Introduction
The ubiquitin-proteasome system (UPS) mediates the
degradation of polyubiquitinated proteins and represents the main
protein degradation pathway in eukaryotic cells (1). It is estimated that over 80% of
intracellular proteins are degraded by the proteasome. By
catalyzing limited or complete degradation of proteins, the UPS
plays a role in many basic cellular processes, such as
differentiation (2) proliferation
(3), apoptosis (3), gene transcription (4), signal transduction (5), metabolic regulation (6), and immune surveillance (7), among others (8). Thus, the UPS is essential for the
development and maintenance of all eukaryotic cells (9), implying that the UPS is also
inevitably involved in pathophysiological processes that result in
the development of many diseases, including autoimmune,
neurodegenerative and rheumatoid diseases, viral infections,
cachexia and cancer.
Based on the unique potential for cellular
regulation via the UPS, several proteasome inhibitors have been
developed. The possibility that proteasome inhibitors could be drug
candidates was considered after studies demonstrated that they
induced apoptosis in leukemia cell lines (10), including chemotherapy-and
radiation-resistant chronic lymphocytic leukemia cells (11). This possibility was bolstered by
findings that proteasome inhibitors preferentially induced
apoptosis in transformed cells (11). Later, studies documented the
efficacy of proteasome inhibition against preclinical models both
as a single approach and in chemosensitization and overcoming
resistance (12).
Proteasome inhibitors are targeted since they are
extremely potent and selective. Due to their effect on the
proteolysis of a wide array of cellular proteins, however, they
share characteristics with general cytotoxic agents, such as
vinflunine, straplatin, aurora kinase inhibitors and epothilones
(13). In light of this,
proteasome inhibitors have several important mechanisms of action,
beyond their effects on NFκB, that have been preclinically
validated in cell line models (14). By interfering with the timely
degradation of cyclins and other cell cycle regulatory proteins,
proteasome inhibitors induce cell cycle arrest. Through their
ability to stabilize pro-apoptotic proteins such as p53 and Bax
while reducing levels of certain anti-apoptotic proteins such as
BcL2, they also induce a pro-apoptotic state. Other mechanisms
include the induction of aggresome formation, endoplasmic reticulum
stress and unfolded protein response (15).
Although proteasome inhibitors display marked
anticancer effects in hematopoietic cells, they exhibit much less
anti-cancer activity against solid tumor malignant cells, mediate
toxicities such as peripheral neuropathy, and induce primary and
secondary resistances. These observations prompted us to
investigate whether sodium butyrate (NaB), a natural product of
apoptosis that exhibits a low degree of clinical toxicity, can
enhance the anticancer effect of the proteasome inhibitors MG115,
MG132, PSI-1, PSI-2 and epoxomicin in human colorectal
carcinoma.
Butyrate is a short 4-carbon fatty acid, one of
three found in the mammalian colonic lumen (16). It is produced by anaerobic bacteria
that ferment undigested dietary carbohydrates (mainly fiber) and
protein (17). Butyrate has been
considered to be a biological response modifier; that is, a reagent
that has generally reversible effects on gene activation and growth
control (18). Butyrate inhibits
DNA synthesis, arrests actively proliferating cells of many tissue
types (19), and induces
differentiation in certain cell types. These observations have led
investigators to propose that butyrate, a byproduct of microbial
fermentation of fiber in the colonic milieu, may have an
antiproliferative, and potentially an antineoplastic, effect on
mucosal epithelial cells (20).
Due to its growth inhibitory effects and low toxicity, butyrate was
tested in this study in order to potentiate the anticancer effects
of a group of proteasome inhibitors (MG115, MG132, PSI-1, PSI-2 and
epoxomicin) towards solid tumor colorectal cancer cells. The
effects of single and combined treatment with proteasome inhibitors
and NaB on cell cycle progression, stabilization of p53 protein,
induction of p53-inducible gene products, and the triggering of the
apoptotic pathway were also investigated.
Materials and methods
Cell culture and reagents
Human colorectal cancer cell lines (SW48, SW1116,
and SW837) were obtained from the American Type Culture Collection
(ATCC, Rockville, MD, USA). The cells were cultured in Leibovitz’s
L-15 medium supplemented with 10% inactivated fetal bovine serum
and 2 mM glutamine. The L-15 medium formulation was devised for use
in a free gas exchange with atmospheric air. CO2 is
detrimental to cells when using this medium for cultivation. Goat
polyclonal anti-human Bax, CPP32 and lamin B, rabbit polyclonal
anti-human PARP and mouse monoclonal anti-human BcL2,
cytochrome-c, Bax, p53, p21Waf1,
p27Kip1 and β-actin were purchased from Santa Cruz
Biotechnology Inc. (Santa Cruz, CA, USA). MG115, MG132, PSI-1,
PSI-2 and epoxomicin were purchased from Biomol Research
Laboratories, Inc. (Plymouth, Meeting, PA, USA). Sodium butyrate
and Ac-DEVD were obtained from the Sigma Chemical Co. (St. Louis,
MO), and z-VAD-fmk was obtained from Bachem AG (Bubendorf,
Switzerland). Stock solutions of z-VAD-fmk (100 mM) and Ac-DEVD
(200 mM) were prepared in methanol and DMSO, respectively.
Time- and dose-dependent
antiproliferative effects of proteasome inhibitors and NaB on human
colorectal cancer cells
Human colorectal cancer cell lines (SW48, SW1116 and
SW837) were plated (27×103 cells/well) into 96-well
plates and treated with NaB (0.195–12.5 mM), MG115 (0.06–4.0 μM),
MG132 (0.06–4.0 μM), PSI-1 (0.03–4.0 μM), PSI-2 (0.03–4.0 μM) and
epoxomicin (7.8–62.5 nM) beginning 24 h after seeding the cells in
culture. The final DMSO concentration in proteasome-treated cells
was 0.1%; all control cultures were treated with the same 0.1% DMSO
to control for any effect that DMSO may exert on the cells. Cell
proliferation was determined at various time periods using an MTT
assay.
Augmentation of the anticancer effects
of proteasome inhibitors by their combination with NaB
The potential of butyrate to sensitize human
colorectal cancer cells to proteasome inhibitors was determined as
previously described (21).
Colorectal cancer cell lines (SW48, SW1116 and SW837) were plated
(27×103 cells/well) into 96-well plates and incubated at
37°C in a non-CO2 incubator. The cells were then treated
with NaB, proteasome inhibitors (MG115, MG132, PSI-1, PSI-2 and
epoxomicin), or combinations of NaB and each of the tested
proteasome inhibitors. The experiment began 18 h after seeding the
cells in culture; control cells were left untreated. Cell
proliferation was determined at various time periods (1, 3, and 5
days) by an MTT assay. The concentrations of NaB and the proteasome
inhibitors used for single treatment experiment were NaB (1.5–12.5
mM), MG115 (0.25–2.0 μM), MG132 (0.25–2.0 μM), PSI-1 (0.013–0.1
μM), PSI-2 (0.375–3.0 μM) and epoxomicin (3.0–12.0 nM). Meanwhile,
the concentrations of the combined treatments were NaB and MG115
(1.56 mM/0.25 μM, 3.125 mM/0.5 μM, 6.25 mM/1.0 μM, 12.5 mM/2.0 μM),
NaB and MG132 (1.56 mM/0.25 μM, 3.125 mM/0.5 μM, 6.25 mM/1.0 μM and
12.5 mM/2.0 μM), NaB and PSI-1 (1.56 mM/0.013 μM, 3.125 mM/0.025
μM, 6.25 mM/0.05 μM, 12.5 mM/0.1 μM), NaB and PSI-2 (1.56 mM/0.375
μM, 3.125 mM/0.75 μM, 6.25 mM/1.5 μM, 12.5 mM/3.0 μM), and NaB and
epoxomicin (1.56 mM/3.0 nM, 3.125 mM/6 nM, 6.25 mM/9.0 nM and 12.5
mM/12.0 nM).
Assessment of the type of interaction
between NaB and proteasome inhibitors in human colorectal cancer
cells
Human colorectal cancer cell lines (SW48, SW1116 and
SW837) were treated with NaB (1.56, 3.125, 6.25, 12.5 mM), MG115
(0.25, 0.5, 1.0, 2.0 μM), MG132 (0.25, 0.5, 1.0, 2.0 μM), PSI-1
(0.013, 0.025, 0.05, 0.1 μM), PSI-2 (0.375, 0.75, 1.5, 3.0 μM),
epoxomicin (3.0, 6.0, 9.0, 12.0 nM), and the same combinations of
NaB and proteasome inhibitors that were previously mentioned. The
interactions of the tested combinations on human colorectal cancer
cell growth were determined as previously described (22,23),
using the following formulas: SFA+B >
(SFA) x (SFB), antagonistic; SFA+B
= (SFA) x (SFB), additive; SFA+B
< (SFA) x (SFB), synergistic; where SF is
the surviving fraction; A and B indicate the agent when used alone,
and A+B refers to the agents when used in combination.
Cell cycle analysis
The cell cycle phase (G0–G1, S
and G2-M) distribution of the human colorectal cancer
cells (SW48, SW1116 and SW837) was evaluated by measuring the DNA
content of nuclei that were labeled with propidium iodide via flow
cytometry (23). The human
colorectal cancer cells were plated (5×10⁵/well) into
24-well plates and incubated at 37°C in a non-CO2
incubator. After 18 h, the cells were treated with either NaB (3
mM), MG115 (1.0 μM), MG132 (1.0 μM), PSI-1 (0.1 μM), PSI-2 (1.5
μM), epoxomicin (12.0 nM), or with combinations of NaB and the
proteasome inhibitors [NaB/MG115 (3.0 mM/1.0 μM), NaB/MG132 (3.0
mM/1.0 μM), NaB/PSI-1 (3.0 mM/0.1 μM), PSI-2 (3.0 mM/1.5 μM) and
NaB/epoxomicin (3.0 mM/12.0 nM)] for 72 h. The tested cells were
collected via trypsinization then washed with cold
phosphate-buffered saline and counted with a cell counter. A sample
of 5×10⁵cells/ml was processed using a DNA-Prep kit
(Beckman and Coulter, FL, USA) and a DNA-Prep Epics workstation
(Beckman and Coulter). During this process, the cell sample was
treated with a cell membrane-premeabilizing agent, followed by the
propidium iodide and RNase enzyme. The sample was then incubated at
room temperature for at least 15 min before being analyzed by
aligned flow cytometry (Epics XL, Beckman and Coulter). The
percentage of cells in various cell cycle phases was calculated
using the Phoenix statistical software package and advanced DNA
cell cycle software (Phoenix Flow Systems, San Diego, CA, USA).
Acridine orange (AO) staining
Morphological evidence of apoptosis was obtained
through the use of AO/ethidium bromide (EB) staining. After removal
of the incubation medium, cells were rinsed and treated with an
AO/EB solution (100 μg/ml PBS of each dye), then examined by
fluorescence microscopy and photographed. Viable cells appeared
green with intact nuclei, while nonviable cells exhibited bright
orange chromatin. Apoptosis was marked by the appearance of cell
shrinkage with condensation and the fragmentation of nuclei; in
addition, apoptotic cells were easily distinguished from necrotic
cells since the latter appeared orange and had a normal nuclear
structure.
DNA fragmentation analysis
A DNA fragmentation assay was also performed
(24). Human colorectal cancer
cells were plated (5×10⁵/well) into 24-well plates and
incubated at 37°C in a non-CO2 incubator. After 18 h,
the cells were treated for 72 h with NaB (3.0 mM), MG115 (1.0 μM),
MG132 (1.0 μM), PSI-1 (0.1 μM), PSI-2 (1.5 μM), epoxomicin (12.0
nM), or the combinations of NaB and proteasome inhibitors that were
previously mentioned. The cell pellets of SW48, SW1116 and SW837
cells were then lysed with 100 μM of hypotonic buffer [10 mM Tris,
(pH 8.0), 20 mM EDTA containing 0.5% Triton X-100] for 30 min at
4°C. After lysis, the intact chromatin (pellet) was separated from
the DNA fragment (supernatant) by centrifugation for 15 min at
12,000 x g. The supernatants containing fragmented DNA were
precipitated overnight with 0.5 M NaCl and 50% isopropyl alcohol at
−20°C. Pellets were recovered by centrifugation at 12,000 x g for
10 min, air dried, then re-suspended in 30 μl of TE-buffer
supplemented with 1 mg/ml RNase I at 37°C for 30 min and again with
2 mg/ml of proteinase K for another 1 h. A DNA sample was
supplemented with 3 μl of sample buffer (0.25% Bromophenol blue,
30% glyceric acid) and electrophoretically separated on a 1.0%
agrose gel containing 0.1 μg/ml ethidium bromide. DNA fragments
were then visualized using ultraviolet transillumination.
Western blot analysis of cell cycle
and apoptosis regulatory protein expression levels in human
colorectal cancer cells treated with proteasome inhibitors, NaB,
and their combinations
The expression levels of cell cycle and apoptosis
regulatory proteins were determined as follows (24): 1–2×10⁶ human colorectal
cells were treated with NaB (3.0 mM), MG115 (1.0 μM), MG132 (1.0
μM), PSI-1 (0.1 μM), PSI-2 (1.5 μM), epoxomicin (12.0 nM), or a
combination of NaB and each of the proteasome inhibitors. The
samples were washed twice with ice-cold phosphate-buffered saline
then lysed for 30 min with a solution composed of 1% NP40, 0.5%
sodium deoxycholate, and 0.1% SDS in PBS (pH 7.4), then sonicated
three times for 10 sec. The following protease inhibitors were
added: 25 μg/ml aprotinin, 1 mM phenylmethylsulfonyl fluoride, 1 mM
sodium orthovanadate, 10 mM NaF, 25 μg/ml leupeptin and 0.2 mM
sodium PPi. Cell lysates were centrifuged at 15,000 x g for 20 min
at 4°C; equivalent amounts of protein (60 μg) were resolved by 10%
SDS-PAGE and transferred onto nitrocellulose for detection with
antibodies. The primary antibodies used were: goat polyclonal
anti-human Bax (1:500), CPP32 (1:1000), lamin B (1:1000), rabbit
polyclonal anti-human PARP (1:2000), mouse monoclonal anti-human
BcL2 (1:1000), p53 (1:1000); p21Waf1 (1:500),
p27Kip1 (1:500) and β-actin (1:1000). Visualization was
performed using nitroblue tetrazolium and
bromochloroindoyl-phosphate. The specificities of the antibodies
used in this study were examined by testing their reactivities with
unrelated antigens, such as bovine serum albumin (BSA). The blots
were scanned, and the band intensities were determined using
Master™Total Lab Software v. 2.0 (Amersham Biosciences, UK).
Expression of p53, p21Waf1, p27Kip1, and Bax
and BcL2 genes was calculated by setting the β-actin protein at
100% and calculating the expression of these genes in relation to
this internal standard.
In vitro assay of caspase-3
activity
The catalytic activity of caspase-3 was measured
using a colorimetric assay according to the manufacturer’s
(Calbiochem) instructions. the assay is based on spectrophotometric
detection of the chromophore p-nitroanilide following
cleavage from the labeled substrate of the enzyme
DEVD-p-nitroanilide. Human colorectal cancer cells were
treated with NaB (3.0 mM), epoxomicin (12 nM), or a combination of
NaB (3.0 mM) and epoxomicin (12 nM) for 24 h, and then harvested by
centrifugation at 1,000 x g for 10 min. The cells were then washed
twice with ice-cold PBS. The cell pellet was re-suspended in 100 μl
of extraction buffer that contained 50 mM HEPES, 1 mM DDT, 0.1 mM
EDTA, 10% glycerol and 0.1% CHAPS at a pH of 7.4. After 10 min of
incubation on ice, the cells were centrifuged at 10,000 x g at 4°C
for 10 min, and the supernatants were removed and stored at −70°C.
Proteolytic reactions were carried out in an assay buffer [50 mM
HEPES (pH 7.4), 100 mM NaCl, 0.1 CHAPS, 10 mM dithiothreitol, 0.1
mM EDTA and 10% glycerol] containing 20 μg of cytosolic protein
extracts, and incubated at 37°C for 10 min. Thereafter, a freshly
prepared colorimetric substrate was added to the mixtures, and the
samples were mixed and recorded according to the manufacturer’s
instructions. Cells without drug treatment were used as controls.
Enzyme activity was calculated as pmol/min, according to the
formula provided by the manufacturer.
Inhibition of caspase-3 activity
Inhibition of caspases with DEVD cleavage activity
was achieved using the inhibitors Ac-DEVD (500 μM) and z-VAD-fmk
(100 μM) that were administered 1 h before the addition of either 3
mM NaB or 12 nM epoxomicin. Twenty-four hours after the addition of
NaB or epoxomicin, the cells were harvested and analyzed for
caspase-3 activity.
In vitro assay of cytochrome-c efflux
from the mitochondria
Subcellular fractions were prepared as described by
Yang et al (25). The human
colorectal cells (1–2×10⁶) were treated with NaB (3.0
mM), epoxomicin (12.0 nM), or a combination of NaB (3.0 mM) and
epoxomicin (12.0 nM). The cells were washed twice in PBS and
re-suspended in a lysis buffer [20 mM HEPES-KOH (pH 7.5), 10 mM
KCl, 1.5 mM MgCl2, 1 mM EGTA, 1 mM EDTA, 1 mM DTT and
0.1 mM phenylmethylsulfonyl fluoride] containing 250 mM sucrose.
The cells were homogenized with 20 strokes of Teflon homogenizers,
and the homogenates were centrifuged at 750 x g for 10 min at 4°C;
the resulting supernatants were centrifuged at 10,000 x g for 30
min. The mitochondrial pellets were re-suspended in the same
buffer. The cytosolic fraction was obtained after centrifugation at
100,000 x g for 1 h at 4°C. For the immunoblotting analysis, equal
amounts of protein (50 μg) were subjected to a 10% SDS-PAGE. After
being transferred to a nitrocellulose filter, the filter was probed
using the mouse monoclonal anti-human cytochrome-c antibody
(1:1000).
Statistical analysis
The data were recorded as the mean ± SE and were
analyzed by SPSS (version 10, SPSS Inc.). One-way analysis of
variance was performed using the ANOVA procedure. Significant
differences between the means of percentage growth inhibition were
determined by least significant difference (LSD), and differences
were considered statistically significant at P<0.05.
Results
Time- and dose-dependent
antiproliferative effect of proteasome inhibitors and NaB on human
colorectal cancer cells
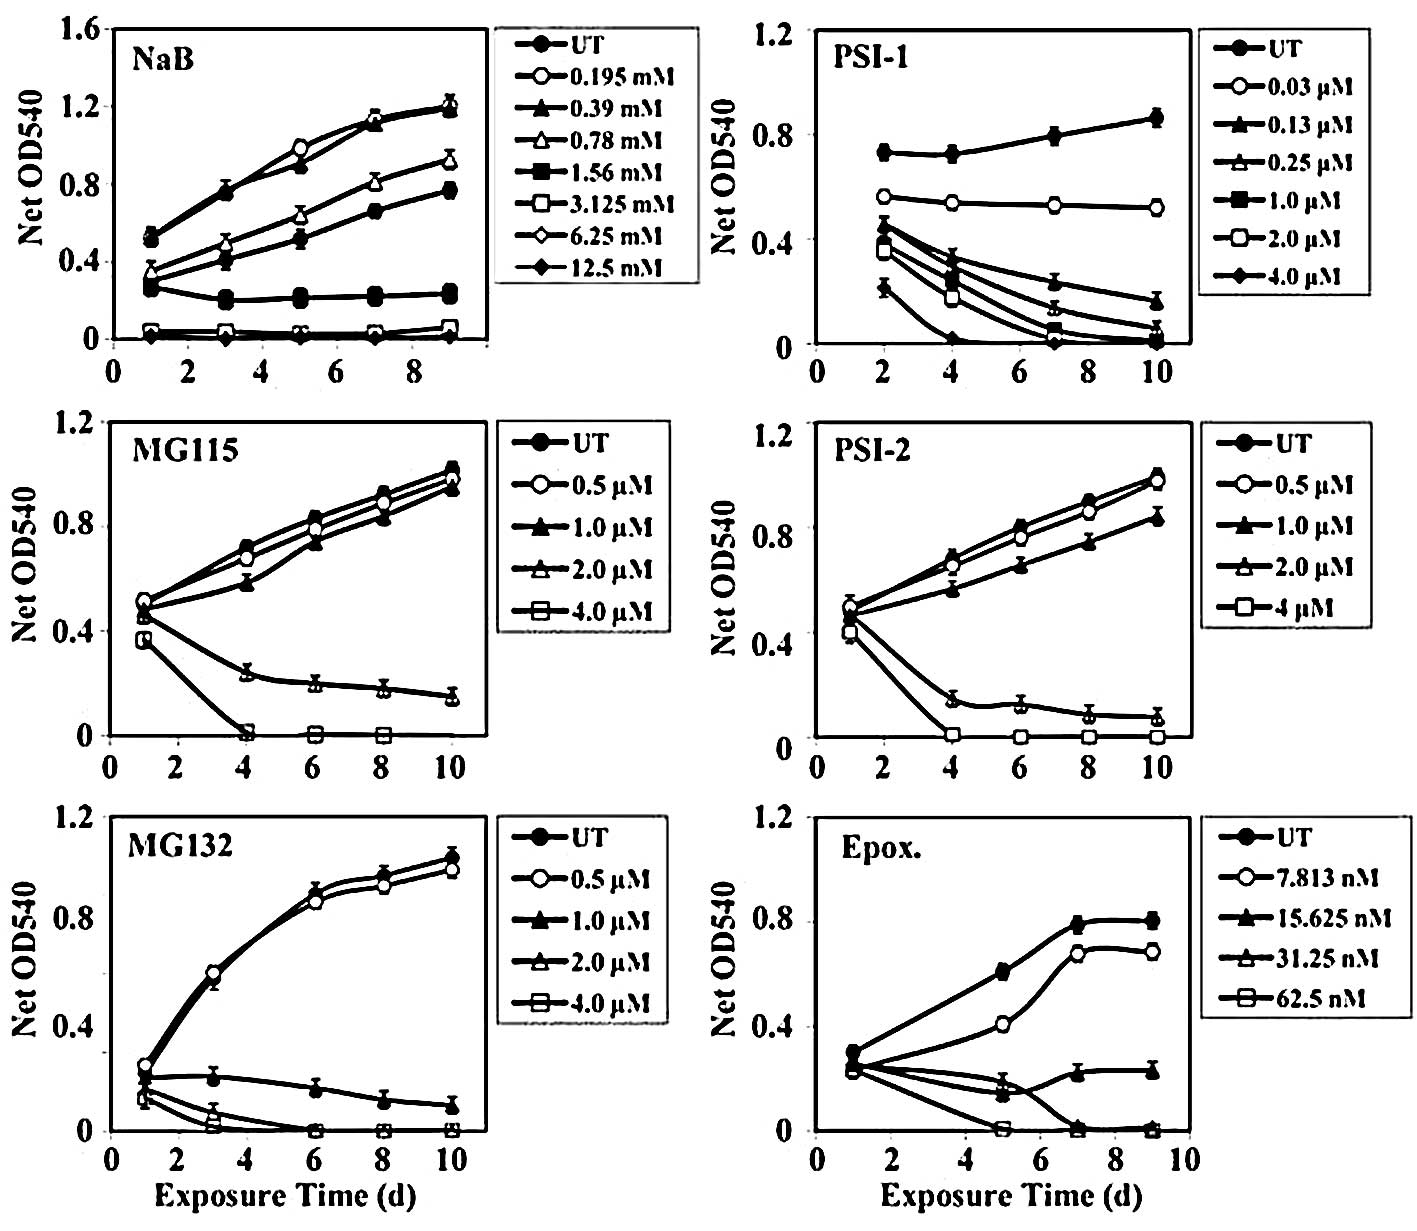
Human colorectal cancer SW837 cells treated with
various concentrations of NaB or the proteasome inhibitors, MG115,
MG132, PSI-1, PSI-2 and epoxomicin, showed marked time-and
dose-dependent growth inhibition (Fig.
1). Treatment of SW837 cells with low concentrations of NaB
(0.195–0.78 mM) had no effect on their growth. But when SW837 cells
were treated with 1.56 mM NaB, higher growth inhibition (mean
percentage growth inhibition, 51.2±10%) was observed. Marked growth
inhibition (mean, 96±0.95%) was noted when the SW837 cells were
treated with even higher concentrations of NaB (3.125–12.5 mM)
(Fig. 1).
The growth of SW837 cells was slightly affected
(mean, 10±2%) after treatment with proteasome inhibitor MG115
(0.5–1.0 μM). Treatment of SW837 cells with higher concentrations
of MG115 (2.0–4.0 μM) produced 17.5±0.9% growth inhibition after 24
h; however, a much higher growth inhibition (87±5%) was noticed
after 96–240 h of treatment with MG115 (2.0–4.0 μM) (Fig. 1).
The growth of SW837 cells was slightly affected
(mean, 26±9%) after 24 h of treatment with 1.0–4.0 μM of MG132. A
marked growth inhibitory effect (mean, 92±3%) was observed with
longer periods of treatment (72–240 h) with the same range of MG132
concentrations (1.0–4.0 μM) (Fig.
1).
Treatment of SW837 cells with 0.03 μM PSI-1
inhibited their growth by 31±4%. Increasing concentrations of PSI-1
(0.13–0.25 μM) produced a higher growth inhibition (65±7%). An even
higher growth inhibition (mean, 83±6%) was obtained with higher
concentrations of PSI-1 (1.0–4.0 μM) (Fig. 1).
The growth of SW837 cells was slightly affected
(mean, 9±2%) after treatment with PSI-2 at 0.5–1.0 μM. However, the
growth of SW837 cells was dramatically inhibited (mean, 93±3%)
after 96–240 h of treatment with higher concentrations of PSI-2
(2.0–4.0 μM) (Fig. 1).
Treatment of SW837 cells with a low concentration of
epoxomicin (7.8 nM) slightly affected (mean, 21±4%) their growth
throughout 24–240 h of treatment. A similar degree of inhibition
(mean, 22.8±3%) was obtained when SW837 cells were treated with
higher concentrations (15.6–250 nM) for 24 h. However, a marked
growth inhibition (mean, 92±3%) was obtained when SW837 cells were
exposed to 15.6–250 nM of epoxomicin for 120–216 h (Fig. 1).
Augmentation of the antimitogenic effect
of proteasome inhibitors by combination with NaB in human
colorectal cancer cells
Augmentation of the anticancer effect
of proteasome inhibitor MG115 by combination with NaB in colorectal
cancer cells
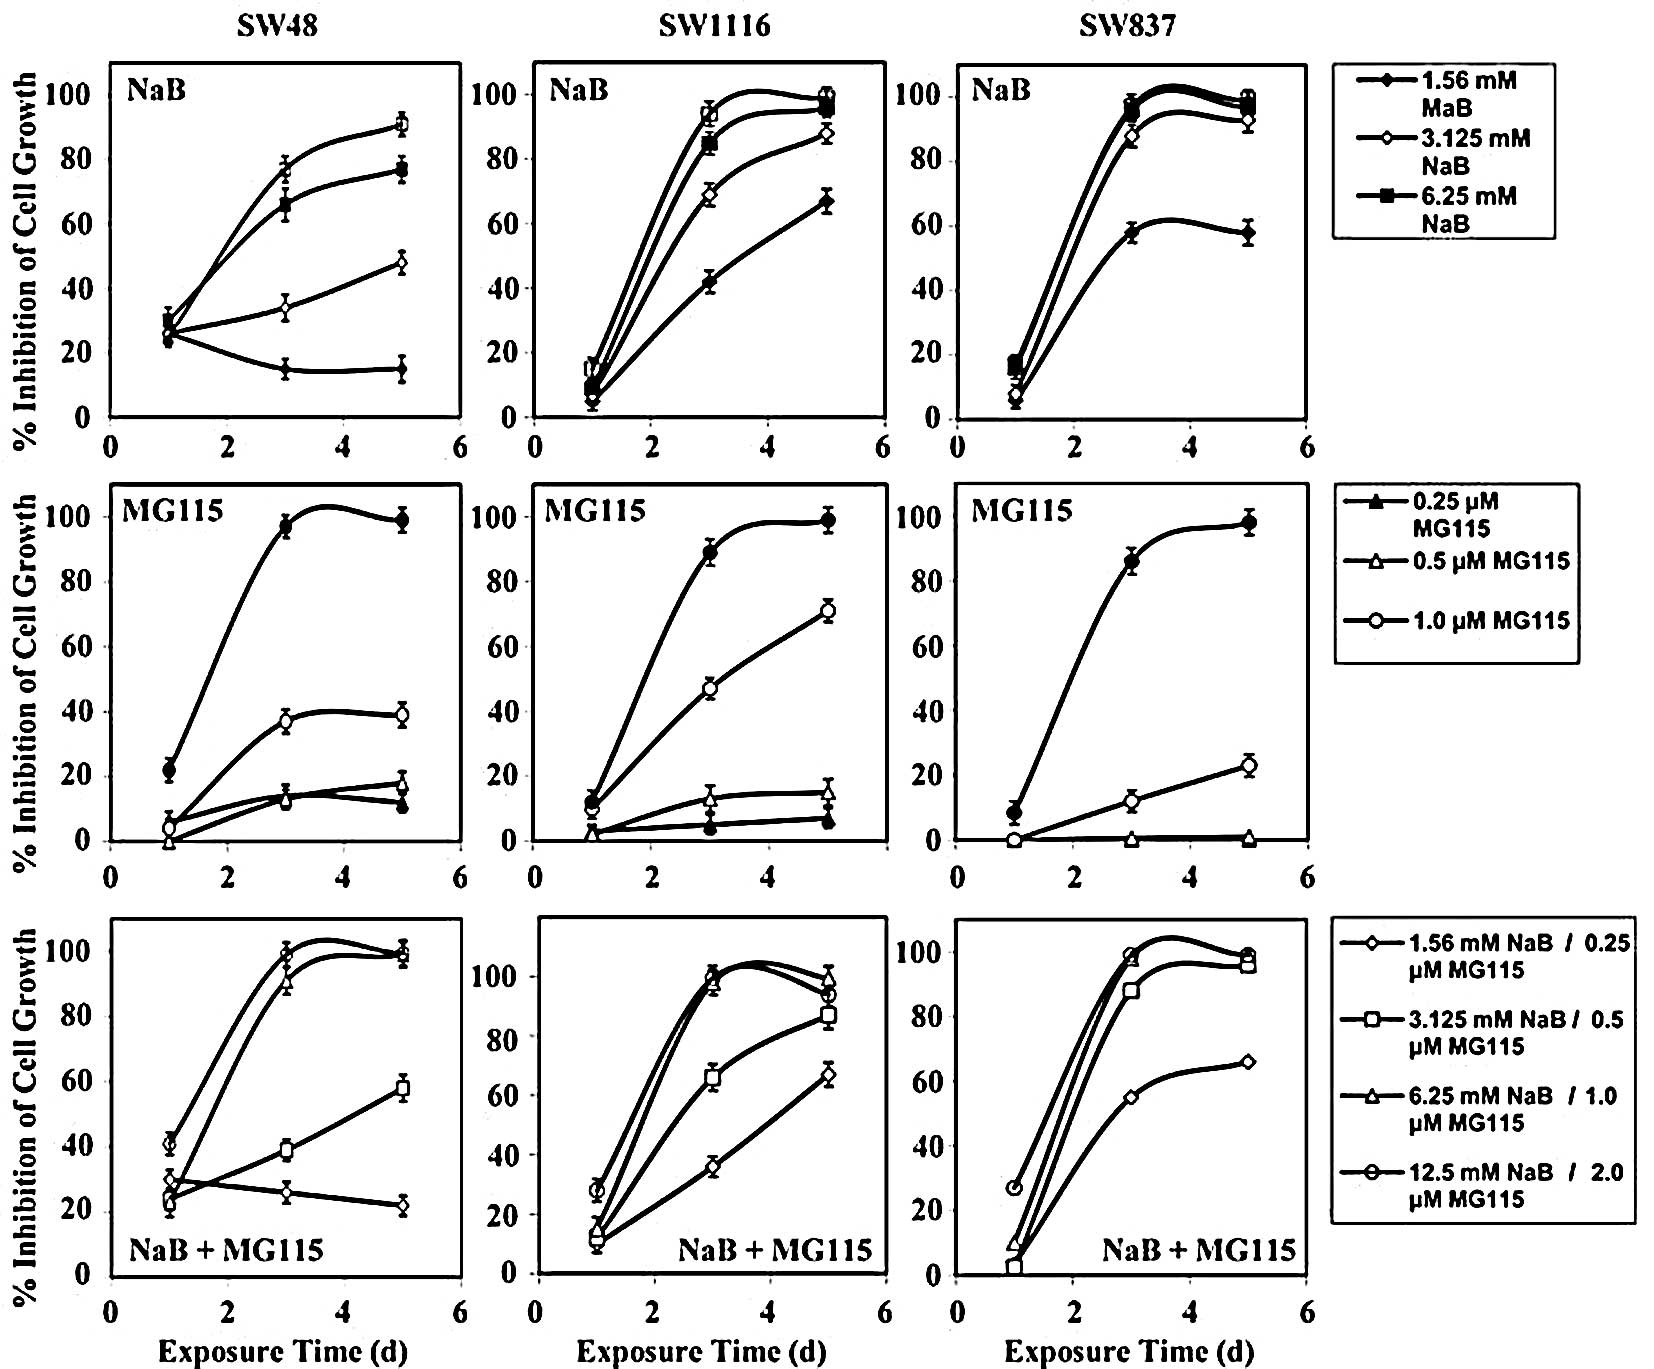
Treatment of human colorectal cancer SW48 cells with
NaB, MG115, and their combination inhibited their growth by 26.8±2,
8.0±0.97 and 29.75±0.8%, respectively, after 24 h of treatment
(Fig. 2). The differences in
growth inhibition between the combined treatment and single
treatment with NaB (P=0.899) and MG115 (P=0.314) were statistically
non-significant.
Treatment of SW48 with NaB, MG115, and their
combination inhibited their growth by 47.5±3, 38±4 and 63±3.8%,
respectively, after 72 h of treatment. Although the combined
treatment netted a higher growth inhibition than single treatment
with NaB (P=0.418) or MG115 (P=0.303), the differences in growth
inhibition were non-significant. The combined treatment of SW48
with NaB and MG115 netted a higher growth inhibition (mean
percentage growth inhibition, 70±3.1%) than single treatment with
NaB (mean percentage growth inhibition, 58±5%) and MG115 (mean
percentage growth inhibition, 42±3%) after 120 h of treatment. The
differences in growth inhibition of SW48 between combined treatment
and single treatment with NaB (P=0.584) and MG115 (P=0.206) were
statistically non-significant.
Treatment of SW1116 cells with NaB, MG115, and their
combination had very little effect on their growth after 24 h of
treatment (Fig. 2). However,
higher growth inhibition was observed when SW1116 cells were
treated for a longer period (72 h) with NaB (mean, 72.5±2.3%),
MG115 (mean, 39±4%), and the combination of NaB and MG115 (mean,
75±3%). The combined treatment produced a significant growth
inhibition effect (P=0.05) on SW1116, as compared to single
treatment with MG115. However, the difference in growth inhibition
of SW1116 exerted by combined treatment, as compared to that
produced by NaB, was statistically non-significant (P=0.9).
Treatment of SW1116 with the combination of NaB and MG115 for an
even longer period (120 h) produced marked growth inhibition (mean,
87±14%), as compared to that produced by treatment with MG115
(mean, 43±5%). The difference between the growth inhibition
produced by combined treatment and MG115 was statistically very
significant (P=0.024). Treatment of SW1116 with NaB for 120 h gave
comparable growth inhibition (mean, 87.7±14%) to that produced by
combined treatment for 120 h (Fig.
2).
Treatment of SW837 cells with NaB, MG115, and their
combination for 24 h produced very small growth inhibitory effects
(mean, 6±0.4%) (Fig. 2). However,
after 72 h of treatment, NaB markedly inhibited the growth of SW837
cells (mean, 84±2%). On the other hand, MG115 produced a moderate
growth inhibition (mean, 31±4%). The growth inhibition of SW837
cells (mean, 85±2%) produced by the combination of NaB and MG115
was comparable to that produced by NaB. Inhibition of SW837 cells
by the combination of NaB and MG115 was statistically very
significant (P=0.004), as compared to the inhibition produced by
single treatment with MG115 for 72 h. Treatment of SW837 cells with
NaB for 120 h produced growth inhibition (mean, 90±2%) comparable
to that produced by single treatment with NaB (mean, 87±2%). In
contrast, MG115 produced moderate growth inhibition (mean, 31±5%)
after 120 h of treatment. Inhibition of SW837 cell growth produced
by the combination of NaB and MG115 was statistically very
significant (P=0.002), as compared to that produced by MG115 after
120 h of treatment.
Augmentation of the antimitogenic
effect of proteasome inhibitor MG132 by combination with NaB in
colorectal cancer cells
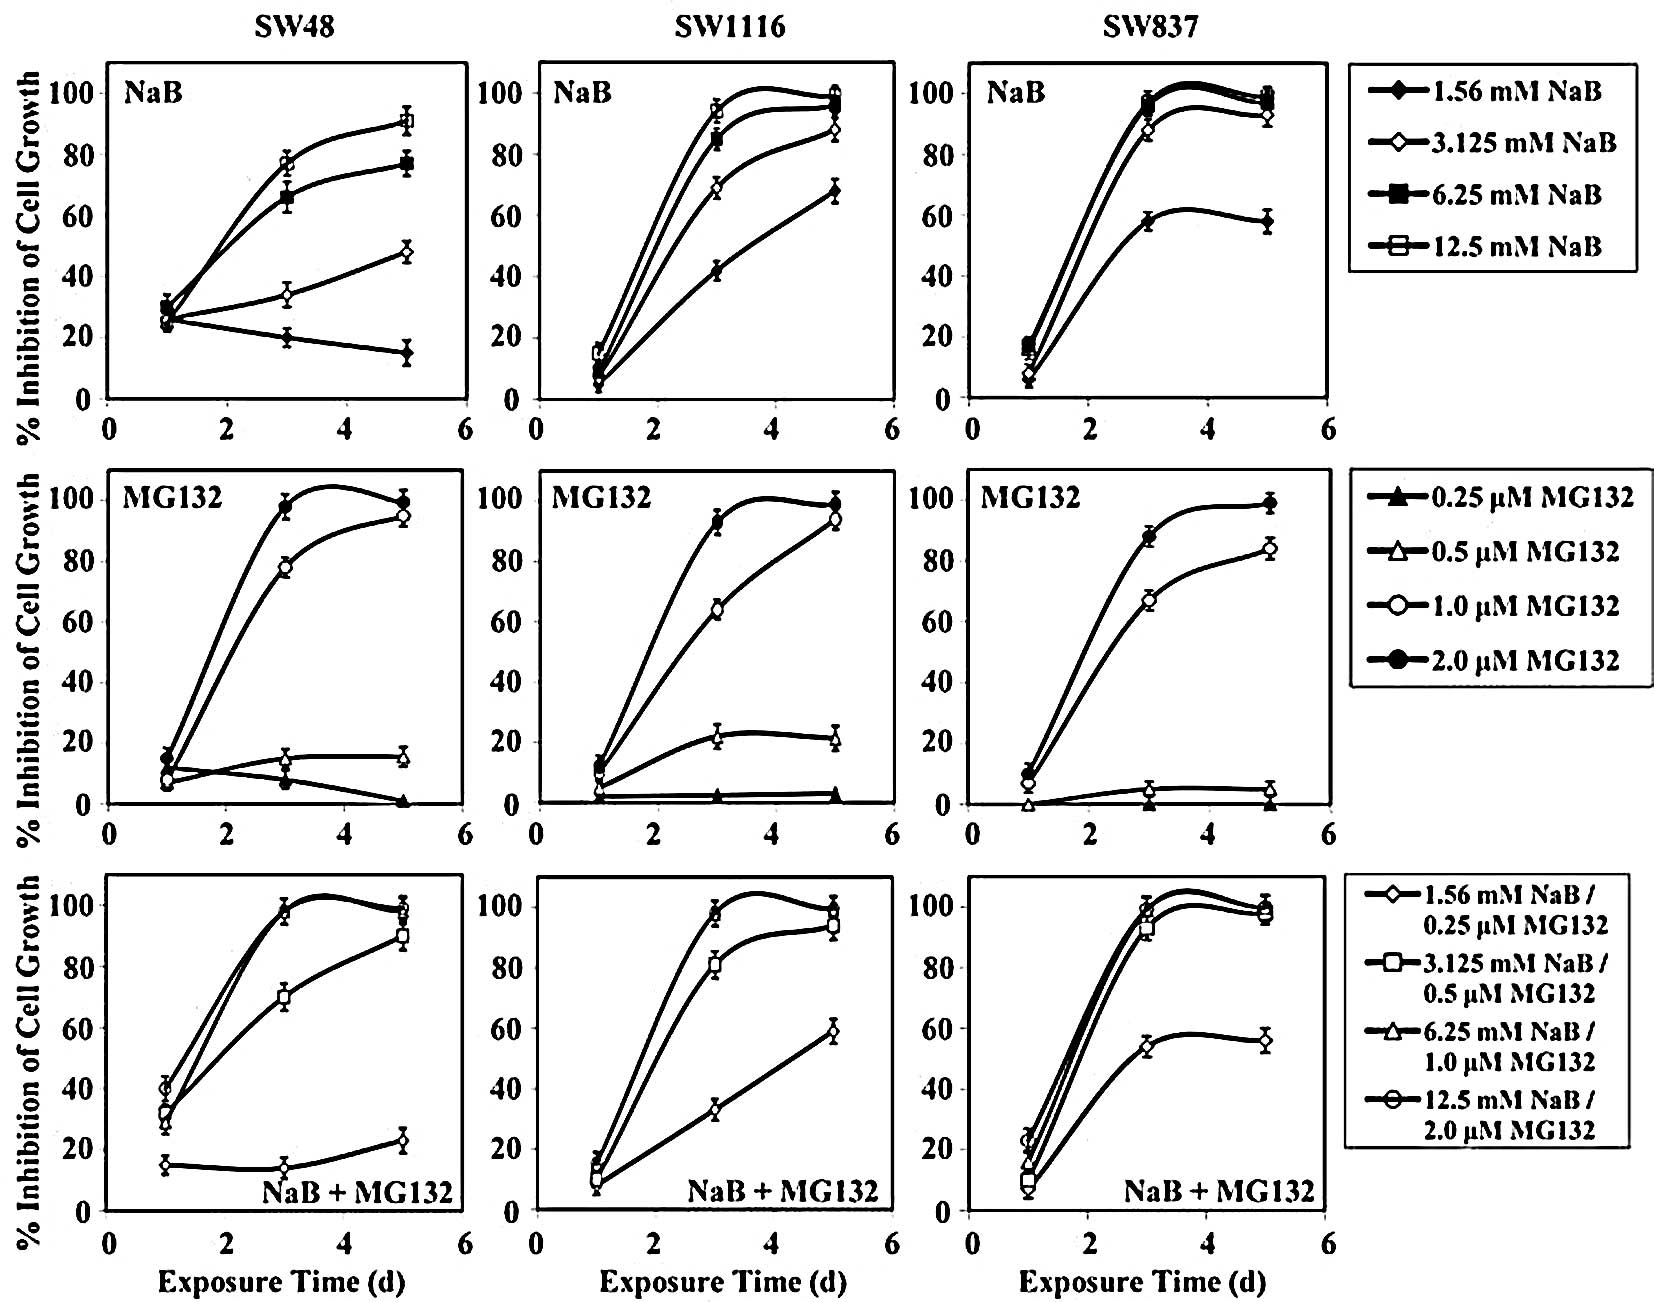
Treatment of human colorectal cancer SW48 cells for
24 h with NaB, MG132, and their combination inhibited cell growth
by 27±2, 11±3 and 29±56%, respectively (Fig. 3). The differences in the growth
inhibition produced by the combination of NaB and MG132 compared to
that produced by NaB (P=0.923) or MG132 (P=0.428) were
statistically non-significant. After 72 h of treatment with NaB,
MG132, or their combination, the growth of SW48 cells was inhibited
by 48±3, 50±5 and 70±4%, respectively (Fig. 3). Although the combination of NaB
and MG132 produced a higher growth inhibition than single treatment
with NaB (P=0.34) and MG132 (P=0.39), the differences were
non-significant. Additionally, combined treatment produced a higher
growth inhibition (mean, 78±4%), as compared to single treatment of
NaB (mean, 58±3%) and MG132 (mean, 55±5%) after 120 h of treatment.
However, the differences in growth inhibition between combined
treatment and NaB (P=0.4) and MG132 (P=0.33) were statistically
non-significant after 120 h of treatment.
Treatment of SW1116 cells with NaB, MG132, and their
combination had very little effect on the growth of SW1116 cells
after 24 h of treatment (Fig. 3).
However, after 72 h of treatment, the combination of NaB and MG132
produced a higher growth inhibition (mean, 78±3%) than single
treatment with MG132 (mean, 46±4%). This difference in growth
inhibition was statistically non-significant (P=0.1). NaB had
similar growth inhibition (mean, 73±2%) to that produced by
combined treatment (Fig. 3). After
120 h of treatment, the combination of NaB and MG132 produced a
higher growth inhibition (mean, 88±2%) than single treatment with
MG132 (mean, 54±5%). The difference in SW1116 growth inhibition was
statistically significant (P=0.05). NaB produced comparable growth
inhibition (mean, 88±4%) to that produced by combined treatment
(Fig. 3).
The growth of human colorectal cancer cells SW837
was slightly affected when treated with NaB, MG132, or their
combination for 24 h (Fig. 3).
However, the growth of SW837 cells was markedly affected by the
combination of NaB and MG132 (mean, 86±2%) after 72 h of treatment.
NaB produced growth inhibition (mean, 84±2%) similar to that of the
combined treatment. However, much less growth inhibition was
observed when SW837 cells were treated for 72 h with MG132 (mean,
40±4%). The difference in the growth inhibition of SW837 after
treatment with the combination of NaB and MG132 and single
treatment with MG132 was statistically significant (P=0.022).
Treatment of SW837 cells with the combination of NaB and MG132 for
120 h produced a marked growth inhibition (mean, 89±2%). NaB
produced growth inhibition of SW837 (mean, 87±2%) similar to that
produced by the combination of NaB and MG132 after 120 h of
treatment. Much less growth inhibition was obtained after treatment
with MG132 (mean, 47±5%) for 120 h. The difference in the growth
inhibition of SW837 cells produced by the combination of NaB and
MG132 was statistically significant (P=0.037), when compared to
single treatment with MG132.
Augmentation of the antimitogenic
effect of proteasome inhibitor PSI-1 by combination with NaB
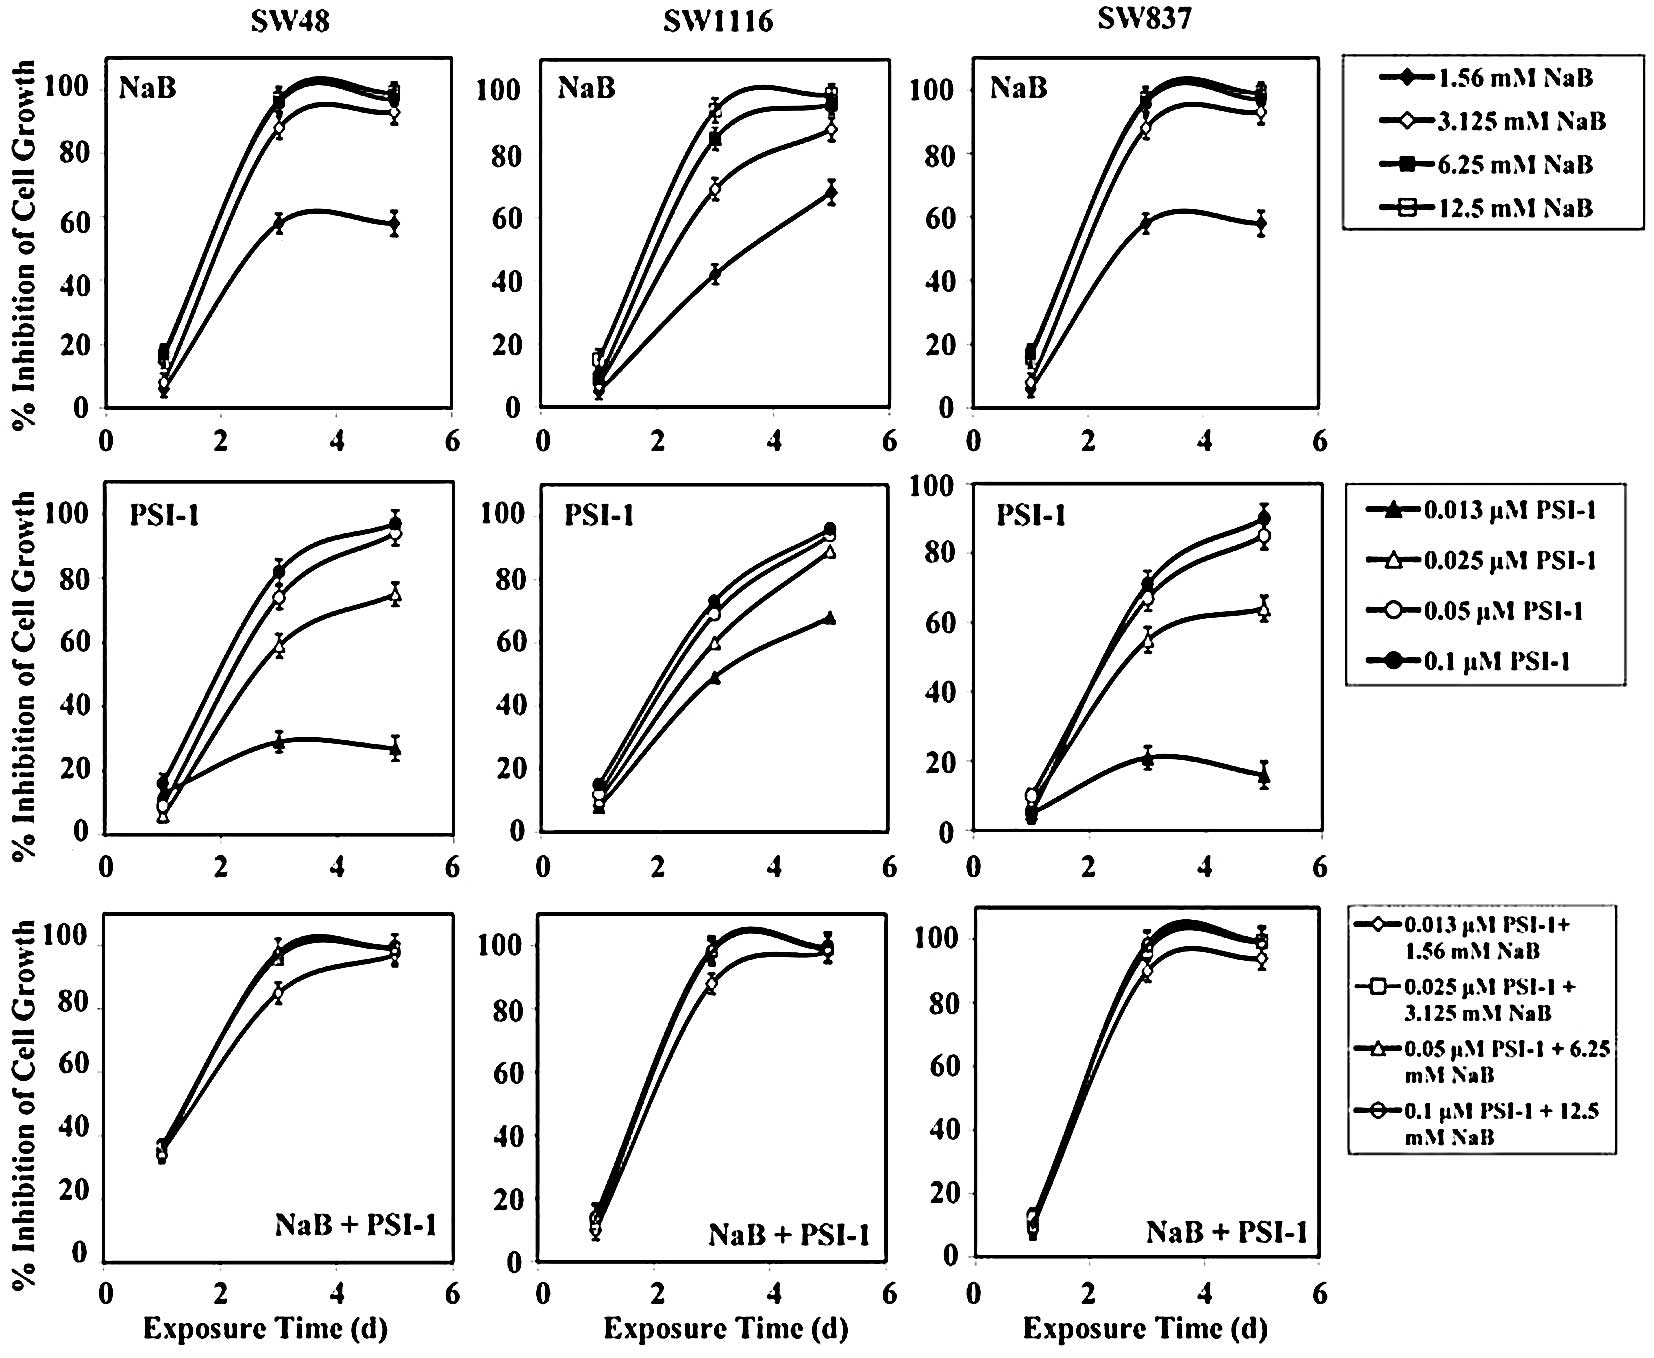
Treatment of SW48 cells with the combination of NaB
and PSI-1 for 24 h produced a growth inhibition of 36±0.8%, while
single treatment with NaB and PSI-1 produced a growth inhibition of
27±2 and 11±4%, respectively. After 72 h of treatment, the
combination of NaB and PSI-1 produced a greater inhibition of SW48
growth (mean, 94±6%) than single treatment with NaB (mean, 48±3%,
P=0.003) and PSI-1 (mean, 61±2%; P=0.03). Treatment of SW48 with
the combination of NaB and PSI-1 for 120 h produced a marked growth
inhibition (mean, 99±1%), as compared to single treatment with NaB
(mean, 58±3%; P=0.008) and PSI-1 (mean, 73±3%; P=0.085) (Fig. 4).
Treatment of human colorectal cancer cells SW1116
with NaB, PSI-1, and their combination for 24 h had no effect on
their proliferation. However, after 72 h of treatment, SW1116 cell
growth was markedly inhibited (mean, 96±7%), as compared to single
treatment with NaB (mean, 73±2%) and PSI-1 (mean, 63±1%). The
differences in the growth inhibition produced by the combination of
NaB and PSI-1 after 72 h of treatment and NaB (P=0.005) or PSI-1
(P=0.001) were statistically very significant. After 120 h, the
combined treatment produced a slightly higher growth inhibition
(mean, 99±1.0%) than NaB (mean, 88±4%) or PSI-1 (mean, 87±3%)
(Fig. 4).
The growth of human colorectal cancer SW837 cells
was slightly affected after 24 h of treatment with NaB (mean,
12±1.0%), PSI-1 (mean, 1.3±0.4%), and their combination (mean,
3.0±0.4%) (Fig. 4). The
combination of NaB and PSI-1 produced a marked growth inhibition of
SW837 (mean, 96.0±4.0%), as compared to that produced by PSI-1
(mean, 54.0±2.0%) after 72 h of treatment. The difference in SW837
growth inhibition produced by combined treatment and single
treatment with PSI-1 was statistically very significant (P=0.001).
The combined treatment produced a higher growth inhibition of SW837
than NaB (mean, 84.0±2.0) after 72 h of treatment. However, the
difference in SW837 growth inhibition between these treatments was
statistically non-significant (P=0.322). Similar results were
obtained when SW837 cells were treated for 120 h. The combined
treatment produced greater significant growth inhibition (mean,
98.0±3.0%), as compared to that produced by PSI-1 (mean, 64.0±3.0%,
P=0.006). Additionally, the combined treatment produced higher
SW837 growth inhibition, as compared to that produced by single
treatment with NaB (mean, 87.0±2.0%). However, the difference in
SW837 growth inhibition between these treatments was statistically
non-significant (P=0.322) (Fig.
4).
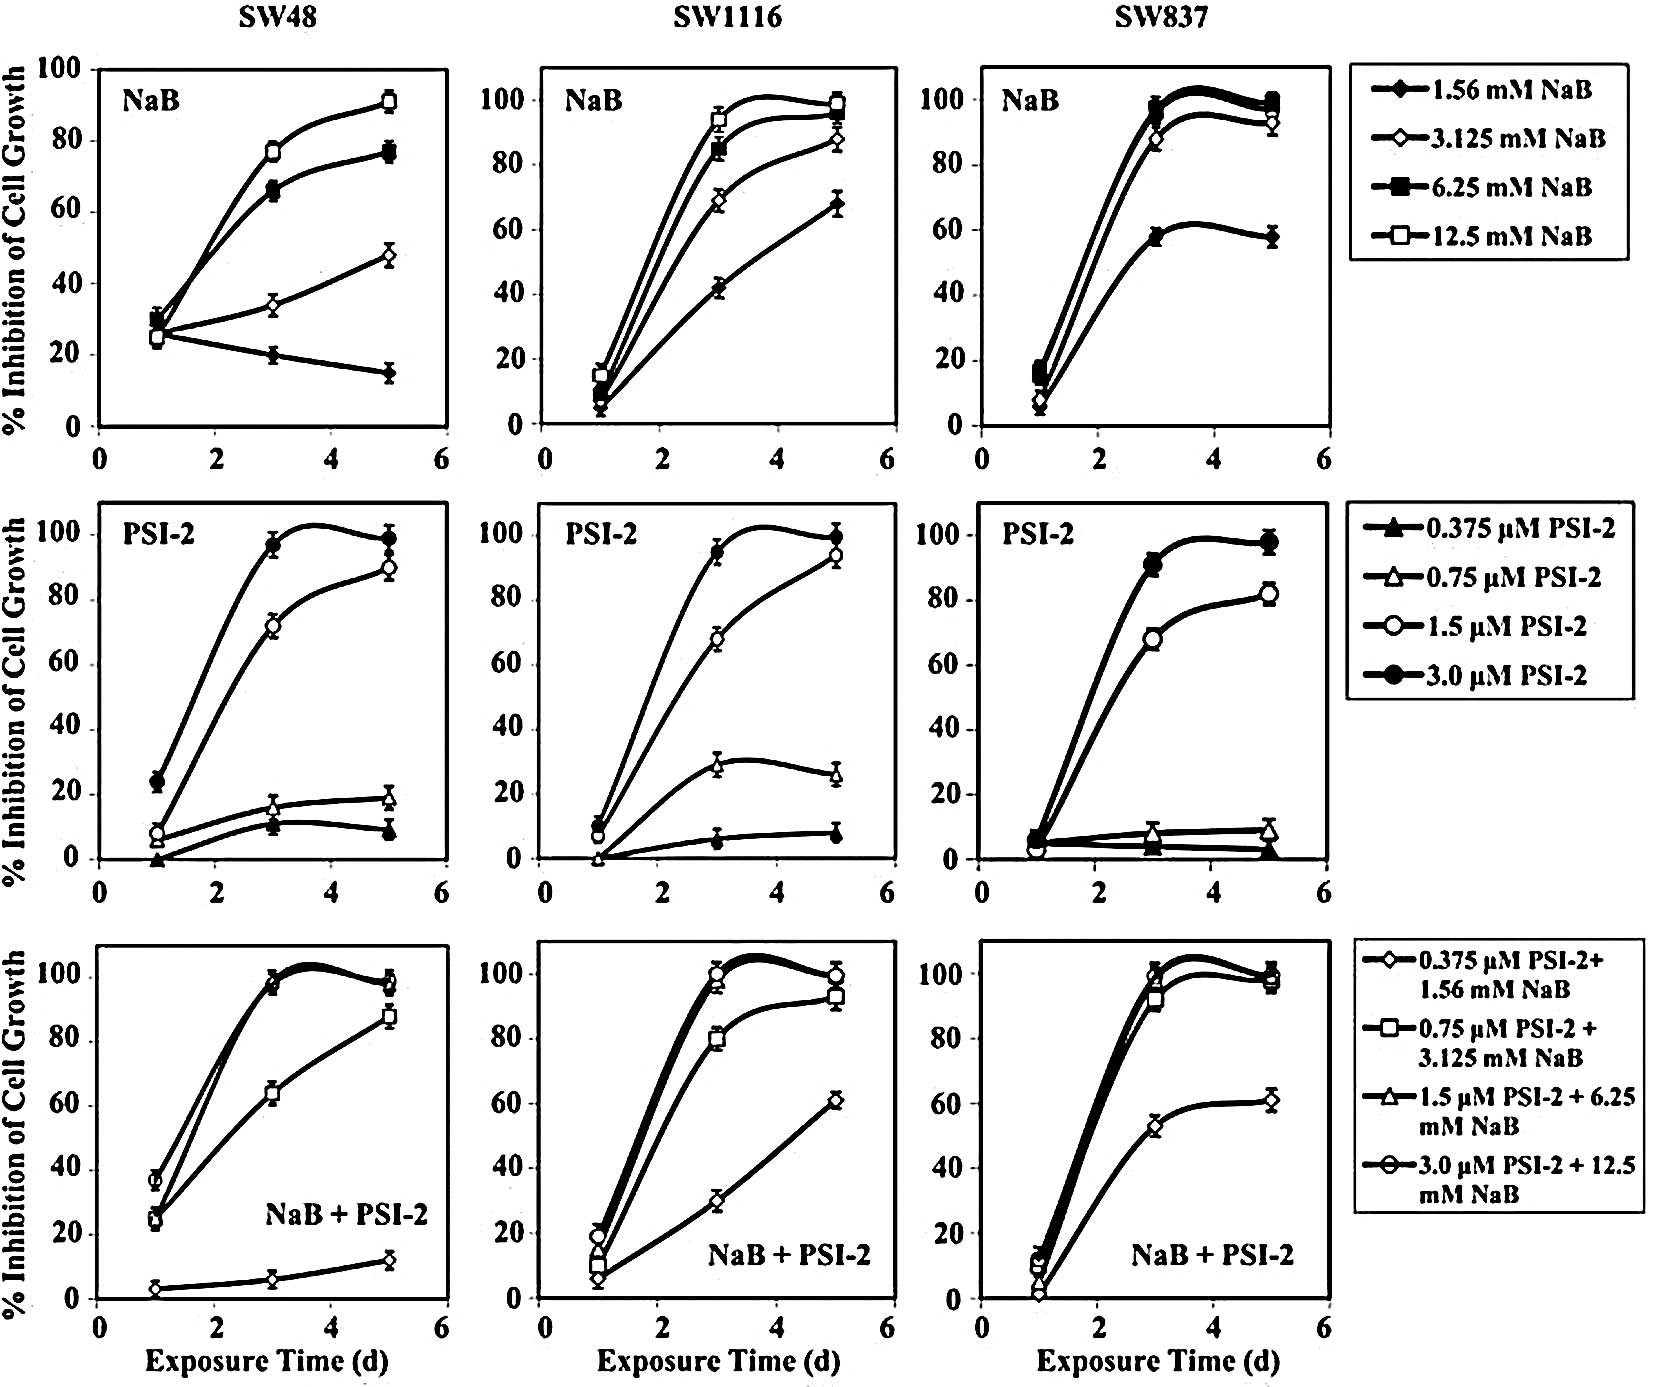
Augmentation of the antimitogenic
effect of PSI-2 by combination with NaB
Treatment of human colorectal cancer SW48 cells with
the combination of NaB and PSI-2 produced comparable growth
inhibition (mean, 31±5%) to that produced by NaB (mean, 27±2%)
after 24 h of treatment. The combined treatment produced higher
growth inhibition than that produced by PSI-2 (mean, 10±1%) after
24 h of treatment. However, this difference in growth inhibition
was statistically non-significant (P=0.376) (Fig. 5). After 72 h of treatment, the
combination of NaB and PSI-2 produced higher SW48 growth inhibition
(mean, 68±4%) than that produced by NaB (mean, 47±3%) or PSI-2
(mean, 49±4%). The differences in the SW48 growth inhibition
produced by combined treatment and single treatment with NaB
(P=0.381) and PSI-2 (P=0.416) were statistically non-significant
(Fig. 5). Similar results were
obtained when SW48 cells were treated with NaB and PSI-2 (mean,
73±4%), NaB (mean, 58±3%), or PSI-2 (mean, 54±5%) for 72 h
(Fig. 5). The differences in SW48
growth inhibition produced by combined treatment and NaB (P=0.525)
or PSI-2 (P=0.434) were statistically non-significant.
Human colorectal cancer cells SW1116 were not
affected by exposure to NaB, PSI-2, or their combination for 24 h
(Fig. 5). The combination of NaB
and PSI-2 produced a marked growth inhibition of SW1116 cells after
72 h of treatment (mean, 77±3%) that was comparable to the growth
inhibition produced by single treatment with NaB (mean, 73±2%). The
combined treatment produced higher but statistically
non-significant growth inhibition of SW1116 than that produced by
treatment with PSI-2 (mean, 50±4%; P=0.155) (Fig. 5). The growth of SW1116 cells was
markedly inhibited when the cells were exposed for 120 h to the
combination of NaB and PSI-2 (mean, 89±2%) or NaB (mean, 88±13%).
Exposure of SW1116 cells to PSI-2 for 120 h inhibited their growth
(mean, 55±5%). Although the combination of NaB and PSI-2 markedly
inhibited the growth of SW1116, as compared to single treatment
with PSI-2, the difference in growth inhibition was statistically
non-significant (P=0.083).
Treatment of SW837 cells with NaB, PSI-2 or their
combination for 24 h exerted very little effect (2–12%) on their
growth (Fig. 5). However, after 72
h, single treatment with NaB and the combination of NaB and PSI-2
produced a marked comparable growth inhibition of 84±2 and 85±2%,
respectively, of the SW837 cells (Fig.
5). Moreover, exposure of SW837 cells to PSI-2 for 72 h
produced much lower growth inhibition (mean, 42±4%) than that
produced by NaB (P=0.029) or the combination of NaB and PSI-2
(P=0.026). Exposure of SW837 cells to NaB, PSI-2, or their
combination for 120 h produced a similar growth inhibition to that
observed when these cells were treated for 72 h. NaB and the
combination of NaB and PSI-2 produced growth inhibition of 87±2 and
89±2%, respectively (Fig. 5).
Meanwhile, single treatment with PSI-2 produced a growth inhibition
of 47±5% after 120 h of treatment. The differences in SW837 growth
inhibition produced by PSI-2 and NaB or the combination of NaB and
PSI-2 were statistically significant, as indicated from P-values of
0.041 and 0.031, respectively.
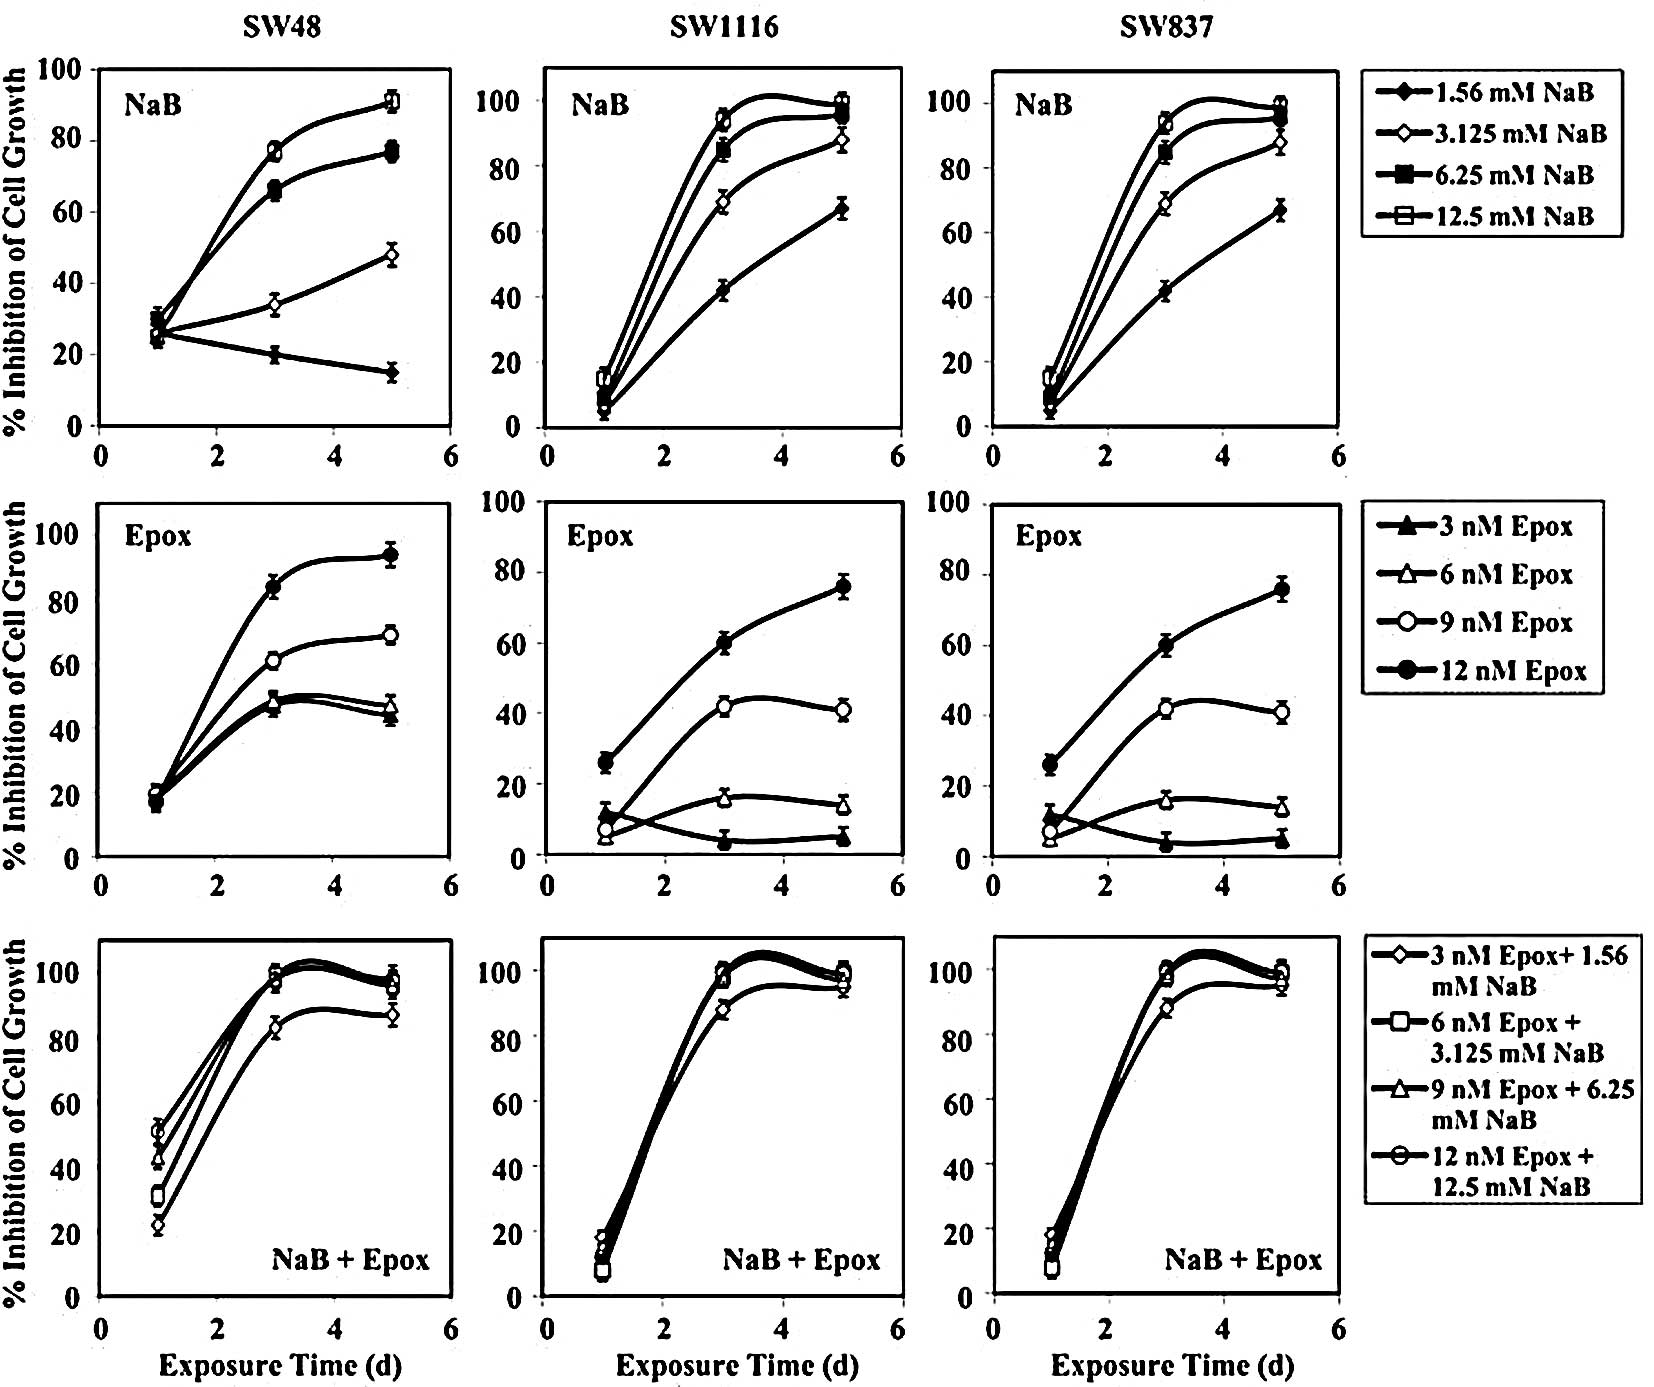
Augmentation of the antimitogenic
effect of epoxomicin by combination with NaB
Treatment of SW48 cells with the combination of NaB
and the proteasome inhibitor epoxomicin produced a higher growth
inhibition (mean, 37±8%) than that produced by NaB (mean, 27±2%;
P=0.542) or epoxomicin (mean, 17±3%; P=0.134) after 24 h of
treatment (Fig. 6). However, the
differences in growth inhibition were statistically non-significant
(Fig. 6). After 72 h of treatment,
the combination of NaB and epoxomicin produced a marked growth
inhibition (mean, 95±8%), as compared to single treatment with NaB
(mean, 48±3%) and epoxomicin (mean, 60±2%). The differences in SW48
growth inhibition produced by combined treatment with NaB and
epoxomicin and that produced by single treatment with NaB (P=0.001)
and epoxomicin (P=0.014) were statistically significant. Similar
results were obtained when SW48 cells were treated for 120 h with
the combination of NaB and epoxomicin (mean, 94±6%), as compared to
single treatment with NaB (mean, 58±3%) and epoxomicin (mean,
64±2%). The differences in SW48 growth inhibition produced by
combined treatment and single treatment with NaB (P=0.01) and
epoxomicin (P=0.027) were statistically significant.
The growth of SW1116 cells was slightly affected
after 24 h of treatment with epoxomicin (mean, 13%) or the
combination of NaB and epoxomicin (mean, 12.75%). Meanwhile, NaB
exhibited no effect on SW1116 proliferation (Fig. 6). Marked SW1116 growth inhibition
was observed after 72 h of treatment with the combination of NaB
and epoxomicin (mean, 96±5%). The differences in the growth
inhibition produced by combined treatment and single treatment with
NaB (mean, 73±2%; P=0.05) or epoxomicin (mean, 31±5%; P=0.001) were
statistically very significant. The combination of NaB and
epoxomicin produced a slightly higher SW1116 growth inhibition than
that produced by NaB alone (mean, 88±14%). However, the growth
inhibition of SW1116 produced either by the combination of NaB and
epoxomicin or NaB alone was much greater than that produced by
epoxomicin alone (mean, 34±3%) after 120 h of treatment. The
differences in the growth inhibition produced by either the
combination or NaB and that produced by epoxomicin were
statistically very significant (P=0.001).
The combined treatment with NaB and epoxomicin
produced a higher growth inhibition of SW837 cells (mean, 30±1.2%)
than that produced by NaB (mean, 12±0.6%) and epoxomicin (mean,
17.5±7%) alone after 24 h of treatment. The difference in growth
inhibition produced by combined treatment was statistically
significant (P=0.05), as compared to that produced by NaB alone.
However, this difference was statistically non-significant
(P=0.177), as compared to that produced by epoxomicin alone
(Fig. 6). After 72 h, the combined
treatment produced a much higher growth inhibition of SW837 (mean,
98±3%) than that produced by single treatment with epoxomicin
(mean, 21±2%; P=0.001). Although the combined treatment produced a
higher growth inhibition than that produced by NaB alone (mean,
84±2%), the difference in growth inhibition was statistically
non-significant (P=0.177). Similar results were obtained after 120
h of treatment; the growth of SW837 was markedly suppressed after
treatment with the combination of NaB and epoxomicin (mean,
99.0±1%), as compared to that produced by epoxomicin alone (mean,
19±2%; P=0.001). The combined treatment produced a higher growth
inhibition than that produced by NaB alone (mean, 87±2%). However,
the difference in growth inhibition was statistically
non-significant (P=0.194).
Analysis of the combined effects of
proteasome inhibitors and NaB on human colorectal cancer cells
The effects produced by treating human colorectal
cancer cells SW48, SW1116 and SW837 with various combinations of
NaB and the proteasome inhibitors (MG115, MG132, PSI-1, PSI-2 and
epoxomicin) were observed as previously described (22,23).
The results of three independent experiments are summarized in
Table I.
 | Table I.Analysis of the combined effects of
proteasome inhibitors and sodium butyrate on human colorectal
cancer cell lines. |
Table I.
Analysis of the combined effects of
proteasome inhibitors and sodium butyrate on human colorectal
cancer cell lines.
| Combined
interaction of proteasome inhibitors and NaB in human colorectal
cancer cell lines: |
|---|
| Single and combined
treatment of NaB and proteasome inhibitors | SW48
| SW1116
| SW837
|
|---|
| 1 d | 3 d | 5 d | 1 d | 3 d | 5 d | 1 d | 3 d | 5 d |
|---|
| 1.56 mM NaB + 0.25
μM MG115 | ant | ant | ant | ant | ant | ant | ant | ant | add |
| 3.125 mM NaB + 0.5
μM MG115 | ant | ant | ant | ant | ant | ant | ant | ant | syn |
| 6.25 mM NaB + 1.00
μM MG115 | ant | add | syn | ant | syn | syn | ant | add | syn |
| 12.5 mM NaB + 2.00
μM MG115 | ant | add | add | ant | add | syn | ant | add | add |
| 1.56 mM NaB + 0.25
μM MG132 | ant | ant | ant | ant | ant | ant | ant | ant | ant |
| 3.125 mM NaB + 0.5
μM MG132 | ant | ant | syn | ant | ant | add | ant | add | syn |
| 6.25 mM NaB + 1.00
μM MG132 | ant | add | add | ant | add | add | ant | add | add |
| 12.5 mM NaB + 2.00
μM MG132 | add | add | syn | ant | add | add | ant | add | add |
| 1.56 mM NaB + 0.013
μM PSI-1 | ant | add | syn | ant | add | syn | ant | syn | syn |
| 3.125 mM NaB +
0.025 μM PSI-1 | ant | syn | syn | ant | syn | add | ant | add | syn |
| 6.25 mM NaB + 0.05
μM PSI-1 | ant | add | add | ant | add | add | ant | add | add |
| 12.5mM NaB + 0.10
μM PSI-1 | ant | add | add | ant | add | add | ant | add | add |
| 1.56 mM NaB + 0.375
μM PSI-2 | ant | ant | ant | ant | ant | ant | ant | ant | ant |
| 3.125 mM NaB +
0.750 μM PSI-2 | ant | ant | add | ant | ant | add | ant | add | syn |
| 6.25 mM NaB + 1.500
μM PSI-2 | ant | add | add | ant | add | add | ant | add | add |
| 12.5 mM NaB + 3.000
μM PSI-2 | ant | add | add | ant | add | add | ant | add | add |
| 1.56 mM NaB + 3.000
nM Epox | ant | syn | syn | ant | syn | syn | ant | syn | syn |
| 3.125 mM NaB +
6.000 nM Epox | ant | syn | syn | ant | syn | syn | ant | syn | syn |
| 6.25 mM NaB + 9.000
nM Epox | ant | syn | add | ant | syn | add | ant | syn | syn |
| 12.5 mM NaB +
12.000 nM Epox | ant | add | add | ant | add | add | ant | add | add |
Various combinations of NaB and MG115 (6.25 mM/1.0
μM and 12.5 mM/2.0 μM) had additive or synergistic
anti-proliferative effects on SW48 and SW1116 after 72 and 120 h of
treatment. All the tested combinations exhibited additive or
synergistic anti-proliferative effects on SW837 after 120 h of
treatment (Table I).
Various combinations of NaB and MG132 (3.125 mM/0.5
μM, 6.25 mM/1.0 μM and 12.5 mM/2.0 μM) exhibited synergistic or
additive antiproliferative effects on the SW48, SW1116 and SW837
cells after 120 h of treatment. Additionally, these combinations
had additive antiproliferative effects on SW837 after 72 h of
treatment. The combinations of NaB and MG132 (6.25 mM/1.0 μM and
12.5 mM/2.0 μM) had additive antiproliferative effects on SW48 and
SW1116 after 72 h of treatment.
All the tested combinations of NaB and PSI-1
exhibited additive or synergistic antimitogenic effects on the
human colorectal cancer cells after 72 and 120 h of treatment
(Table I). All of the tested
combinations of NaB and PSI-2 except 1.56 mM NaB and 0.375 μM PSI-2
produced additive or synergistic antimitogenic effects on SW48,
SW1116 and SW837 after 120 h of treatment (Table I). The same combinations had an
additive antiproliferative effect on SW837 after 72 h of treatment.
All of the combinations of NaB and epoxomicin exhibited synergistic
or additive antiproliferative effects on SW48, SW1116 and SW837
after 72 and 120 h of treatment (Table
I).
These results indicate that the combinations of NaB
and the tested proteasome inhibitors can be ranked with respect to
their antimitogenic effects in the following order: NaB +
epoxomicin > NaB + PSI-1 > NaB + PSI-2 ≡ Na + MG115 ≡ NaB +
MG132. The antiproliferative activities and the type of combined
treatment were time-, dose- and cell line-dependent.
Cell cycle phase distribution of human
colorectal cancer cells treated with NaB, proteasome inhibitors,
and their combinations
FACS analysis showed that treatment of the human
colorectal cancer cells with 3 mM NaB resulted in the accumulation
of cells in the G1 phase (82.7%) with a corresponding
decrease in the number of cells in G2/M (2.61%) and S
(14.7%) phases (Fig. 7).
Meanwhile, treatment with 1.0 μM MG115, 1.0 μM MG132, 0.1 μM PSI-1,
1.5 μM PSI-2, or 12 nM epoxomicin resulted in the accumulation of
cells in the S phase (55.5, 33.7, 41.5, 42.7 and 32%, respectively)
and the G2 phase (15.2, 36, 44.3, 29.9 and 45.7%,
respectively) with a corresponding decrease in the number of cells
in the G1 phase (29.0, 29.7, 14.1, 27.4 and 22.3%,
respectively).
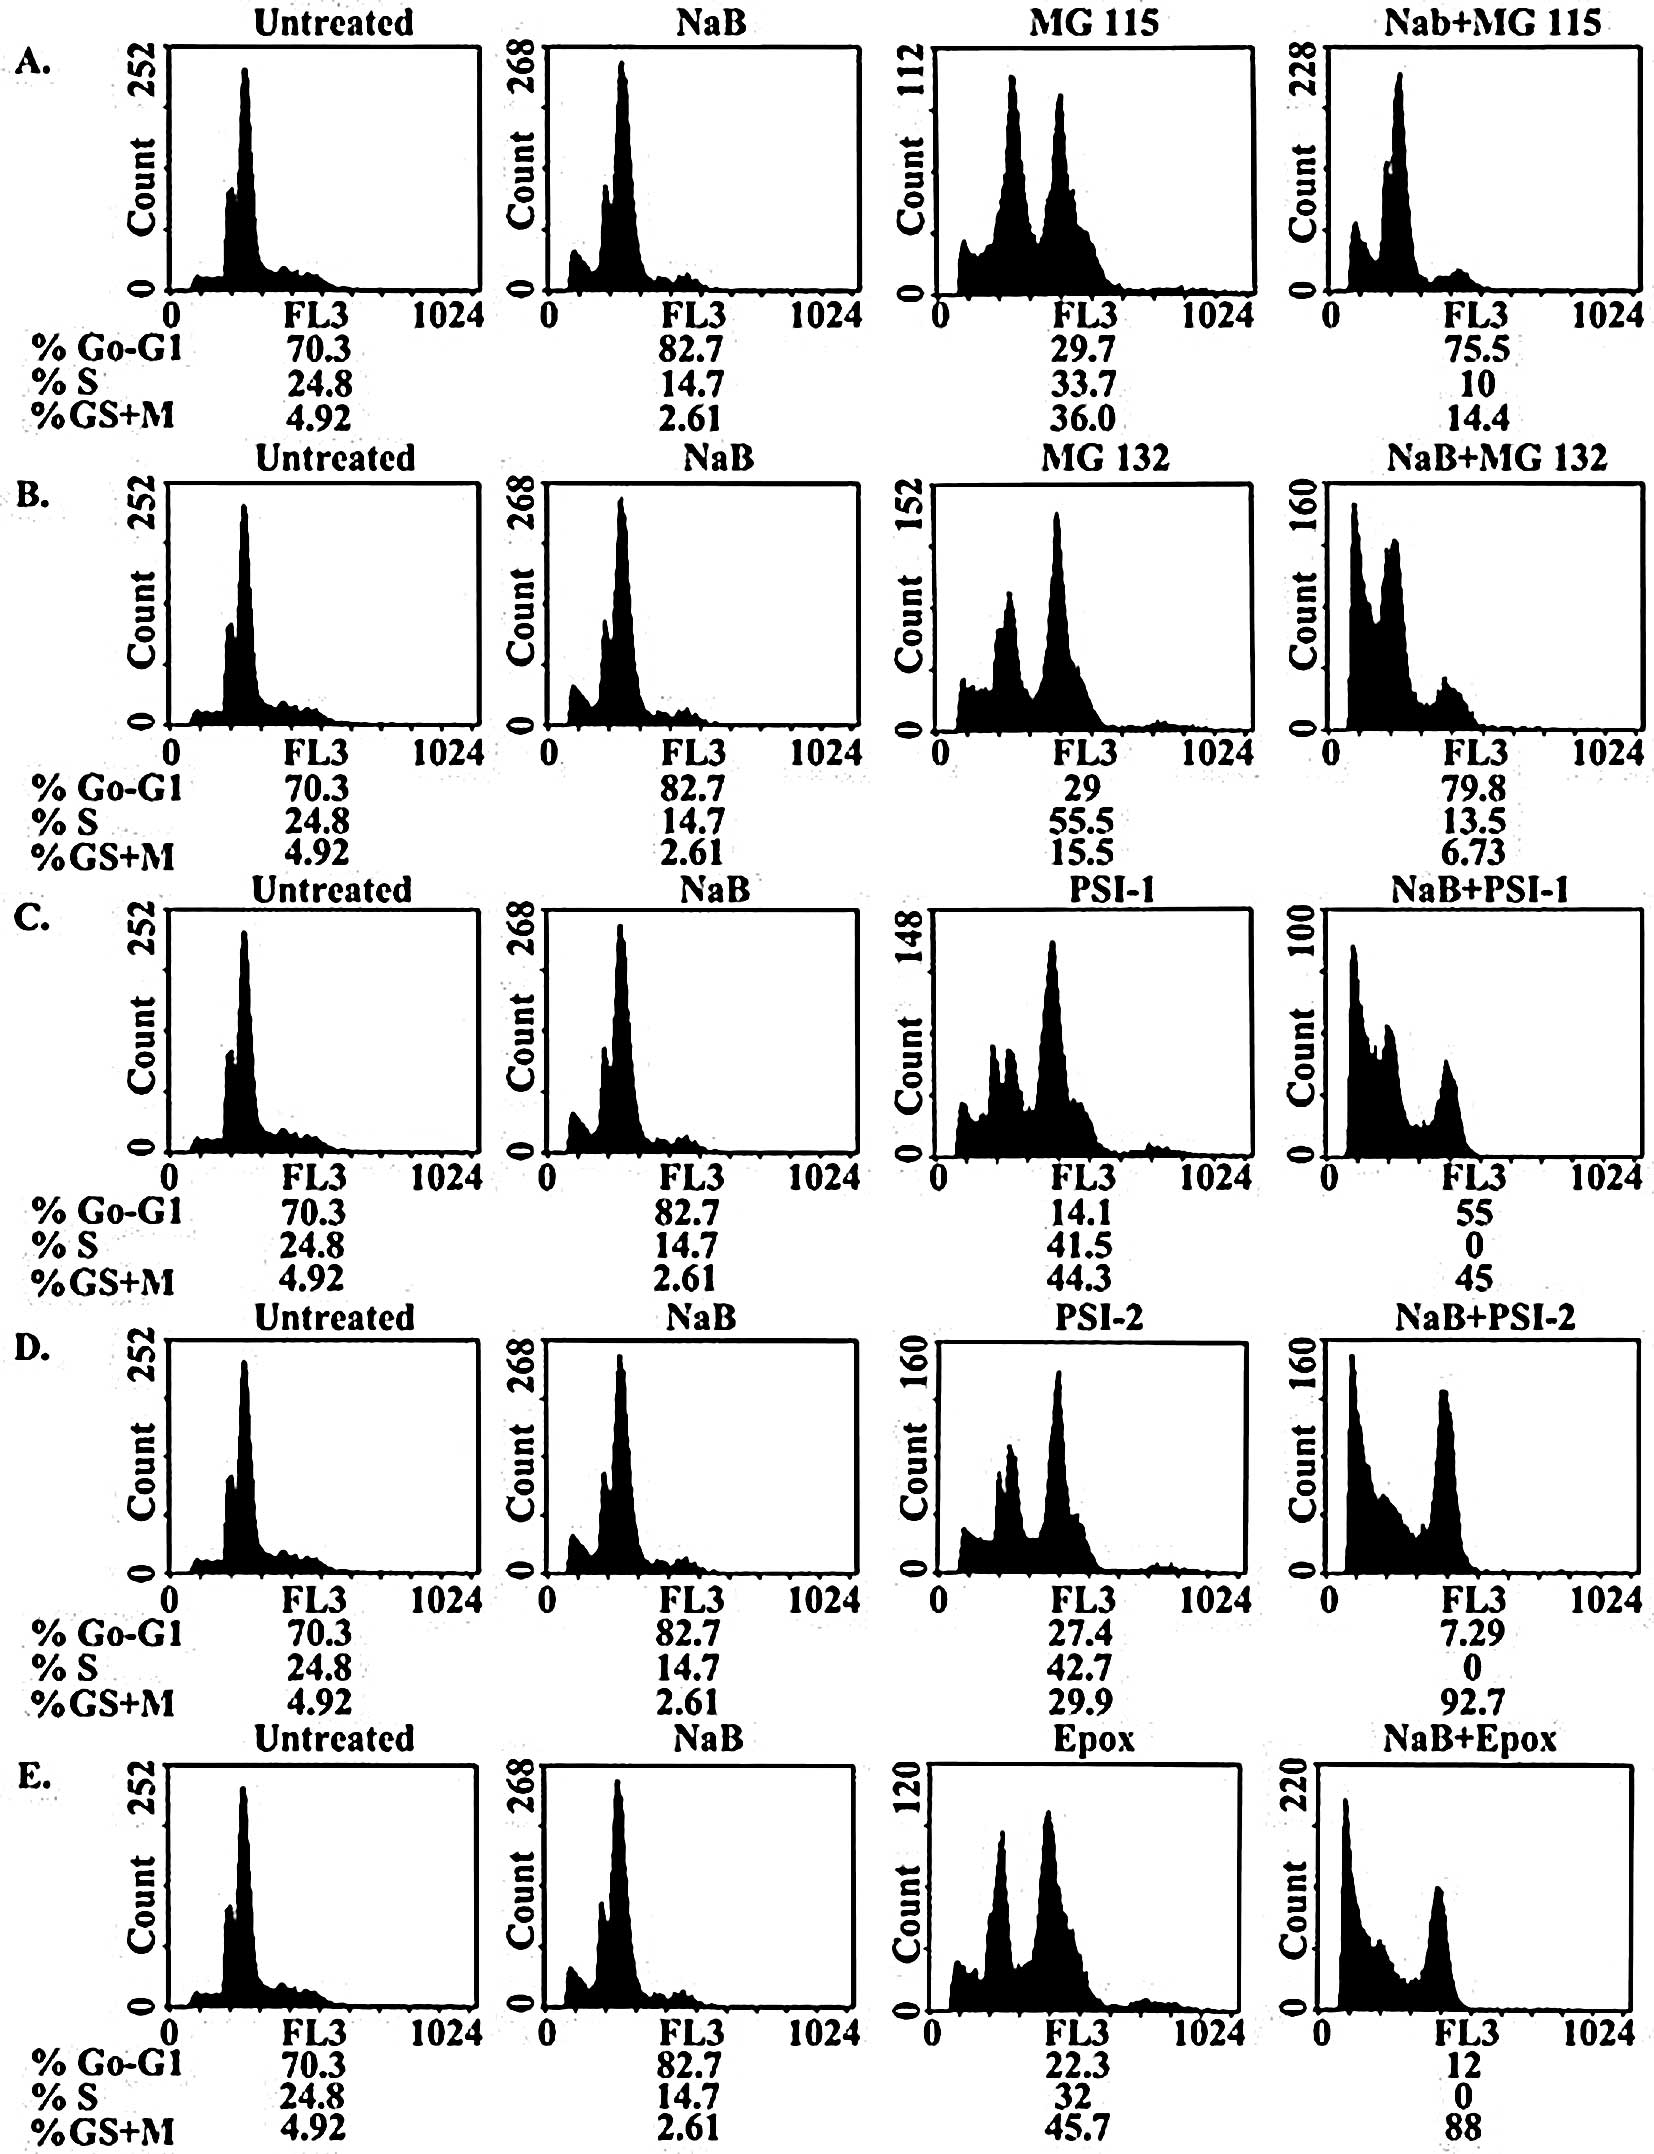 | Figure 7.Cell cycle distribution of human
colorectal cancer cells treated with NaB, proteasome inhibitors and
their combinations. Human colorectal cancer cells were plated
(5×10⁵ cells/well) into 24-well plates and incubated at 37°C in a
non-CO2 incubator. After 18 h, cells were treated
individually with NaB (3 mM), MG115 (1.0 μM), MG132 (1.0 μM), PSI-1
( 0.1 μM), PSI-2 (1.5 μM) and epoxomicin (12 nM) or treated with
the combinations NaB/MG115 (3 mM/1.0 μM), NaB/MG132 (3 mM/1.0 μM),
NaB/PSI-1 (3 mM/0.1 μM), NaB/PSI-2 (3 mM/1.5 μM) and NaB/epoxomicin
(3 mM/12 nM) for 72 h. At least duplicate samples were analyzed and
20,000 events were scored for each sample. The vertical axis
represents the relative number of events and the horizontal axis
represents the fluorescence intensity. The percentage of cells in
different cell cycle phases was calculated using Phoenix
statistical software package. |
Treatment of the human colorectal cancer cells with
the combination of 3 mM NaB and 1.0 μM MG115 or MG132 resulted in
the accumulation of cells in the G1 phase (79.8 or
75.5%, respectively) and the G2 phase (6.73 or 14.4%,
respectively) with a corresponding decrease in the number of cells
in the S phase (13.5 or 10%, respectively) (Fig. 7). On the other hand, the
combination of 3 mM NaB and 1.0 μM PSI-1, 1.5 μM PSI-2, or 12 nM
epoxomicin resulted in the accumulation of cells in the
G2 phase (45, 92.7 or 88%, respectively) with a
corresponding decrease in the number of cells in the G1
phase (55, 7.29 or 12%, respectively) and the S phase (0%)
(Fig. 7).
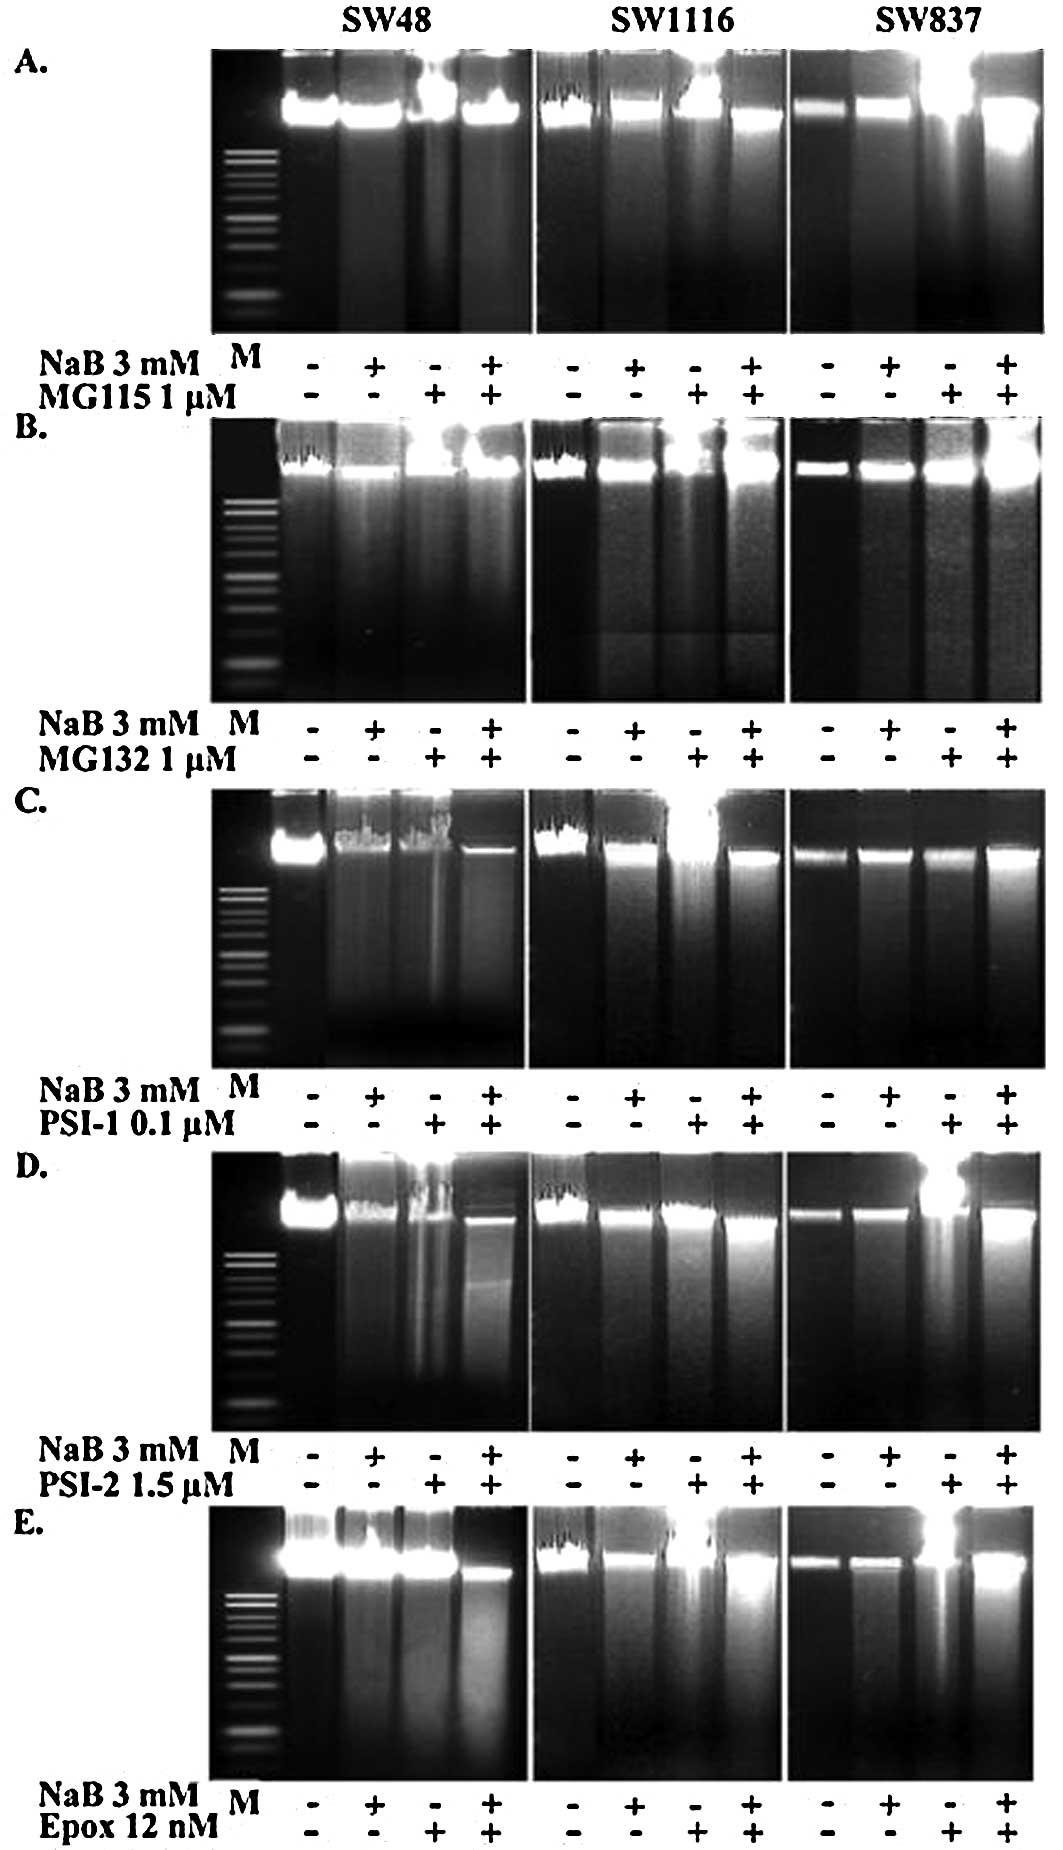
The effects of NaB, proteasome
inhibitors, and their combinations on apoptosis in human colorectal
cancer cells
The agarose gel electrophoresis of DNA extracted
from the untreated and treated (with NaB, proteasome inhibitors and
their combinations) human colorectal cancer cells exhibited a
distinct ladder pattern, which is the hallmark of apoptosis. Our
results clearly demonstrated that treatment with NaB, the
proteasome inhibitors, or their combinations induced apoptotic
involution. The extent of apoptosis in the human colorectal cancer
cells treated with the combination of NaB and the proteasome
inhibitors was more pronounced, as compared to that observed in the
cells treated with either NaB or proteasome inhibitors (Fig. 8).
To investigate the type of cell death induced by
NaB, the proteasome inhibitors, and their combinations, cells were
treated with AO/EB, which allows for the identification of viable,
apoptotic, and necrotic cells based on color and appearance.
Staining with AO/EB of the human colorectal cancer cells treated
for 24 h with 3 mM NaB exhibited ∼50% orange-stained cells. The
apoptotic effect appeared earlier in cells treated with proteasome
inhibitors or the combination of NaB and proteasome inhibitors. In
fact, 30 and 50% of apoptotic cells were observed after 8 h of
incubation with the proteasome inhibitors and their combinations
with NaB, respectively. The maximum effect was reached at 24 h when
50 and 80% of cells showed signs of apoptosis with the proteasome
inhibitors and the combination of NaB and the proteasome inhibitors
(data not shown).
Effects of NaB and epoxomicin on the
activities of caspases and on cytochrome-c release
Caspase-3, a cysteine protease, is present in cells
as an inactive pro-enzyme. Activation of this form requires
cleavage at specific aspartate sites to produce subunits of
Mr 17,000 Da and Mr 12,000 Da. The active
enzyme takes part in the execution phase of apoptosis (26).
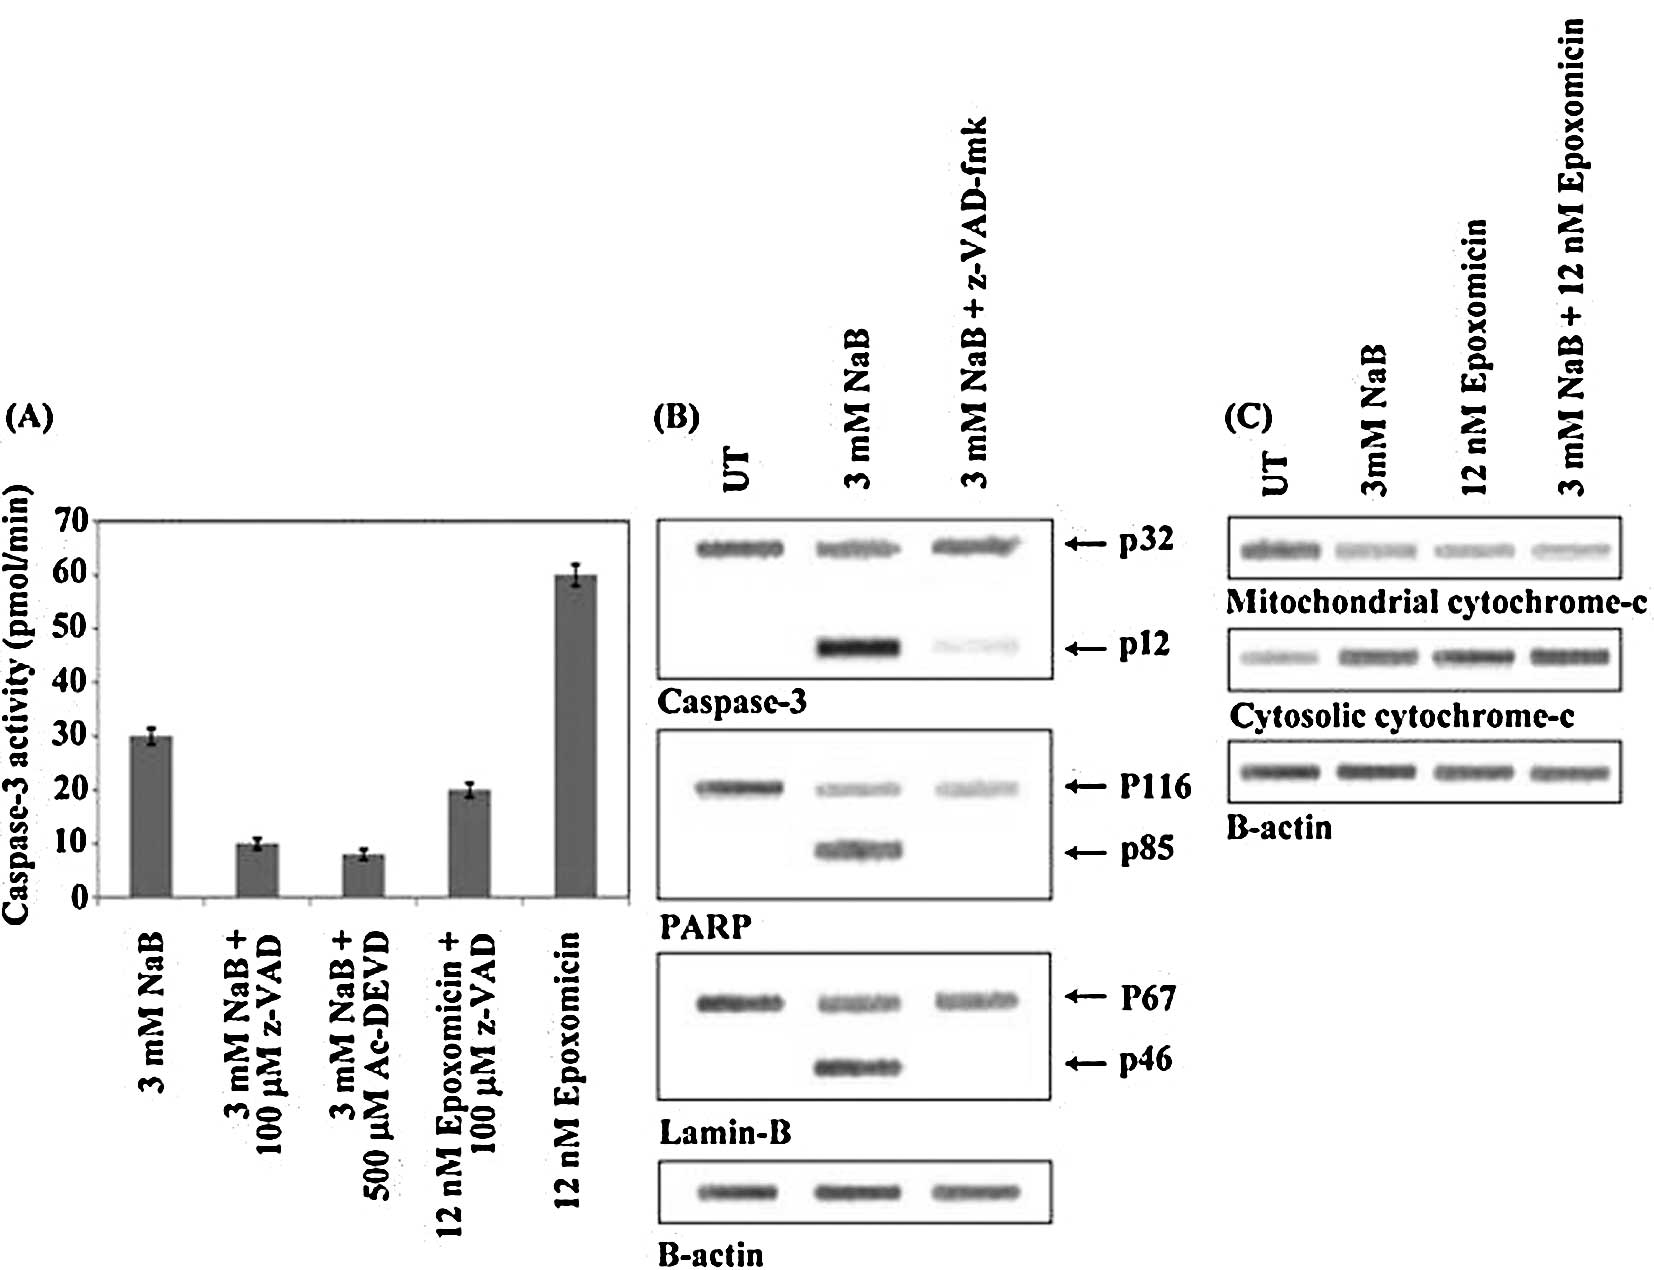
In this study, NaB induced the activation of
caspase-3 in human colorectal cancer cells. The direct estimation
of caspase-3 activity showed a 3-fold increase after exposure to 3
mM NaB. The effect was inhibited by both z-VAD-fmk and Ac-DEVD
(Fig. 9A). Exposure of colorectal
cancer cells to epoxomicin enhanced the activity of caspase-3, and
z-VAD-fmk (100 μM) was capable of suppressing the effect exerted by
epoxomicin on caspase activity (Fig.
9A).
The activation of caspase-3 was also shown by means
of Western blot analysis using a primary antibody that recognizes
both the Mr 32,000 Da pro-enzyme and the Mr
12,000 Da subunit of the active enzyme. As shown in Fig. 9B, in the cells treated with 3 mM
NaB, the p12 subunit increased, whereas that of the pro-enzyme
diminished at the same time. The addition of z-VAD-fmk suppressed
the production of the p12 subunit induced by NaB, providing
evidence that the activation of caspase-3 was stimulated by caspase
activities inhibited by z-VAD-fmk (Fig. 9B).
To demonstrate the proteolytic activity of caspase
in cells treated with NaB, we studied the fragmentation of two
nuclear proteins, PARP and lamin B, which are cleaved by caspase
activities (27). PARP is a
protein of Mr 16,000 Da that is associated with
chromatin and is cleaved in a number of cell death systems by
cysteine proteases to yield two fragments of Mr 24,000
Da. Western blot analysis revealed that treatment of the human
colorectal cancer cells with 3 mM NaB induced the proteolytic
cleavage of the Mr 116, Da PARP protein to yield the
characteristic Mr 85,000 Da fragment (Fig. 9B). Additionally, NaB (3.0 mM)
induced the cleavage of lamin B. The effects on both the cleavage
of PARP and lamin B were suppressed by the addition of z-VAD-fmk
(Fig. 9B). Similar results were
obtained when human colorectal cancer cells were treated with
epoxomicin (12.0 nM) and the combination of NaB (3 mM) and
epoxomicin (12.0 nM) (data not shown).
Mitochondria play a decisive role in apoptosis
(27), functioning as integrators
of different pro-apoptotic signaling pathways. In response to these
signals, mitochondria activate mega-channels (also called
permeability transition pores) that are present between the inner
and outer mitochondrial membranes. BcL2, a fundamental death
antagonist protein, inhibits mega-channel opening, whereas Bax, a
death antagonist protein, facilitates the opening of mega-channels
(28). The increase in the content
of agonists and the concomitant decrease in the content of
antagonists stimulate the release of cytochrome-c from the
mitochondria, with the consequent activation of caspase activities.
As shown in Fig. 9C, treatment
with 3 mM NaB, 12 nM epoxomicin, and their combination for 72 h
seemed to favor the release of cytochrome-c from the
mitochondria as the mitochondrial level of cytochrome-c
appeared diminished and the cytosolic level increased.
Differential expression of p53,
p21Waf1, p27Kip1, Bax and BcL2 proteins in
human colorectal cancer cells treated with NaB, proteasome
inhibitors and the combinations of NaB and proteasome
inhibitors
Western blot analysis (Fig. 10A and B) revealed that treatment
of the human colorectal cancer cells with NaB or proteasome
inhibitors differentially decreased the levels of BcL2 and
concomitantly increased the levels of Bax. Moreover, the
combinations of NaB with each of the tested proteasome inhibitors
modified the suppressive effects of NaB and proteasome inhibitors
on BcL2 levels and enhanced the enhancing effect on Bax levels
(Fig. 10A and B).
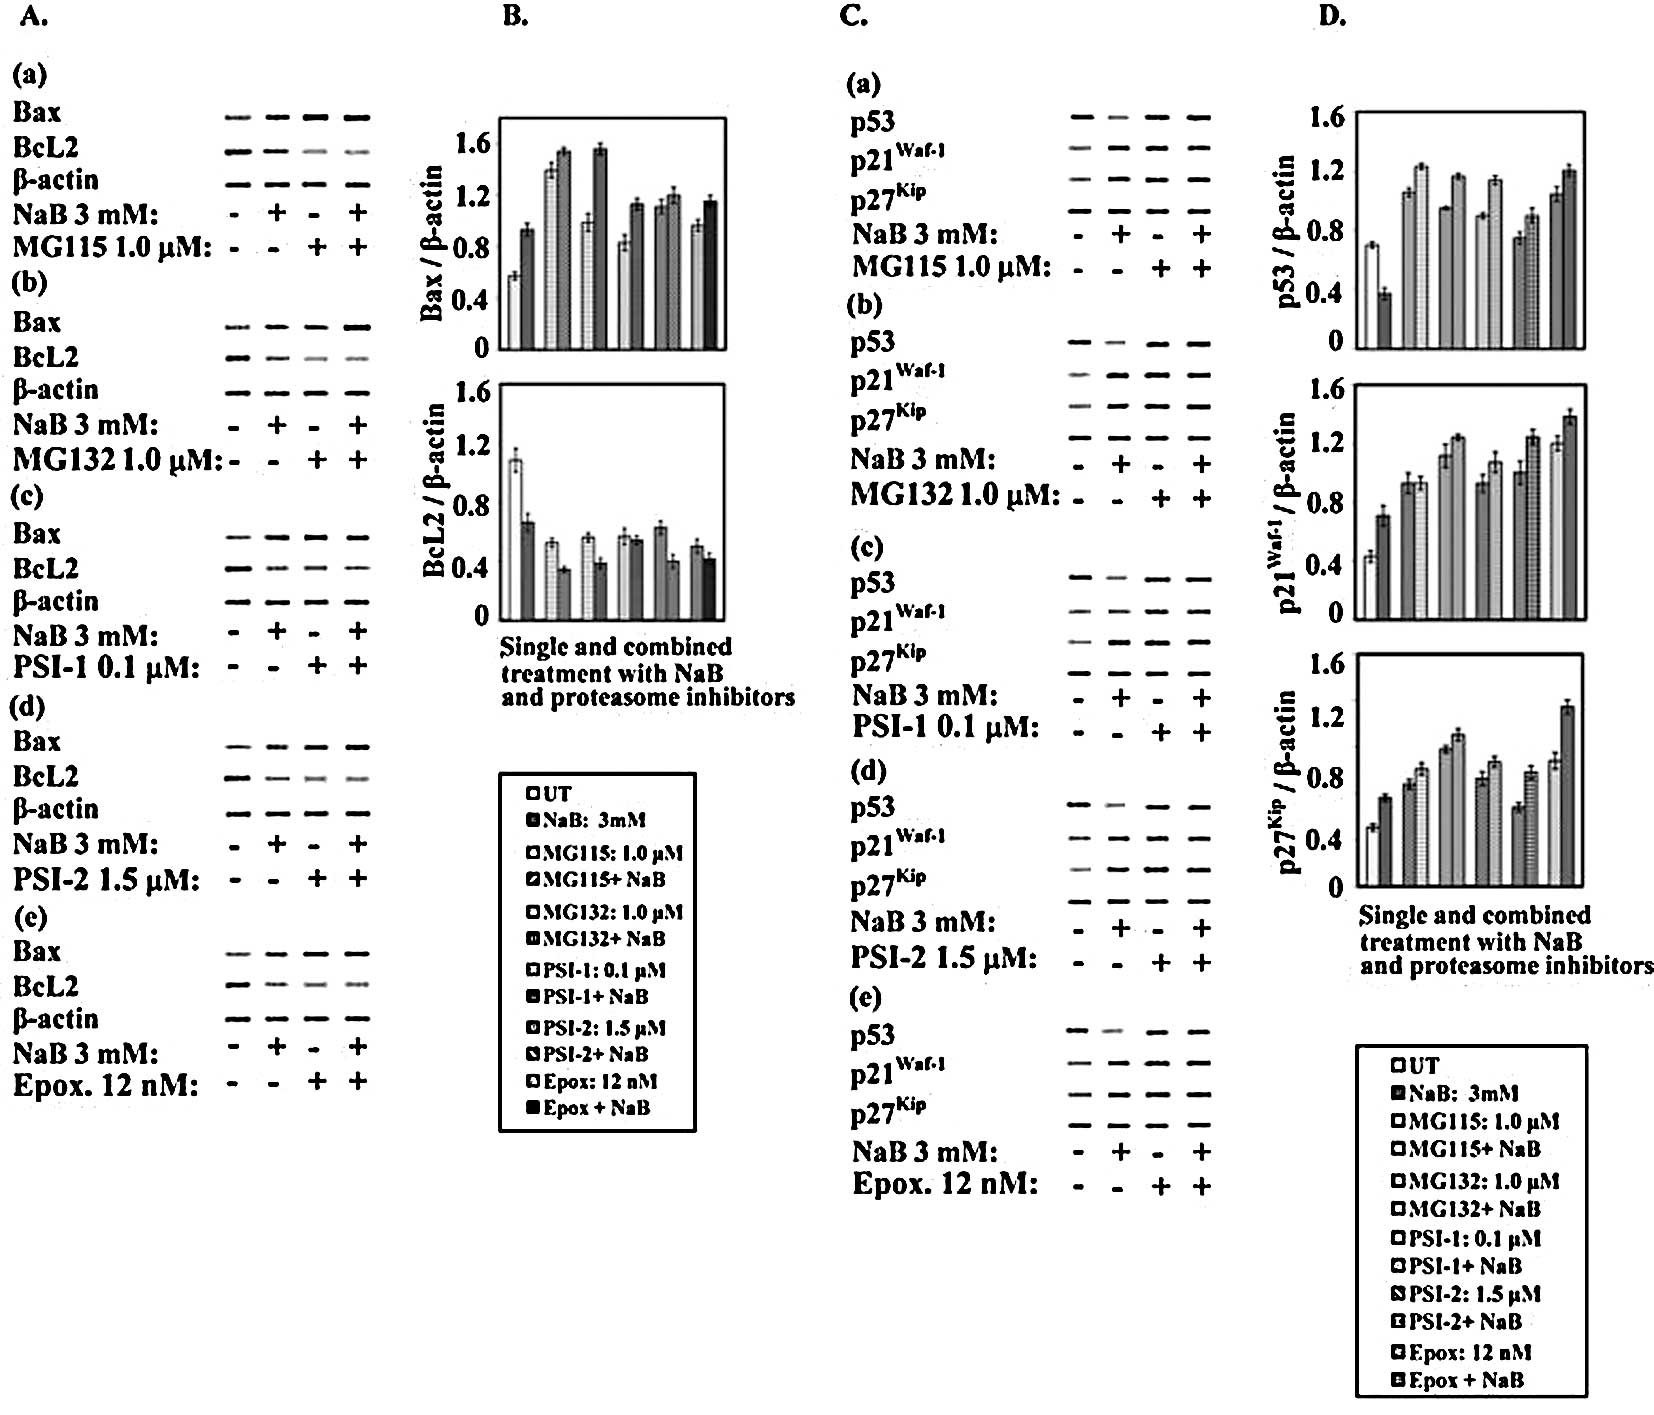 | Figure 10.Expression of cell cycle and
apoptosis regulatory proteins in human colorectal cancer cells
treated with NaB, proteasome inhibitors and their combinations.
Human colorectal cancer cells were plated (1–2×10⁶ cells/well) into
24-well plates and incubated at 37°C in a non-CO2
incubator. After 18 h, cells were treated individually with NaB
(3.0 mM), MG115 (1.0 μM), MG132 (1.0 μM), PSI-1 (0.1 μM), PSI-2
(1.5 μM) and epoxomicin (12.0 nM) or treated with the combination
of NaB/MG115 (3.0 mM/1.0 μM), NaB/MG132 (3.0 mM/1.0 μM), NaB/PSI-1
(3.0 mM/0.1 μM), NaB/PSI-2 (1.5 μM) or NaB/epoxomicin (3.0 mM/12.0
nM) for 72 h. Cell extracts of untreated and NaB-, proteasome
inhibitor- or the combinations of NaB and proteasome
inhibitor-treated colorectal cancer cells were analyzed for the
expression of Bax, Bcl2, p21Waf1, p27Kip1,
p53 and β-actin by Western blot analysis. The blots (A and C) were
scanned, and the intensities of the bands were determined (B and
D). |
Studies from several laboratories have suggested
that deregulation of cell progression may be involved in the
initiation of apoptosis (29). In
addition, it has been reported that the ubiquitin-proteasome
pathway plays an essential role in the regulation of several
important cell cycle proteins, including p53 (30) and the cyclin-dependent kinase
inhibitors p21Waf1 (31) and p27Kip1 (32).
After treatment with NaB, proteasome inhibitors
(MG115, MG132, PSI-1, PSI-2 and epoxomicin), and their
combinations, the protein levels of p53, p21Waf1 and
p27Kip1 were examined by Western blotting. It is well
known that ubiquitin-proteasome systems play an important role in
the degradation of many short-lived proteins, including p53
(33). As shown in Fig. 10C and D, treatment of the human
colorectal cancer cells with 3.0 mM NaB lowered the level of p53 by
∼50% with respect to the control. Since p53 is cleaved by the
ubiquitin-proteasome complex, the inhibition of this activity would
be expected to stabilize the p53 protein. To investigate this
possibility, the effect of proteasome inhibitors MG115, MG132,
PSI-1, PSI-2 and epoxomicin on the p53 level was determined. Clear
differential enhancement in the levels of p53 was observed after 72
h exposure to 1.0 μM MG115, 1.0 μM MG132, 1.0 μM PSI-1, 1.5 μM
PSI-2 or 12.0 nM epoxomicin (Fig. 10C
and D).
Notably, when human colorectal cancer cells were
treated with the combinations of each of these proteasome
inhibitors and NaB, the proteasome inhibitors counteracted the
decreasing effects of NaB on p53. In this way, in the colorectal
cancer cells exposed for 72 h to combined treatment, the levels of
p53 were higher than those in the control and were comparable to
the levels found in the cells treated with the proteasome
inhibitors alone (Fig. 10C and
D).
It is well known that p21Waf1, a
transcriptional target of p53, plays a role in the control of the
cell cycle. Moreover, it has been reported that NaB is capable of
stimulating p21Waf1 expression in a p53-independent
manner (34). The results
presented in this study showed that in the human colorectal cancer
cells, NaB increased the level of the p21Waf1 protein.
Treatment of cancer cells with the rest of the proteasome
inhibitors and their combinations with NaB for 72 h differentially
increased the levels of p21Waf1 depending upon the type
of proteasome inhibitor and its combination with NaB. Similar to
p21Waf1, treatment with NaB, proteasome inhibitors and
their combinations resulted in increased expression of
p27Kip1 (Fig. 10C and
D).
Discussion
The proteasome is a multi-catalytic protease complex
that is responsible for the ubiquitin-dependent turnover of
cellular proteins (35). It is
estimated that over 80% of intracellular proteins are degraded by
proteasomes. Besides carrying out protein turnover, the ubiquitin
proteasome pathway plays an essential role in regulating protein
levels during the cell cycle, during apoptosis, in response to
cellular stress (i.e. DNA damage or hypoxia), and during
intracellular signal transduction (36).
Clinical validation of the proteasome as a
therapeutic target in oncology has been provided by the boronic
acid bortezomib, a dipeptide (36). Bortezomib has proven to be
effective as a single agent in multiple myeloma (37) and against some forms of
non-Hodgkin’s lymphoma (38);
however, despite the clinical success of bortezomib, a significant
fraction of patients remain refractory to treatment (37,38).
Furthermore, a number of side effects, including cardiotoxicity
(39,40), painful peripheral neuropathy
(41) and thrombocytopenia
(42), have restricted treatment
of bortezomib to a biweekly dosing schedule that allows for the
full recovery of proteasome activity between doses (43). In addition, drug resistance
ultimately emerges in all tumors that initially respond to
proteasome inhibitors (44).
The induction of apoptosis has been recognized as an
effective tool in the therapeutic treatment of many types of
tumors, and apoptosis can be triggered by a number of drugs, such
as proteasome inhibitors. However, the efficacy of treatment with
apoptotic drugs is limited by their toxicity and cell resistance
(45). Sodium butyrate, a natural
product that is capable of inducing apoptosis in a number of tumor
cells, exhibits a low degree of clinical toxicity (46) and may therefore be of particular
importance in tumor therapy. With this in mind, the aim of the
current study was to investigate whether sodium butyrate enhances
the anticancer effects of proteasome inhibitors MG115, MG132,
PSI-1, PSI-2 and epoxomicin in human colorectal cancer
carcinoma.
The results obtained from this study demonstrated
that single treatment of human colorectal cancer cells with NaB and
proteasome inhibitors MG115, MG132, PSI-1, PSI-2 or epoxomicin
inhibited cell growth in a time- and dose-dependent manner
(Fig. 1). Moreover, the
combinations of proteasome inhibitors and NaB markedly inhibited
the proliferation of the human colorectal cancer cells in a dose-
and time-dependent manner (Figs.
2–6); the combinations of
proteasome inhibitors and NaB produced additive and synergistic
growth inhibitory effects (Table
I). Our results are consistent with those reported by Giuliano
et al who found that the treatment of retinoblastoma Y79
cells with NaB progressively reduced cell viability, and after 72 h
the number of cells decreased by approximately 70% (47). Our results are also consistent with
those obtained by Kim et al who demonstrated that MG132
inhibited the cellular growth of HCT116 cells in a time- and
dose-dependent manner (48).
Similar to those reported by Fan et al our results showed
that MG132 inhibited the growth of human colorectal cell lines in a
dose- and time-dependent manner (24). Similar results were recently
reported by Wu et al who found that MG-132 significantly
suppressed the proliferation of colon cancer SW1116 and HT-29 cells
(49). However, our results
contradicted those obtained by Denlinger et al who found
that non-small cell lung cancer cell lines treated with NaB were
resistant to NaB-induced apoptosis (50).
Flow cytometric analysis showed that NaB induced an
arrest of human colorectal cancer cells at the G1-phase.
Our results are similar to those reported by Abramova et al
who showed that NaB induced G1-S arrest in rat embryo
fibroblast cells that were transformed with the oncogenes E1A and
c-Ha-Ras (51). On the other hand,
these results contradict the observation of other investigators
(47,52). In the present study, the treatment
of colorectal cancer cells with proteasome inhibitors resulted in
the accumulation of cells in the S phase and G2 phase.
Meanwhile, the combinations of NaB and MG115 or MG132 induced an
arrest of the colorectal cancer cells in the G1 phase
and G2 phase. Conversely, the combinations of NaB and
PSI-1, PSI-2 or epoxomicin growth arrested colorectal cancer cells
in the G2 phase (Fig.
7).
Coordinated proteolytic activity of the
ubiquitinproteasome system has proven to be crucial to the normal
progression of the cell cycle. In this study, the levels of
p21Waf1 and p27Kip1 were markedly increased
following treatment with the combinations of NaB and each of the
tested proteasome inhibitors (Fig.
10C and D). Other researchers have demonstrated the
accumulation of p21Waf1 and p27Kip1 in
different cell lines treated with different proteasome inhibitors
(24,53). Our results are also in agreement
with those reported recently by Wu et al (49) who demonstrated that MG-132
activated bone morphogenetic protein (BMP) signaling, which
manifested as an increase in the up-regulation of
p21Waf1 and p27Kip1 expression as well as
Smad 1/5/8 phosphorylation. Knockdown of the BMP receptor II
abolished Smad 1/5/8 phosphorylation, the induction of
p21Waf1 and p27Kip1, and the inhibition of
cell proliferation that was induced by MG132. These findings
suggest that proteasome inhibition suppresses gastric cancer cell
proliferation via activation of BMP signaling, demonstrating a
novel aspect of proteasome function in the regulation of colon
cancer cell proliferation (49).
Overexpression of p27Kip1, as reported in this study,
can directly result in apoptosis (54). Recently, Timmerbeul et al
demonstrated that p27Kip1 stabilization prevents
progression from adenomatous polyps to invasive intestinal cancer
(55). Proteasome-induced
cytotoxicity could potentially result from several events,
including the stabilization and deregulated function of cyclins,
CDK inhibitors, tumor suppressor proteins, and a large number of
other proteins that are associated with cell cycle progression
(33). Inhibiting the degradation
of key cell cycle regulatory proteins causes a disparity in the
proliferative signals and eventually leads to apoptosis.
In the present study, the human colorectal cancer
cells exhibited a distinct ladder pattern that is indicative of
apoptosis following treatment with NaB, proteasome inhibitors, or
their combinations. The extent to which apoptosis occurred in
colorectal cancer cells treated with the combinations of NaB and
the proteasome inhibitors was more pronounced than it was when
produced by a single treatment with NaB or the proteasome
inhibitors (Fig. 8). These results
are consistent with those reported by other researchers (24,47,48).
Quite recently, similar results were obtained using a combination
of the proteasome inhibitor bortezomib and thiazol antibiotics,
which synergistically induced apoptosis in prostate cancer cells
(56). Also, the combination of
the novel proteasome inhibitor NPI-0052 and lenalidomide induced
apoptosis in multiple myeloma cell lines and in multiple myeloma
cells (57). Moreover, Matondo
et al investigated the induction of apoptosis by proteasome
inhibitors in several human myeloid leukemia (AML) cell lines and
in primary cells from patients, and found that various AML subtypes
may present different responses to proteasome inhibitors and that
the amount of 20S proteasome in AML cells may be predictive
of the cellular response to these inhibitors (58).
Members of the ICE family of cysteine proteases are
present as inactive zymogens within the cell and are processed at
the onset of apoptosis into enzymatically active heterodimer
complexes (59). Three of these
caspases, including caspase-3, -6 and -7, have been implicated in
the execution phase of apoptosis (60). Caspase-3 was shown to cleave a wide
range of cytoplasmic and nuclear proteins (60); caspase-7 is closely related to
caspase-3 and has the same synthetic substrate specificity in
vitro (61). PARP cleavage has
been widely used as an indicator of the activation of caspase-3 or
of closely related enzymes with similar substrate specificity
(62). Similarly, caspase-7 is
also involved in the cleavage of PARP during apoptosis (63). In the present study, butyrate or
tested proteasome inhibitor-induced apoptosis was preceded by the
activation of caspase-3, which was clearly observed at 24 h of
treatment by direct measurement of its activity (Fig. 9A). Western blot analysis also
demonstrated the conversion of procaspase-3 into the active form of
the enzyme (Fig. 9B). Activation
of caspase-3 was accompanied by degradation of PARP with the
production of the Mr 85 kDa fragment (Fig. 9B). The observation that NaB also
provokes the degradation of lamin B, a substrate of caspase-6
(64), suggests that other
caspases besides caspase-3 could be involved in butyrate-induced
apoptosis. All of these events preceded the appearance of
morphological signs that were observed in a large percentage of
cells after a 48-h treatment.
Members of the BcL2 gene family are major
regulators of programmed cell death. BcL2 is a potent inhibitor of
apoptosis, while Bax, one of the BcL2 family genes, promotes
apoptosis. Bax can dimerize with BcL2, and the regulation of the
BcL2-Bax heterodimer determines whether a cell will continue to
grow or undergo apoptosis (65).
BcL2, located on the outer mitochondrial membrane, inhibits
cytochrome-c release, thereby blocking apoptosis (66); conversely, Bax induces caspase
activation and apoptosis via cytochrome-c release (34). The present study tested whether
NaB, epoxomicin, or their combination is capable of inducing
changes in the levels of cytochrome-c that is present in
both the mitochondria and cytosol. The results shown in Fig. 9C showed that after 24 h of
treatment, cytochrome-c was released from the mitochondria
under the influence of NaB, epoxomicin, and their combination. Such
an event could be responsible for the production of the apoptosome
that, with the consequent activation of caspase-9, activates
caspase-3 (67). The release of
cytochrome-c was induced in the colorectal cancer by a decrease in
the level of the anti-apoptotic factor BcL2 as well as concomitant
enhancement in the level of the pro-apoptotic factor Bax in the
human colorectal cancer cells treated with NaB, proteasome
inhibitors, and their combinations (Fig. 10A and B).
It has been ascertained that 26S proteasome
inhibitors are capable of triggering apoptosis in rapidly dividing
cells (30); such an effect has
been correlated with the ability of proteasome inhibitors to
increase the intracellular levels of many short-lived factors
(32). However, it has been
suggested that apoptosis that is induced by proteasome inhibitors
can be a consequence of the activation of c-Jun NH2-terminal kinase
(68), an enzyme that is involved
in the initiation of programmed cell death.
The results presented in this study clearly
indicate that proteasome inhibitors MG115, MG132, PSI-1, PSI-2 and
epoxomicin induced apoptosis (Fig.
8), together with a marked increase in the level of the
short-lived protein p53 (Fig. 10C and
D). Expression of the p53 protein is controlled largely by
mdm-2/hdm-2-mediated ubiquitylation and is degraded via the
proteasome. It therefore stands to reason that proteasome
inhibitors will result in the accumulation of p53 in cells that
contain the wild-type protein. Furthermore, our results
demonstrated that the tested proteasome inhibitors increased the
level of Bax protein (Fig. 10A and
B), a factor that seems to be involved in the p53-mediated
response as it favors the release of cytochrome-c from the
mitochondria into the cytosol and the consequent activation of
caspase-3. Our results are in agreement with those reported by
Williams and McConkey (69) who
found that bortezomib stabilized p53 and induced its nuclear
translocation in human LNCaP prostate cancer cells (69). In addition, bortezomib activated
p53 downstream target genes, including p21, Fas, and Bax and
transfection with the human papilloma virus E6 protein, which
blocked p53, attenuated bortezomib-induced cell death (69).
The results reported in this study demonstrate that
NaB decreases the levels of p53, most likely through the activation
of the 26S proteasome. Also, the finding that the tested
proteasome inhibitors induced apoptosis and concomitantly increased
the levels of p53 suggests a possible synergistic interaction
between NaB and the tested proteasome inhibitors in the induction
of apoptosis in human colorectal cancer cell lines. This postulate
was confirmed by our results, which illustrate the synergistic
relationship between NaB and proteasome inhibitors on apoptosis.
These effects are likely a result of the inhibition of proteasome
activity by the proteasome inhibitors with the suppression of the
stimulatory action of butyrate; consequently, the cells were
prevented from decreasing their levels of p53. The presence of
adequate amounts of p53 most likely enhances the susceptibility of
the cells to apoptosis induction. A synergistic effect was reported
by Medina et al (70) who
observe that cells primed with butyrate were rendered highly
susceptible to apoptosis by staurosporine, an agent that causes
mitochondrial release of cytochrome-c.
In the present study, when the colorectal cancer
cells were simultaneously exposed to the proteasome inhibitors and
NaB, Bax protein levels increased markedly compared to single
treatments. Bax protein is the product of a gene that represents a
transcriptional target of p53. In addition, BcL2 levels in these
cells were down-regulated. Our results concur with those reported
in another study (71). Meanwhile,
Zhu et al did not find any changes in the expression of BcL2
or Bcl-XL in human colorectal, lung and ovarian cancer cells that
were treated with bortezomib (72).
The increase in the Bax levels and the concomitant
decrease in the BcL2 levels could have been responsible for the
enhanced release of cytochrome-c from the mitochondria, with
the consequent activation of caspase-3 and the induction of
apoptosis. Our results agree with Goldstein et al who show
that the release of cytochrome-c during apoptosis via
GFA-tagged cytochrome-c was rapid, complete and kinetically
invariant (73). Also, our results
are in agreement with those reported by Zhu et al who found
that cytochrome-c release was detectable in as little time
as 3 h, and that a dramatic cytochrome-c release was
detected at 18 h following bortezomib treatment (72).
The ability of butyrate to influence cell function
is associated with its regulation of gene expression, which is
often attributed to its inhibition of histone deacetylase (74). This results in the hyperacetylation
of histones and the enhancement of the accessibility of
transcription factors to nucleosomal DNA (75). However, it is likely that butyrate
has other intracellular targets, including hyperacetylation of
nonhistone proteins, alteration of DNA methylation, selective
inhibition of histone phosphorylation, and modulation of
intracellular kinase signaling (74). This multiplicity of effects may
underlie the ability of butyrate to modulate gene expression and
impact the key regulators of apoptosis and the cell cycle.
We therefore conclude that the synergistic
interactions between NaB and proteasome inhibitors MG115, MG132,
PSI-1, PSI-2, or epoxomicin are closely correlated with the
increased levels of the pro-apoptotic factor p53 and subsequent
p21Waf1 transactivation, resulting in cell cycle arrest.
Increases in p53 activity also results in the up-regulation of Bax
and induced apoptosis. Combined treatment with NaB and proteasome
inhibitors may also directly induce the up-regulation of both Bax
and p27Kip1; accumulation of p27Kip1
contributes to both apoptosis and cell cycle arrest.
The synergistic apoptotic effects of NaB and
proteasome inhibitors may open new and interesting perspectives in
the therapeutic strategy for the treatment of human colorectal
cancer. It is of interest that the proteasome inhibitors seem to
behave as apoptotic agents only in rapidly dividing cells while
protecting quiescent cells from apoptosis that may be triggered by
many different compounds (30).
Due to this particular behavior, proteasome inhibitors may
represent a new alternative in the treatment of certain
proliferative diseases. In addition, the association between a
proteasome inhibitor and other effective agents of apoptosis could
induce a clear effect at lower concentrations of the compounds, as
is shown in this study, thereby reducing the toxicity of the
therapeutic treatment.
Acknowledgements
This study was supported by Kuwait
University, Research grant no. SL04/02. The author gratefully
acknowledge the help of Dr Rajaa Al-Attiyah and Mrs. Amany
El-Shazely of the Department of Microbiology, Faculty of Medicine,
University of Kuwait who performed the flow cytometric
analysis.
References
|
1.
|
Mani A and Gelmann EP: The
ubiquitin-proteasome pathway and its role in cancer. J Clin Oncol.
23:4776–4789. 2005. View Article : Google Scholar : PubMed/NCBI
|
|
2.
|
Bowerman B and Kurz T: Degrade to create:
developmental requirements for ubiquitin-mediated proteolysis
during early C. elegans embryogenesis. Development.
133:773–784. 2006. View Article : Google Scholar : PubMed/NCBI
|
|
3.
|
Naujokat C and Hoffmann S: Role and
function of the 20S proteasome in proliferation and
apoptosis. Lab Invest. 82:965–980. 2002.
|
|
4.
|
Collins GA and Transey WP: The proteasome:
a utility for transcription. Current Opin Genet Dev. 16:197–202.
2006. View Article : Google Scholar : PubMed/NCBI
|
|
5.
|
Tylor C and Jobin C: Ubiquitin protein
modification and signal transduction: Implications for inflammatory
bowel diseases. Inflamm Bowel Dis. 11:1097–1107. 2005. View Article : Google Scholar : PubMed/NCBI
|
|
6.
|
Asher G, Bercovich Z, Tsvetkov P, Shaul Y
and Kahana C: 20S proteasomal degradation of ornithine
decarboxylase is regulated by NQO1. Mol Cell. 17:645–655. 2005.
|
|
7.
|
Strehl B, Seifert U, Krüger E, Heink S,
Kuckelkorn U and Kloetzel PM: Interferon-γ, the functional
plasticity of the ubiquitin-proteasome system, and MHC class I
antigen processing. Immunol Rev. 207:19–30. 2005.
|
|
8.
|
Sakai N, Sawada MT and Sawada H:
Non-traditional roles of ubiquitin-proteasome system in
fertilization and gametogenesis. Int J Biochem Cell Biol.
36:776–784. 2004. View Article : Google Scholar : PubMed/NCBI
|
|
9.
|
Heinemeyer W, Kleinschmidt JA, Saidowsky
J, Escher C and Wolf DH: Proteinase yscE, the yeast
proteasome/multicatalytic-multifunctional proteinase: Mutant
unravels its function in stress proteolysis and uncovers its
necessity for cell survival. EMBO J. 10:555–562. 1991.
|
|
10.
|
Shinohara K, Tomioka M, Nakano H, Toné S,
Ito H and Kawashima S: Apoptosis induction resulting from
proteasome inhibition. Biochem J. 317:385–388. 1996.
|
|
11.
|
Delic J, Masdehors P, Omura S, Cosset JM,
Dumont J, Binet J and Magdelenat H: The proteasome inhibitor
lactacystin induces apoptosis and sensitizes chemo- and
radioresistant human lymphocytic leukemia lymphocytes to TNF-α
initiated apoptosis. Br J Cancer. 77:1103–1107. 1998.PubMed/NCBI
|
|
12.
|
Ma MH, Yang HH, Parker K, et al: The
proteasome inhibitor PS-341 markedly enhances sensitivity of
myeloma tumor cells to chemotherapeutic agents. Clin Cancer Res.
9:1136–1144. 2003.PubMed/NCBI
|
|
13.
|
Teicher BA: Newer cytotoxic agents:
attacking cancer broadly. Clin Cancer Res. 14:1610–1617. 2008.
View Article : Google Scholar : PubMed/NCBI
|
|
14.
|
Rajkumar SV, Richardson PG, Hideshima T
and Anderson KC: Proteasome inhibition as a novel therapeutic
target in human cancer. J Clin Oncol. 23:630–639. 2005. View Article : Google Scholar : PubMed/NCBI
|
|
15.
|
Obeng EA, Carlson LM, Gutman DM,
Harrington WJ Jr, Lee KP and Boise LH: Proteasome inhibitors induce
a terminal unfolded protein response in multiple myeloma cells.
Blood. 107:4907–4919. 2006. View Article : Google Scholar : PubMed/NCBI
|
|
16.
|
Velazquez OC, Lederer HM and Rombeau JL:
Butyrate and the colonocyte: production, absorption, metabolism,
and therapeutic implications. Adv Exp Med Biol. 427:123–134. 1997.
View Article : Google Scholar : PubMed/NCBI
|
|
17.
|
Macfarlane GT and Gibson GR:
Microbiological aspects of the production of short-chain fatty
acids in the large bowel. Physiological and Clinical Aspects of
Short-Chain Fatty Acids. Cambridge University Press; Cambridge: pp.
87–105. 1995
|
|
18.
|
Pouillart PR: Role of butyric acid and its
derivatives in the treatment of colorectal cancer and
hemoglobinopathies. Life Sci. 63:1739–1760. 1998. View Article : Google Scholar : PubMed/NCBI
|
|
19.
|
Kruth J, Defer N and Tichonicky L:
Molecular and cellular action of butyrate. C R Seances Soc Biol
Fil. 186:12–25. 1992.
|
|
20.
|
Velazquez OC and Rombeau JL: Butyrate:
potential role in colon cancer prevention and treatment. Adv Exp
Med Biol. 427:169–181. 1997. View Article : Google Scholar : PubMed/NCBI
|
|
21.
|
Abaza MSI, Bahman A and Al-Attiyah R:
Roscovitine synergizes with conventional chemotherapeutic drugs to
induce efficient apoptosis of human colorectal cancer cells. World
J Gasteroenterol. 14:5162–5175. 2008. View Article : Google Scholar
|
|
22.
|
Lam PK, To EW, Chan ES, Liew CT, Lung IW
and King WK: In vitro modulation of head and neck cell
growth by human recombinant interferon α and 13-cis-retinoic acid.
Br J Biomed Sci. 58:226–229. 2001.
|
|
23.
|
Abaza MSI, Al-Saffar AM, Al-Sawan SM and
Al-Attiyah R: c-myc antisense oligonucleotides sensitize
human colorectal cancer cells to chemotherapeutic drugs. Tumor
Biol. 29:287–303. 2008. View Article : Google Scholar
|
|
24.
|
Fan XM, Wong BC, Wang WP, et al:
Inhibition of proteasome function induced apoptosis in gastric
cancer. Int J Cancer. 93:481–488. 2001. View Article : Google Scholar : PubMed/NCBI
|
|
25.
|
Yang J, Liu X, Bhalla K, Kim CN, Ibrado
AM, Cai J, Peng T, Jones DP and Wang X: Prevention of apoptosis by
Bcl-2: release of cytochrome c from mitochondria blocked.
Science. 275:1129–1132. 1997. View Article : Google Scholar : PubMed/NCBI
|
|
26.
|
Wilson MR: Apoptosis: unmasking the
executioner. Cell Death Differ. 5:646–652. 1998. View Article : Google Scholar : PubMed/NCBI
|
|
27.
|
Green DR and Reed JC: Mitochondria and
apoptosis. Science. 281:1309–1312. 1998. View Article : Google Scholar : PubMed/NCBI
|
|
28.
|
Schendel SL, Montal M and Reed JC: Bcl-2
family proteins as ion-channels. Cell Death Diff. 5:372–380. 1998.
View Article : Google Scholar : PubMed/NCBI
|
|
29.
|
Lee S, Christakos S and Small MB:
Apoptosis and signal transduction: clues to a molecular mechanisms.
Curr Opin Cell Biol. 5:286–289. 1993. View Article : Google Scholar : PubMed/NCBI
|
|
30.
|
Lopes UG, Erhardt P, Yao R and Cooper GM:
p53-dependent induction of apoptosis by proteasome inhibitors. J
Biol Chem. 272:12893–12896. 1997. View Article : Google Scholar : PubMed/NCBI
|
|
31.
|
Blagosklonny MV, Wu GS, Omura S and
El-Deriry WS: Proteasome-dependent regulation of
p21Waf1/Cip1 expression. Biochem Biophys Res Commun.
227:564–569. 1996. View Article : Google Scholar : PubMed/NCBI
|
|
32.
|
Pagano M, Tam SW, Theodoras AM,
Beer-Romero P, Del Sal G, Chau V, Yew PR, et al: Role of the
ubiquitin-proteasome pathway in regulating abundance of the
cyclin-dependent kinase inhibitor p27. Science. 269:682–685. 1995.
View Article : Google Scholar : PubMed/NCBI
|
|
33.
|
Orlowski RZ: The role of the
ubiquitin-proteasome pathway in apoptosis. Cell Death Diff.
6:303–313. 1999. View Article : Google Scholar : PubMed/NCBI
|
|
34.
|
Finucane DM, Wetzel-Bossy E, Waterhouse
NJ, Cotter TG and Green DR: Bax-induced caspase activation and
apoptosis via cytochrome c release from mitochondria is
inhibitable by Bcl-XL. J Biol Chem. 274:2225–2233. 1999. View Article : Google Scholar : PubMed/NCBI
|
|
35.
|
Ciechanover A: Proteolysis from the
lysosome to ubiquitin and the proteasome. Nat Rev Mol Cell Biol.
6:79–87. 2005. View Article : Google Scholar : PubMed/NCBI
|
|
36.
|
Admas J: The proteasome: a suitable
antineoplastic target. Nat Rev Cancer. 4:349–360. 2004. View Article : Google Scholar : PubMed/NCBI
|
|
37.
|
Richardson PG, Sonneveld P, Schuster MW,
et al: Bortezomib or high-dose dexamethsome for relapsed multiple
myeloma. N Engl J Med. 352:2487–2498. 2005. View Article : Google Scholar : PubMed/NCBI
|
|
38.
|
Goy A, Younes A, McLaughlin P, et al:
Phase II study of proteasome inhibitor bortezomib in relapsed or
refractory B-cell non-Hodgkin’s lymphoma. J Clin Oncol. 23:667–675.
2005.
|
|
39.
|
Hacihanefioglu A, Tarkun P and Gonullu E:
Acute severe cardiac failure in a myeloma patient due to proteasome
inhibitor bortezomib. Int J Hematol. 88:219–222. 2008. View Article : Google Scholar : PubMed/NCBI
|
|
40.
|
Enrico O, Gabriele B, Nadia C, et al:
Unexpected cardiotoxicity in haematological bortezomib-treated
patients. Br J Haematol. 138:396–397. 2007. View Article : Google Scholar : PubMed/NCBI
|
|
41.
|
Richardson PG, Briemberg H, Jagannath S,
et al: Frequency, characteristics, and reversibility of peripheral
neuropathy during treatment of advanced multiple myeloma with
bortezomib. J Clin Oncol. 24:3113–3120. 2006. View Article : Google Scholar : PubMed/NCBI
|
|
42.
|
Lonial S, Waller EK, Richardson PG, et al:
Risk factors and kinetics of thrombocytopenia associated with
bortezomib for relapsed, refractory multiple myeloma. Blood.
106:3777–3784. 2005. View Article : Google Scholar : PubMed/NCBI
|
|
43.
|
Papandreou CN, Daliani DD, Nix D, et al:
Phase I trial of the proteasome inhibitor bortezomib in patients
with advanced solid tumors with observations in
androgen-independent prostate cancer. J Clin Oncol. 22:2108–2121.
2004. View Article : Google Scholar : PubMed/NCBI
|
|
44.
|
McConkey D and Zhu K: Mechanisms of
proteasome inhibitor action and resistance in cancer. Drug Resist
Updates. 11:164–179. 2008. View Article : Google Scholar : PubMed/NCBI
|
|
45.
|
Andrews PA and Howell SB: Cellular
pharmacology of cisplatin: perspectives on mechanisms of acquired
resistance. Cancer Cell. 2:35–43. 1990.PubMed/NCBI
|
|
46.
|
Miller AA, Kurschel E, Osieka P and
Schmidt CG: Clinical pharmacology of sodium butyrate in patients
with acute leukemia. Eur J Cancer Clin Oncol. 23:1283–1287. 1987.
View Article : Google Scholar : PubMed/NCBI
|
|
47.
|
Giuliano M, Lauricella M, Calvaruso G,
Carabillo M, Emanuele S, Vento R and Tesoriere G: The apoptotic
effects and synergistic interaction of sodium butytrate and MG132
in human retinoblastoma Y79 cells. Cancer Res. 59:5586–5595.
1999.PubMed/NCBI
|
|
48.
|
Kim OH, Lim JH, Woo KJ, Kim YH, Jin IN,
Han ST, Park JW and Kwon TK: Influence of p53 and
p21waf1 expression on G2/M phase arrest of
colorectal carcinoma HCT116 cells to proteasome inhibitors. Int J
Oncol. 24:935–941. 2004.PubMed/NCBI
|
|
49.
|
Wu WK, Sung JY, Wu YC, Li ZJ, Yu L and Cho
CH: Bone morphogenetic protein signaling is required for the
anti-mitogenic effect of the proteasome inhibitor MG-132 on colon
cancer cells. Br J Pharmacol. 154:632–638. 2008. View Article : Google Scholar : PubMed/NCBI
|
|
50.
|
Denlinger CE, Keller MD, Mayo MW, Broad RM
and Jones DR: Combined proteasome and histone deacetylase
inhibition in non-small cell lung cancer. J Thorac Cardiovasc Surg.
127:1087–1086. 2004. View Article : Google Scholar : PubMed/NCBI
|
|
51.
|
Abramova M, Pospelova TV, Nikulenkov FP,
Hollander CM, Fornace AJ Jr and Pospelov VA: G1/S arrest
induced by deacetylase inhibitor sodium butyrate in
E1A+Ras-transformed cells is mediated through down-regulation of
E2F activity and stabilization of β-catenin. J Biol Chem.
281:21040–21051. 2006.
|
|
52.
|
Lauricella M, Calvaruso G, Giuliano M,
Carabillo M, Emanuele S and Vento R: Synergistic cytotoxic
interactions between butyrate, MG132 and camptothecin in human
retinoblastoma Y79 cells. Tumor Biol. 21:337–348. 2000. View Article : Google Scholar : PubMed/NCBI
|
|
53.
|
Kitagawa H, Tani E, Ikemoto H, Ozaki I,
Nakano A and Omura S: Proteasome inhibitors induce
mitochondria-independent apoptosis in human glioma cells. FEBS
Lett. 443:181–186. 1999. View Article : Google Scholar : PubMed/NCBI
|
|
54.
|
Katayose Y, Kim M, Rakkar ANS, Li Z, Cowan
KH and Seth P: Promoting apoptosis: a novel activity associated
with the cyclin-dependent kinase inhibitor p27. Cancer Res.
57:5441–5446. 1997.PubMed/NCBI
|
|
55.
|
Timmerbeul I, Garrett-Engele CM, Kossatz
U, et al: Testing the importance of p27 degradation by the SCFskp2
pathway in murine models of lung and colon cancer. Proc Natl Acad
Sci USA. 103:14009–14014. 2006. View Article : Google Scholar : PubMed/NCBI
|
|
56.
|
Pandit B and Gartel AL: New potential
anti-cancer agents synergize with bortezomib and ABT-737 against
prostate cancer. Prostate. 70:825–833. 2010.PubMed/NCBI
|
|
57.
|
Chauhan D, Singh AV, Ciccarelli B,
Richardson PG, Palladino MA and Anderson KC: Combination of novel
proteasome inhibitor NPI-5552 and lenalidomide trigger in
vitro and in vivo synergistic cytotoxicity in multiple
myeloma. Blood. 115:834–845. 2009.PubMed/NCBI
|
|
58.
|
Matondo M, Bousquet-Dubouch MP, Gallay N,
et al: Proteasome inhibitor-induced apoptosis in acute myeloid
leukemia: A correlation with proteasome status. Leuk Res.
34:498–506. 2009. View Article : Google Scholar : PubMed/NCBI
|
|
59.
|
Yuan JY, Shaham S, Ledoux S, Ellis HM and
Horvitz HR: The C. elegans cell death gene ced-3 encodes a
protein similar to mammalian interleukin-1 beta-converting enzyme.
Cell. 75:641–652. 1993.
|
|
60.
|
Nicholson DW and Thornberry NA: Caspases:
killer proteases. Trends Biochem Sci. 22:299–306. 1997. View Article : Google Scholar
|
|
61.
|
Talanian RV, Quinlan C, Trautz S, et al:
Substrate specificities of caspase family proteases. J Biol Chem.
272:9677–9682. 1997. View Article : Google Scholar : PubMed/NCBI
|
|
62.
|
Fuchs E and Weber K: Intermediate
filaments: structure, dynamics, function, and disease. Ann Rev
Biochem. 63:345–382. 1994. View Article : Google Scholar : PubMed/NCBI
|
|
63.
|
Germain M, Affar EB, D’Amours D, Dixit VM,
Salvesen GS and Poirier GG: Cleavage of auto-modified
poly(ADP-ribose)polymerase during apoptosis. Evidence for
involvement of caspase-7. J Biol Chem. 274:28379–28384. 1999.
View Article : Google Scholar : PubMed/NCBI
|
|
64.
|
Cuvillier O, Rosenthal DS, Smulson ME and
Spiegel S: Shingosine-1-phosphate inhibits activation of caspases
that cleave poly(ADP-ribose) polymerase and lamins during Fas- and
ceramide-mediated apoptosis in Jurkat lymphocytes. J Biol Chem.
273:29010–29016. 1998. View Article : Google Scholar
|
|
65.
|
Reed JC: Bcl-2 and the regulation of
programmed cell death. J Cell Biol. 124:1–6. 1994. View Article : Google Scholar : PubMed/NCBI
|
|
66.
|
Liu X, Kim CN, Yang J, Jemmerson R and
Wang X: Induction of apoptotic program in cell-free extracts:
requirement for dATP and cytochrome c. Cell. 96:147–157.
1999.PubMed/NCBI
|
|
67.
|
Chandra J, Niemer I, Gilbreath J, et al:
Proteasome inhibitors induce apoptosis in glucocorticoid-resistant
chronic lymphocytic leukemic lymphocytes. Blood. 92:4220–4229.
1998.PubMed/NCBI
|
|
68.
|
Chen YR, Wang X, Templeton D, Davis RJ and
Tan TH: The role of c-jun N-terminal kinase (JNK) in apoptosis
induced by ultraviolet C and λ radiation. J Biol Chem. 31929–31936.
1996.
|
|
69.
|
Williams SA and McConkey DJ: The
proteasome inhibitor bortezomib stabilizes a novel active form of
p53 in human LNCaP-Pro5 prostate cancer cells. Cancer Res.
63:7338–7344. 2003.PubMed/NCBI
|
|
70.
|
Medina V, Edmonds B, Young GP, James R,
Appleton S and Zalewski PD: Induction of caspase-3 protease
activity and apoptosis by butyrate and trichostatin-A (inhibitors
of histone deacetylase): dependence on protein synthesis and
synergy with a mitochondrial/cytochrome c-dependent pathway.
Cancer Res. 57:3697–3707. 1997.PubMed/NCBI
|
|
71.
|
Lara PN, Davies AM, Mack PC, Mortenson MM,
Bold RJ, Gumerlock PH and Gandara DR: Proteasome inhibition with
PS-341 (bortezomib) in lung cancer therapy. Sem Oncol. 31:40–46.
2004. View Article : Google Scholar : PubMed/NCBI
|
|
72.
|
Zhu H, Zhang L, Dong F, et al: Bik/NBK
accumulation correlates with apoptosis-induction by bortezomib
(PS-341, Velcade) and other proteasome inhibitors. Oncogene.
24:4993–4999. 2005. View Article : Google Scholar : PubMed/NCBI
|
|
73.
|
Goldstein JC, Waterhouse NJ, Juin P, Evan
GI and Green DR: The coordinate release of cytochrome c during
apoptosis is rapid, complete and kinetically invariant. Nat Cell
Biol. 2:156–162. 2000. View Article : Google Scholar : PubMed/NCBI
|
|
74.
|
Daly K and Shirazi-Beechey SP: Microarray
analysis of butyrate-regulated genes in colonic epithelial cells.
DNA Cell Biol. 25:49–62. 2006. View Article : Google Scholar : PubMed/NCBI
|
|
75.
|
Davie JR: Inhibition of histone
deacetylase activity by butyrate. J Nutr. 133(Suppl 7):
2485s–2493s. 2003.PubMed/NCBI
|