Introduction
Cervical cancer (CC) is an extremely common
malignant tumor of the female reproductive system, and the
prevalence of CC is the second highest in the whole category of
female malignant tumors (1,2). Data on global cancer epidemics from
the International Cancer Research Agency have demonstrated that the
year 2020 witnessed almost 600,000 CC cases and 34,000 deaths
resulted from this disease (3,4).
Currently applied vaccines, which are essentially focusing on
prophylaxis, cannot combat the immense numbers of patients with CC
worldwide (5). Patients with CC
present no notable differences on clinical outcomes. Therefore, it
is difficult to predict the disease at the early stage. As a result
of the heterogeneity of CC, the successful development of
individual-based treatments is a difficult task (6). Therefore, the exploration of potential
and effective biomarkers which may be used to diagnose and predict
the prognosis of patients with CC is of utmost urgency (7).
The aberrant DNA hypermethylation of CpG island
(CGI) promoters (promoter hypermethylation) occurs in numerous
types of cancer (8). CGIs are
contiguous groups of dinucleotides mainly located at the 5' end of
a gene and are characterized by a high guanine-cytosine (GC)
content. CGI hypermethylation has been recognized as one of the key
features of cancer (9). The
increased DNA methylase activity in tumor cells or the destruction
of CGI local protection mechanisms leads to genomic instability,
transposon reactivation, chromosome structural changes and the
activation of cancer-related genes, etc. (10,11).
DNA hypermethylation causes the silencing of cancer-related genes,
such as genes related to apoptosis, cell cycle regulation and
angiogenesis (12); this promotes
the incidence and development of cancer. CGIs in the promoter
region of genes are under abnormal methylation, which induces the
transcriptional silencing of tumor suppressor genes and
carcinogenesis (10,13). It has been reported that DNA
methylation occurs in 70-100% of CC cases, as well as in 30-80% of
cervical precancerous lesions (14). To date, >100 genes, which have
been found to be methylated or silenced in CC, may be applied as
latent biological markers for the prediction of CC (15).
Methylation-driven genes are directly responsible
for carcinogenesis and are closely related to the transformation,
development and invasion of cancer (16). DNA methylation alterations of driver
genes can alter the expression of cognate genes, interacting genes
and genes in the same downstream pathways, subsequently causing
inference in cancer-related pathways and inducing the cancer
phenotype. The downregulated expression of SFRP1 by promoter
hypermethylation has been previously demonstrated to result in the
constitutive activation of the Wnt pathway, which in turn
contributes to colorectal cancer malignancy (17). Studies on prostate cancer have
demonstrated that the hypomethylation of promoter regions of the
Wnt5b gene upregulate gene expression, eventually contributing to
prostate cancer progression (18,19).
Guo et al (20) reported
that the detection of the methylation frequencies of SLC19A1, CREB
and CYLD could be used to predict the recurrence of colorectal
cancer. To date, several studies have been conducted to identify
DNA methylation-driven genes using the MethylMix algorithm and The
Cancer Genome Atlas (TCGA) database (21-23).
However, only a limited number of studies have focused on assessing
methylation-driven genes in CC. A previous study merely attained
the information on mRNAs based on methylation, which can predict
the prognosis of CC (24).
The present study identified hypomethylated and
hypermethylated genes associated with specific diseases in order to
obtain CC-specific long-coding RNA (lncRNA) sequences driven by
methylation, and that may be used to predict the diagnosis and
prognosis of patients with CC. These findings may provide new
insight into the prediction of the prognosis of patients with CC,
using the combination of methylation-driven lncRNAs and mRNAs.
Materials and methods
Data retrieval and integrative
analysis
RNA-sequencing data from 310 cases (255 cervical
squamous cell carcinoma, 31 cervical adenocarcinoma, 17 cervical
mucinous cystic neoplasms, 4 cervical intraepithelial neoplasia and
3 normal cervical tissues), DNA methylation data from 313 cases
(257 cervical squamous, 32 cervical adenocarcinoma, 17 cervical
mucinous cystic neoplasms, 4 cervical intraepithelial neoplasia and
3 normal cervical tissues) were obtained from TCGA database
(https://portal.gdc.cancer.gov/). The
acquisition of DNA methylation data was implemented on the Illumina
Infinium Human Methylation 450 platform. Above all, all retrieved
data were analyzed and normalized to obtain access to
differentially expressed genes (DEGs) and differentially methylated
genes (DMGs), and the analytical procedures were performed on the
Limma package of R software (version 3.6.2, Mathsoft, Inc.). The
DEGs and DMGs were then integrated for analysis using R-software
based on the MethylMix algorithm (version 3.6.2, Mathsoft, Inc.).
The missing values and the matched intersecting methylation DNA
data were filtered with the RNA expression data. A total of 306
samples of patients with CC and three samples of non-CC patients
were recruited for the next calculation step. Subsequently, the
correlation between the methylation level and gene expression was
calculated. The Wilcoxon rank sum test to calculate the differences
in methylation between the CC patient samples and adjacent non-CC
patient samples. Pearson's correlation analysis was then used to
determine the correlation between the methylation level and gene
expression. Finally, the final output of MethyMix included genes
with both transcriptional predictability and a differential
methylation status. Finally, mRNAs and lncRNAs driven by
methylation were acquired.
Functional enrichment analysis on
methylation-driven genes
In addition to an open source platform (https://david.ncifcrf.gov/), the Database for
Annotation, Visualization and Integrated Discovery (DAVID) was used
to explore the functions of methylation-driven mRNAs. Gene Ontology
(GO) analysis of methylation-driven genes were visualized by
‘GOplot’ R package. Subsequently, the Kyoto Encyclopedia of Genes
and Genomes (KEGG) analysis was also used to perform the pathway
enrichment analysis for those DNA methylation-driven genes through
KOBAS 3.0 (http://kobas.cbi.pku.edu.cn). A value of P<0.05 was
set as the cut-off standard.
Construction of prognostic
signatures
Univariate Cox regression analysis was conducted to
determine the association between the expression of DNA
methylation-driven genes and the prognosis of patients with CC.
Genes with a P-value <0.05 were regarded as prognostic
methylation-driven genes and were subsequently fitted into the
multivariate Cox regression analysis. A DNA methylation-driven
gene-based prediction model was constructed using the linear
combination of the expression levels of methylation-driven genes
with coefficients (β) calculated from multivariate Cox regression
as the weights. The risk score for each patient was calculated
based on the following risk score formula: Risk score=expression of
gene1 x β1 + expression of gene2 x β2 + …expression of genen x βn.
Subsequently, patients were divided into the high- and low-risk
groups by setting the median value of risk scores as the cut-off
value. The overall survival (OS) of these two groups was calculated
using the Kaplan-Meier method with the log-rank test. Receiver
operating characteristic (ROC) curves were used to assess the
predictive performance of the prognostic model and area under the
curve (AUC) values were calculated. The expression patterns of DNA
methylation-driven genes in this prognostic model were visualized
using the ‘pheatmap’ R package (R software3.6.2, Mathsoft,
Inc.).
Survival analysis
In order to perform an in-depth assessment of
methylation-driven genes associated with prognosis and survival,
the clinical data of CC from TCGA were utilized to analyze the
survival of the driver genes and related methylated sites. The
construction of Kaplan-Meier curves was conducted to identify the
association between methylation-driven genes and the survival rate
of patients with CC. The prognosis of patients with CC was
predicted by identifying latent methylation-driven mRNAs and
methylation-driven lncRNAs.
Bisulfite sequencing for the
determination of Fms related receptor tyrosine kinase 1 (FLT1)
methylation
The methylation status of the FLT1 promoter was
determined using bisulfite sequencing. DNA was extracted and
digested with EcoRV (Takara Bio, Inc.). The EpiTect Bisulite Kit
(Qiagen, Inc.) was used to perform the bisulfite sequencing
analysis with the EpiTect Bisulite kit (Qiagen, Inc.) according to
the manufacturer's instructions. The transformed DNA was then
PCR-amplified using the Takara Taq kit (Takara Bio, Inc.). The
sequences of the primers used are presented in Table SI. The KK8504 kit (Kapa Biosystems,
Inc.) was used for DNA library construction for each sample and for
sequencing on Nova-seq6000 (Illumina, Inc.). A total of 12 clinical
samples, including 10 cervical cancer specimens and 2 normal
cervical specimens were randomly selected for this FLT1 methylation
assay. The clinical features of the 10 cervical cancer samples are
listed in Table SII. Ethical
approval was obtained from the Ethics Committee of the Affiliated
Hospital of Qingdao University. Two cervical cancer tissue samples
were excluded due to quality problems. Finally, four squamous cell
carcinoma, four adenocarcinoma and two normal cervical tissues were
collected for detection.
Immunohistochemical analysis
A total of 25 paraffin-embedded CC tissue specimens
and 15 paraffin-embedded normal cervical epithelium tissue
specimens were collected from The Affiliated Hospital of Qingdao
University. The present study was approved by the Institutional
Review Board of the Affiliated Hospital of Qingdao University
Health Science Center Ethics Committee (approval no. QYFY WZLL
25964). All patients or their patents/guardians in the present
study provided written informed consent for participation in the
study. The clinical parameters of the 25 patients with CC are
presented in Table SII. CC tissue
specimens embedded in paraffin were cut into 3- to 5-µm-thick
serial sections and fixed onto slides. The sections were then
deparaffinized in xylene twice for 10 min, and rehydrated through
graded ethanol to distilled water. After conducting antigen
retrieval with a microwave for 5 min at 95˚C, endogenous peroxidase
activity and non-specific binding activity were blocked with 3%
hydrogen peroxide and 5% non-fat dried milk, respectively.
Subsequently, the sections were incubated with anti-human FLT1
(AF321, R&D Systems, Inc.) and PLEKHG6 antibodies (PA5-59578,
Thermo Fisher Scientific, Inc.) overnight at 4˚C in a humidified
chamber. The primary antibodies were replaced by immunoglobulin
(Rabbit Immunoglobulin Fraction, #X0936; Agilent Technologies,
Inc.) for the negative control. The following day, sections were
incubated with horseradish peroxidase-labeled anti-goat IgG
secondary antibody (CST Inc., Danvers, MA, USA.) at room
temperature for 30 min. Finally, slides were visualized by
3,3-diaminobenzidine (DAB) staining.
Statistical analysis
The R statistical package (R version 3.6.2) and SPSS
23.0 software (SPSS, Inc.) were used for statistical analysis. The
Student's t-test was used for comparing the methylation status of
FLT1 between the groups.
Results
Identification of methylation-driven
mRNAs and lncRNAs in CC
DNA methylation data were extracted from 309
cervical cancer specimens, including 3 normal samples and 306 tumor
samples. Using the cut-off criteria of a false discovery rate (FDR)
<0.05 and logFC >1, a total of 2,916 DEGs were screened for
further analysis. The gene expression data and DNA methylation data
for the 2,916 DEGs were included in the MethylMix analysis with a
screening criteria set as |logFC|>1, P<0.05 and Cor <-0.3.
In total, 200 mRNAs and 38 lncRNAs were identified for DNA
methylation in virtue of the MethylMix criteria. The
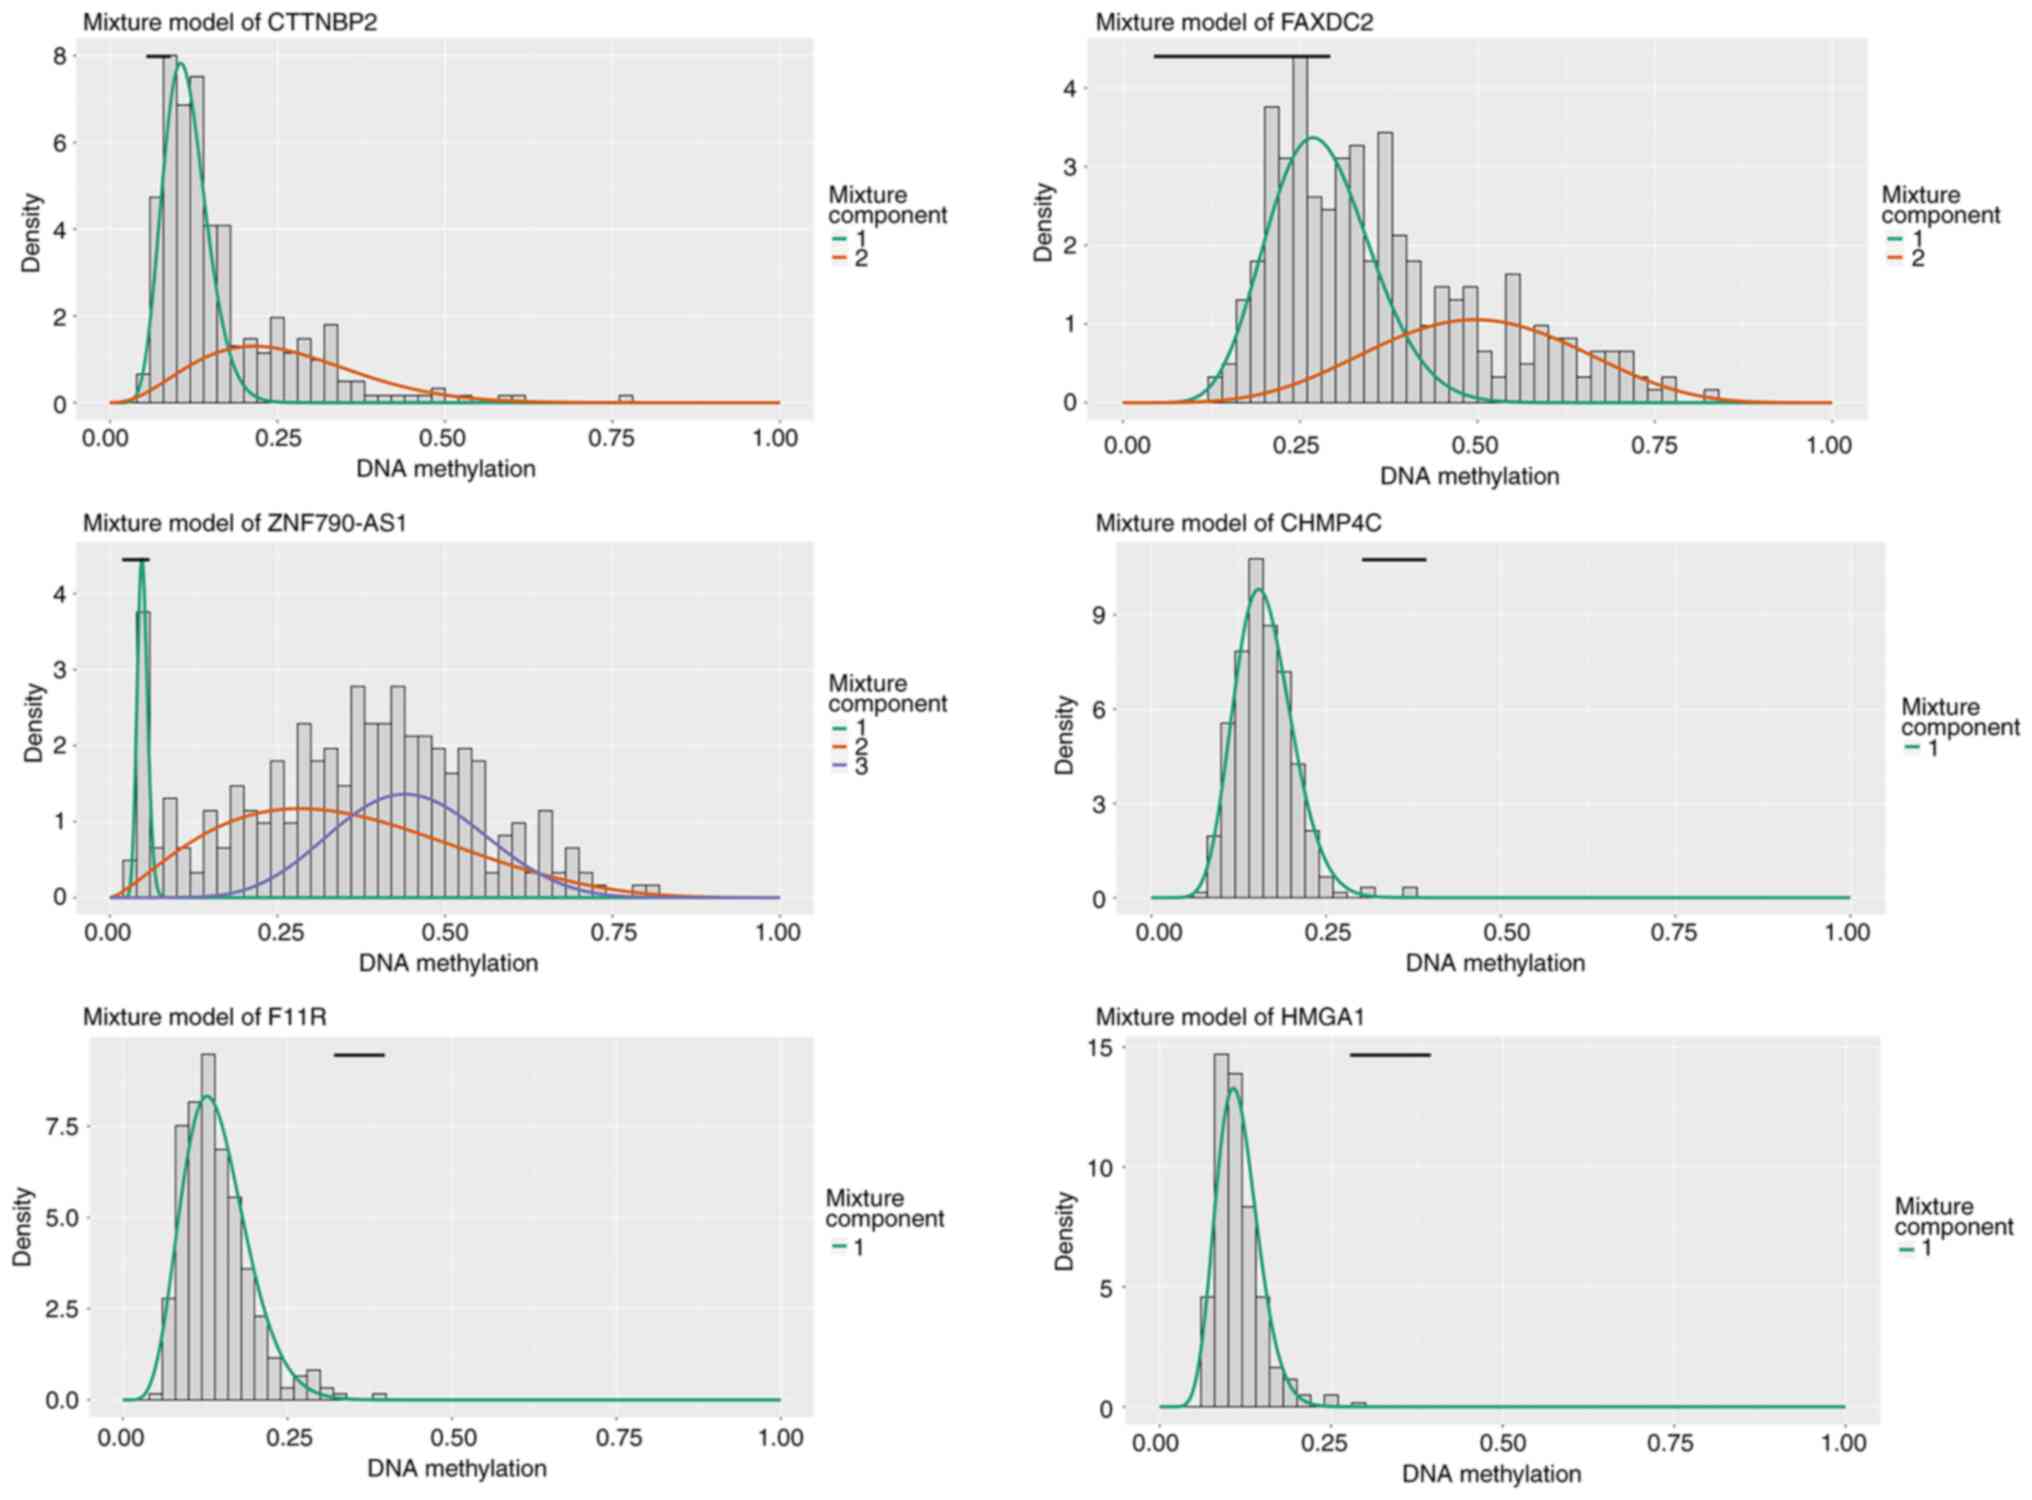
methylation-driven mRNAs and lncRNAs are listed in Tables I and II, respectively. As shown in Fig. 1, the distributed area of the
methylation degree indicated that CTTNBP2, FAXDC2, ZNF790-AS1,
CHMP4C, F11R and HMGA1 were hypermethylated in patients with CC and
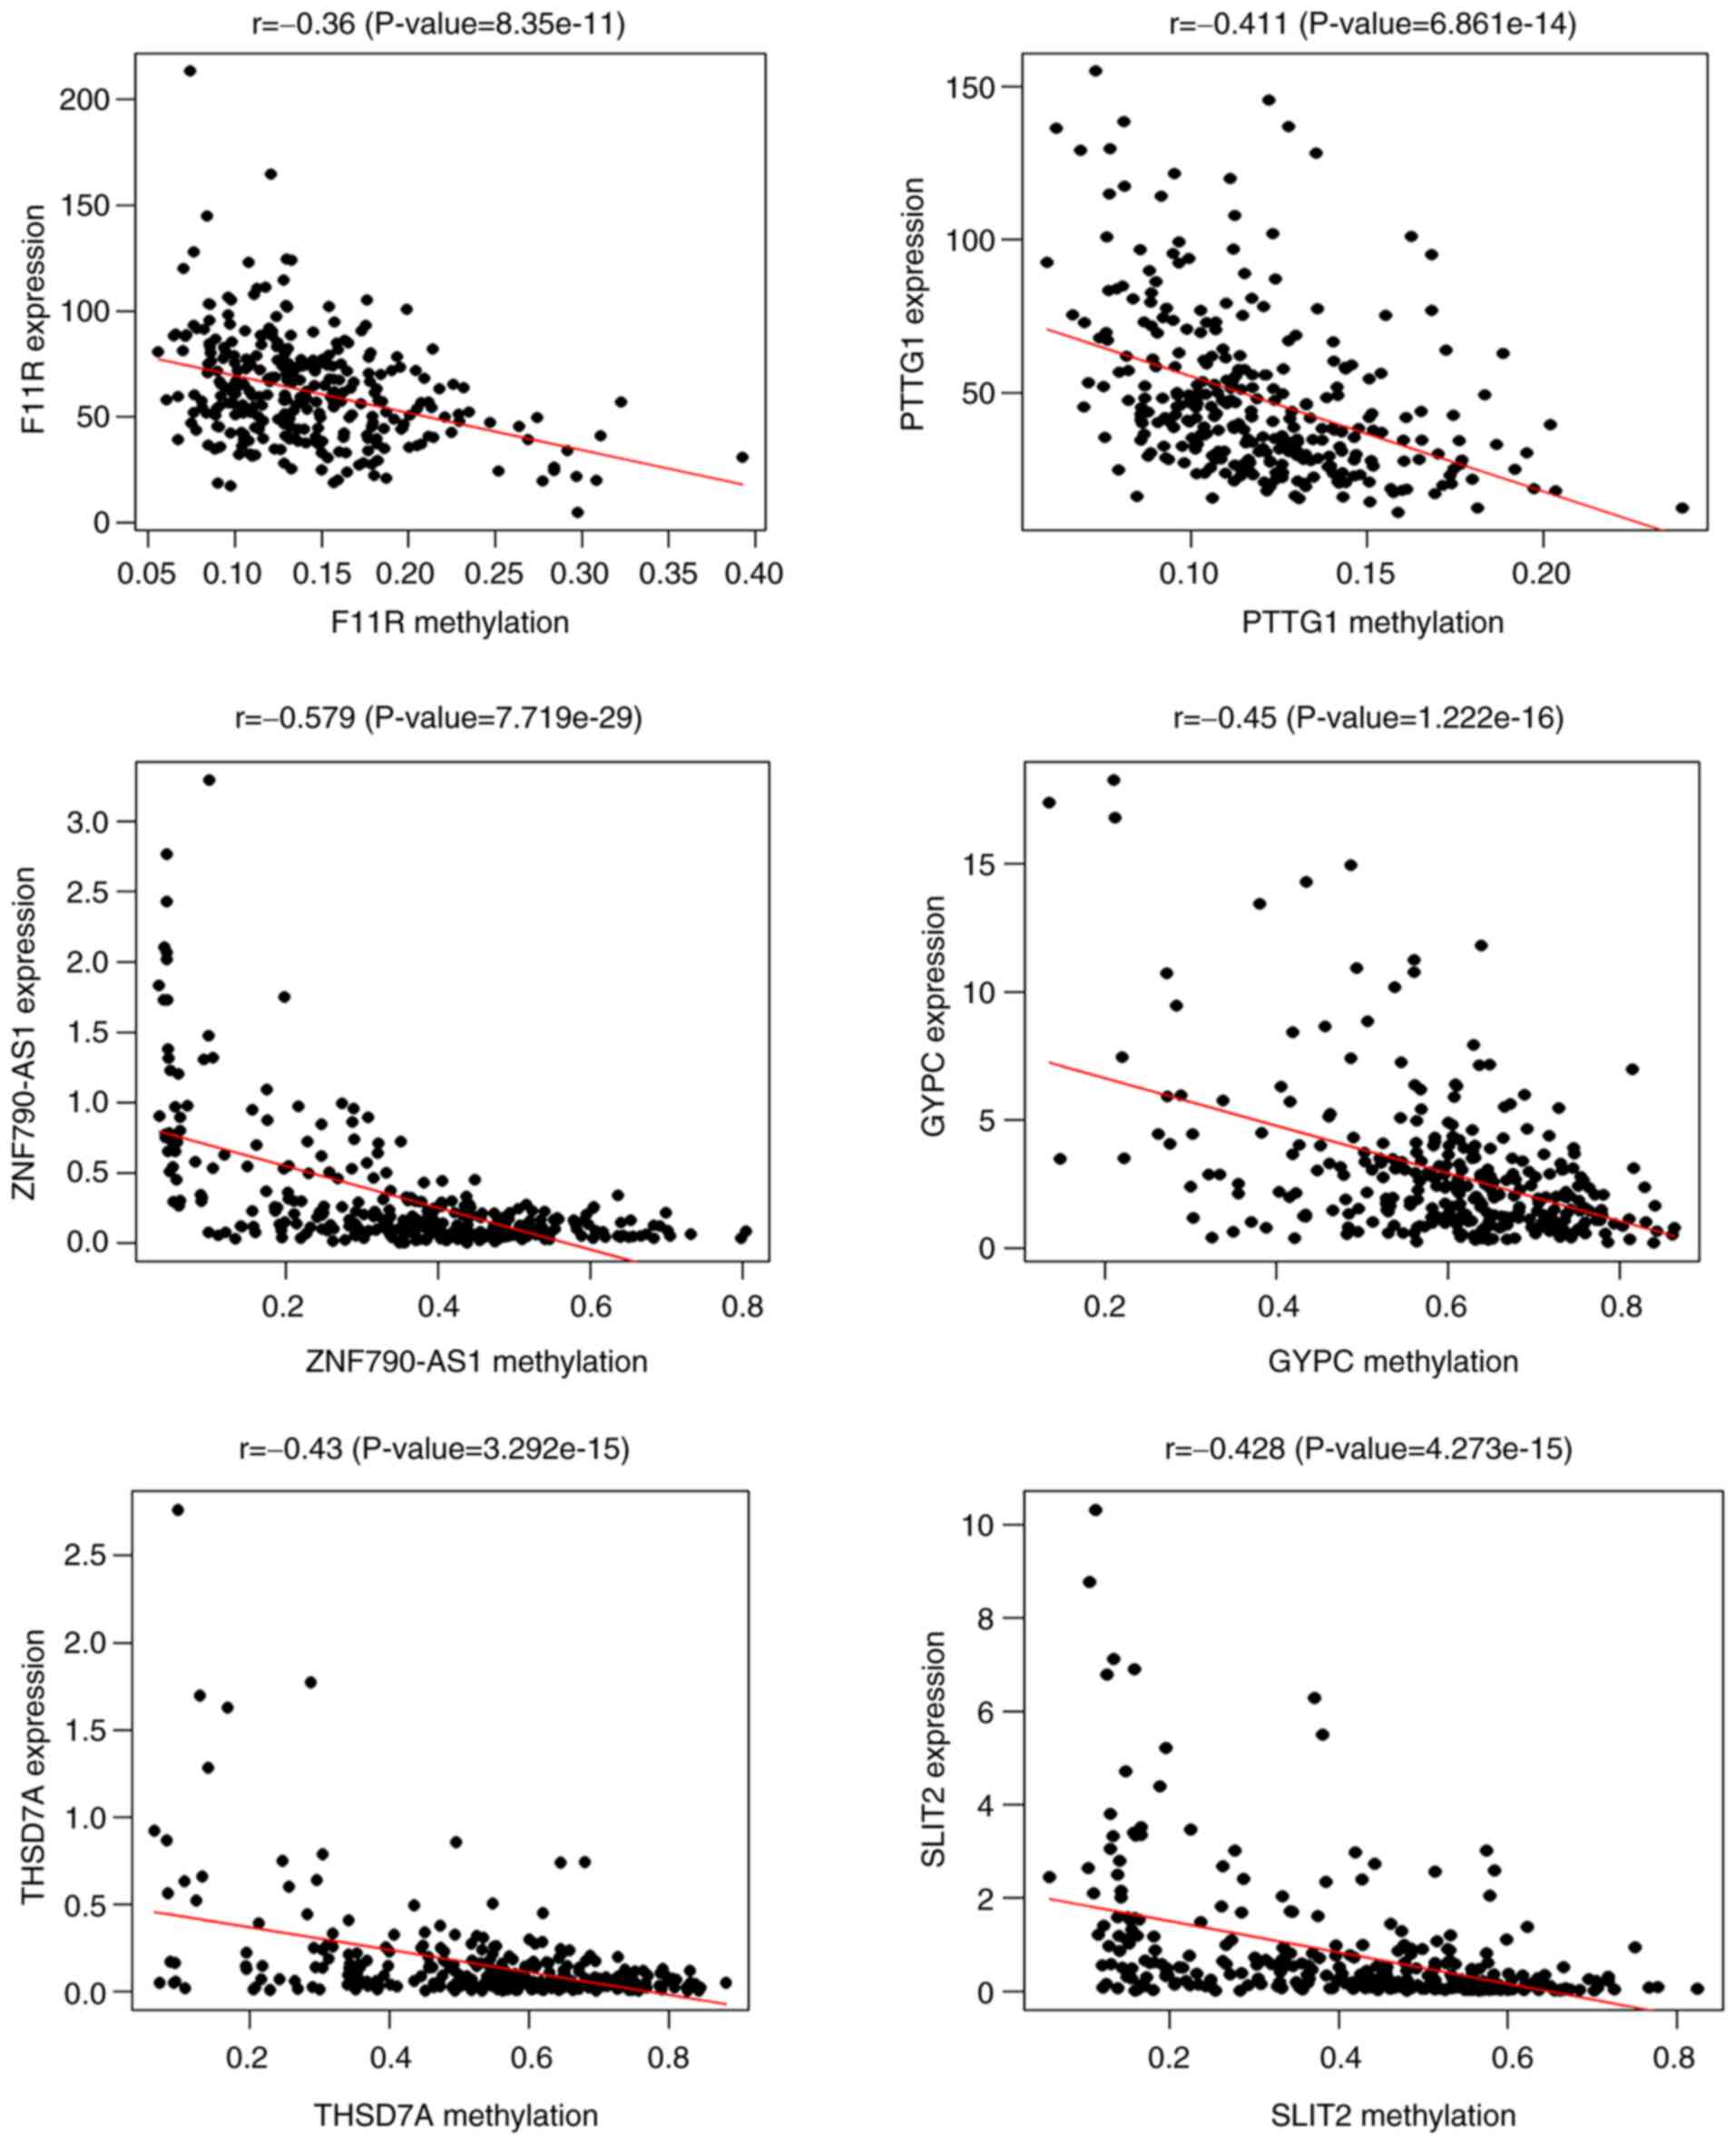
hypomethylated in non-CC patients. Pearson's correlation analysis
revealed a negative correlation between the gene expression and
methylation of F11R, PTTG1, ZNF790-AS1, GYPC, THSD7A, and SLIT2
(Fig. 2). The expression patterns
and methylation values of the methylation-driven genes are
illustrated as a heatmap in Fig.
3.
 | Table IMethylation-driven mRNAs. |
Table I
Methylation-driven mRNAs.
| Gene | Normal mean | Tumor mean | logFC | P-value | FDR |
|---|
| OTX1 | 0.008609738 | 2.422484869 | 8.136302547 | 0.002907656 | 0.048976629 |
| HIST1H2AM | 0.01357165 | 1.050542267 | 6.274394268 | 0.002969844 | 0.048976629 |
| KREMEN2 | 0.025207773 | 5.182757296 | 7.683707338 | 0.002907656 | 0.048976629 |
| HIST1H2BH | 0.025716823 | 5.936443692 | 7.850742668 | 0.002907656 | 0.048976629 |
| POLQ | 0.03518915 | 3.045189881 | 6.435257713 | 0.002907656 | 0.048976629 |
| CLSPN | 0.03697982 | 3.388624708 | 6.517817854 | 0.002907656 | 0.048976629 |
| MCM10 | 0.052274933 | 4.303523361 | 6.363255173 | 0.002907656 | 0.048976629 |
| CCDC150 | 0.05328457 | 0.70413694 | 3.724066303 | 0.002969847 | 0.048976629 |
| AL109811.2 | 0.058717813 | 1.204383547 | 4.358352852 | 0.002969847 | 0.048976629 |
| ASPM | 0.06079877 | 5.853531897 | 6.589121431 | 0.002907656 | 0.048976629 |
| CKAP2L | 0.060848407 | 4.653990218 | 6.257104882 | 0.002907656 | 0.048976629 |
| E2F8 | 0.070134097 | 5.908846804 | 6.396616784 | 0.002907656 | 0.048976629 |
| E2F2 | 0.07500838 | 6.683604622 | 6.477430797 | 0.002907656 | 0.048976629 |
| KIF18B | 0.094850093 | 9.138667451 | 6.590190811 | 0.002907656 | 0.048976629 |
| HASPIN | 0.096249443 | 2.47958553 | 4.687176983 | 0.002969847 | 0.048976629 |
| HIST1H2AG | 0.115060643 | 1.913568162 | 4.055798945 | 0.002969847 | 0.048976629 |
| UHRF1 | 0.124969837 | 11.78907108 | 6.559726315 | 0.002907656 | 0.048976629 |
| TROAP | 0.147849247 | 11.56818612 | 6.289891966 | 0.002907656 | 0.048976629 |
| DLGAP5 | 0.153893317 | 12.06073375 | 6.292243291 | 0.002907656 | 0.048976629 |
| RAD54B | 0.162129053 | 1.128769995 | 2.799536996 | 0.002907656 | 0.048976629 |
| NEK2 | 0.17629113 | 13.32260506 | 6.239772511 | 0.002907656 | 0.048976629 |
| CENPE | 0.1779729 | 3.701522009 | 4.378389124 | 0.002969847 | 0.048976629 |
| PIF1 | 0.22515228 | 3.478096936 | 3.949325149 | 0.002969847 | 0.048976629 |
| KIF24 | 0.2599404 | 2.147583169 | 3.046461223 | 0.002907656 | 0.048976629 |
| DDIAS | 0.284714567 | 2.745727824 | 3.269600411 | 0.002969847 | 0.048976629 |
| ATAD5 | 0.291022067 | 2.476068676 | 3.088850875 | 0.002907656 | 0.048976629 |
| DNA2 | 0.296769 | 3.329539141 | 3.487910197 | 0.002969847 | 0.048976629 |
| ZNF296 | 0.303531533 | 4.707985191 | 3.955191474 | 0.002969847 | 0.048976629 |
| FAM83D | 0.304326433 | 23.02657124 | 6.241536143 | 0.002907656 | 0.048976629 |
| ECE2 | 0.383145467 | 3.429845882 | 3.16217961 | 0.002907656 | 0.048976629 |
| PARPBP | 0.384524433 | 3.276042714 | 3.09080699 | 0.002907656 | 0.048976629 |
| HELLS | 0.3898357 | 5.23057021 | 3.746030111 | 0.002969847 | 0.048976629 |
| SGO2 | 0.412476167 | 3.403119544 | 3.044475165 | 0.002969847 | 0.048976629 |
| FANCD2 | 0.435973233 | 4.350073 | 3.318728143 | 0.002907656 | 0.048976629 |
| RELT | 0.442929167 | 2.479509729 | 2.48490698 | 0.002969847 | 0.048976629 |
| MND1 | 0.504417033 | 6.33443716 | 3.650527537 | 0.002969847 | 0.048976629 |
| BRCA1 | 0.507887067 | 4.548310873 | 3.162751223 | 0.002969847 | 0.048976629 |
| C5orf34 | 0.5172911 | 2.765671281 | 2.418581417 | 0.002907656 | 0.048976629 |
| CENPO | 0.5524477 | 4.275784107 | 2.952279213 | 0.002907656 | 0.048976629 |
| MYBL2 | 0.552865033 | 58.36758471 | 6.72209623 | 0.002907656 | 0.048976629 |
| POLE2 | 0.654987567 | 6.006028095 | 3.196871798 | 0.002907656 | 0.048976629 |
| CENPL | 0.658509633 | 2.976383827 | 2.176284134 | 0.002907656 | 0.048976629 |
| MARVELD2 | 0.671502467 | 5.997847346 | 3.1589802 | 0.002969847 | 0.048976629 |
| CHEK1 | 0.735316333 | 5.703614173 | 2.955439456 | 0.002907656 | 0.048976629 |
| OSBPL3 | 0.741138933 | 6.655781915 | 3.166792243 | 0.002907656 | 0.048976629 |
| WDHD1 | 0.788465033 | 6.624031029 | 3.07059075 | 0.002969847 | 0.048976629 |
| CBX8 | 0.829757267 | 3.313400315 | 1.997551252 | 0.002969847 | 0.048976629 |
| TRAIP | 0.8313529 | 4.403457653 | 2.405103872 | 0.002969847 | 0.048976629 |
| MYO19 | 0.956252333 | 7.737194882 | 3.016347344 | 0.002907656 | 0.048976629 |
| AC145124.1 | 1.017866967 | 0.098647165 | -3.367127609 | 0.002896012 | 0.048976629 |
| NUP210 | 1.106373633 | 19.89151312 | 4.168242439 | 0.002969847 | 0.048976629 |
| RNU6-247P | 1.133219833 | 0.247219555 | -2.196562986 | 0.001125537 | 0.048976629 |
| AC134043.2 | 1.205617333 | 0.104221029 | -3.532053754 | 0.002969788 | 0.048976629 |
| MAP7 | 1.210302133 | 10.97342529 | 3.180574781 | 0.002969847 | 0.048976629 |
| BRI3BP | 1.226047 | 8.72528698 | 2.831188298 | 0.002907656 | 0.048976629 |
| KNSTRN | 1.267626333 | 7.984351493 | 2.655045698 | 0.002907656 | 0.048976629 |
| AC009806.1 | 1.285511 | 0.145998563 | -3.138315879 | 0.002925703 | 0.048976629 |
| POLE | 1.315502 | 6.201415209 | 2.236984045 | 0.002907656 | 0.048976629 |
| TMEM206 | 1.379000333 | 4.893858761 | 1.82734966 | 0.002969847 | 0.048976629 |
| AL133346.1 | 1.434255967 | 0.106993678 | -3.744705055 | 0.002644399 | 0.048976629 |
| ESRP1 | 1.443912813 | 29.74875038 | 4.364773531 | 0.002969847 | 0.048976629 |
| AC112715.1 | 1.4462248 | 0.118338606 | -3.611299114 | 0.002965719 | 0.048976629 |
| CHTF18 | 1.462383 | 9.24523781 | 2.660389225 | 0.002907656 | 0.048976629 |
| ECT2 | 1.4816846 | 22.15220232 | 3.90213985 | 0.002969847 | 0.048976629 |
| MAPK13 | 1.501844767 | 18.86749931 | 3.651095615 | 0.002969847 | 0.048976629 |
| RFTN2 | 1.595348667 | 0.31019602 | -2.362619679 | 0.002969847 | 0.048976629 |
| AC109309.1 | 1.602678533 | 0.104860342 | -3.933944014 | 0.001162976 | 0.048976629 |
| CHAF1B | 1.6720722 | 7.810766497 | 2.223826988 | 0.002969847 | 0.048976629 |
| ZWILCH | 1.708687667 | 8.741075 | 2.354922008 | 0.002907656 | 0.048976629 |
| CHEK2 | 1.774875333 | 6.630946745 | 1.901497175 | 0.002907656 | 0.048976629 |
| INTS7 | 1.820999 | 9.316283118 | 2.355024353 | 0.002907656 | 0.048976629 |
| SIRT7 | 1.844280333 | 6.782226856 | 1.878701077 | 0.002907656 | 0.048976629 |
| AL139339.1 | 1.938017667 | 0.125707253 | -3.946441924 | 0.002879369 | 0.048976629 |
| CHAF1A | 2.076047667 | 16.8995404 | 3.025072538 | 0.002907656 | 0.048976629 |
| RF00265 | 2.089666333 | 0.136408423 | -3.937267965 | 0.001504763 | 0.048976629 |
| NXT2 | 2.091489 | 8.301585023 | 1.988856406 | 0.002907656 | 0.048976629 |
| TMEM252 | 2.106628667 | 0.19583094 | -3.42725541 | 0.002418008 | 0.048976629 |
| DARS2 | 2.133191 | 11.35261951 | 2.411940173 | 0.002907656 | 0.048976629 |
| BAIAP2L1 | 2.15688 | 19.55399884 | 3.180445854 | 0.002969847 | 0.048976629 |
| ABCA9 | 2.19188 | 0.125320954 | -4.128469253 | 0.002907628 | 0.048976629 |
| AC027682.6 | 2.313769 | 0.252232545 | -3.197418496 | 0.002969817 | 0.048976629 |
| AC055874.1 | 2.3517578 | 0.117155321 | -4.327245109 | 0.000133275 | 0.048976629 |
| RNU5B-4P | 2.435468 | 0.157760404 | -3.94839197 | 0.001411833 | 0.048976629 |
| MIR497HG | 2.491191667 | 0.151214923 | -4.042163599 | 0.002969847 | 0.048976629 |
| LINC02310 | 2.498536333 | 0.084457297 | -4.886717316 | 0.001686668 | 0.048976629 |
| AJ011932.1 | 2.579065 | 0.105607893 | -4.61005856 | 0.002370969 | 0.048976629 |
| RF02204 | 2.585491 | 0.113003328 | -4.516001121 | 0.00023333 | 0.048976629 |
| LIG1 | 2.855578 | 17.84753708 | 2.643870302 | 0.002907656 | 0.048976629 |
| DSN1 | 3.161946 | 20.01669406 | 2.662319085 | 0.002907656 | 0.048976629 |
| TCF21 | 3.189872 | 0.085908038 | -5.214561602 | 0.002869776 | 0.048976629 |
| MCM2 | 3.466193333 | 52.52739823 | 3.921646096 | 0.002969847 | 0.048976629 |
| CACNB2 | 3.546071333 | 0.143111465 | -4.631010398 | 0.002907656 | 0.048976629 |
| MAP6 | 3.770149333 | 0.232398213 | -4.019950787 | 0.002969847 | 0.048976629 |
| STARD8 | 4.046868 | 0.579137356 | -2.80482833 | 0.002969847 | 0.048976629 |
| DNAJC18 | 4.105557 | 0.851534115 | -2.269441731 | 0.002969847 | 0.048976629 |
| ABCA8 | 4.243906 | 0.104108682 | -5.34923041 | 0.002907415 | 0.048976629 |
| FEN1 | 4.245454 | 39.62434142 | 3.222396211 | 0.002907656 | 0.048976629 |
| AC005180.1 | 4.319371333 | 0.10970813 | -5.299079001 | 0.002676123 | 0.048976629 |
| PGM5P4 | 4.466981 | 0.061985645 | -6.171222156 | 0.001334966 | 0.048976629 |
| ABCC9 | 4.678883667 | 0.183156014 | -4.675019383 | 0.002969847 | 0.048976629 |
| C1QTNF7 | 4.795991667 | 0.163575051 | -4.873804526 | 0.002907556 | 0.048976629 |
| CKS1B | 4.879866667 | 27.9482614 | 2.517844905 | 0.002907656 | 0.048976629 |
| PLPP7 | 4.934464667 | 0.261087022 | -4.240290927 | 0.002907656 | 0.048976629 |
| REEP4 | 5.081881 | 42.67654261 | 3.070008805 | 0.002907656 | 0.048976629 |
| MCM5 | 5.320449333 | 29.57469622 | 2.474743353 | 0.002969847 | 0.048976629 |
| CMA1 | 5.378929667 | 0.078556297 | -6.097448395 | 0.002371218 | 0.048976629 |
| ZDHHC14 | 5.434402667 | 1.034312338 | -2.393449555 | 0.002969847 | 0.048976629 |
| AC027449.1 | 5.444661 | 0.096116507 | -5.823914194 | 0.002281905 | 0.048976629 |
| RNASEH2A | 5.474293 | 41.41412395 | 2.919378312 | 0.002907656 | 0.048976629 |
| AVPR1A | 5.481554 | 0.367751649 | -3.897781233 | 0.002969847 | 0.048976629 |
| KIF22 | 5.775282667 | 28.40978773 | 2.298424587 | 0.002907656 | 0.048976629 |
| HSPB2 | 5.852205333 | 0.270781266 | -4.433780553 | 0.002907556 | 0.048976629 |
| AC011472.4 | 5.928092667 | 0.389895757 | -3.92640764 | 0.002907599 | 0.048976629 |
| JPT1 | 6.380713667 | 63.13397343 | 3.306626852 | 0.002907656 | 0.048976629 |
| ALG3 | 6.436405333 | 24.27056442 | 1.914880572 | 0.002907656 | 0.048976629 |
| AL049838.1 | 6.503072333 | 0.420695562 | -3.950272966 | 0.002907556 | 0.048976629 |
| EBF1 | 6.611833667 | 0.442443688 | -3.901484679 | 0.002907656 | 0.048976629 |
| MEF2C | 6.728852667 | 0.705862737 | -3.252900965 | 0.002969847 | 0.048976629 |
| MYOCD | 6.996498667 | 0.102720679 | -6.089834575 | 0.002969601 | 0.048976629 |
| ZNF25 | 7.554867 | 1.683135292 | -2.166255211 | 0.002969847 | 0.048976629 |
| AL031429.2 | 7.769253533 | 0.031932759 | -7.926594995 | 0.002356484 | 0.048976629 |
| VEGFD | 7.808901333 | 0.171508728 | -5.508765681 | 0.002907025 | 0.048976629 |
| KIAA1522 | 7.813884333 | 51.56979363 | 2.722414467 | 0.002907656 | 0.048976629 |
| RECK | 8.13414 | 0.775032279 | -3.391661519 | 0.002969847 | 0.048976629 |
| CASQ2 | 8.312275667 | 0.121069969 | -6.101330542 | 0.002898258 | 0.048976629 |
| LEPR | 8.325784333 | 0.674650187 | -3.625374639 | 0.002969847 | 0.048976629 |
| TUBG1 | 8.337667667 | 29.424488 | 1.819301538 | 0.002969847 | 0.048976629 |
| TEK | 8.535434667 | 0.677732175 | -3.654677456 | 0.002969847 | 0.048976629 |
| KPNA2 | 8.540581333 | 67.03229788 | 2.972450212 | 0.002907656 | 0.048976629 |
| ACTA2-AS1 | 8.612886 | 0.24691938 | -5.124384757 | 0.002969847 | 0.048976629 |
| CCL14 | 8.827088333 | 0.121593624 | -6.181798153 | 0.002867082 | 0.048976629 |
| AC012085.2 | 8.845370333 | 0.072649553 | -6.927824818 | 0.002798703 | 0.048976629 |
| TCEAL6 | 8.920253 | 0.022519671 | -8.629755081 | 0.001402316 | 0.048976629 |
| PAFAH1B3 | 8.988921333 | 49.43504549 | 2.459314251 | 0.002969847 | 0.048976629 |
| AC053503.4 | 9.164009667 | 0.083320645 | -6.781161168 | 0.000164822 | 0.048976629 |
| GPIHBP1 | 9.366506667 | 0.134603951 | -6.120718419 | 0.002904384 | 0.048976629 |
| ATOH8 | 9.419009 | 0.448944619 | -4.390965884 | 0.002969847 | 0.048976629 |
| TRPC4 | 9.738115667 | 0.145428399 | -6.065261709 | 0.002969835 | 0.048976629 |
| ABCG2 | 10.176267 | 0.409445899 | -4.635391781 | 0.002907656 | 0.048976629 |
| LGI4 | 10.311944 | 0.601528799 | -4.099538714 | 0.002907656 | 0.048976629 |
| RANGAP1 | 10.32322533 | 44.33790046 | 2.102646666 | 0.002907656 | 0.048976629 |
| AP001107.5 | 10.62646067 | 0.253305039 | -5.390641573 | 0.002901848 | 0.048976629 |
| PDE2A | 10.95424967 | 0.494103392 | -4.470533898 | 0.002907656 | 0.048976629 |
| GPRASP1 | 11.455003 | 0.552640084 | -4.373493819 | 0.002907656 | 0.048976629 |
| MMRN1 | 12.15564167 | 0.522061313 | -4.541262989 | 0.002969847 | 0.048976629 |
| MYCT1 | 12.30727667 | 0.762555452 | -4.012525498 | 0.002969847 | 0.048976629 |
| TNXB | 12.857966 | 0.456718245 | -4.815214207 | 0.002907656 | 0.048976629 |
| SAMD1 | 13.00907 | 41.81634958 | 1.684549296 | 0.002969847 | 0.048976629 |
| SGCA | 13.19399167 | 0.197471119 | -6.062095624 | 0.002969788 | 0.048976629 |
| KCNJ8 | 13.53072233 | 0.921078094 | -3.876771568 | 0.002907656 | 0.048976629 |
| TIE1 | 13.80315467 | 1.427333232 | -3.273603931 | 0.002969847 | 0.048976629 |
| RHOJ | 13.874021 | 1.100021946 | -3.656781762 | 0.002969847 | 0.048976629 |
| HSPA12B | 14.034565 | 0.972455828 | -3.851207818 | 0.002907656 | 0.048976629 |
| FGF7 | 14.537865 | 0.520324267 | -4.804260609 | 0.002969844 | 0.048976629 |
| DBI | 15.14378 | 65.29300935 | 2.108203179 | 0.002907656 | 0.048976629 |
| FAM110D | 16.130117 | 0.720151257 | -4.485313138 | 0.002907656 | 0.048976629 |
| CNRIP1 | 16.31504667 | 0.989692338 | -4.043079194 | 0.002969847 | 0.048976629 |
| FRMD6-AS2 | 16.315638 | 0.070309123 | -7.858327798 | 0.001728836 | 0.048976629 |
| CXorf36 | 16.816334 | 0.861871217 | -4.286247105 | 0.002907656 | 0.048976629 |
| JAM2 | 17.52046 | 0.675551827 | -4.69683039 | 0.002907656 | 0.048976629 |
| CRY2 | 17.84693667 | 3.796723552 | -2.232849603 | 0.002969847 | 0.048976629 |
| MITF | 18.94895667 | 1.400401072 | -3.758206439 | 0.002907656 | 0.048976629 |
| ADGRL4 | 19.25257667 | 2.112064328 | -3.188325861 | 0.002969847 | 0.048976629 |
| JPH2 | 19.33681 | 0.772258646 | -4.646121884 | 0.002907656 | 0.048976629 |
| DACT3 | 19.65532333 | 0.624052469 | -4.977108954 | 0.002907656 | 0.048976629 |
| EMCN | 19.71717233 | 0.714594377 | -4.786184296 | 0.002907656 | 0.048976629 |
| MRVI1 | 20.67947667 | 1.229043436 | -4.072591867 | 0.002907656 | 0.048976629 |
| TCF23 | 20.77050833 | 0.096224314 | -7.753919336 | 0.002941943 | 0.048976629 |
| ADH1B | 21.589176 | 0.242721229 | -6.474864072 | 0.002935074 | 0.048976629 |
| PDZRN3 | 23.89231333 | 1.010759848 | -4.563034381 | 0.002969847 | 0.048976629 |
| MMRN2 | 24.07429333 | 2.602476773 | -3.209536258 | 0.002969847 | 0.048976629 |
| JAM3 | 24.25990667 | 1.557027809 | -3.961707384 | 0.002907656 | 0.048976629 |
| PCNA | 26.66728333 | 215.2883285 | 3.013127342 | 0.002907656 | 0.048976629 |
| LDB2 | 26.84531333 | 1.120228078 | -4.582805845 | 0.002969847 | 0.048976629 |
| SERTM1 | 27.00274533 | 0.295550294 | -6.513558623 | 0.002277432 | 0.048976629 |
| RAB3IL1 | 28.05983667 | 2.484895139 | -3.497249734 | 0.002969847 | 0.048976629 |
| ZCCHC12 | 32.23301333 | 0.38459773 | -6.389045008 | 0.002969204 | 0.048976629 |
| MXRA7 | 32.36333 | 4.08448121 | -2.986135309 | 0.002969847 | 0.048976629 |
| RASL12 | 35.02677333 | 1.685038159 | -4.377604925 | 0.002907656 | 0.048976629 |
| PPP1R12B | 36.13469 | 2.383394038 | -3.922295126 | 0.002907656 | 0.048976629 |
| PLAC9 | 36.57375667 | 1.376582116 | -4.731646243 | 0.002969847 | 0.048976629 |
| RAI2 | 38.13514 | 1.739924689 | -4.454024229 | 0.002907656 | 0.048976629 |
| CD34 | 38.94151 | 2.532088291 | -3.942909212 | 0.002907656 | 0.048976629 |
| PODN | 39.42252 | 1.995966966 | -4.303860252 | 0.002907656 | 0.048976629 |
| TBC1D1 | 39.68758333 | 6.338195114 | -2.646543739 | 0.002969847 | 0.048976629 |
| RERG | 45.54668667 | 1.610461774 | -4.821799786 | 0.002907656 | 0.048976629 |
| MSRB3 | 47.28062667 | 2.374195522 | -4.315738502 | 0.002907656 | 0.048976629 |
| C7 | 53.39584333 | 0.747076013 | -6.159328587 | 0.00296535 | 0.048976629 |
| CHRDL1 | 56.66380333 | 0.493004955 | -6.844681482 | 0.002945266 | 0.048976629 |
| TNS1 | 57.79483333 | 4.231390233 | -3.771736879 | 0.002969847 | 0.048976629 |
| GNG11 | 58.94997667 | 3.146258062 | -4.227782329 | 0.002907656 | 0.048976629 |
| PRELP | 63.81604667 | 3.606790139 | -4.145131851 | 0.002907656 | 0.048976629 |
| ITM2A | 63.81789667 | 4.108238425 | -3.957369243 | 0.002969847 | 0.048976629 |
| MATN2 | 65.18636667 | 6.405312375 | -3.34722943 | 0.002969847 | 0.048976629 |
| NDN | 69.41545667 | 3.558211637 | -4.286032714 | 0.002907656 | 0.048976629 |
| FBLN5 | 71.73318 | 4.392540344 | -4.029513146 | 0.002907656 | 0.048976629 |
| PLN | 74.64023 | 0.821842713 | -6.504947309 | 0.002907556 | 0.048976629 |
| CXCL12 | 76.48481333 | 2.589450314 | -4.884455536 | 0.002907656 | 0.048976629 |
| KANK2 | 91.52304 | 8.810647905 | -3.376814954 | 0.002969847 | 0.048976629 |
| PGM5-AS1 | 103.9762653 | 0.153204864 | -9.406576423 | 0.001700567 | 0.048976629 |
| Table IIMethylation-driven IncRNAs. |
Table II
Methylation-driven IncRNAs.
| Gene | Normal mean | Tumor mean | logFC | P-value | Cor | Cor P-value |
|---|
| CTSK | 0.359953657 | 0.778931247 | 1.113684816 | 0.002907613 | -0.333186659 | 2.28E-09 |
| HMGA1 | 0.336366172 | 0.114271749 | -1.557563851 | 0.002907622 | -0.346189262 | 4.83E-10 |
| ZIK1 | 0.112378753 | 0.423256447 | 1.913162742 | 0.002907633 | -0.4225026 | 1.12E-14 |
| PTTG1 | 0.239439619 | 0.119640652 | -1.000954214 | 0.002969791 | -0.410831811 | 6.86E-14 |
| ZSCAN18 | 0.287461835 | 0.583381623 | 1.021069511 | 0.003033222 | -0.582416793 | 3.48E-29 |
| CDO1 | 0.143990529 | 0.567419479 | 1.978441762 | 0.003097858 | -0.381641109 | 4.78E-12 |
| F11R | 0.35962326 | 0.142571806 | -1.334797621 | 0.003097864 | -0.360185914 | 8.35E-11 |
| NOVA1 | 0.070986809 | 0.549410942 | 2.952262777 | 0.003163751 | -0.359827999 | 8.74E-11 |
| ZNF582 | 0.118658864 | 0.513854519 | 2.114540083 | 0.003197172 | -0.623223069 | 2.54E-34 |
| DDR2 | 0.380932141 | 0.789642763 | 1.051666101 | 0.003230892 | -0.317960483 | 1.29E-08 |
| CHMP4C | 0.347515219 | 0.162185406 | -1.099432153 | 0.00329935 | -0.391735829 | 1.15E-12 |
| ZNF677 | 0.084379051 | 0.573297327 | 2.764326789 | 0.003299369 | -0.602084535 | 1.44E-31 |
| PTPRD | 0.11697317 | 0.492863393 | 2.07501017 | 0.003440272 | -0.367446412 | 3.25E-11 |
| LAMA4 | 0.26922608 | 0.581786764 | 1.111672304 | 0.003738586 | -0.343996592 | 6.31E-10 |
| ZNF418 | 0.177561931 | 0.63031161 | 1.827742931 | 0.003738618 | -0.493238972 | 3.64E-20 |
| CDKN2A | 0.200931093 | 0.095506903 | -1.073023924 | 0.00397755 | -0.320163484 | 1.01E-08 |
| ARNTL2 | 0.366240185 | 0.155970223 | -1.231519468 | 0.00406028 | -0.321666208 | 8.53E-09 |
| GYPC | 0.238177584 | 0.602450285 | 1.338804554 | 0.004060299 | -0.449701958 | 1.22E-16 |
| ZNF790-AS1 | 0.039053506 | 0.358995752 | 3.200442814 | 0.004060303 | -0.579449912 | 7.72E-29 |
| ZNF135 | 0.284970925 | 0.679272407 | 1.253175522 | 0.004317812 | -0.654121773 | 9.58E-39 |
| AF186192.1 | 0.111066679 | 0.493975764 | 2.1530142 | 0.004497656 | -0.453585503 | 6.20E-17 |
| THSD7A | 0.100507008 | 0.537490751 | 2.418943824 | 0.004684211 | -0.430102805 | 3.29E-15 |
| LRFN5 | 0.08563937 | 0.514578088 | 2.587043942 | 0.00478012 | -0.356743502 | 1.30E-10 |
| SPARCL1 | 0.221767893 | 0.687152496 | 1.631579789 | 0.004877773 | -0.409453404 | 8.46E-14 |
| ZNF880 | 0.045439117 | 0.424736649 | 3.224561903 | 0.005286769 | -0.611950539 | 7.93E-33 |
| PABPC1P4 | 0.344094877 | 0.688325541 | 1.000284629 | 0.005958452 | -0.668913704 | 4.72E-41 |
| CPXM2 | 0.235657194 | 0.503267657 | 1.094636163 | 0.006575888 | -0.40452501 | 1.78E-13 |
| ANGPTL1 | 0.224534915 | 0.735755194 | 1.712286021 | 0.006838515 | -0.372454964 | 1.67E-11 |
| HENMT1 | 0.234654382 | 0.106237576 | -1.143243265 | 0.007536963 | -0.389308525 | 1.63E-12 |
| ZNF471 | 0.069975202 | 0.453574624 | 2.696424276 | 0.00783384 | -0.690878505 | 9.82E-45 |
| EMX2 | 0.098532812 | 0.321111542 | 1.704398389 | 0.007986166 | -0.338378799 | 1.24E-09 |
| CTTNBP2 | 0.072730113 | 0.167092872 | 1.200025464 | 0.00845908 | -0.329763608 | 3.40E-09 |
| FAXDC2 | 0.168151612 | 0.364885714 | 1.117682056 | 0.008459093 | -0.378660562 | 7.20E-12 |
| CLSTN2 | 0.142064024 | 0.409902778 | 1.528740508 | 0.009128618 | -0.318465241 | 1.22E-08 |
| ROR2 | 0.060251887 | 0.132899666 | 1.141259162 | 0.015707688 | -0.33512759 | 1.82E-09 |
| SLIT2 | 0.156368293 | 0.407988703 | 1.383581202 | 0.020261048 | -0.42849441 | 4.27E-15 |
| PREX2 | 0.08137986 | 0.399527012 | 2.295549348 | 0.020261061 | -0.364080516 | 5.05E-11 |
| CTSK | 0.359953657 | 0.778931247 | 1.113684816 | 0.002907613 | -0.333186659 | 2.28E-09 |
Enrichment analysis of
methylation-driven mRNAs in CC
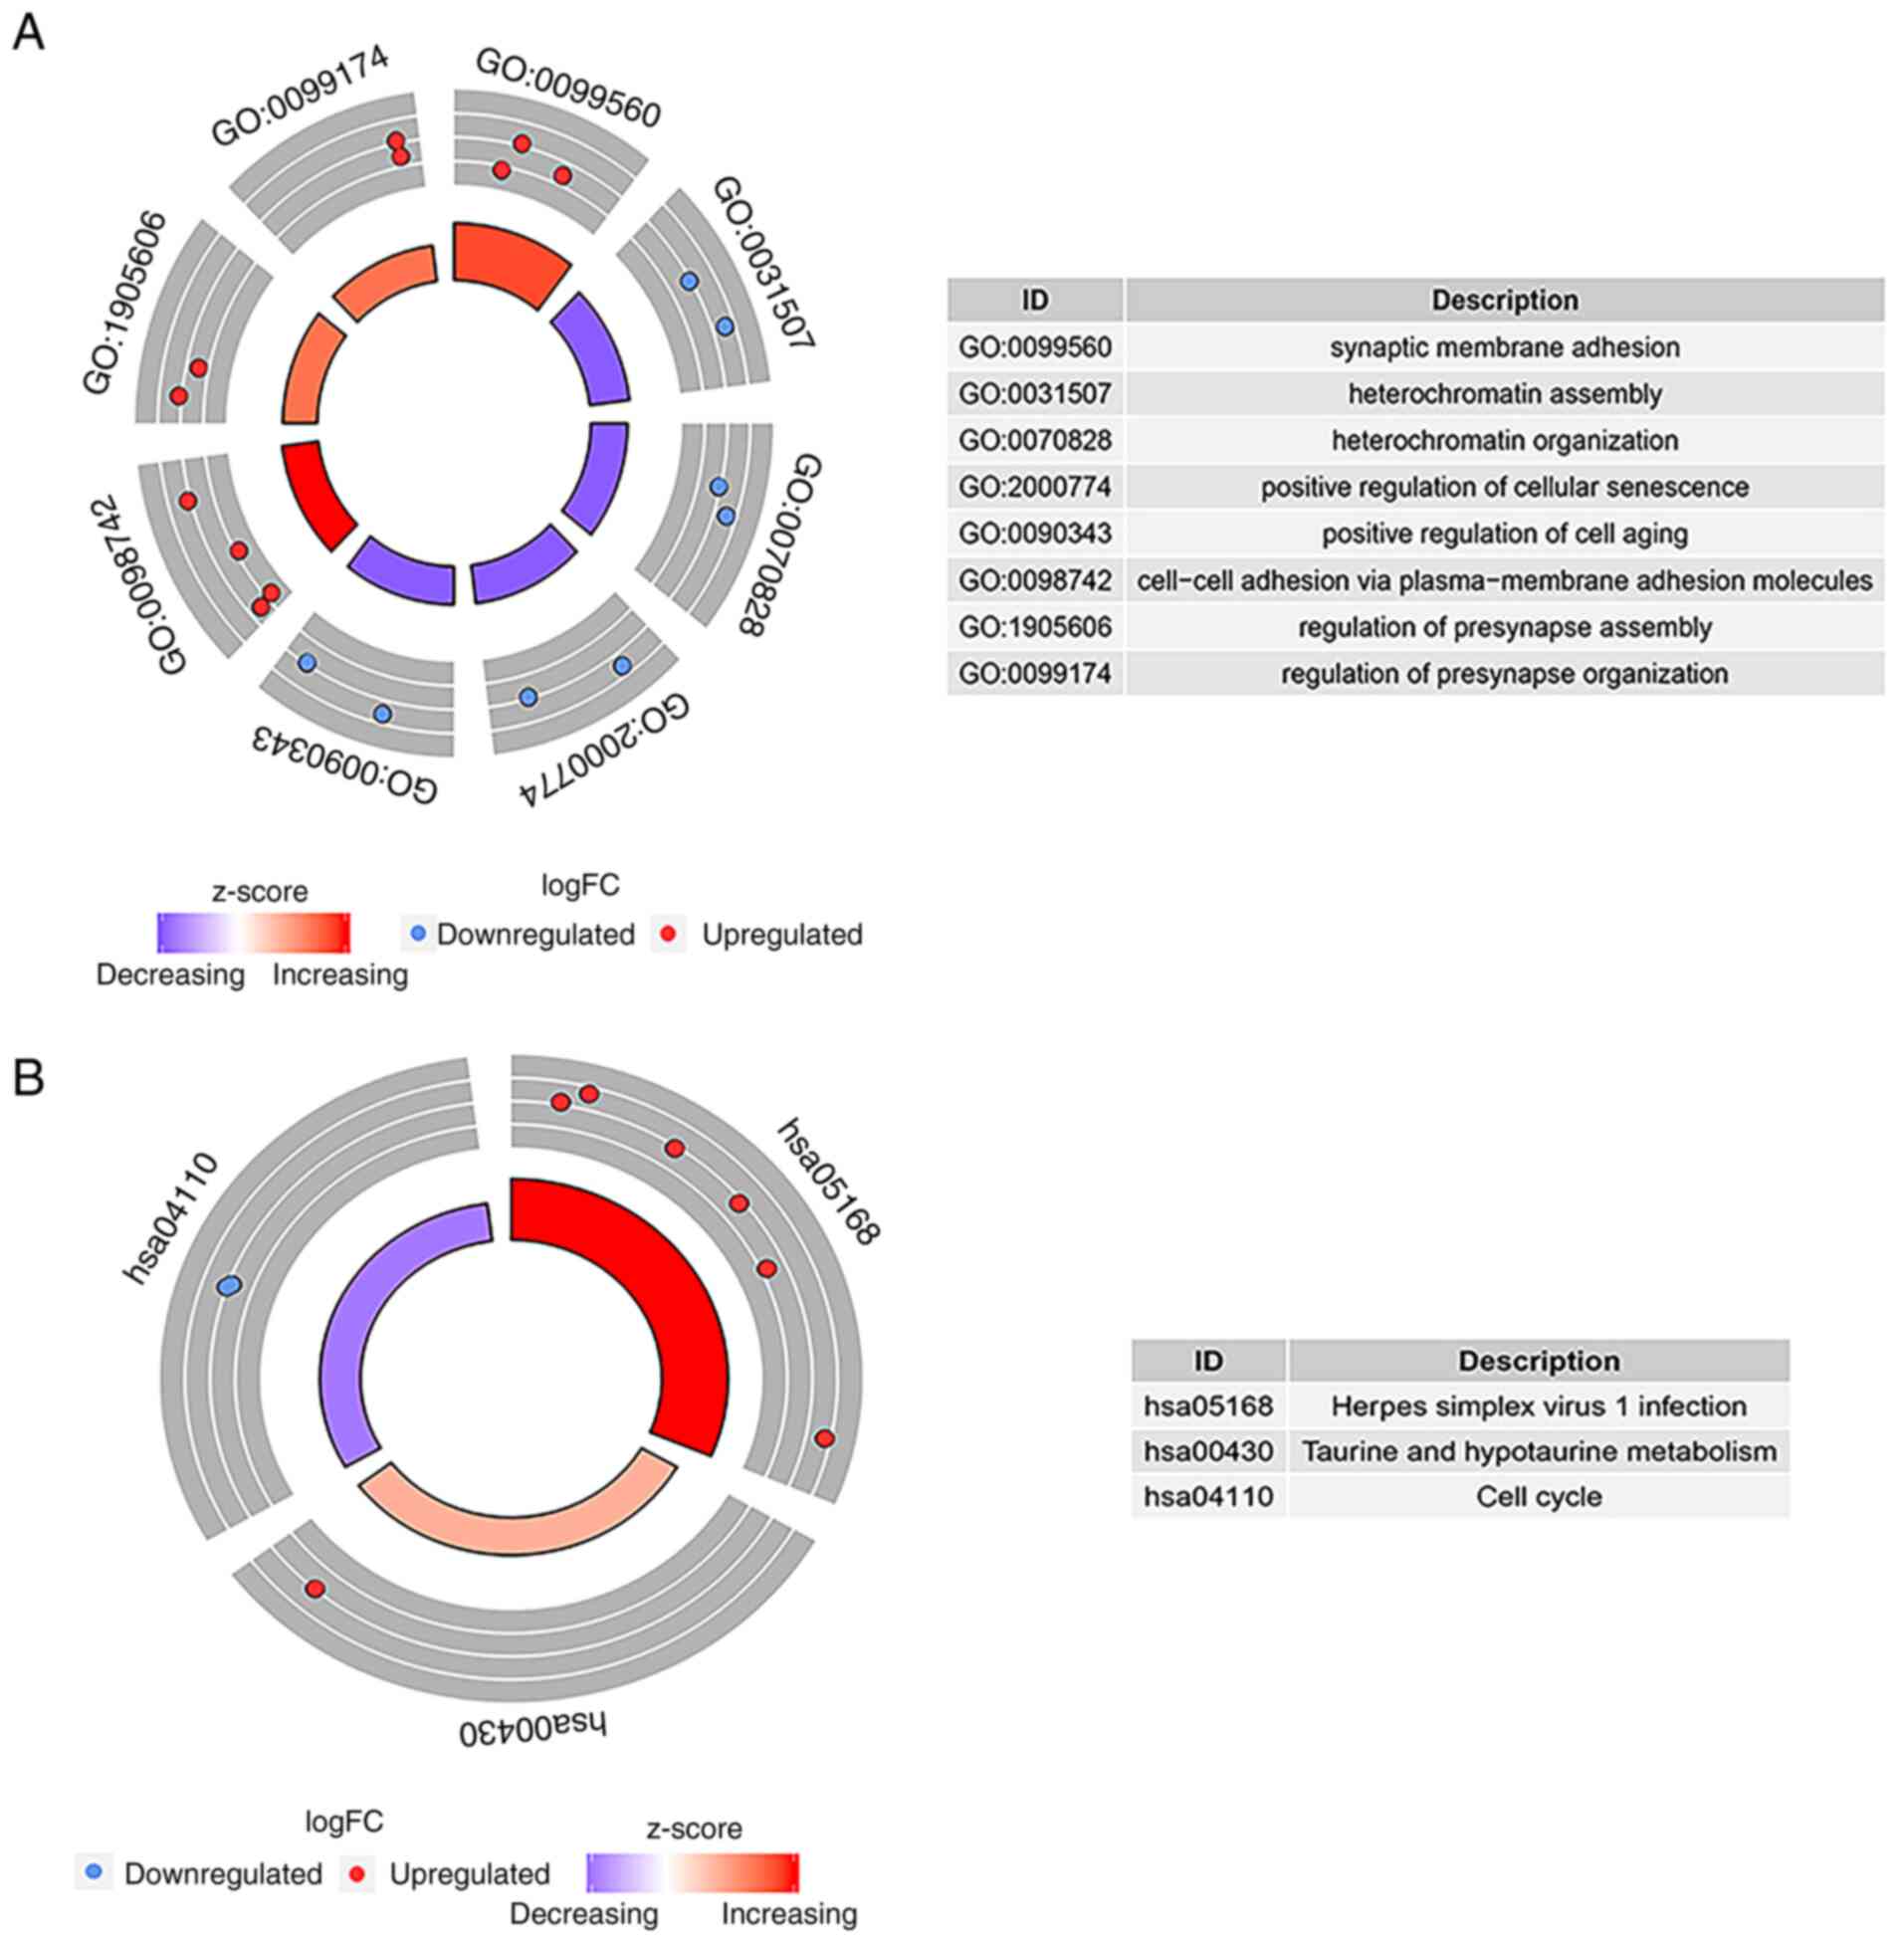
According to the results of the GO enrichment
analysis, there were eight GO terms with statistically significant
differences (P<0.05): Synaptic membrane adhesion,
heterochromatin assembly, heterochromatin organization, positive
regulation of cellular senescence, positive regulation of cell
aging, cell-cell adhesion via plasma-membrane adhesion molecules,
regulation of presynapse assembly, and the regulation of presynapse
organization. ‘GO:0099560 synaptic membrane adhesion’ exhibited the
highest GO biological process (Fig.
4A). As shown in Fig. 4B, three
pathways (hsa05168, hsa00430 and hsa04110) were regarded to be of
statistical significance (P<0.05); the highest KEGG pathway was
‘hsa05168 Herpes simplex virus 1 infection’.
Establishment of a predictive model of
two distinctively methylated lncRNAs in CC
The univariate Cox regression model was conducted
for identifying the prognosis in relevance to differentially
methylated genes in CC and incorporated three methylation genes
conspicuous relevance to the overall survival rate (P<0.05). The
univariate and multivariate Cox regression model revealed that two
lncRNAs were eventually related to the survival rate of patients
with CC (Tables III and IV).
| Table IIIUnivariate Cox regression analysis of
two lncRNAs associated with overall survival in patients with
cervical cancer. |
Table III
Univariate Cox regression analysis of
two lncRNAs associated with overall survival in patients with
cervical cancer.
| Genes | HR | 95% CI of HR | P-value |
|---|
| FLT1 | 0.153 | 0.0266-0.876 | 0.035 |
| MKI67 |
7622606324559.52 |
3137.628-1.851E+22 | 0.007 |
| Table IVMultivariate Cox regression analysis
of two lncRNAs associated with the overall survival of patients
with cervical cancer. |
Table IV
Multivariate Cox regression analysis
of two lncRNAs associated with the overall survival of patients
with cervical cancer.
| Genes | HR | 95% CI of HR | P-value |
|---|
| FLT1 | 0.158 | 0.0280-0.894 | 0.037 |
| MKI67 | 9.805E+12 |
3111.326-3.09E+22 | 0.007 |
Analysis of risk groupings and ROC
curve
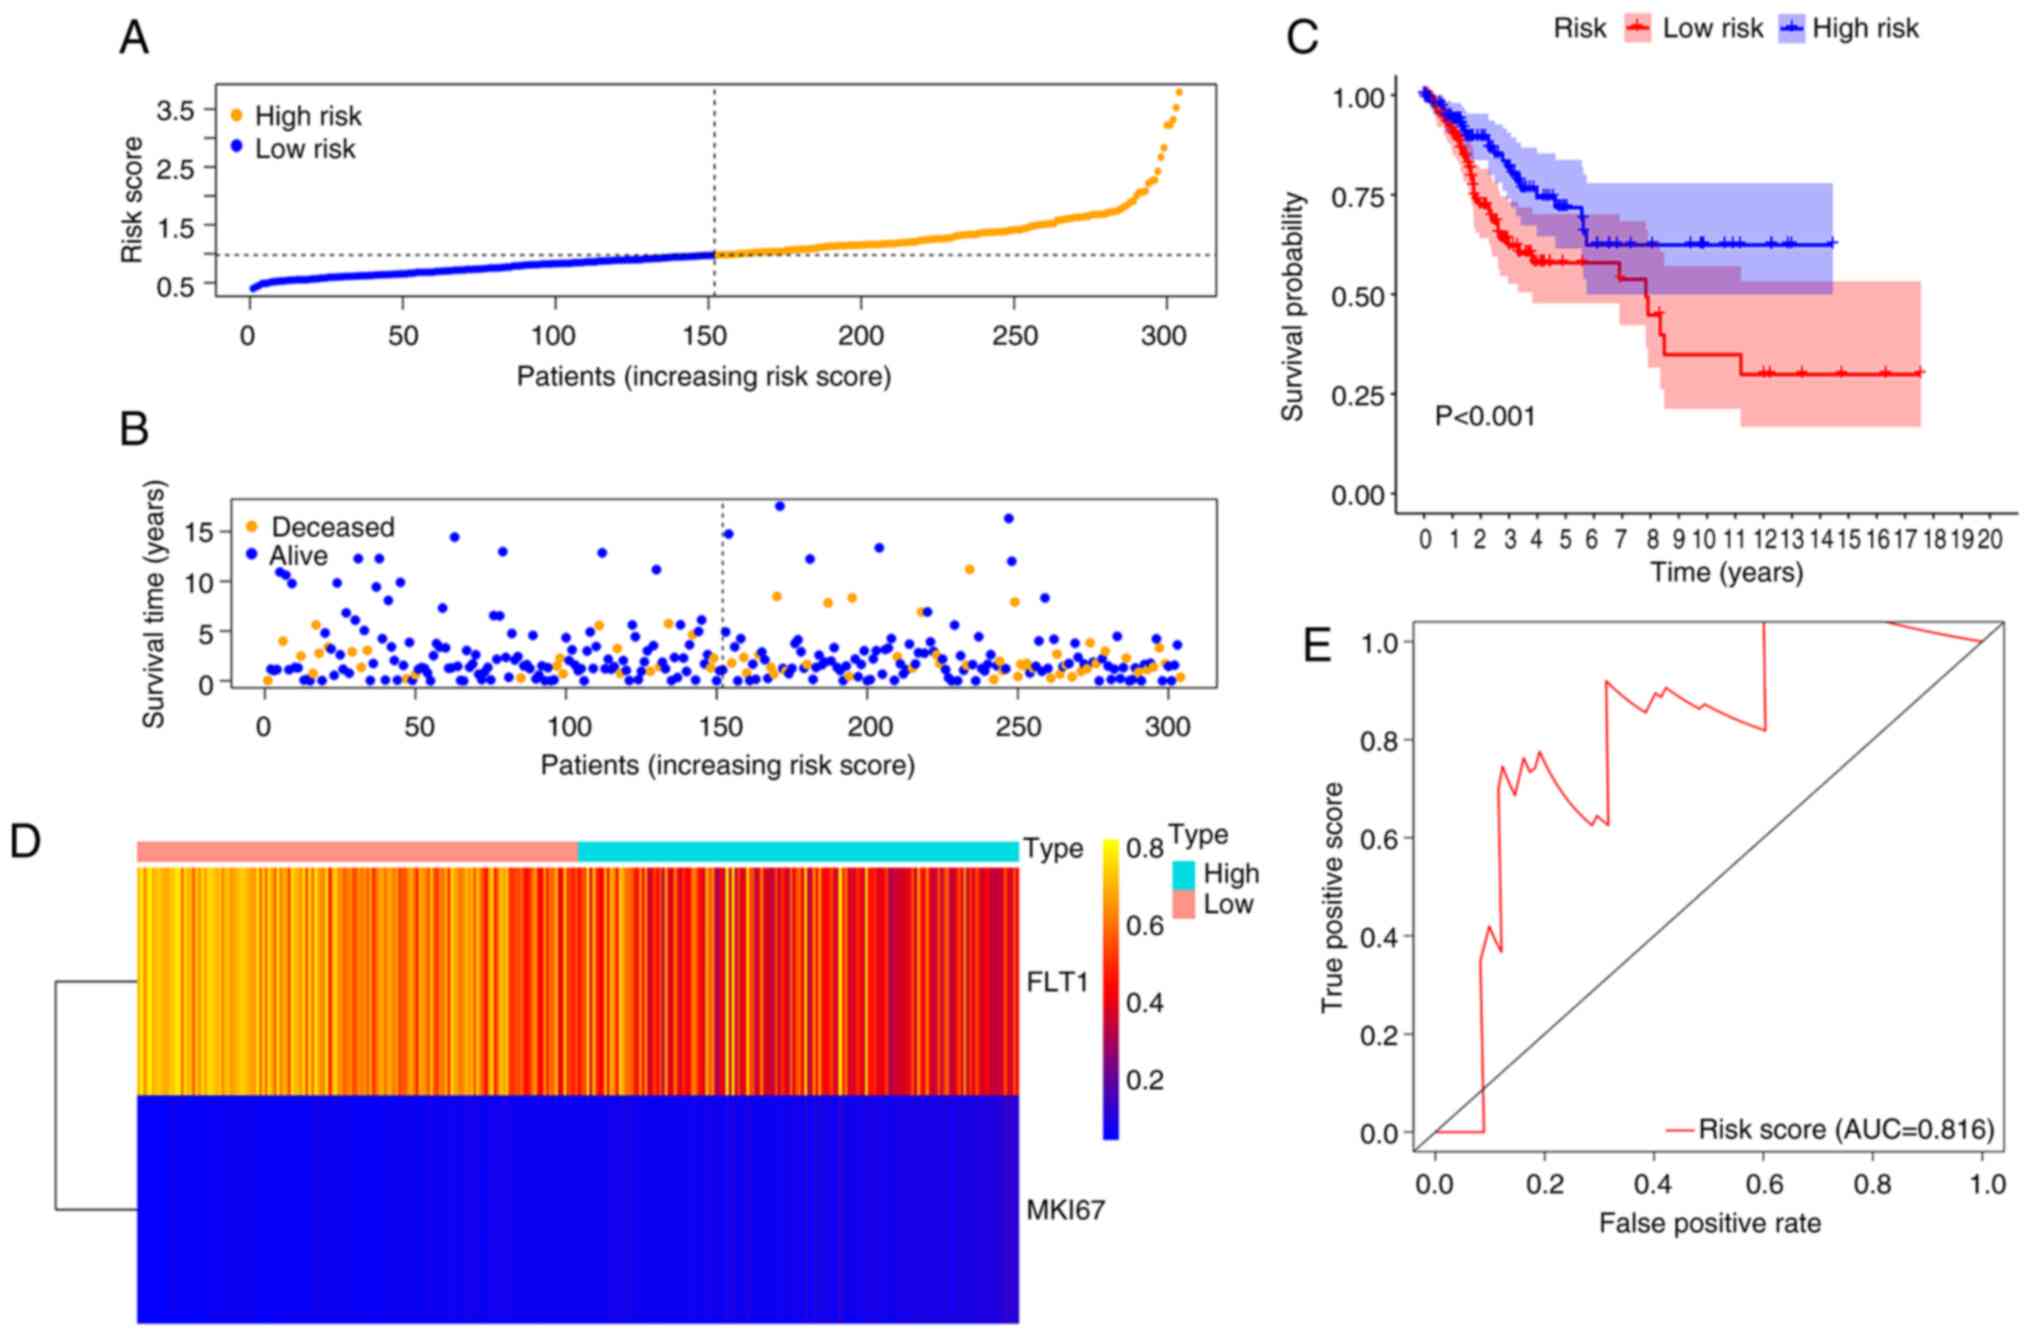
Based on the median risk scores, a total of 304
samples of complete survival information were classified into a
high-risk group (n=152) and low-risk group (n=152). The risk score
of the low-risk group was in the range of 0.5 to 1.0; 1.0 to 2.5
was the risk score attached to the high-risk group with rapid
growth trends (Fig. 5A). The
distributions of risk scores and the OS status of each patient are
illustrated in Fig. 5B, suggesting
a good discrimination between the low- and high-risk groups. The
Kaplan-Meier curve based on the log-rank statistical examination
was used for survival analysis. Patients with CC belonging to the
low-risk group exhibited an improved OS compared with those in the
high-risk group (P<0.001) (Fig.
5C). According to the heatmap, the expression of two prognostic
methylation genes was profiled (Fig.
5D). ROC curve analysis further revealed an excellent
prediction efficiency with an AUC value of 0.816 (Fig. 5E).
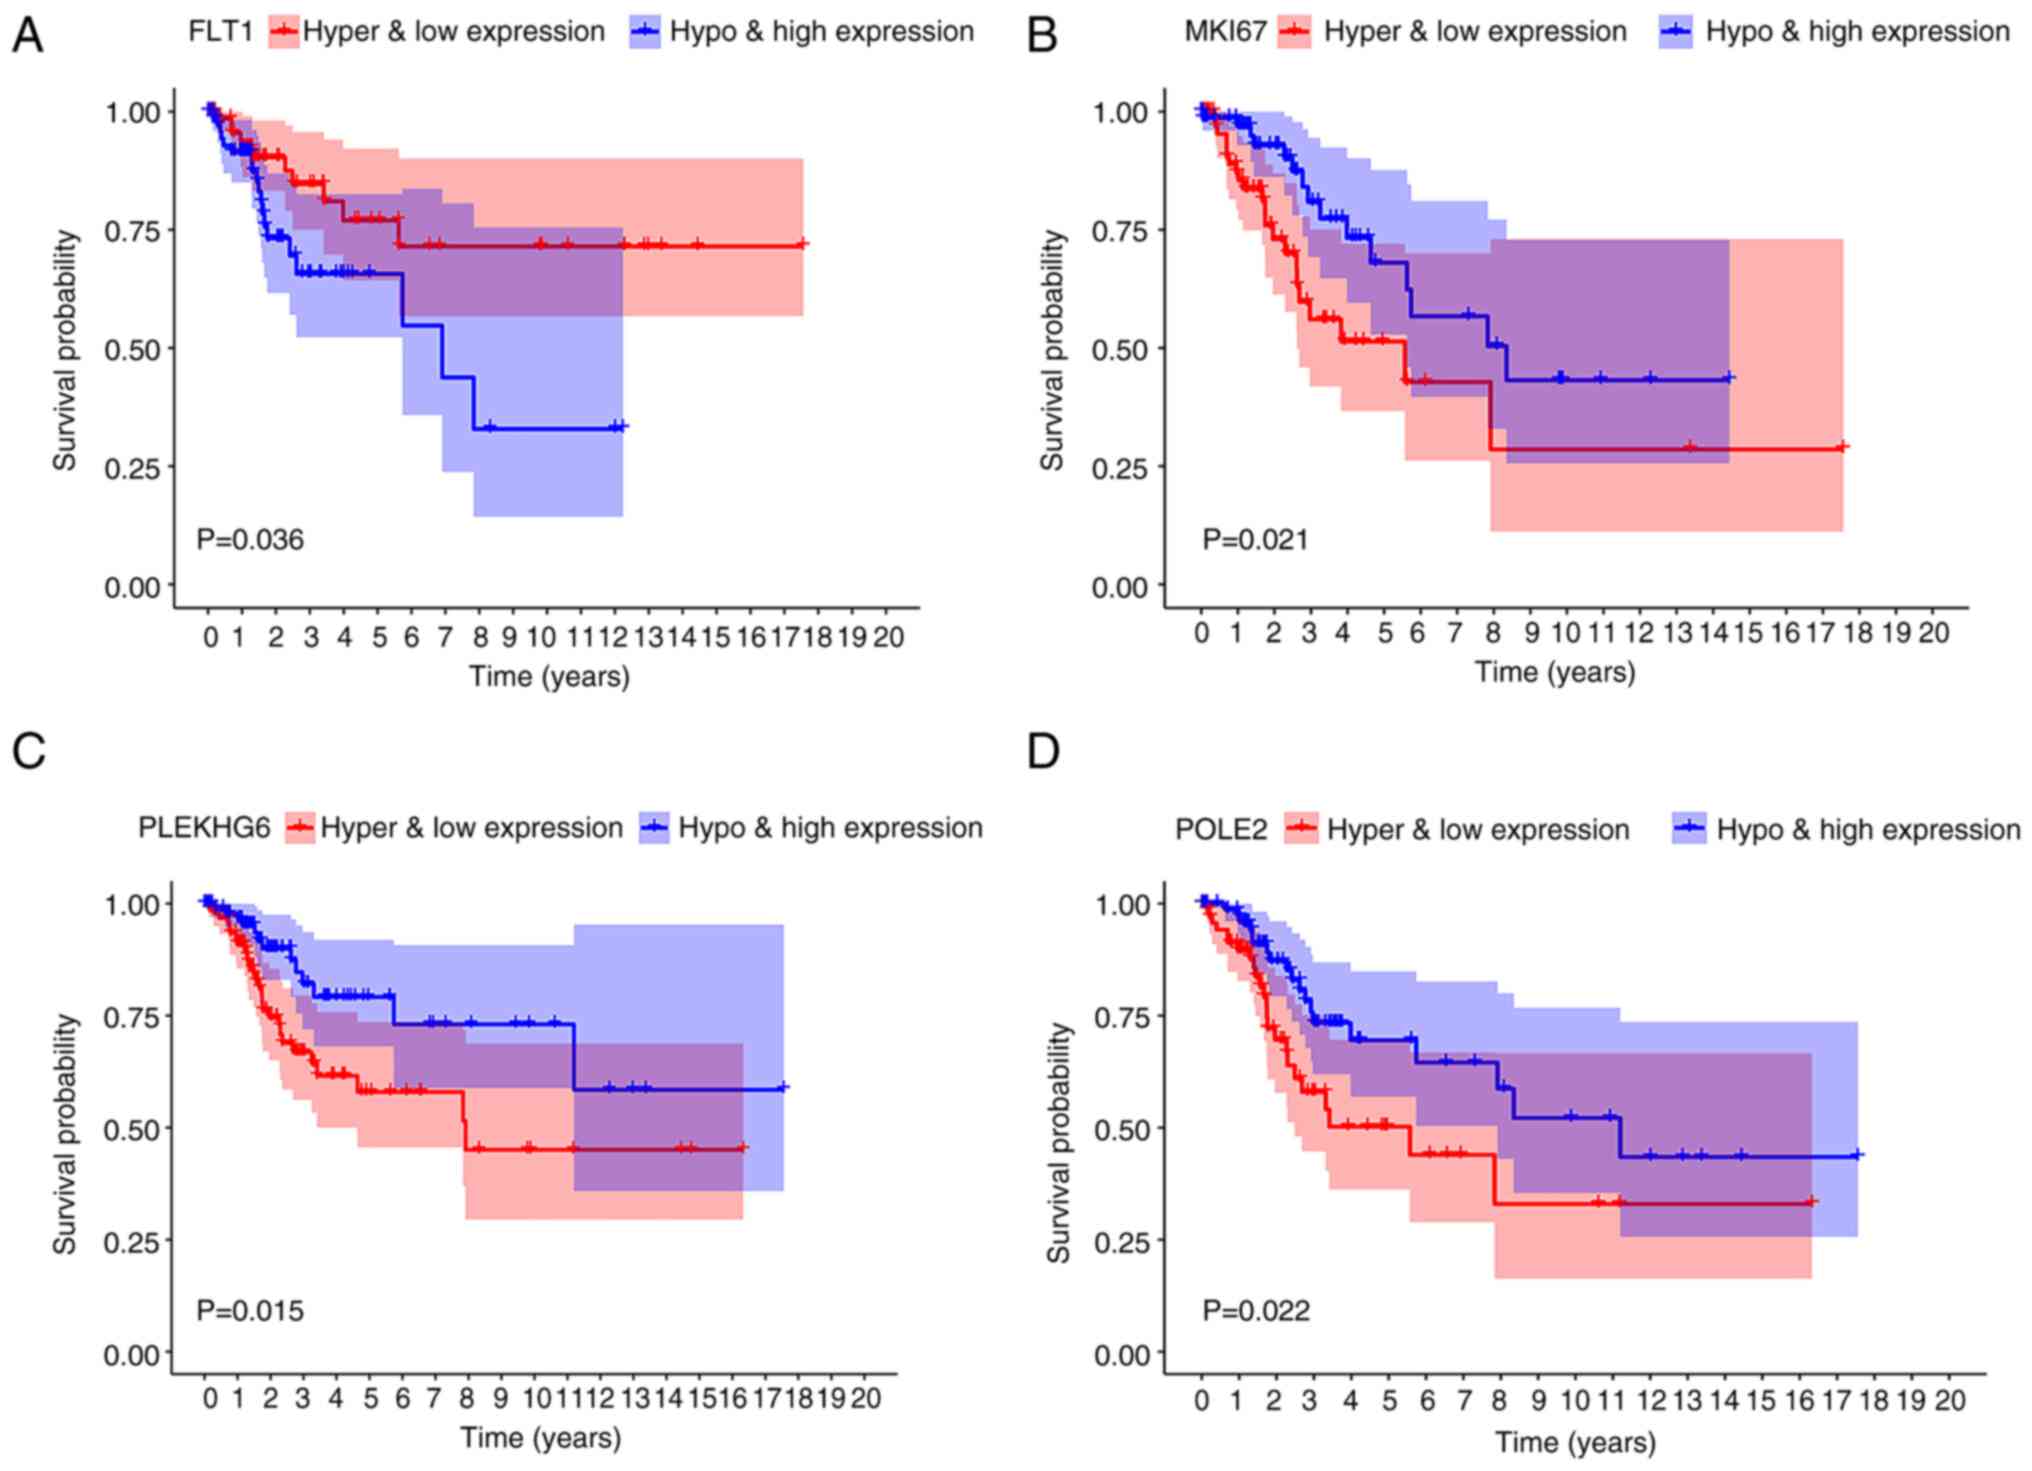
Combined methylation and gene
expression survival analysis in CC
In accordance with the combined Kaplan-Meier curve
analysis, the combined methylation and mRNA presentation of FLT1
was relevant to the OS rate of patients with CC (P=0.036; Fig. 6A). The low expression of FLT1 with
hypermethylation was associated with a higher survival rate as
compared with the high expression of FLT1 with hypomethylation. The
combination methylation and presentation of the lncRNAs marker of
proliferation Ki-67 (MKI67), PLEKHG6 and DNA polymerase epsilon 2,
accessory subunit (POLE2) harbored a marked relevance to the
prognosis of patients with CC (P=0.021, 0.015 and 0.022,
respectively) (Fig. 6B-D).
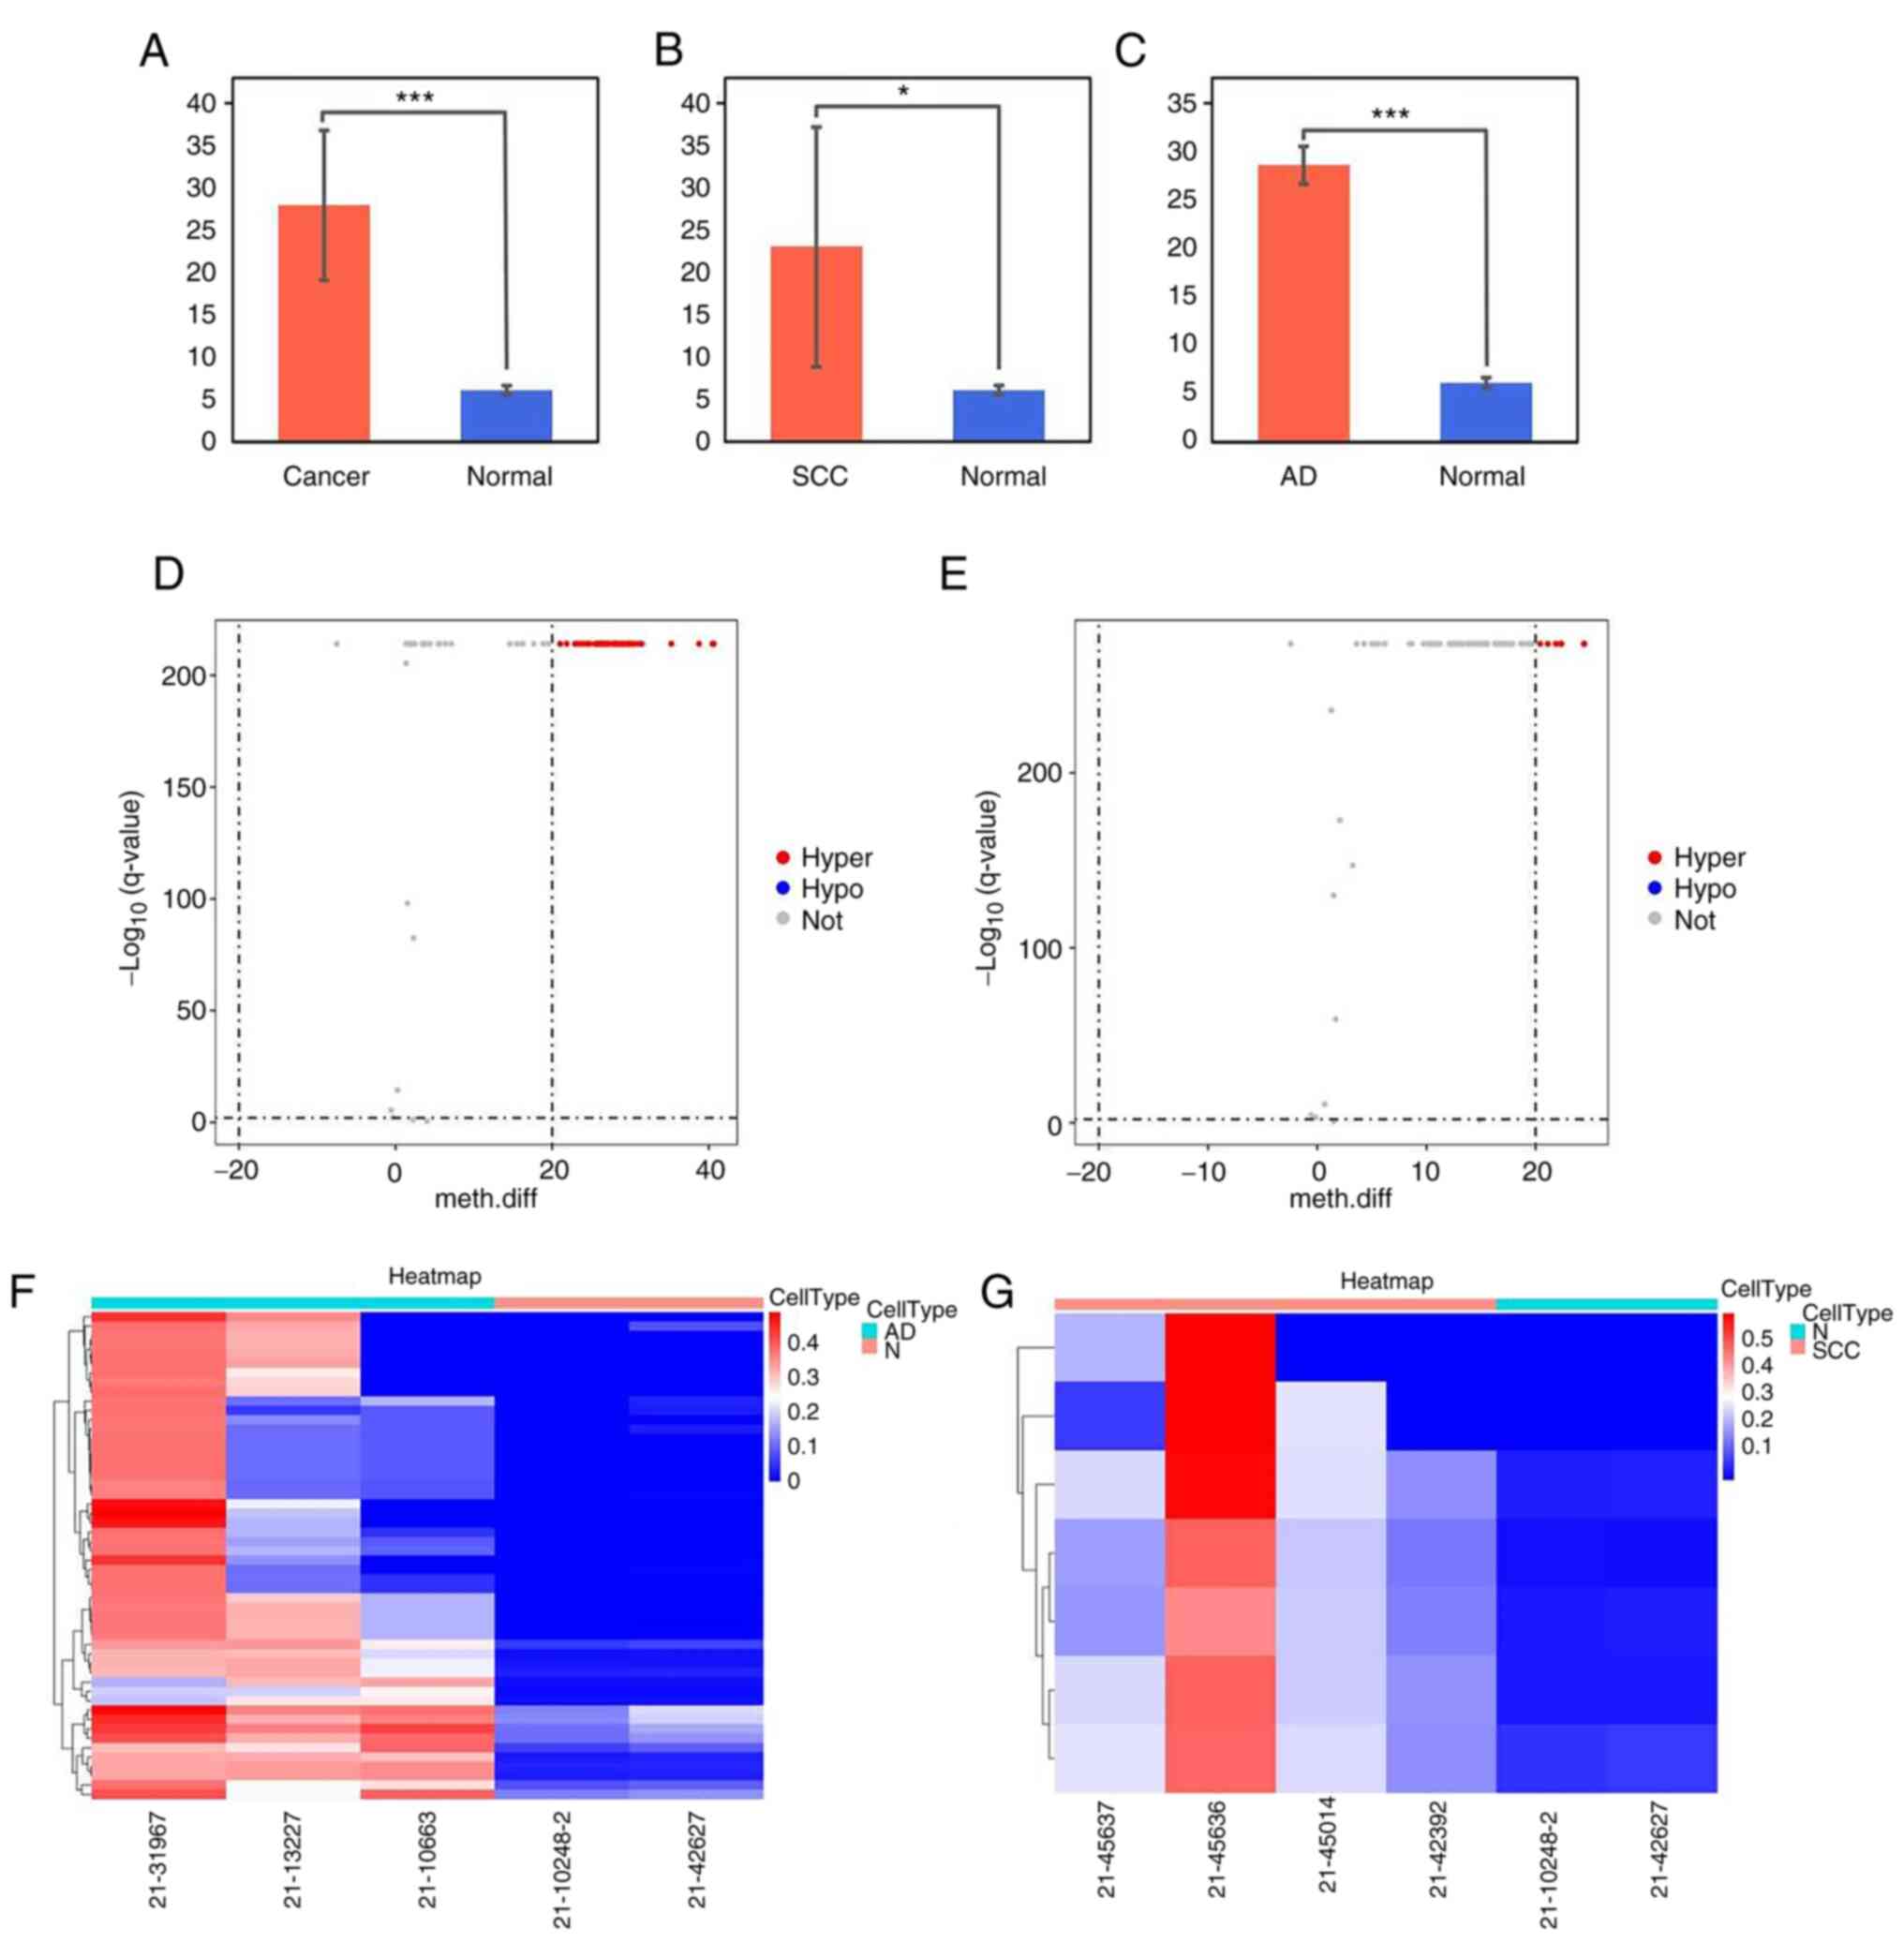
Promoter methylation level of FLT1 in
CC tissues
The methylation levels of the FLT1 promoter were
significantly higher in tumor tissue than in normal tissue (CC:
27.9±8.8, P=0.0008; cervical squamous carcinoma: 22.9±14.1,
P=0.048; cervical adenocarcinoma: 28.6±1.9, P=0.0005) (Fig. 7A-C). The volcano plot revealed DNA
methylation differences of the FLT1 promoter in CC tissues.
Compared with the normal tissue group, 52 of the CpGs were
hypermethylated in the adenocarcinoma group (Fig. 7D) and eight of the CpGs were
hypermethylated in the squamous carcinoma group (Fig. 7E). The methylation values of the
FLT1 promoter are presented as a heatmap in Fig. 7F and G).
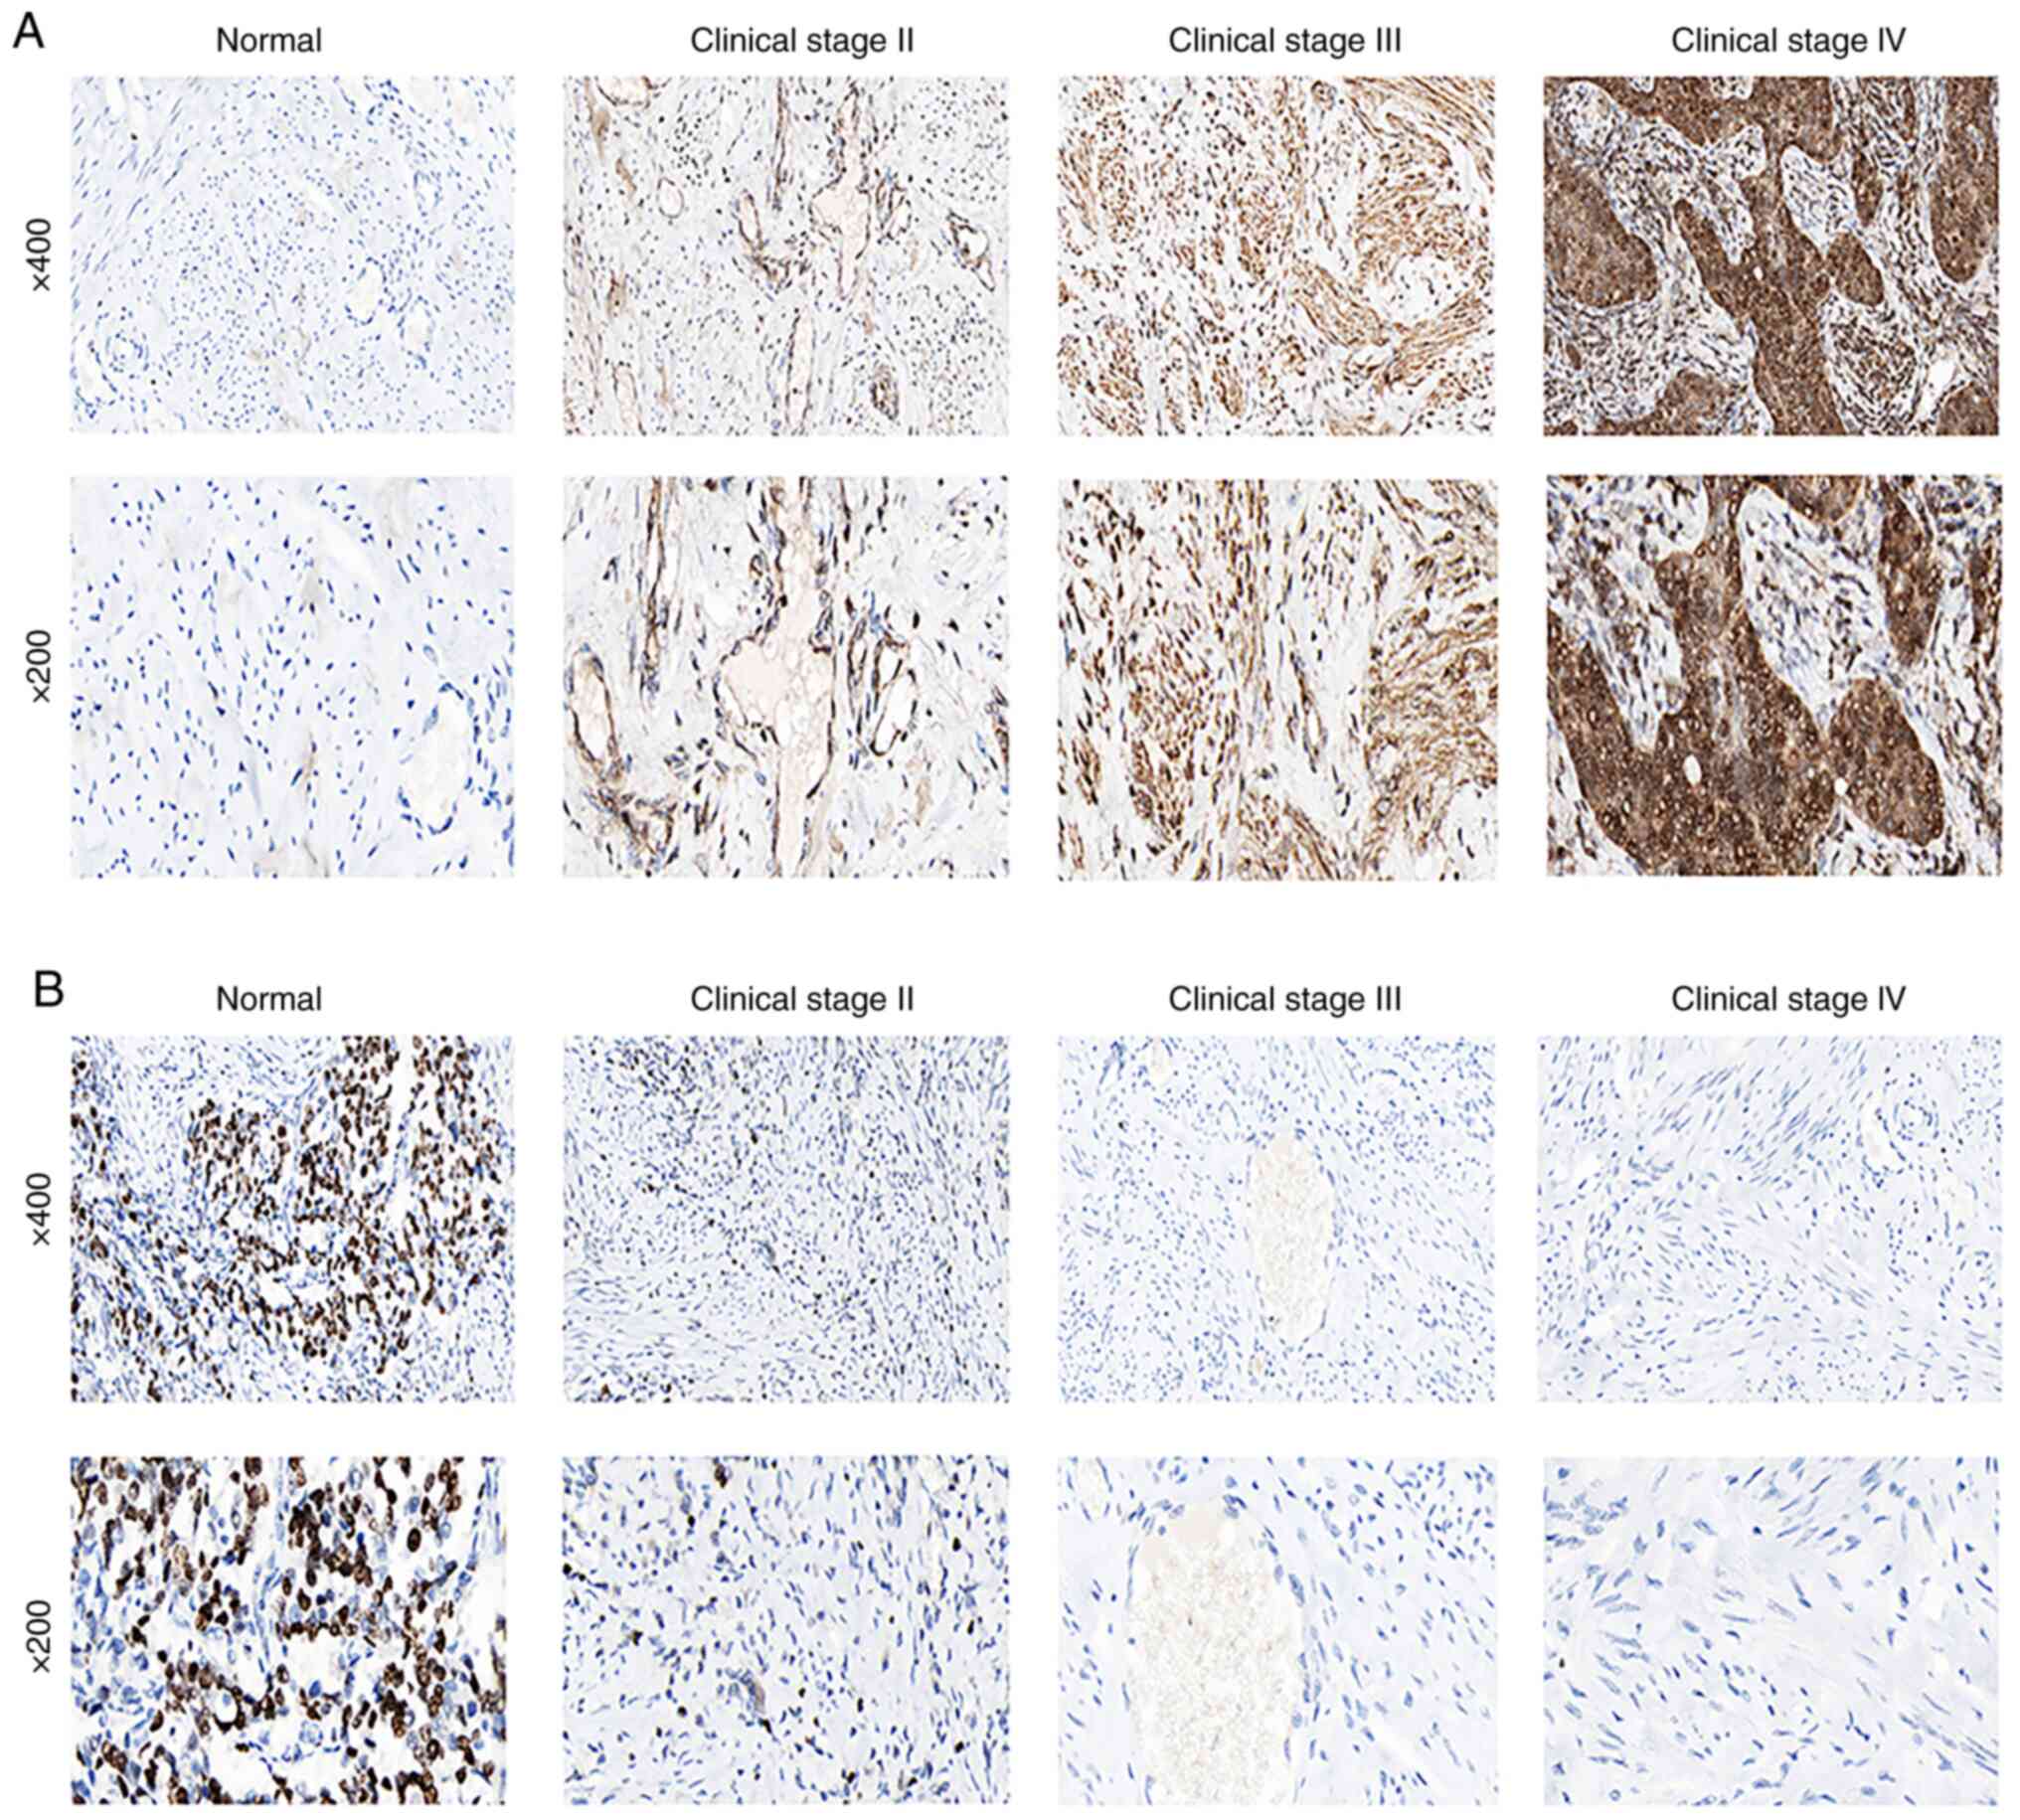
Validation of FLT1 and PLEKHG6
expression
The results of the staining of normal cervical
tissues demonstrated that FLT1 was negatively expressed in normal
cervical tissues (Fig. 8A). As
regards FLT1, the staining was low, and the intensity was weak in
stage II cervical adenocarcinoma (Fig.
8A). FLT1 was highly expressed in stage III/IV cervical
adenocarcinoma (Fig. 8A). However,
as regards PLEKHG6 (Fig. 8B), when
compared with normal cervical tissues (Fig. 8B), staining was not detected, and
the intensity was negative in stage II/III/IV cervical
adenocarcinoma tissues (Fig.
8B).
Discussion
As precise medicine is developing rapidly, the
further discovery of diagnostic and prognostic biomarkers is of
utmost urgency in order to enhance the decision making for CC. Over
the years, it has been found that the decreased expression of genes
caused by hypomethylation plays a crucial role in the regulating
and developing malignant tumors. Abnormal DNA methylation is an
effective tumor marker (25,26),
which can lead to the inactivation of tumor suppressor genes,
interference with genomic imprinting and genomic instability by
reducing the formation of heterochromatin on repeat sequences
(27). A number of studies have
revealed that tumor formation is intimately associated with
aberrant DNA methylation, which can alter the expression of
proto-oncogenes and tumor suppressor genes (28-30).
The present study identified abnormal gene methylation by comparing
normal and CC samples using MethyMix. To further explore the
functions of the DNA methylation-driven genes identified, GO and
KEGG pathway enrichment analyses were performed. DNA methylation
driven gene function was enriched in molecular functions, including
immune receptor activity, cytokine activity and cytokine receptor
binding. Function analysis and pathway analysis revealed that the
function of these genes could regulate tumor cell migration,
metabolism and the cell cycle.
DNA methylation is known as a type of covalent
modification of DNA. The primary mechanism through which epigenetic
modification modulates genomic function is related to the
regulation of the expression of multiple differentiation-related
genes in mammals (31,32). In terms of high-activity promoters
with a vast range of CpG islands, on a general basis,
disease-associated or experimental methylation will lead to the
alteration of transcription factor interaction and histone
modification, as well as the cis-silencing of previously
active genes (33). Zhong and Cen
(27) proved that the abnormality
of promoter methylation was closely related to the survival and
prognosis of patients with hepatic carcinoma. Moreover, the
function could silence certain tumor suppressor genes and other key
genes which can mediate cellular signaling pathways in cancerous
tissues (27). Dong et al
(34) concluded that the promoter
methylations of RASSF1A, BVES and HOXA9 in combination with serum
alpha fetoprotein was associated with a marked improvement in the
diagnosis of patients with hepatitis B-associated hepatocellular
carcinoma (34). According to the
downregulation of tumor-repressing genes and key molecules
modulating cellular signaling pathways associated with promoter
methylation, promoter hypermethylation can suppress the expression
of liver cancer genes, which is negatively associated with gene
expression in normal and tumor tissues (25,32,35).
Recent studies on the effects of lncRNAs in tumorigenesis and
metastasis have demonstrated that lncRNAs may become potential
novel biomarkers for the diagnosis and prognosis of cancers
(27,36,37).
For example, lncRNA PVT1, as a promising serum biomarker associated
with CC detection, has been shown to facilitate CC progression by
negatively regulating miR-424(38).
As also previously demonstrated, the hypomethylation of the lncRNA
SOX21-AS1 may function as a clinical prognostic indicator in CC
(39). lncRNA NEAT1 has also been
shown to accelerate CC growth by sponging miR-9-5p (40). Another study also demonstrated that
lncRNA HOXD-AS1 regulated CC proliferation by modulating the
Ras/ERK signaling pathway (41).
In the present study, one mRNA and three lncRNAs
were identified as independent prognostic factors for the
monitoring and prognosis of CC by combining methylation, mRNA and
IncRNA expression data with survival analysis. Joint survival
analysis demonstrated that the low expression of FLT1 with
hypermethylation was associated with a higher survival rate than
the high expression of FLT1 with hypomethylation. Compared with a
high expression with hypomethylation, the low expression of MKI67,
PLEKH6 and POLE2 with hypermethylation was associated with a lower
survival rate. As a result, lncRNA MKI67, PLEKHG6 and POLE2 may
function as cancer suppressor genes under the regulation of DNA
methylation, playing crucial roles in predicting the prognosis of
CC.
FLT1 (VEGFR1) is a tyrosine kinase receptor with a
binding affinity to VEGF-A ~10-fold higher than other kinase insert
domain receptors, and it is associated with tumor growth and
metastasis (42). FLT1 activation
upgrades epithelial-mesenchymal transition, as well as an
aggressive phenotype in specific cancer cells (43). Promoter hypermethylation is known to
play a key role in the epigenetic silencing of tumor suppressor
genes in the development and progression of cancers (44). The expression level of FLT1 in
individual tissues of patients with CC differs. Therefore, FLT1 may
function as a potential biomarker for the monitoring and prognosis
of patients with CC. In the present study, the promoter methylation
levels of FLT1 were significantly upregulated in cervical squamous
cell carcinoma and adenocarcinoma compared with normal controls.
This result is consistent with the findings of another previous
experimental study on head and neck squamous cell carcinoma
(HNSCC), suggesting that the methylation levels of the FLT1
promoter tended to be higher in HNSCC than in normal tonsil samples
(45). Methylation of the FLT1
promoter has also been found to be significantly higher in tumor
tissues of prostate cancer, renal cancer, and chorio carcinoma, in
comparison with normal tissues (46-48).
In the present study, Kaplan-Meier analysis revealed that the
hypomethylation of FLT1 with a low expression predicted a longer
survival of patients with CC. The results revealed that FLT1 was
upregulated and was associated with a poor prognosis (Fig. 6). However, the experimental results
demonstrated that its expression was not inversely correlated with
DNA methylation in CC tissues (Figs.
7 and 8). This inconsistency
may be due to the expression levels determined and the cervical
tissues used in DNA methylation analysis were not from the same
patients or controls. Another possible explanation for this is that
the immunohistochemistry method on tissue sample is a
semi-quantitative method, thus not highly informative. In the
present study, FLT1 protein expression was not quantified;
therefore, further studies are required for validation. The
methylation status of the FLT1 promoter may be useful as a novel
potential biomarker for CC diagnosis. The authors aim to continue
to detect FLT1 methylation using more samples in future studies to
confirm the accuracy of the findings presented herein.
The nuclear staining of the nuclear antigen Ki-67
has the most popular application as an agent oriented with
multiplication activity. Ki-67 exists within the cell nucleus all
through cell-cycle stages which excluded the resting phase G0.
MKI67 protein is employed as a proliferation-oriented biomarker for
determining benign, malignant tumors, or the malignancy-oriented
histological grade. The percentage of Ki-67-expressing cells (Ki-67
labeling index) is used for assessing the multiplication of
neoplastic cells, as this increases in separating cells,
culminating in cells in the M phase (49-51).
Song et al (52) revealed
that hypomethylation may contribute to the overexpression of MKI67
in breast cancer and may lead to the pathological process of breast
cancer. In addition, a previous meta-analysis demonstrated that a
high expression level of MKI-67 led to the poor overall survival,
as well as illness-free survival of patients with colorectal cancer
(53). The present study
demonstrated that the high methylation level of MKI67 was
associated with a lower survival ratio of patients with CC. This
may provide a novel treatment strategy and may also aid in
improving the prognosis of patients with CC.
A previous study indicated that a high PLEKHG6
expression was related to a shorter survival time of patients with
colorectal cancer (54). A few
studies have examined the gene PLEKHG6 (55-57).
The present study demonstrated the potential of this gene as a
novel target for the monitoring and prognosis of patients with CC.
The present study revealed that PLEKHG6 expression was lower in
cervical adenocarcinoma compared with adjacent para-carcinoma
tissues using immunohistochemical analysis. It was previously
reported that POLE2 is expressed in breast cancer, colorectal
cancer, cervical and bladder cancer (58-61).
Li et al (62) reported that
lung adenocarcinoma cell malignant phenotypes were suppressed by
the knockdown of POLE2 expression. The present study found the
POLE2 gene to be a renown prognostic-related methylation-driven
genes in the CC group; the Kaplan-Meier curve revealed that
patients with POLE2 hypermethylation had a lower survival rate and
a shorter methylation survival period, which was confirmed by the
combined survival analysis.
Some limitations of the present study need to be
acknowledged. First, the present study was based only on research
data from TCGA, which may contribute to selection bias. Second, the
sample size of normal controls in TCGA was relatively small, and
only three non-CC patients were included for analysis from the
database. Third, FLT1 protein expression was not quantified.
Therefore, further studies are warranted for experimental
validation.
In conclusion, based on the genomic methylation data
provided by TCGA for patients with CC, 48 methylation-driven genes
associated with CC were obtained through the MethylMix algorithm.
Univariate and multivariate Cox regression models revealed that the
prognostic survival model constructed from four aberrant
methylation-driven genes, including FLT1, MKI67, PLEKHG6 and POLE2,
was an independent predictor for the prognosis of patients with CC.
Based on the risk model of these five methylation-driven genes,
patients with CC could be divided into a high- and a low-risk
group, which provides a basis for prognosis prediction and
personalized treatment plans. The expression levels of the genes,
FLT1, MKI67, PLEKHG6 and POLE2, may be used as independent
prognostic indicators for CC. Although further experimental
verification is needed, the findings presented herein provide the
bioinformatic and theoretical basis for guiding the subsequent
in-depth study of CC.
Supplementary Material
FLT1 CpG primer sequences.
Clinical parameters of the patients in
the present study.
Acknowledgements
Not applicable.
Funding
Funding: The present study was supported by the Chinese
Postdoctoral Science Foundation (grant no. 88014Y0181).
Availability of data and materials
The datasets used and/or analyzed during the current
study are available from the corresponding author on reasonable
request.
Authors' contributions
BL, TZ and HL wrote the manuscript. BL, YL, TZ and
HL performed the experiments. BL and BH analyzed the data. FC and
QL designed the experiments and revised the manuscript. BL and FC
confirm the authenticity of all the raw data. All authors have read
and approved the final manuscript.
Ethics approval and consent to
participate
The present study was approved by the Institutional
Review Board of the Affiliated Hospital of Qingdao University
Health Science Center Ethics Committee (approval no. QYFY WZLL
25964). All patients or their patents/guardians in the present
study provided written informed consent for participation in the
study.
Patient consent for publication
Not applicable.
Competing interests
The authors declare that they have no competing
interests.
References
|
1
|
Arbyn M, Weiderpass E, Bruni L, de Sanjosé
S, Saraiya M, Ferlay J and Bray F: Estimates of incidence and
mortality of cervical cancer in 2018: A worldwide analysis. Lancet
Glob Health. 8:e191–e203. 2020.PubMed/NCBI View Article : Google Scholar
|
|
2
|
Torre LA, Islami F, Siegel RL, Ward EM and
Jemal A: Global cancer in women: Burden and trends. Cancer
Epidemiol Biomarkers Prev. 26:444–457. 2017.PubMed/NCBI View Article : Google Scholar
|
|
3
|
Jürgenliemk-Schulz IM, Beriwal S, de Leeuw
AAC, Lindegaard JC, Nomden CN, Pötter R, Tanderup K, Viswanathan AN
and Erickson B: Management of nodal disease in advanced cervical
cancer. Semin Radiat Oncol. 29:158–165. 2019.PubMed/NCBI View Article : Google Scholar
|
|
4
|
Mohan G and Chattopadhyay S:
Cost-effectiveness of leveraging social determinants of health to
improve breast, cervical, and colorectal cancer screening: A
systematic review. JAMA Oncol. 6:1434–1444. 2020.PubMed/NCBI View Article : Google Scholar
|
|
5
|
Bogani G, Maggiore ULR, Signorelli M,
Martinelli F, Ditto A, Sabatucci I, Mosca L, Lorusso D and
Raspagliesi F: The role of human papillomavirus vaccines in
cervical cancer: Prevention and treatment. Crit Rev Oncol Hematol.
122:92–97. 2018.PubMed/NCBI View Article : Google Scholar
|
|
6
|
Marlow LAV, Chorley AJ, Haddrell J, Ferrer
R and Waller J: Understanding the heterogeneity of cervical cancer
screening non-participants: Data from a national sample of British
women. Eur J Cancer. 80:30–38. 2017.PubMed/NCBI View Article : Google Scholar
|
|
7
|
Santoni G, Morelli MB, Amantini C and
Battelli N: Urinary markers in bladder cancer: An update. Front
Oncol. 8(362)2018.PubMed/NCBI View Article : Google Scholar
|
|
8
|
Sproul D, Kitchen RR, Nestor CE, Dixon JM,
Sims AH, Harrison DJ, Ramsahoye BH and Meehan RR: Tissue of origin
determines cancer-associated CpG island promoter hypermethylation
patterns. Genome Biol. 13(R84)2012.PubMed/NCBI View Article : Google Scholar
|
|
9
|
Heery R and Schaefer MH: DNA methylation
variation along the cancer epigenome and the identification of
novel epigenetic driver events. Nucleic Acids Res. 49:12692–12705.
2021.PubMed/NCBI View Article : Google Scholar
|
|
10
|
Klutstein M, Nejman D, Greenfield R and
Cedar H: DNA methylation in cancer and aging. Cancer Res.
76:3446–3450. 2016.PubMed/NCBI View Article : Google Scholar
|
|
11
|
Moore LD, Le T and Fan G: DNA methylation
and its basic function. Neuropsychopharmacology. 38:23–38.
2013.PubMed/NCBI View Article : Google Scholar
|
|
12
|
Easwaran HP, Van Neste L, Cope L, Sen S,
Mohammad HP, Pageau GJ, Lawrence JB, Herman JG, Schuebel KE and
Baylin SB: Aberrant silencing of cancer-related genes by CpG
hypermethylation occurs independently of their spatial organization
in the nucleus. Cancer Res. 70:8015–8024. 2010.PubMed/NCBI View Article : Google Scholar
|
|
13
|
Bogdanović O and Lister R: DNA methylation
and the preservation of cell identity. Curr Opin Genet Dev.
46:9–14. 2017.PubMed/NCBI View Article : Google Scholar
|
|
14
|
Clarke MA, Luhn P, Gage JC, Bodelon C,
Dunn ST, Walker J, Zuna R, Hewitt S, Killian JK, Yan L, et al:
Discovery and validation of candidate host DNA methylation markers
for detection of cervical precancer and cancer. Int J Cancer.
141:701–710. 2017.PubMed/NCBI View Article : Google Scholar
|
|
15
|
Yue Y, Zhou K, Li J, Jiang S, Li C and Men
H: MSX1 induces G0/G1 arrest and apoptosis by suppressing Notch
signaling and is frequently methylated in cervical cancer. Onco
Targets Ther. 11:4769–4780. 2018.PubMed/NCBI View Article : Google Scholar
|
|
16
|
Liu J, Nie S, Li S, Meng H, Sun R, Yang J
and Cheng W: Methylation-driven genes and their prognostic value in
cervical squamous cell carcinoma. Ann Transl Med.
8(868)2020.PubMed/NCBI View Article : Google Scholar
|
|
17
|
Yu J, Xie Y, Liu Y, Wang F, Li M and Qi J:
MBD2 and EZH2 regulate the expression of SFRP1 without affecting
its methylation status in a colorectal cancer cell line. Exp Ther
Med. 20(242)2020.PubMed/NCBI View Article : Google Scholar
|
|
18
|
Hall CL, Bafico A, Dai J, Aaronson SA and
Keller ET: Prostate cancer cells promote osteoblastic bone
metastases through Wnts. Cancer Res. 65:7554–7560. 2005.PubMed/NCBI View Article : Google Scholar
|
|
19
|
Planutiene M, Planutis K and Holcombe RF:
Lymphoid enhancer-binding factor 1, a representative of
vertebrate-specific Lef1/Tcf1 sub-family, is a Wnt-beta-catenin
pathway target gene in human endothelial cells which regulates
matrix metalloproteinase-2 expression and promotes endothelial cell
invasion. Vasc Cell. 3(28)2011.PubMed/NCBI View Article : Google Scholar
|
|
20
|
Guo YH, Wang LQ, Li B, Xu H, Yang JH,
Zheng LS, Yu P, Zhou AD, Zhang Y, Xie SJ, et al: Wnt/β-catenin
pathway transactivates microRNA-150 that promotes EMT of colorectal
cancer cells by suppressing CREB signaling. Oncotarget.
7:42513–42526. 2016.PubMed/NCBI View Article : Google Scholar
|
|
21
|
Liu Z, Wan Y, Yang M, Qi X, Dong Z, Huang
J and Xu J: Identification of methylation-driven genes related to
the prognosis of papillary renal cell carcinoma: A study based on
the cancer genome atlas. Cancer Cell Int. 20(235)2020.PubMed/NCBI View Article : Google Scholar
|
|
22
|
Lv L, Cao L, Hu G, Shen Q and Wu J:
Methylation-driven genes identified as novel prognostic indicators
for thyroid carcinoma. Front Genet. 11(294)2020.PubMed/NCBI View Article : Google Scholar
|
|
23
|
Han P, Liu Q and Xiang J: Monitoring
methylation-driven genes as prognostic biomarkers in patients with
lung squamous cell cancer. Oncol Lett. 19:707–716. 2020.PubMed/NCBI View Article : Google Scholar
|
|
24
|
Lando M, Fjeldbo CS, Wilting SM, Snoek BC,
Aarnes EK, Forsberg MF, Kristensen GB, Steenbergen RD and Lyng H:
Interplay between promoter methylation and chromosomal loss in gene
silencing at 3p11-p14 in cervical cancer. Epigenetics. 10:970–980.
2015.PubMed/NCBI View Article : Google Scholar
|
|
25
|
Feinberg AP: Phenotypic plasticity and the
epigenetics of human disease. Nature. 447:433–440. 2007.PubMed/NCBI View Article : Google Scholar
|
|
26
|
Wang N, Wang J, Meng X, Li T, Wang S and
Bao Y: The Pharmacological effects of spatholobi caulis tannin in
cervical cancer and its precise therapeutic effect on related
circRNA. Mol Ther Oncolytics. 14:121–129. 2019.PubMed/NCBI View Article : Google Scholar
|
|
27
|
Zhong D and Cen H: Aberrant promoter
methylation profiles and association with survival in patients with
hepatocellular carcinoma. Onco Targets Ther. 10:2501–2509.
2017.PubMed/NCBI View Article : Google Scholar
|
|
28
|
Cui J, Yin Y, Ma Q, Wang G, Olman V, Zhang
Y, Chou WC, Hong CS, Zhang C, Cao S, et al: Comprehensive
characterization of the genomic alterations in human gastric
cancer. Int J Cancer. 137:86–95. 2015.PubMed/NCBI View Article : Google Scholar
|
|
29
|
Nones K, Waddell N, Song S, Patch AM,
Miller D, Johns A, Wu J, Kassahn KS, Wood D, Bailey P, et al:
Genome-wide DNA methylation patterns in pancreatic ductal
adenocarcinoma reveal epigenetic deregulation of SLIT-ROBO, ITGA2
and MET signaling. Int J Cancer. 135:1110–1118. 2014.PubMed/NCBI View Article : Google Scholar
|
|
30
|
Wang G, Luo X, Wang J, Wan J, Xia S, Zhu
H, Qian J and Wang Y: MeDReaders: A database for transcription
factors that bind to methylated DNA. Nucleic Acids Res.
46:D146–D151. 2018.PubMed/NCBI View Article : Google Scholar
|
|
31
|
Rasmussen KD and Helin K: Role of TET
enzymes in DNA methylation, development, and cancer. Genes Dev.
30:733–750. 2016.PubMed/NCBI View Article : Google Scholar
|
|
32
|
Jones PA and Liang G: Rethinking how DNA
methylation patterns are maintained. Nat Rev Genet. 10:805–811.
2009.PubMed/NCBI View Article : Google Scholar
|
|
33
|
Yang X, Gao L and Zhang S: Comparative
pan-cancer DNA methylation analysis reveals cancer common and
specific patterns. Brief Bioinform. 18:761–773. 2017.PubMed/NCBI View Article : Google Scholar
|
|
34
|
Dong X, Hou Q, Chen Y and Wang X:
Diagnostic value of the methylation of multiple gene promoters in
serum in hepatitis B virus-related hepatocellular carcinoma. Dis
Markers. 2017(2929381)2017.PubMed/NCBI View Article : Google Scholar
|
|
35
|
Long J, Chen P, Lin J, Bai Y, Yang X, Bian
J, Lin Y, Wang D, Yang X, Zheng Y, et al: DNA methylation-driven
genes for constructing diagnostic, prognostic, and recurrence
models for hepatocellular carcinoma. Theranostics. 9:7251–7267.
2019.PubMed/NCBI View Article : Google Scholar
|
|
36
|
Bhan A, Soleimani M and Mandal SS: Long
noncoding RNA and cancer: A new paradigm. Cancer Res. 77:3965–3981.
2017.PubMed/NCBI View Article : Google Scholar
|
|
37
|
Yu J, Wu X, Huang K, Zhu M, Zhang X, Zhang
Y, Chen S, Xu X and Zhang Q: Bioinformatics identification of
lncRNA biomarkers associated with the progression of esophageal
squamous cell carcinoma. Mol Med Rep. 19:5309–5320. 2019.PubMed/NCBI View Article : Google Scholar
|
|
38
|
Chang QQ, Chen CY, Chen Z and Chang S:
LncRNA PVT1 promotes proliferation and invasion through enhancing
Smad3 expression by sponging miR-140-5p in cervical cancer. Radiol
Oncol. 53:443–452. 2019.PubMed/NCBI View Article : Google Scholar
|
|
39
|
Wang R, Li Y, Du P, Zhang X, Li X and
Cheng G: Hypomethylation of the lncRNA SOX21-AS1 has clinical
prognostic value in cervical cancer. Life Sci.
233(116708)2019.PubMed/NCBI View Article : Google Scholar
|
|
40
|
Xie Q, Lin S, Zheng M, Cai Q and Tu Y:
Long noncoding RNA NEAT1 promotes the growth of cervical cancer
cells via sponging miR-9-5p. Biochem Cell Biol. 97:100–108.
2019.PubMed/NCBI View Article : Google Scholar
|
|
41
|
Hu YC, Wang AM, Lu JK, Cen R and Liu LL:
Long noncoding RNA HOXD-AS1 regulates proliferation of cervical
cancer cells by activating Ras/ERK signaling pathway. Eur Rev Med
Pharmacol Sci. 21:5049–5055. 2017.PubMed/NCBI View Article : Google Scholar
|
|
42
|
Wei SC, Liang JT, Tsao PN, Hsieh FJ, Yu SC
and Wong JM: Preoperative serum placenta growth factor level is a
prognostic biomarker in colorectal cancer. Dis Colon Rectum.
52:1630–1636. 2009.PubMed/NCBI View Article : Google Scholar
|
|
43
|
Han L, Husaiyin S, Ma C, Wang L and Niyazi
M: TNFAIP8L1 and FLT1 polymorphisms alter the susceptibility to
cervical cancer amongst uyghur females in China. Biosci Rep.
39(BSR20191155)2019.PubMed/NCBI View Article : Google Scholar
|
|
44
|
Wang YQ, Li YM, Li X, Liu T, Liu XK, Zhang
JQ, Guo JW, Guo LY and Qiao L: Hypermethylation of TGF-β1 gene
promoter in gastric cancer. World J Gastroenterol. 19:5557–5564.
2013.PubMed/NCBI View Article : Google Scholar
|
|
45
|
Misawa Y, Misawa K, Kawasaki H, Imai A,
Mochizuki D, Ishikawa R, Endo S, Mima M, Kanazawa T, Iwashita T and
Mineta H: Evaluation of epigenetic inactivation of vascular
endothelial growth factor receptors in head and neck squamous cell
carcinoma. Tumour Biol. 39(1010428317711657)2017.PubMed/NCBI View Article : Google Scholar
|
|
46
|
Yamada Y, Watanabe M, Yamanaka M, Hirokawa
Y, Suzuki H, Takagi A, Matsuzaki T, Sugimura Y, Yatani R and
Shiraishi T: Aberrant methylation of the vascular endothelial
growth factor receptor-1 gene in prostate cancer. Cancer Sci.
94:536–539. 2003.PubMed/NCBI View Article : Google Scholar
|
|
47
|
Kim JY, Hwang J, Lee SH, Lee HJ, Jelinek
J, Jeong H, Lim JS, Kim JM, Song KS, Kim BH, et al: Decreased
efficacy of drugs targeting the vascular endothelial growth factor
pathway by the epigenetic silencing of FLT1 in renal cancer cells.
Clin Epigenetics. 7(99)2015.PubMed/NCBI View Article : Google Scholar
|
|
48
|
Sasagawa T, Jinno-Oue A, Nagamatsu T,
Morita K, Tsuruga T, Mori-Uchino M, Fujii T and Shibuya M:
Production of an anti-angiogenic factor sFLT1 is suppressed via
promoter hypermethylation of FLT1 gene in choriocarcinoma cells.
BMC Cancer. 20(112)2020.PubMed/NCBI View Article : Google Scholar
|
|
49
|
Soliman NA and Yussif SM: Ki-67 as a
prognostic marker according to breast cancer molecular subtype.
Cancer Biol Med. 13:496–504. 2016.
|
|
50
|
Li R, Heydon K, Hammond ME, Grignon DJ,
Roach M III, Wolkov HB, Sandler HM, Shipley WU and Pollack A: Ki-67
staining index predicts distant metastasis and survival in locally
advanced prostate cancer treated with radiotherapy: An analysis of
patients in radiation therapy oncology group protocol 86-10. Clin
Cancer Res. 10:4118–4124. 2004.PubMed/NCBI View Article : Google Scholar
|
|
51
|
Wong E, Nahar N, Hau E, Varikatt W, Gebski
V, Ng T, Jayamohan J and Sundaresan P: Cut-point for Ki-67
proliferation index as a prognostic marker for glioblastoma. Asia
Pac J Clin Oncol. 15:5–9. 2019.PubMed/NCBI View Article : Google Scholar
|
|
52
|
Song B, Wang L, Zhang Y, Li N, Dai H, Xu
H, Cai H and Yan J: Combined detection of HER2, Ki67, and GSTP1
genes on the diagnosis and prognosis of breast cancer. Cancer
Biother Radiopharm. 34:85–90. 2019.PubMed/NCBI View Article : Google Scholar
|
|
53
|
Zhang SD, McCrudden CM, Meng C, Lin Y and
Kwok HF: The significance of combining VEGFA, FLT1, and KDR
expressions in colon cancer patient prognosis and predicting
response to bevacizumab. Onco Targets Ther. 8:835–843.
2015.PubMed/NCBI View Article : Google Scholar
|
|
54
|
Zhang P, Ma Y, Wang F, Yang J, Liu Z, Peng
J and Qin H: Comprehensive gene and microRNA expression profiling
reveals the crucial role of hsa-let-7i and its target genes in
colorectal cancer metastasis. Mol Biol Rep. 39:1471–1478.
2012.PubMed/NCBI View Article : Google Scholar
|
|
55
|
O'Neill AC, Kyrousi C, Klaus J, Leventer
RJ, Kirk EP, Fry A, Pilz DT, Morgan T, Jenkins ZA, Drukker M, et
al: A primate-specific isoform of PLEKHG6 regulates neurogenesis
and neuronal migration. Cell Rep. 25:2729–2741. 2018.PubMed/NCBI View Article : Google Scholar
|
|
56
|
D'Angelo R, Aresta S, Blangy A, Del
Maestro L, Louvard D and Arpin M: Interaction of ezrin with the
novel guanine nucleotide exchange factor PLEKHG6 promotes
RhoG-dependent apical cytoskeleton rearrangements in epithelial
cells. Mol Biol Cell. 18:4780–4793. 2007.PubMed/NCBI View Article : Google Scholar
|
|
57
|
Jiao M, Wu D and Wei Q: Myosin
II-interacting guanine nucleotide exchange factor promotes bleb
retraction via stimulating cortex reassembly at the bleb membrane.
Mol Biol Cell. 29:643–656. 2018.PubMed/NCBI View Article : Google Scholar
|
|
58
|
Wu Z, Wang YM, Dai Y and Chen LA: POLE2
Serves as a prognostic biomarker and is associated with immune
infiltration in squamous cell lung cancer. Med Sci Monit.
26(e921430)2020.PubMed/NCBI View Article : Google Scholar
|
|
59
|
Rogers RF, Walton MI, Cherry DL, Collins
I, Clarke PA, Garrett MD and Workman P: CHK1 inhibition is
synthetically lethal with loss of B-family DNA polymerase function
in human lung and colorectal cancer cells. Cancer Res.
80:1735–1747. 2020.PubMed/NCBI View Article : Google Scholar
|
|
60
|
Liu D, Zhang XX, Xi BX, Wan DY, Li L, Zhou
J, Wang W, Ma D, Wang H and Gao QL: Sine oculis homeobox homolog 1
promotes DNA replication and cell proliferation in cervical cancer.
Int J Oncol. 45:1232–1240. 2014.PubMed/NCBI View Article : Google Scholar
|
|
61
|
Zekri AR, Hassan ZK, Bahnassy AA, Khaled
HM, El-Rouby MN, Haggag RM and Abu-Taleb FM: Differentially
expressed genes in metastatic advanced Egyptian bladder cancer.
Asian Pac J Cancer Prev. 16:3543–3549. 2015.PubMed/NCBI View Article : Google Scholar
|
|
62
|
Li J, Wang J, Yu J, Zhao Y, Dong Y, Fan Y,
Li N, Zhang Y and Wang Y: Knockdown of POLE2 expression suppresses
lung adenocarcinoma cell malignant phenotypes in vitro.
Oncol Rep. 40:2477–2486. 2018.PubMed/NCBI View Article : Google Scholar
|