Introduction
Pancreatic cancer (PCa) is a uniformly lethal
disease and is the 4th leading cause of cancer death in the USA
with >30,000 estimated deaths per year. In recent years, the
morbidity rate if PCa is gradually increasing in China. The
majority of patients diagnosed with PCa succumb to the disease
within months, and the 5-year survival rate is only 3–4% after
diagnosis (1). Therefore, the
diagnosis of PCa at an early stage or resectable phase is
imperative in order to offer the best outcomes. The optimal
approach for the early detection of PCa remains unknown. Molecular
biomarkers may lead not only to the earlier diagnosis of pancreatic
tumors but also to the more accurate diagnosis of these neoplasms
(2). Unfortunately, tumor markers
used for the auxiliary diagnosis of PCa in clinical practice do not
have sufficient sensitivity and specificity to be applied to
screening an asymptomatic population for the purpose of early
detection. CA19-9, the widely used tumor marker for PCa, may be
valuable for monitoring the therapeutic response of patients with
PCa with an elevated serum CA19-9 level (3) and is considered the best test for
PCa (4). However, approximately
10–15% of individuals can not secrete CA19-9 due to their negative
Lewis antigen status. In addition, CA19-9 levels may be within the
normal range while the tumor is small, asymptomatic and may be
elevated in non-neoplastic conditions, such as hepatitis, benign
biliary or pancreatic disease, greatly diminishing its specificity
(2,5). The sensitivity of CA19-9 is
approximately 80%, limiting its use for screening purposes,
particularly for the diagnosis of resectable PCa (6). Since the majority of individuals
with PCa have a poor prognosis, it is imperative to discover early
detection strategies.
Technologies applied in proteomics research, in
particular surface-enhanced laser desorption/ionization
time-of-flight mass spectrometry (SELDI-TOF-MS) and protein array
techniques, are considered to be moving from research-focused
applications to clinical laboratories as routine instruments for
protein analysis (7).
SELDI-TOF-MS profiling has the potential to be a safe and accurate
diagnostic application in conjunction with conventional diagnostic
methods for PCa (8). Although a
number of possible serological tumor markers for PCa have been
identified using the SELDI-TOF technique (9–14),
few have been utilized as routine detection markers in oncological
practice, and none have been thought to be valuable for PCa
diagnosis. A previous study has reported that Chinese PCa patients
may have different K-ras and p53 expressions from other populations
(15). Different molecular
characteristics may be concealed in serum profiling for a different
racial population. Our study differs from previous reports as a
larger number of early-stage PCa samples (stage Ia and Ib) and a
larger sample size were employed. The support vector machine (SVM)
algorithm was used to analyze our raw data by comparing it with 2
other algorithms, the k-nearest neighbors (KNN) algorithm and the
artificial neural network (ANN). Our study may provide a valuable
clue for the early diagnosis of PCa.
Materials and methods
Sample collection and preparation
All samples were obtained from the Cancer Hospital
of Peking Union Medical College (PUMC), Chinese Academy of Medical
Sciences (CAMS), Beijing, China. The protocols of serum
procurement, data management and blood collection were carried out
as previously described (16).
The Ethics Committee of the Cancer Hospital of PUMC and CAMS
reviewed and approved our experimental procedures. Blood specimens
from patients diagnosed with PCa were procured from the Department
of Abdominal Surgery at the Cancer Hospital of PUMC. All healthy
serum samples were obtained from volunteers for free clinic
screening open to the general public. Only pre-treatment samples
obtained at the time of PCa diagnosis were used for this study.
After obtaining informed consent from the patients, ∼3 ml of whole
blood were collected into a vacuum blood collection tube (red top
tube, BD Biosciences) and centrifuged 1,000 x g for 10 min at 4°C,
and the supernatant was transferred into a fresh 2 ml EP tube and
centrifuged 10,000 x g for 10 min at 4°C. To avoid repeated
freeze-thaw cycles, 50 μl serum aliquots were refrozen at −80°C
until needed. These proceedings lasted for no more than 3 h. A
quality control (QC) sample was prepared by pooling an equal amount
of serum from 50 specimens from age-matched healthy individuals.
The QC sample was used to determine reproducibility and as a
control protein profile for each SELDI experiment. A
self-administered questionnaire was collected from each patient and
included information such as gender, age, smoking and alcohol
usage, as well as medical history. All sera were labeled with a
unique number to protect the confidentiality of the patient. None
of the samples were thawed more than twice before analysis.
The detailed characteristics of the healthy controls
(HCs) and PCa patients are listed in Table I. The serum samples were divided
into 2 groups to yield a training cohort comprising of 30 patients
with pathological and (or) cytological evidence of PCa
(CA19-9>300 U/ml) and 39 HCs with no evidence of disease, as
well as a test cohort comprising of 130 serum samples including 28
HCs and 102 PCa patients. We hypothesized that sera with a high
CA19-9 value would possibly lead to the identification of potential
cancer biomarkers. The clinical staging was based on the American
Joint Committee on Cancer TNM classification of malignant cancers
(version 6, published in 2002). A total of 28 early PCa (stage I)
samples were employed in this study. The serum samples of other
types of cancer of the digestive systemm, including 12
hepatocellular carcinomas (HCCs), 3 colorectal carcinomas and 6
gastric cancers were prepared for blinded validation with the
pancreatic SELDI diagnostic pattern.
 | Table I.Clinical characteristics of PCa
patients and and healthy individuals. |
Table I.
Clinical characteristics of PCa
patients and and healthy individuals.
| Clinical
characteristics | Training set
| Test set
|
|---|
| No. | Age range | Mean age | Falsely
classifieda | No. | Age range | Mean age | Falsely
classifieda |
|---|
| HC gender | | | | | | | | |
| Female | 16 | 25–70 | 44.2 | 0 | 15 | 26–65 | 42.2 | 2 |
| Male | 23 | 35–77 | 52.1 | 0 | 13 | 32–57 | 40.5 | 4 |
| PCa gender | | | | | | | | |
| Female | 12 | 42–65 | 55.1 | 0 | 37 | 25–72 | 55.5 | 2 |
| Male | 18 | 43–75 | 62.8 | 1 | 65 | 37–85 | 59.1 | 5 |
| PCa location | | | | | | | | |
| Bulb | 2 | 43–69 | 56.0 | 0 | 21 | 34–73 | 56.5 | 2 |
| Cervix | 1 | 64 | 64.0 | 1 | 1 | 63 | 63.0 | 0 |
| Cervix and
body | 5 | 50–69 | 58.4 | 0 | 3 | 51–68 | 61.0 | 0 |
| Body | 0 | 0 | 0 | 0 | 3 | 39–62 | 51.3 | 0 |
| Body and
tail | 4 | 42–75 | 59.5 | 0 | 15 | 25–82 | 60.5 | 1 |
| Head | 18 | 46–75 | 60.3 | 0 | 59 | 37–85 | 57.6 | 4 |
| PCa diagnosis | | | | | | | | |
| Pathology | 21 | 42–75 | 59.4 | 1 | 46 | 34–82 | 55.8 | 6 |
| Cytology | 15 | 53–75 | 61.5 | 0 | 26 | 25–85 | 55.4 | 1 |
| Clinic | 0 | 0 | 0 | 0 | 36 | 37–73 | 59.3 | 0 |
| PCa pathological
types | | | | | | | | |
| Duct
adenocarcinoma | 28 | 42–75 | 59.1 | 1 | 59 | 25–85 | 56.9 | 6 |
|
Cystadenocarcinoma | 0 | 0 | 0 | 0 | 1 | 71 | 71.0 | |
| Signet-ring cell
carcinoma | 1 | 75 | 75.0 | 0 | 0 | 0 | 0 | 0 |
| Mucinous
adenocarcinoma | 1 | 62 | 62.0 | 0 | 0 | 0 | 0 | 0 |
| Adenosquamous
carcinoma | 0 | 0 | 0 | 0 | 5 | 37–75 | 52.0 | 0 |
| Carcinoma
sarcomatodes | 0 | 0 | 0 | 0 | 1 | 56 | 56.0 | 1 |
| Unclear | 0 | 0 | 0 | 0 | 36 | 37–73 | 59.3 | 0 |
| PCa pathological
differentiation | | | | | | | | |
| Well | 1 | 62 | 62.0 | 0 | 5 | 44–68 | 56.4 | 1 |
| Well and
moderate | 0 | 0 | 0 | 0 | 5 | 43–77 | 62.6 | 0 |
| Moderate | 6 | 42–69 | 55.2 | 1 | 18 | 37–75 | 54.3 | 2 |
| Moderate and
poor | 1 | 61 | 61.0 | 0 | 7 | 34–70 | 53.6 | 0 |
|
Poor-differentiated | 5 | 49–61 | 58.0 | 0 | 6 | 25–73 | 48.5 | 1 |
| Not reported | 17 | 46–75 | 61.6 | 0 | 25 | 37–85 | 60.0 | 3 |
| PCa staging | | | | | | | | |
| Ia | 0 | 0 | 0 | 0 | 12 | 37–77 | 55.7 | 0 |
| Ib | 0 | 0 | 0 | 0 | 16 | 25–74 | 52.6 | 3 |
| IIa | 0 | 0 | 0 | 0 | 16 | 42–85 | 60.3 | 2 |
| IIb | 10 | 43–69 | 58.2 | 1 | 6 | 49–71 | 60.0 | 0 |
| III | 13 | 50–75 | 61.5 | 0 | 33 | 37–82 | 57.6 | 1 |
| IV | 7 | 42–75 | 58.7 | 0 | 19 | 39–73 | 60.9 | 1 |
SELDI-TOF protein analysis
CM10 array (Ciphergen Biosystems, Fremont, CA), an
advanced weak cation exchange (WCX) array, was used for serum
protein profiling. All serum specimens were thawed in wet ice and
then centrifuged at 10,000 x g for 2 min. The supernatants were
retained on ice immediately. A total of 10 μl of U9 buffer [9 M
urea, 2% CHAPS, 1% dithiothreitol (DTT)] was added to 5 μl of each
serum sample in the 96-well cell culture plate, which was then
agitated on a platform shaker at 600 x g at 4°C for 30 min. CM10
chips were activated by adding 200 μl of sodium acetate and
agitated for 5 min twice. Next, 185 μl of sodium acetate (100 mM,
pH 4) were added to the U9/serum mixture and the mixture was
further agitated on a platform shaker for 2 min. Diluted samples
(100 μl) were applied to each spot of protein chip immobilized on
the bioprocessor (Ciphergen Biosystems). The bioprocessor was then
sealed and agitated on a platform shaker for 1 h at 600 x g at 4°C.
The excess of serum mixtures was discarded. The chips were then
washed 3 times with 200 μl of sodium acetate and another 2 times
with HPLC graded water. Finally, the chips were unloaded from the
bioprocessor and air-dried. Prior to the SELDI-TOF-MS analysis, 1
μl of saturated solution of 50% sinapinic acid (SPA) in 50%
acetonitrile and 0.1% trifluoroacetic acid were applied onto each
chip spot twice and the chips were air dried again.
Arrays were measured by a PBS II ProteinChip Reader
(Ciphergen Biosystems) using an automated data collection protocol.
The settings of the instrument were as follows: a high mass of
mass-to-charge ratio (m/z) 100,000, an optimization range of m/z
2,000–20,000, a laser intensity of 180 units, a detector
sensitivity of 7, a focus mass of m/z 9,000 (by optimization
center) and a mass deflector of m/z 1,000. The SELDI acquisition
parameters were set to 20, Δ to 4, transients/to 9, and ending
position to 80. Mass accuracy was calibrated to <0.1% with the
all-in-one peptide molecular mass standard (Ciphergen
Biosystems).
Bioinformatics and biostatistics
The mass spectra obtained from the spectrometer were
first processed using Ciphergen ProteinChip software version 3.2.0
for baseline subtraction and automatic peak detection. Baseline
subtraction is performed on a spectrum in isolation to eliminate
any baseline signal that is caused mainly by chemical noise.
Qualified mass peaks (signal-to-noise ratio >4) with m/z between
2,000–20,000 were automatically detected. Peak clusters were
completed with second-pass peak selection (signal-to-noise ratio
>2, within a 0.3% mass window), and estimated peaks were added.
The peak intensities were normalized to the total ion current of
m/z between 2,000–20,000. The co-efficient of variance (CV) of the
QC serum was calculated using the Biomarker Wizard software
package.
Univariate analysis was performed between the groups
using the Wilcoxon test and the results were considered
significantly different when the P-value was <0.05. For each
putative marker and panel, receiver operating characteristic (ROC)
curves were generated to evaluate their discriminatory power.
To discriminate between patients with PCa and
healthy individuals, the diagnosis pattern was established with the
following procedure: the raw data analysis was performed by the
Zhejiang University, Cancer Institute-ProteinChip Data Analysis
System (ZUCI-PDAS) (www.zlzx.net) (17). Briefly, after obtaining the
registered account number, we uploaded our raw data to the
ZUCI-PDAS server in the ‘.xml’ format transformed by the
ProteinChip software for each profiling, and the ‘sample.txt’ and
‘group.txt’ files arranged according to the requirements were
uploaded. In this process, it was necessary to emphasize that the
uploaded data were the raw data without baseline correction, as a
previous study indicated that the baseline correction prevented
reproduction of their initial results (18). The data were first analyzed using
the undecimated discrete wavelet transform (UDWT) method to denoise
the signals (19). The spectra
were subjected to baseline correction by aligning with a monotone
local minimum curve and mass calibration by adjusting the intensity
and mass/charge scale according to 3 labeled peaks that appear in
all the selected spectra. The parameters were designated as
follows: the top 10 significant peaks were selected; the
signal-to-noise ratio was not <4; the algorithm was SVM; the
minimal percentage of each peak appearing in all spectra was 10 and
the mass size window was not >0.3%. The leave-one-out
cross-validation approach was applied in order to estimate the
accuracy of this classifier. The SVM model with the highest
Youden’s index was selected as the model for detecting pancreatic
carcinoma and the remote server was then run. For the final step,
the spectrum data in the test set were updated onto the server in
the ‘.xml’ format, and the named ‘Trainfact’ and ‘TestFact’ files
generated in the training procedure were uploaded. The training and
test results were downloaded online when the analysis was
completed. All the procedures of the panel construction and
validation for the new test set were performed conveniently by the
ZUCI-PDAS.
In order to evaluate which algorithm was more
suitable to our data, we compared the performance of SVM, KNN and
ANN using ROC curves. The ROC curves were generated with the ROCR
package of the R-project free available software version 2.3.1
(20) (www.r-project.org).
Results
QC and reproducibility
The QC serum sample, 50 pooled sera from healthy
individuals, was used to determine reproducibility and as a control
protein profile for each SELDI experiment. QC spectra selected from
the course of the analysis, were used to calculate the CV of
intensity and mass/charge (mass drift). The range of intensity CV
for the 25 selected peak heights was from 12.6–30.2% and the mean
was 20%; the range of mass/charge CV was from 0.04–0.0797% and the
mean was 0.05% (data not shown).
Peak detection and evaluation of
candidate diagnosis pattern
In the training cohort, a total of 105 significant
peaks (P<0.01) were found using the Wilcoxon test after noise
filtering, normalization, alignment and peak cluster detection.
These peaks were ranked according to the P-value of the Wilcoxon
rank sum test. The P-values of the top 10 significant peaks were
all <10−8. The top ten peaks were 4390, 8773, 7775,
8567, 5362, 4141, 4080, 4289, 5344 and 8661 dalton (Da). The SVM
analyzed the sensitivity and specificity of the random combination
of these peaks as a classifier to discriminate between PCa and HC
samples. The peak combination with the highest accuracy was
selected as the candidate biomarker diagnosis pattern. Finally,
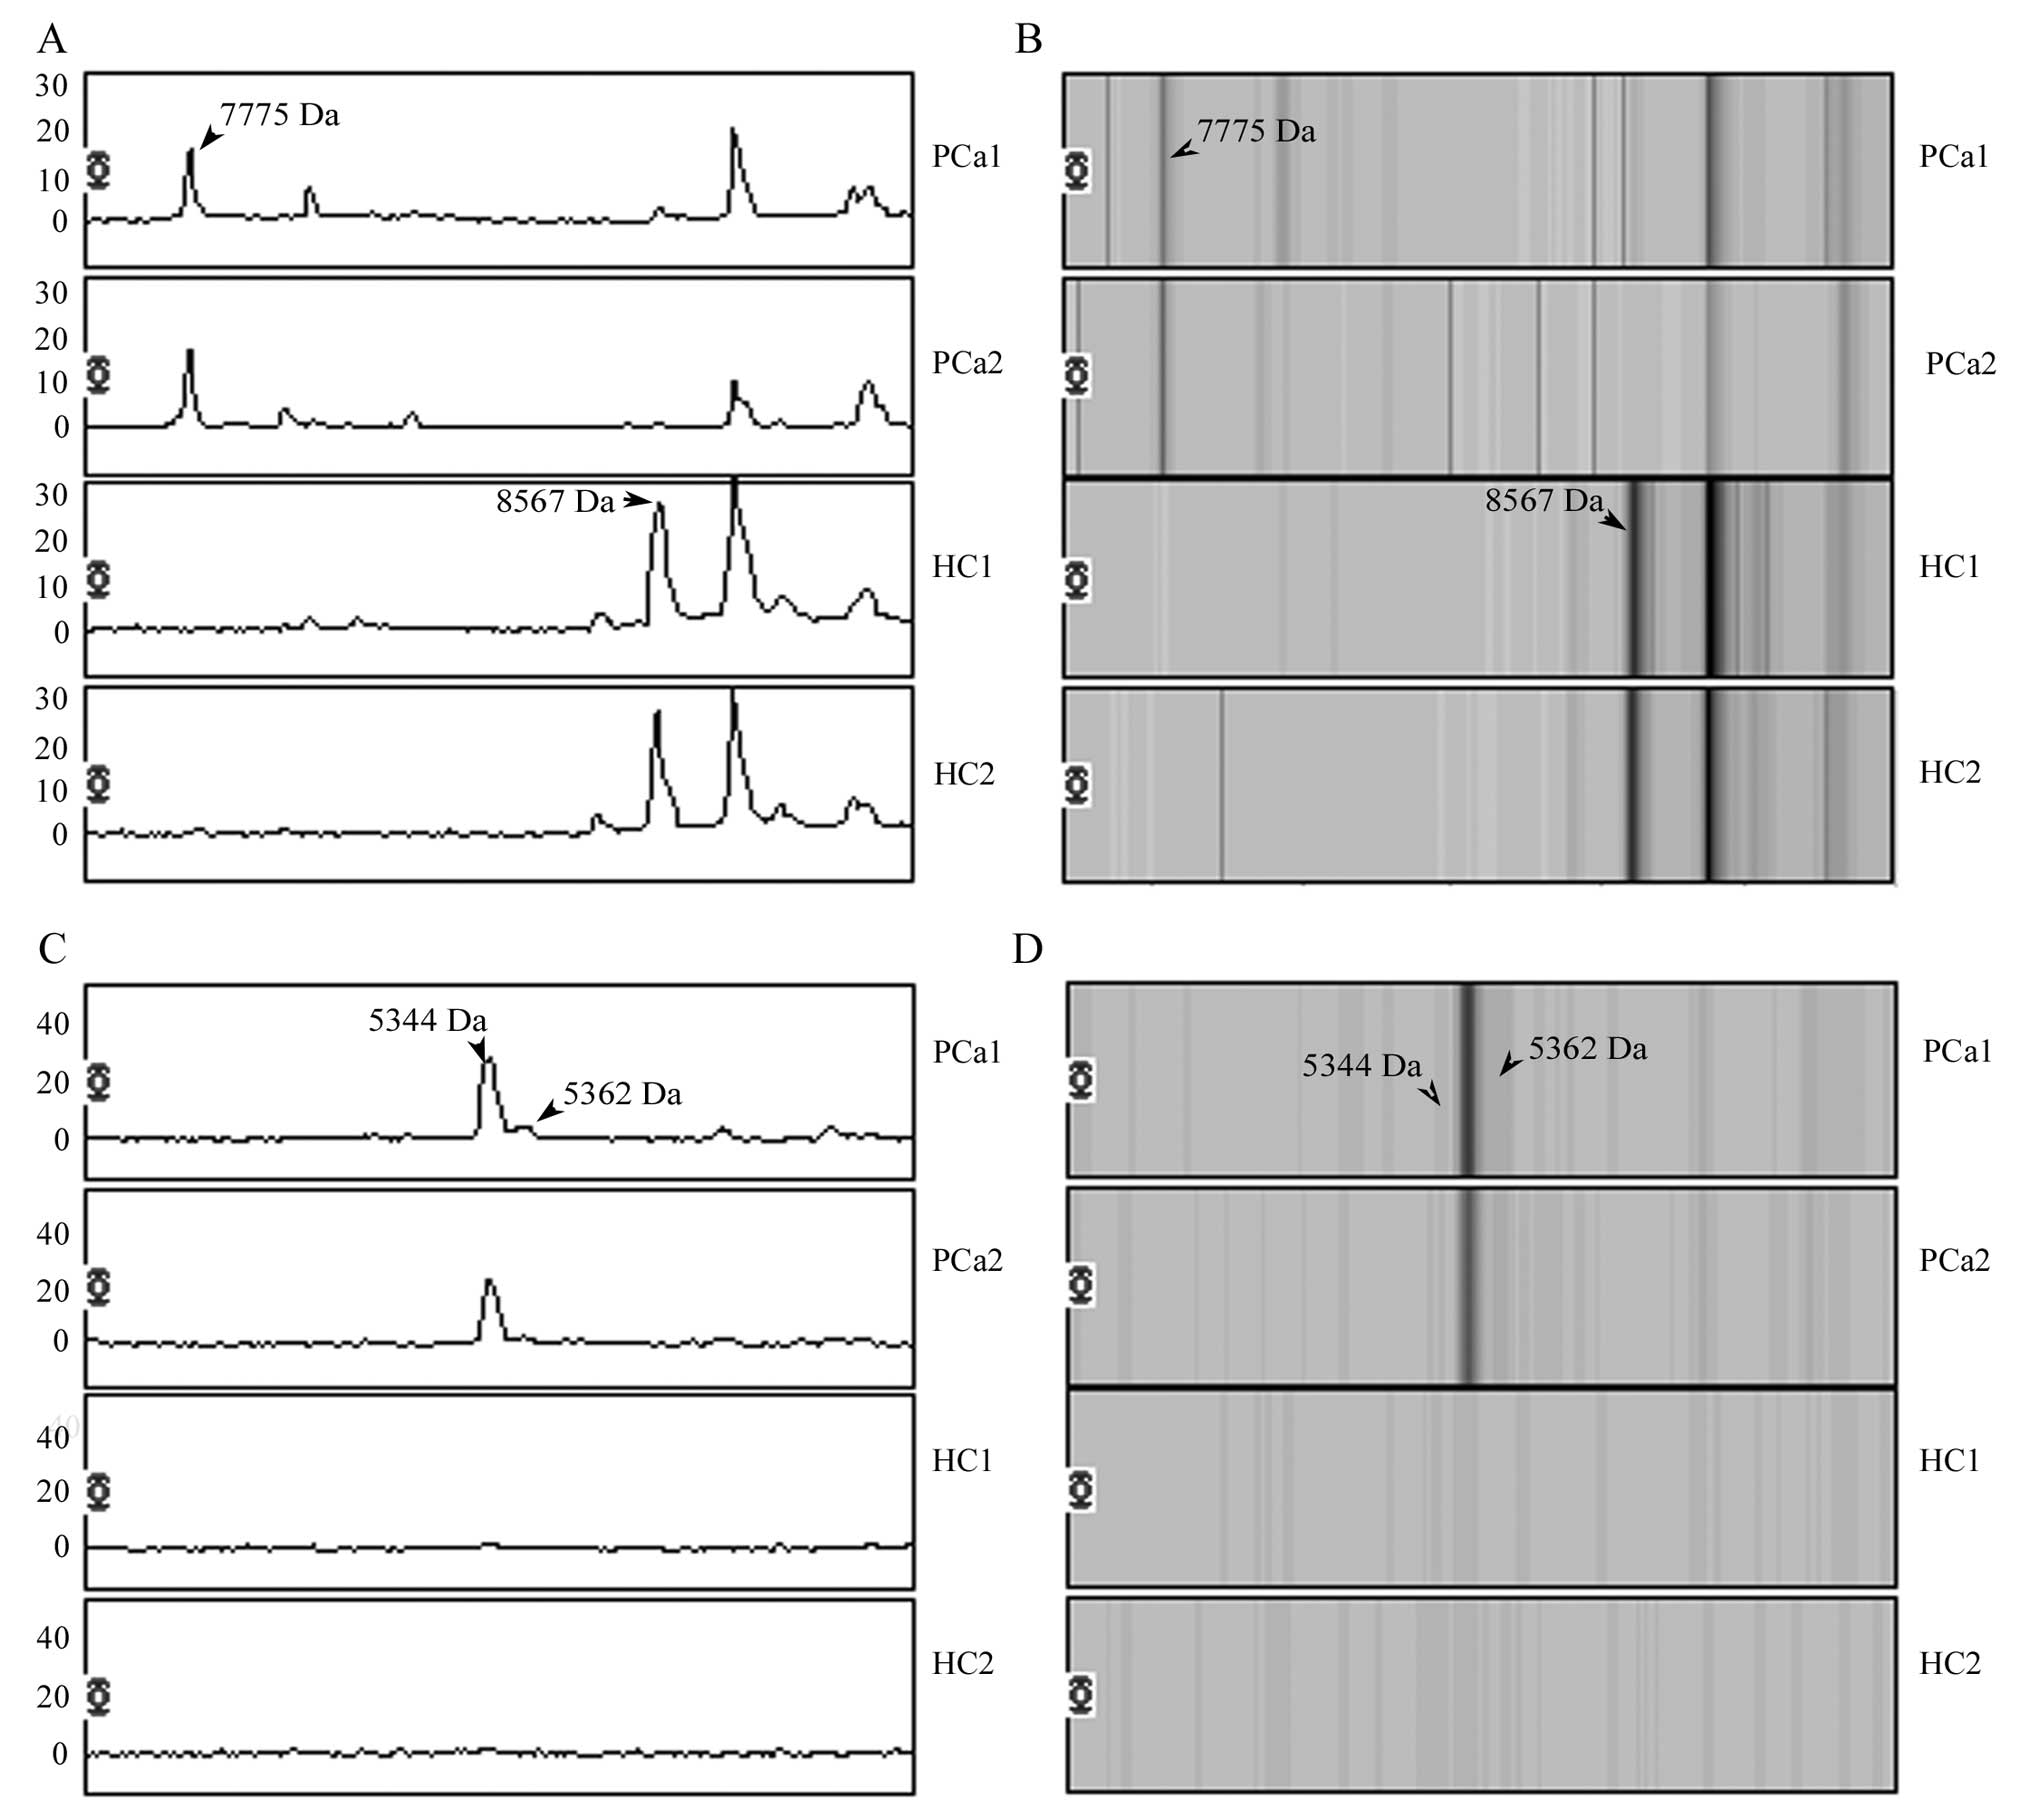
7775, 8567, 5362 and 5344 Da formed the potential biomarker
pattern. The peaks of 7775, 5362 and 5344 Da were all upregulated
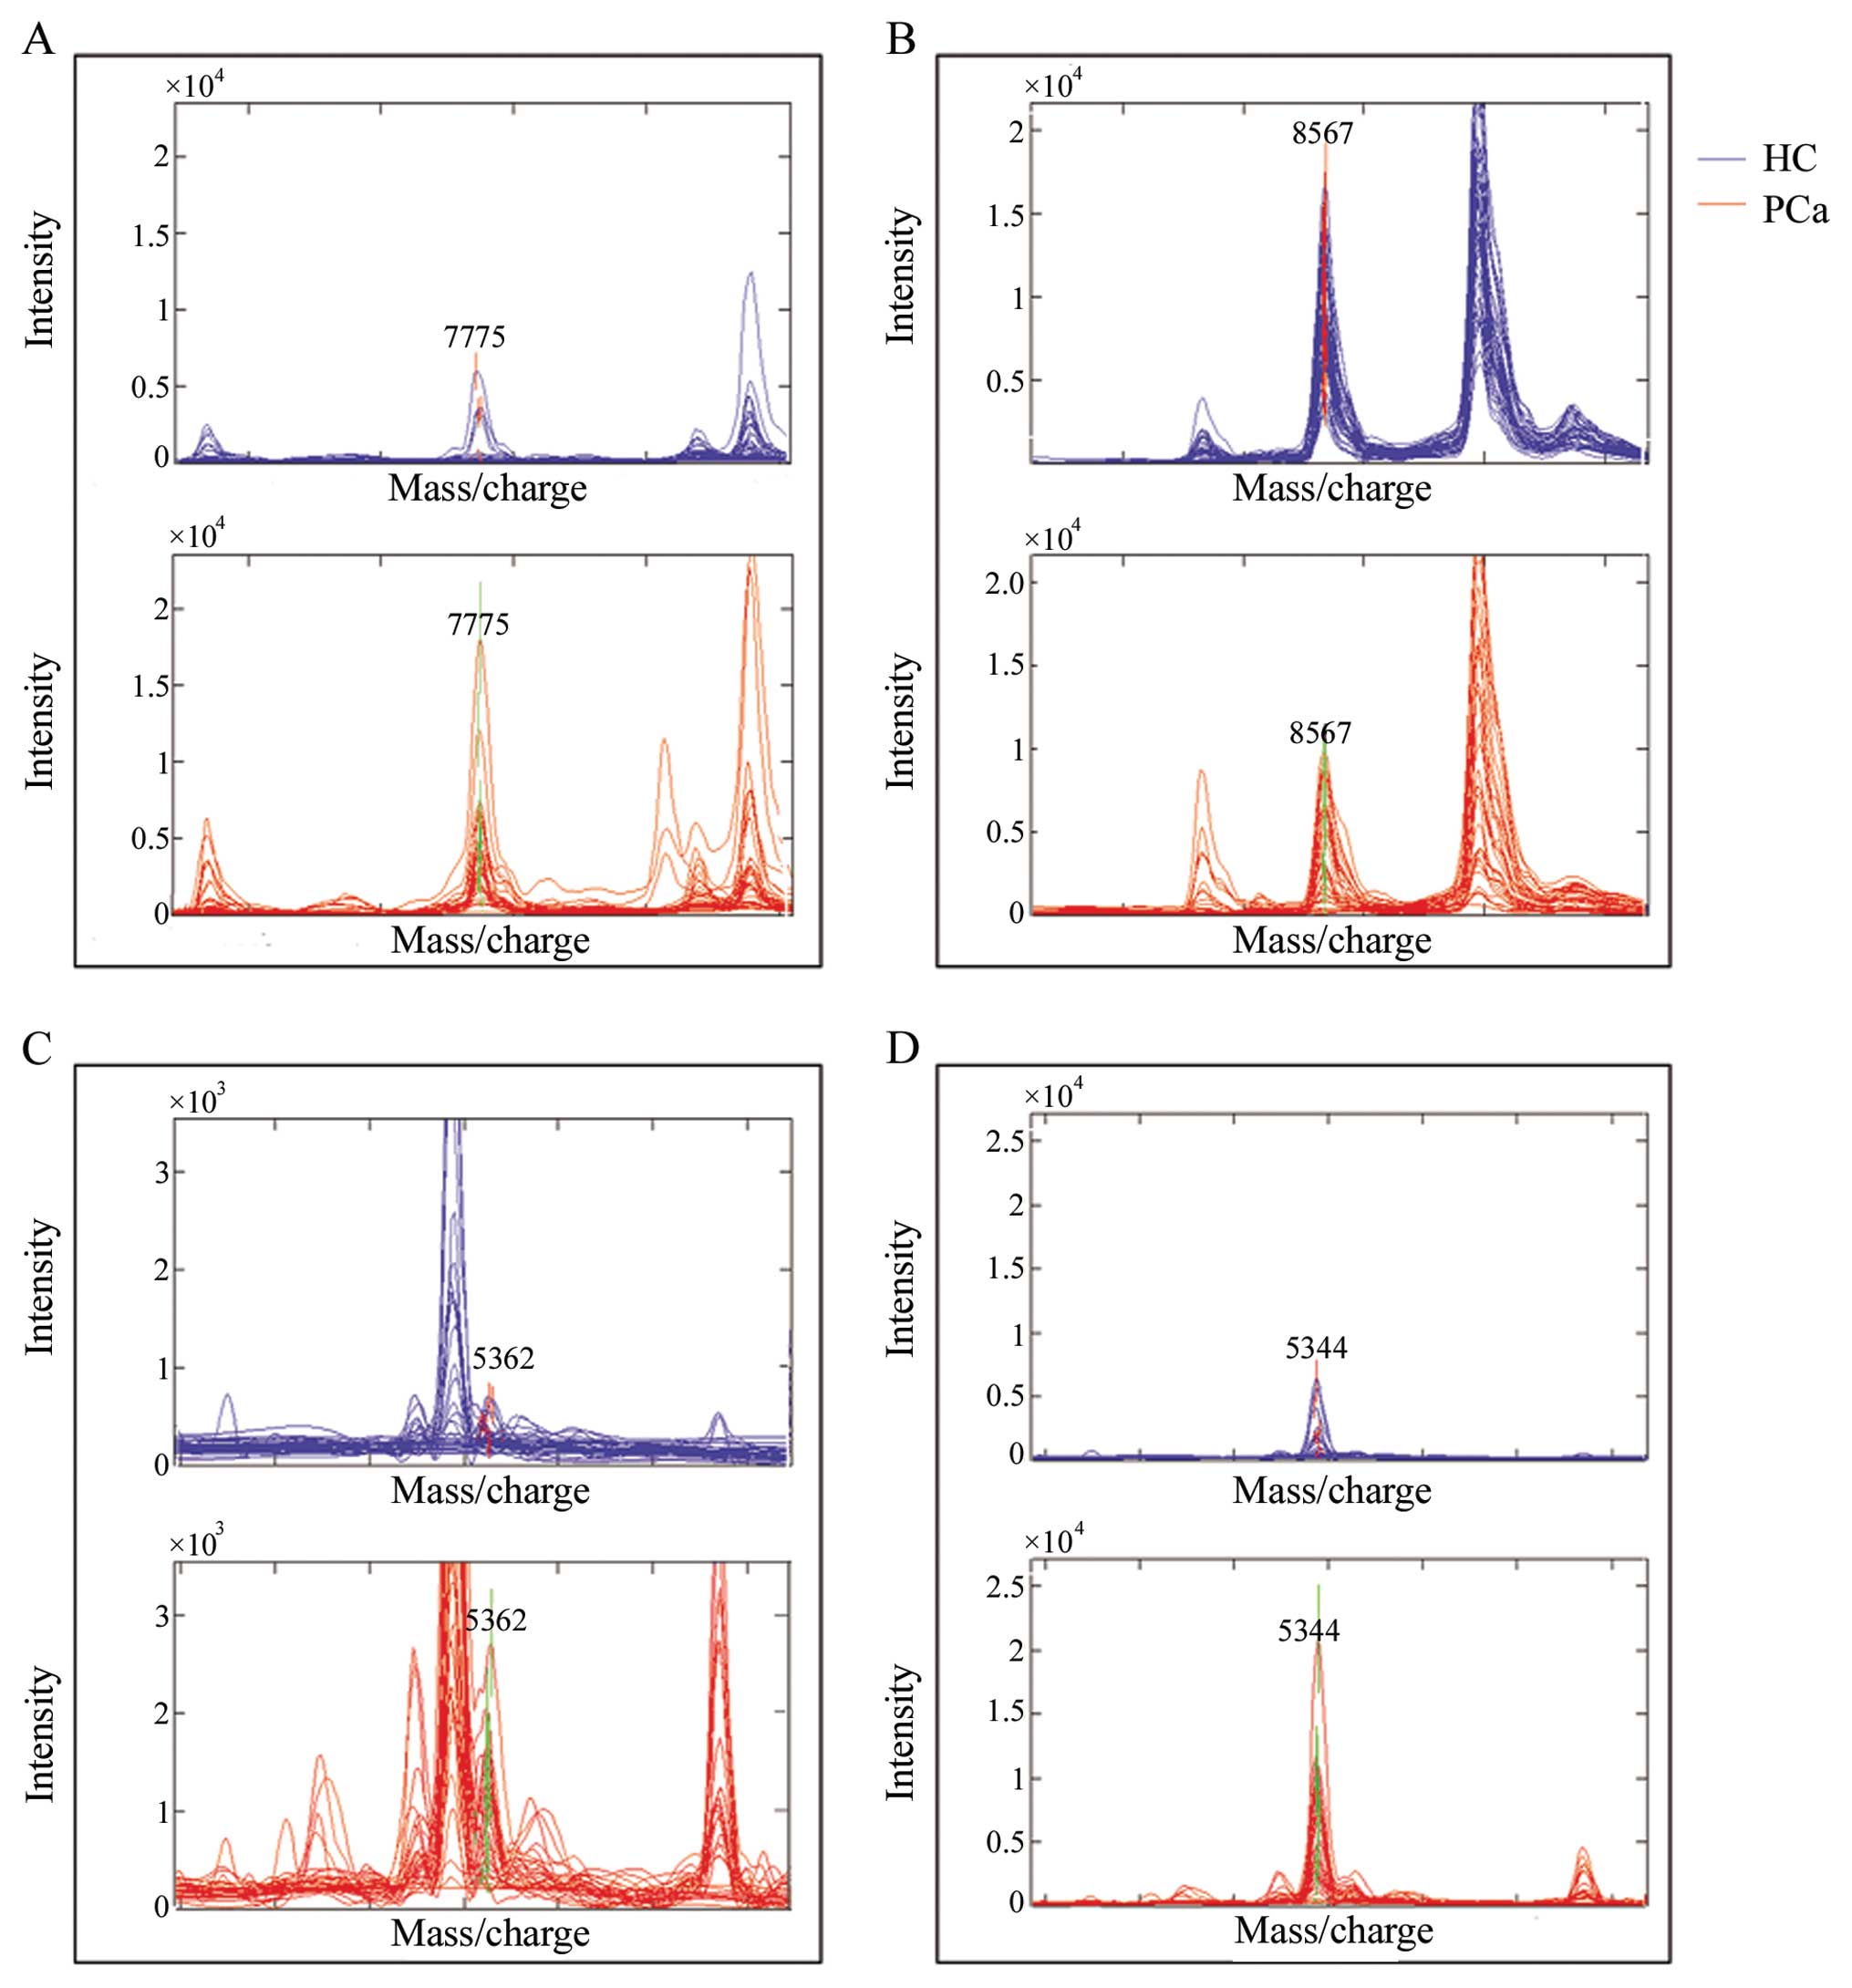
and the peak of 8567 Da was downregulated in PCa patients (Fig. 1). Overlay spectra of the 4 peaks
(7775, 8567, 5362 and 5344 Da) for the 30 patients and 39 healthy
individuals are displayed in Fig.
2. There are different levels overlapping in each peak between
the PCa and HC groups. The statistical results including the
P-value and the means ± standard deviation (SD) of the 4 peaks in
the PCa and HC groups are shown in Table II. The classifier had a 100%
specificity and 96.67% sensitivity for diagnosis of the training
set itself through the leave-one-out cross validation. This
classifier discriminated cancer patients from healthy individuals
in the test cohort with a sensitivity of 93.1% (95 of 102) and a
specificity of 78.57% (22 of 28). For the different stages of PCa,
100% (12/12) of stage Ia, 81.2% (13/16) of stage Ib, 87.5% (14/16)
of stage IIa, 100% (6/6) of stage IIb, 96.97% (32/33) of stage III
and 94.74% (18/19) of stage IV cases were correctly classified by
the classifier. For early-stage PCa, the sensitivity of CA19-9
(cut-off value, 37 U/ml) was 83.3% (10/12) for stage Ia and 68.8%
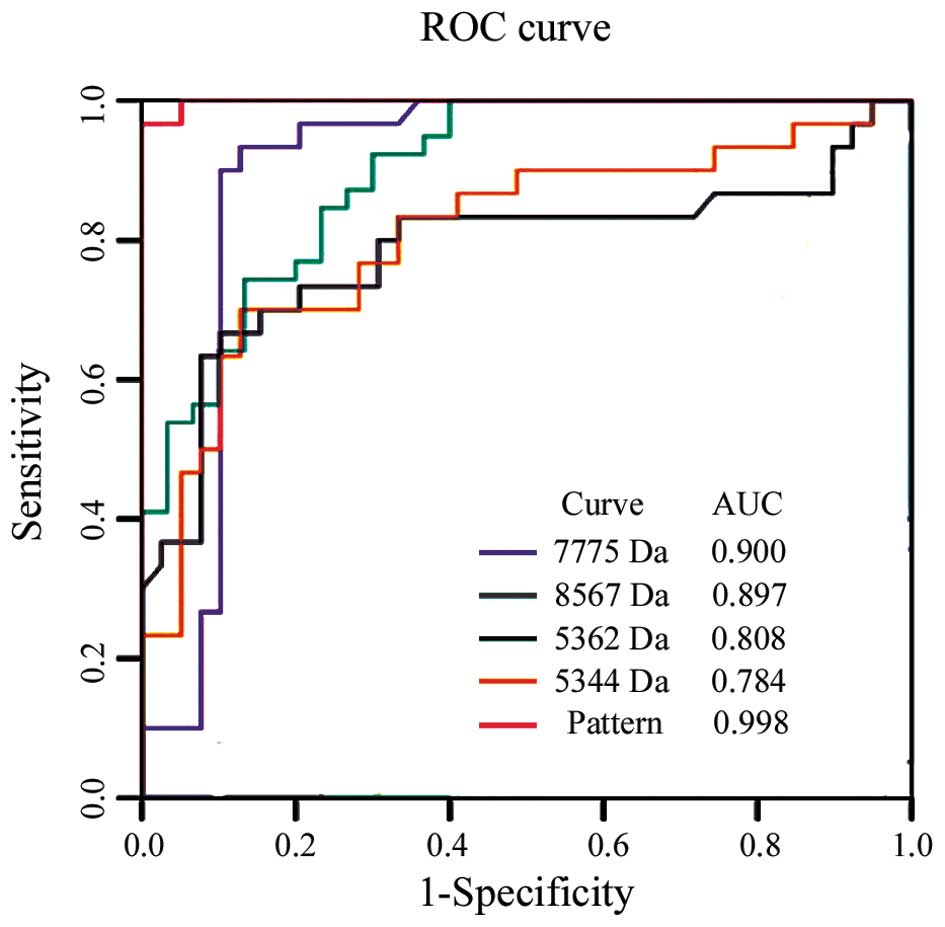
(11/16) for stage Ib. The power of each peak and the diagnostic
pattern in discriminating between patients with PCa from healthy
individuals was determined by estimating the area under the ROC
curve (AUC). The ROC and AUC values of each peak and their
combination in the 69 cases of the training cohort are shown in
Fig. 3. The SELDI panel (m/z
7775, 8567, 5362 and 5344) was more efficient than CA19-9 in
distinguishing individuals with PCa from the healthy subject groups
(P<0.05). The sensitivity of the SELDI panel was 93.1% but that
of CA19-9 was only 72.5% in the test cohort. Combining the SELDI
protein peaks and CA19-9 yielded a significant improvement for
CA19-9 at distinguishing between serum from patients with PCa and
that of HCs. The sensitivity of the combination of the SELDI panel
and CA19-9 was 97.1% in the test cohort and 97.7% in the total
patient population (Table III).
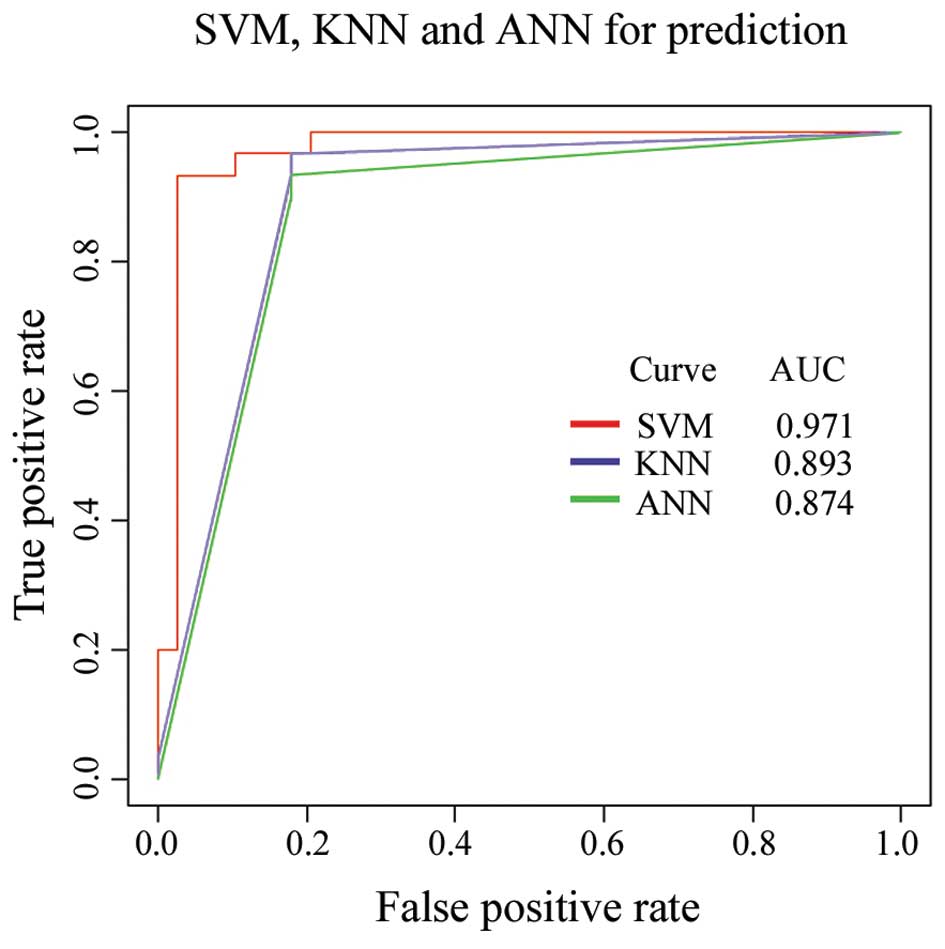
The SVM as a powerful classification tool has been widely applied
in bioinformatics (21,22). In the present study, the SVM
learning algorithm was optimized to analyze our data by comparing
the distinguishing ability of SVM to that of the KNN and the
artificial nerve net (ANN) (Fig.
4). In our study, we also included patients with other types of
gut cancer in order to challenge the PCa classifier. Consequently,
58.3% (7/12) of HCCs, 33.3% (1/3) of colon cancer and 66.7% (4/6)
of gastric cancer cases were correctly classified as cancer. These
results suggest that the 4 peaks may be specifically associated
with PCa but not with other types of gut cancer.
| Table II.Statistics of the 4 candidate
biomarkers used to discriminate pancreatic cancer from healthy
individuals. |
Table II.
Statistics of the 4 candidate
biomarkers used to discriminate pancreatic cancer from healthy
individuals.
| m/z | P-value | HCs mean ± SD | PCa mean ± SD |
|---|
| 7775 | 1.3E-09 | 539.94±1107.18 |
3054.52±2054.35 |
| 8567 | 4.8E-09 |
9757.83±3687.34 |
3393.56±2790.46 |
| 5362 | 2.16E-08 | 313.91±109.22 | 762.29±379.51 |
| 5344 | 9.08E-08 | 970.23±1210.87 |
4319.07±3077.86 |
| Table III.Detailed evaluation of the
sensitivity of the SELDI diagnostic pattern and its combination
with CA19-9. |
Table III.
Detailed evaluation of the
sensitivity of the SELDI diagnostic pattern and its combination
with CA19-9.
| Stage | Test cohort (%)
| Test and training
cohorts (%)
|
|---|
| n | CA19-9 | Pattern | Combination | n | CA19-9 | Pattern | Combination |
|---|
| Ia | 12 | 10 (83.3) | 12 (100) | 12 (100) | 12 | 10 (83.3) | 12 (100) | 12 (100) |
| Ib | 16 | 11 (68.8) | 13 (81.3) | 14 (87.5) | 16 | 11 (68.8) | 13 (81.3) | 14 (87.5) |
| IIa | 16 | 13 (81.3) | 14 (87.5) | 16 (100) | 16 | 13 (81.3) | 14 (87.5) | 16 (100) |
| IIb | 6 | 4 (66.7) | 6 (100) | 6 (100) | 16 | 14 (87.5) | 15 (93.8) | 16 (100) |
| III | 33 | 23 (69.7) | 32 (97) | 32 (97) | 46 | 36 (78.3) | 45 (97.8) | 45 (97.8) |
| IV | 19 | 13 (68.4) | 18 (94.7) | 18 (94.7) | 26 | 20 (76.9) | 25 (96.2) | 25 (96.2) |
| Total | 102 | 74 (72.6) | 95 (93) | 99 (97.1) | 132 | 104 (78.8) | 124 (93.9) | 129 (97.7) |
Discussion
We employed SELDI-TOF-MS technology to uncover the
discriminating information hidden in the proteome of PCa patient
serum. Zinkin et al (23)
showed that SELDI-TOF-MS could accurately distinguish patients with
HCC from those with hepatitis C virus cirrhosis and was more
accurate than traditional biomarkers in identifying small tumors. A
number of studies have reported that PCa serum, plasma, pancreatic
juice or tissue profiling may be used to discover tumor markers for
discriminating PCa samples from controls using SELDI-TOF-MS coupled
with various protein chips including IMAC (9–11,13,24), WCX (10), H50 (8,12),
CM10 (12,13) and Q10 (25). A number of studies have conducted
similar experiments using stepwise anion exchange chromatography
prior to using the ProteinChip system (9,10,12,13). Zinkin et al (23) suggested that whole serum, rather
than serum depleted of high abundant proteins, be used for SELDI
measurements, as within the range of molecular weights of proteins
detected by SELDI-TOF, the depletion of albumin and other high
abundant proteins does not dramatically change the pattern and
level of low molecular weight proteins detected by SELDI-TOF. In
addition, the reproducibility of the whole process with processed
serum was worse than that with crude serum (12), and certain potential protein may
be lost. Therefore, the fraction steps of serum or plasma prior to
identifying biomarkers using the SELDI-TOF technology may not be
optimal. Expanding the study to encompass other populations and
strategies will lead to the discovery of additional potential
biomarkers. In this study, crude serum samples from 132 patients
with PCa and 67 healthy individuals of Han nationality were used
for protein-chip analysis, allowing a higher throughput and
improving reproducibility. To the best of our knowledge, we used
the highest number of PCa cases for the largest for the serological
biomarkers study using SELDI-TOF-MS. Another different
characteristic in this research was that there were more
early-stage PCa samples (28 cases of stage I) used for the
SELDI-TOF evaluation. The final characteristic of the experimental
design differing from previous studies was that the case number of
patients with PCa in the test set was far greater than that in the
training set. For the limited cases with PCa, the sensitivity of
the classifier received greater credibility when additional cases
were used to validate the SELDI pattern.
The mean CV of the intensity of the peaks existing
in all the QC serum profiling at different spots was 20% (range,
12.2–30.2%), which was comparable with the CVs reported by other
groups (10–43%) for SELDI serum profiling (26–33). The mean CV of m/z of peaks was
0.05% (range, 0.04–0.08%) which was similar to the CVs reported by
previous studies (27,29,34). Proteomic profiling of the serum
from the training cohort was evaluated by the other 2 algorithms,
KNN and ANN. The AUC suggested that SVM was a better algorithm for
our data.
Using the CM10 ProteinChip array, we identified
groups of PCa-associated proteins (biomarker protein panels)
significantly expressed in patients with PCa. Four proteins of mass
7775, 8567, 5362 and 5344 Da were selected as biomarkers to
correctly discriminate between patients with PCa and the healthy
individuals. The peak of 8567 Da, a promising isolated mass, was of
particular interest as it was decreased in the patients with PCa
and was also identified by 2 other similar separate studies using
the WCX and H50 chip, respectively (8,10)
(likely the same protein/peptide). Tumor-derived proteins secreted
into the extracellular spatial or bloodstream were usually expected
to be mined in the study of serum samples from cancer patients.
Although the decreased expression or loss of serum peaks as
classifiers in cancer patients is different from the serum
biomarkers currently used in clinics, the similar biomarker was
found in gastric cancer (35).
The mass of 7775 Da was also identified in another study, a serum
profiling study of esophageal squamous cell carcinoma (unpublished
data). We confirmed all the case archives of the samples that
failed to be classified by the SELDI pattern, and found that 1
patient with benign adenoma was incorrectly sorted to the duct
adenocarcinoma group. The perfect example illustrated that it was
possible for the panel to be developed in order to discern between
benign and malignant pancreatic lesions, although more benign cases
needed to be validated. Due to the relatively low prevalence of
PCa, an increased sensitivity is required for the early detection
of PCa in the asymptomatic population (9). The SELDI pattern in this study had a
high sensitivity of 96.67 and 93.1% in the training and test
cohorts, respectively. The predictive capacity of the mass peaks
identified in this study require further testing, including the
examination of a larger panel of serum from patients with PCa of
stage I, various other malignancies and benign diseases.
SELDI-TOF-MS is currently the most widely used and
advertised non gel-based method. However, little is known about the
potential of this technique for future application. Many different
peaks have been purified and identified using various methods, as
summarized by Hortin (36). All
these proteins are non tumor-specific and most are derived from
host non-specific response. Although still preliminary and
requiring validation on an independent dataset, these results
provide incentive to further explore SELDI-based serum proteomics
as a prognostic and/or predictive tool. Schwegler et al
(38) maintained that the profile
itself was diagnostic, and extending its use does not depend on the
identification of the proteins in discriminating peaks in the
emerging field of MS-based protein profiling of body fluids
(37). We deem that it is
immature to identify a SELDI-TOF panel as the sensitivity and
recovery rate of the fraction strategy and identification
technology is far less compared to the need for low abundance
significant proteins.
Our results provide the premise for further
evaluation and validation of this SELDI proteomic classification
system for the early detection and diagnosis of PCa. However,
further study is required to construct profiles for the
identification of PCa. Our findings are in general agreement with
those reported by previous studies, thus providing additional
confirmation that a proteomic approach may accurately identify
clinical PCa. Various purification and serial efforts to identify
the low-mass protein biomarkers discovered in this study are
currently ongoing.
Abbreviations:
|
PCa
|
pancreatic cancer;
|
|
HCs
|
healthy controls;
|
|
SVM
|
support vector machine;
|
|
SELDI-TOF-MS
|
surface-enhanced laser
desorption/ionization time-of-flight mass spectrometry;
|
|
KNN
|
k-nearest neighbors;
|
|
ANN
|
artificial neural network;
|
|
WCX
|
weak cation exchange;
|
|
DTT
|
dithiothreitol;
|
|
SPA
|
sinapinic acid;
|
|
m/z
|
mass- to-charge ratios;
|
|
CV
|
co-efficient of variance;
|
|
ROC
|
receiver operating characteristic;
|
|
UDWT
|
undecimated discrete wavelet
transform;
|
|
QC
|
quality control;
|
|
AUC
|
area under the curve;
|
|
Da
|
dalton (one twelfth the mass of
carbon-12)
|
Acknowledgements
This study was supported by the
National Natural Science Foundation of China (nos. 30572126 and
30721001), the High-Tech R&D Program of China (nos.
2006AA02Z19B, 2006AA02Z341 and 2006AA02A403) and the National Basic
Research Program of China (no. 2004CB518707). We thank Professor
Shu Zheng from the Second Affiliated Hospital of Zhejing University
for helpful suggestions and technical support in this study. The
authors also thank Dr Jie-kai Yu for his assistance in data
analysis.
References
|
1.
|
D LiK XieR WolffJL AbbruzzesePancreatic
cancerLancet36310491057200410.1016/S0140-6736(04)15841-8
|
|
2.
|
TP YeoRH HrubanSD LeachPancreatic
cancerCurr Probl
Cancer26176275200210.1067/mcn.2002.12957912399802
|
|
3.
|
RA AbramsLB GrochowA
ChakravarthyIntensified adjuvant therapy for pancreatic and
periampullary adenocarcinoma: survival results and observations
regarding patterns of failure, radiotherapy dose and CA19-9
levelsInt J Radiat Oncol Biol
Phys4410391046199910.1016/S0360-3016(99)00107-8
|
|
4.
|
DK PleskowHJ BergerJ GyvesE AllenA
McLeanDK PodolskyEvaluation of a serologic marker, CA19-9, in the
diagnosis of pancreatic cancerAnn Intern
Med110704709198910.7326/0003-4819-110-9-7042930108
|
|
5.
|
M AkdoganN SasmazB KayhanI BiyikogluS
DisibeyazB SahinExtraordinarily elevated CA19-9 in benign
conditions: a case report and review of the
literatureTumori87337339200111765186
|
|
6.
|
XG NiXF BaiYL MaoThe clinical value of
serum CEA, CA19-9, and CA242 in the diagnosis and prognosis of
pancreatic cancerEur J Surg
Oncol31164169200510.1016/j.ejso.2004.09.00715698733
|
|
7.
|
E Petricoin IIILA LiottaCounterpoint: The
vision for a new diagnostic paradigmClin
Chem4912761278200310.1373/49.8.127612881442
|
|
8.
|
CJ ScarlettRC SmithA SaxbyProteomic
classification of pancreatic adenocarcinoma tissue using protein
chip
technologyGastroenterology13016701678200610.1053/j.gastro.2006.02.03616697731
|
|
9.
|
S BhattacharyyaER SiegelGM PetersenST
ChariLJ SuvaRS HaunDiagnosis of pancreatic cancer using serum
proteomic
profilingNeoplasia6674686200410.1593/neo.0426215548376
|
|
10.
|
J KoopmannZ ZhangN WhiteSerum diagnosis of
pancreatic adenocarcinoma using surface-enhanced laser desorption
and ionization mass spectrometryClin Cancer
Res10860868200410.1158/1078-0432.CCR-1167-3
|
|
11.
|
Y YuS ChenLS WangPrediction of pancreatic
cancer by serum biomarkers using surface-enhanced laser
desorption/ionization-based decision tree
classificationOncology687986200510.1159/000084824
|
|
12.
|
K HondaY HayashidaT UmakiPossible
detection of pancreatic cancer by plasma protein profilingCancer
Res651061310622200510.1158/0008-5472.CAN-05-185116288055
|
|
13.
|
M EhmannK FelixD HartmannIdentification of
potential markers for the detection of pancreatic cancer through
comparative serum protein expression
profilingPancreas34205214200710.1097/01.mpa.0000250128.57026.b217312459
|
|
14.
|
J SongM PatelCN RosenzweigQuantification
of fragments of human serum inter-alpha-trypsin inhibitor heavy
chain 4 by a surface-enhanced laser desorption/ionization-based
immunoassayClin Chem5210451053200610.1373/clinchem.2005.065722
|
|
15.
|
M DongY NioK TamuraKi-ras point mutation
and p53 expression in human pancreatic cancer: a comparative study
among Chinese, Japanese, and Western patientsCancer Epidemiol
Biomarkers Prev9279284200010750666
|
|
16.
|
P HeHZ HeJ DaiThe human plasma proteome:
analysis of Chinese serum using shotgun
strategyProteomics534423453200510.1002/pmic.20040130116047309
|
|
17.
|
JX WangJK YuL WangQL LiuJ ZhangS
ZhengApplication of serum protein fingerprint in diagnosis of
papillary thyroid
carcinomaProteomics653445349200610.1002/pmic.20050083316941571
|
|
18.
|
KA BaggerlyJS MorrisKR
CoombesReproducibility of SELDI-TOF protein patterns in serum:
comparing datasets from different
experimentsBioinformatics20777785200410.1093/bioinformatics/btg48414751995
|
|
19.
|
S BraunFD VoglB NaumeA pooled analysis of
bone marrow micrometastasis in breast cancerN Engl J
Med353793802200510.1056/NEJMoa05043416120859
|
|
20.
|
T SingO SanderN BeerenwinkelT
LengauerROCR: visualizing classifier performance in
RBioinformatics2139403941200510.1093/bioinformatics/bti62316096348
|
|
21.
|
P PavlidisI WapinskiWS NobleSupport vector
machine classification on the
webBioinformatics20586587200410.1093/bioinformatics/btg46114990457
|
|
22.
|
M WagnerDN NaikA PothenComputational
protein biomarker prediction: a case study for prostate cancerBMC
Bioinformatics526200410.1186/1471-2105-5-2615113409
|
|
23.
|
NT ZinkinF GrallK BhaskarSerum proteomics
and biomarkers in hepatocellular carcinoma and chronic liver
diseaseClin Cancer
Res14470477200810.1158/1078-0432.CCR-07-058618223221
|
|
24.
|
C RostyL ChristaS KuzdzalIdentification of
hepato-carcinoma-intestine-pancreas/pancreatitis-associated protein
I as a biomarker for pancreatic ductal adenocarcinoma by protein
biochip technologyCancer Res62186818752002
|
|
25.
|
C MelleG ErnstN EscherProtein profiling of
microdissected pancreas carcinoma and identification of HSP27 as a
potential serum markerClin
Chem53629635200710.1373/clinchem.2006.07919417303689
|
|
26.
|
EF PetricoinAM ArdekaniBA HittUse of
proteomic patterns in serum to identify ovarian
cancerLancet359572577200210.1016/S0140-6736(02)07746-211867112
|
|
27.
|
BL AdamY QuJW DavisSerum protein
fingerprinting coupled with a pattern-matching algorithm
distinguishes prostate cancer from benign prostate hyperplasia and
healthy menCancer Res62360936142002
|
|
28.
|
AJ RaiPM StemmerZ ZhangAnalysis of Human
Proteome Organization Plasma Proteome Project (HUPO PPP) reference
specimens using surface enhanced laser desorption/ionization-time
of flight (SELDI-TOF) mass spectrometry: multi-institution
correlation of spectra and identification of
biomarkersProteomics5346734742005
|
|
29.
|
OJ SemmesZ FengBL AdamEvaluation of serum
protein profiling by surface-enhanced laser desorption/ionization
time-of-flight mass spectrometry for the detection of prostate
cancer: I. Assessment of platform reproducibilityClin
Chem51102112200510.1373/clinchem.2004.038950
|
|
30.
|
M AivadoD SpentzosG AlterovitzOptimization
and evaluation of surface-enhanced laser desorption/ionization
time-of-flight mass spectrometry (SELDI-TOF MS) with reversed-phase
protein arrays for protein profilingClin Chem Lab
Med43133140200510.1515/CCLM.2005.022
|
|
31.
|
DG WardY ChengG N’KontchouChanges in the
serum proteome associated with the development of hepatocellular
carcinoma in hepatitis C-related cirrhosisBr J
Cancer94287292200610.1038/sj.bjc.660292316404431
|
|
32.
|
J AlbrethsenR BogeboJ OlsenH RaskovS
GammeltoftPreanalytical and analytical variation of
surface-enhanced laser desorption-ionization time-of-flight mass
spectrometry of human serumClin Chem Lab
Med4412431252200610.1515/CCLM.2006.22817032137
|
|
33.
|
DG WardY ChengG N’KontchouPreclinical and
post-treatment changes in the HCC-associated serum proteomeBr J
Cancer9513791383200610.1038/sj.bjc.660342917060939
|
|
34.
|
J RobozMass spectrometry in diagnostic
oncoproteomicsCancer
Invest23465478200510.1081/CNV-6718216193645
|
|
35.
|
MP EbertJ MeuerJC WiemerIdentification of
gastric cancer patients by serum protein profilingJ Proteome
Res312611266200410.1021/pr049865s15595736
|
|
36.
|
GL HortinThe MALDI-TOF mass spectrometric
view of the plasma proteome and peptidomeClin
Chem5212231237200610.1373/clinchem.2006.06925216644871
|
|
37.
|
EF PetricoinLA LiottaSELDI-TOF-based serum
proteomic pattern diagnostics for early detection of cancerCurr
Opin Biotechnol152430200410.1016/j.copbio.2004.01.00515102462
|
|
38.
|
EE SchweglerL CazaresLF SteelSELDI-TOF MS
profiling of serum for detection of the progression of chronic
hepatitis C to hepatocellular
carcinomaHepatology41634642200510.1002/hep.2057715726646
|