Introduction
Osteoarthritis (OA) is characterized by a basic
pathology of cartilage degeneration caused by the mutual influence
of mechanical and biological factors. The balance of catabolism and
anabolism within chondrocytes helps to maintain the structural and
functional integrity of the extracellular cartilage matrix (ECM).
In the early stages of OA development, cartilage tissues show
self-repair activity, the volume of chondrocytes increases and the
synthesis of proteoglycan accelerates. In the late stage of OA, the
balance is broken, and the damaging effect of inflammation becomes
more dramatic. Chondrocytes can rapidly respond to changes in the
microenvironment of the joint and regulate the dynamic equilibrium
between the degradation and synthesis of the ECM (1–4).
Therefore, the functional changes in chondrocytes play important
roles in the degeneration of joint cartilage, and chondrocyte
proliferation is one of the important factors contributing to the
maintenance of cellular function.
The cell cycle is composed of four different phases,
G1, S, G2 and M, which regulate cell
proliferation, differentiation and apoptosis, essential to cell
life. The G1/S checkpoint that exists at the end of
G1 stage is the key point of intracellular and
extracellular signaling which integrates in the nucleus, then
stimulates S phase cells to begin a new round of proliferation,
differentiation, death or exit the cell cycle into the
G0 phase (5,6). Cell cycle progression involves the
activity of cyclin-dependent kinases (CDKs), which are complexes of
cyclin and CDK proteins. The G1/S transition of the cell
cycle is dependent on the activity of cyclin D1-CDK4/6. Once
activated, these CDK complexes phosphorylate retinoblastoma (Rb)
and related family members and release sequestered E2F
transcription factors, thereby promoting the transcription of genes
required for progression through the cell cycle. Such progression
is under the control of CDK inhibitors (CDKIs), such as P16, which
cause transient or permanent cell cycle arrest in cells carrying
DNA damage. Cell cycle transitions are tightly regulated, and
changes in the expression of CDKs or CDKIs may lead to exacerbated
cell proliferation (7,8).
Acupuncture, which has been used for the treatment
of various types of diseases in Eastern countries for thousands of
years, is currently gaining acceptance as an alternative medicine
in Western countries (9,10). Electroacupuncture (EA) is a
modified acupuncture technique that utilizes electrical
stimulation. Previous studies have demonstrated that EA has
therapeutic effects on chondral defects including knee
osteoarthritis (11–13) and produces cytokines with multiple
biological activities in various types of diseases (14,15). Our previous study showed that EA
can be employed as a novel non-drug-inducing method for the
differentiation of BMSCs into chondrocytes (16). However, the effects of EA on the
proliferation of chondrocytes, have not yet been reported. To
further elucidate the precise mechanism of the potential treatment
of OA, in the present study we investigated the effect of EA on the
proliferation of chondrocytes and investigated the underlying
molecular mechanism.
Materials and methods
Materials and reagents
Fetal bovine serum (FBS), Dulbecco’s modified
Eagle’s medium (DMEM), trypsin and toluidine blue stain were
purchased from Hyclone Inc. (Carlsbad, CA, USA); MTT, type-II
collagenase, and nocodazole were obtained from Sigma. Cell cycle
test kit was obtained from Becton-Dickinson (San Jose, CA, USA). A
total protein extraction kit and an ECL kit were purchased from
Beyotime Biotech (Nanjing, Jiangsu, China). Cyclin D1, CDK4, CDK6,
phospho-Rb, p16INK4a and β-actin antibodies and
horseradish peroxidase (HRP)-conjugated secondary antibodies were
obtained from Cell Signaling Technology, Inc. (Danvers, MA, USA).
DNA primers were synthesized by Sangon Biotech (Shanghai,
China).
Animals
Healthy and clean, 4-week-old Sprague Dawley rats
(90–110 g weight) of either gender (n=42) were purchased from SLAC
Laboratory Animal Inc. (Shanghai, China) [Laboratory Animal Use
Certificate no. SCXK(SH)2007-0005] and raised in a sterile
environment. All experiments involving the animals complied with
Guidance Suggestions for the Care and Use of Laboratory Animals
2006 administered by the Ministry of Science and Technology,
China.
Isolation and culture of rat
chondrocytes
Rat chondrocytes were isolated and cultured as
previously described (17). The
cells used in these experiments were counted by a hemocytometer and
adjusted to 104–106 cells/ml.
EA stimulation
The EA stimulation method was in accordance with a
previously described method (16). The acupuncture stimulation was
applied daily for 0, 15, 30, 60 or 120 min.
Cell treatment and grouping
The passage 2 chondrocytes were seeded at
1×10⁵/ml in a T-25 flask, cultured for 48 h and starved
in DMEM medium without FBS for 24 h. The cells were then randomly
divided into four groups: control group (normal culture without
treatment); experimental group 1 (treated with 50 nM nocodazole for
24 h and receiving no EA treatment); experimental group 2
(receiving no nocodazole treatment and treated with EA stimulator
for 60 min) and experimental group 3 (treated with 50 nM nocodazole
for 24 h and receiving EA stimulator for 60 min). After treatment,
cell proliferation was detected using an MTT assay and DNA staining
followed by FACS analysis. Cells were also processed to measure the
mRNA levels of cyclin D1, CDK4, CDK6, Rb and P16 by RT-PCR and the
protein levels of cyclin D1, CDK4, CDK6, pRb and P16 by western
blotting.
MTT assay
The passage 2 chondrocytes were seeded in a 6-well
plate at 1×10⁵/ml (2 ml/well) and treated with
nocodazole and EA stimulator. The chondrocytes were then washed
with PBS once, and 1 ml of a 0.5% MTT solution was added to each
well. After incubation at 37°C for 4 h, wells were emptied,
supplied with 1 ml of DMSO and shaken for 10 min. The absorbance
was measured at 490 nm using an EL×808™ absorbance
microplate reader (BioTek Instruments, Inc., Winooski, VT,
USA).
Detection of cell cycle distribution by
flow cytometric analysis with propidium iodide (PI) staining
Chondrocytes were digested with 0.25% trypsin and
incubated in 25-ml culture flasks at a density of 1×10⁵
cells/ml in 4 ml of medium for 24 h and starved for 24 h in
serum-free DMEM medium and were then treated with or without
nocodazole and EA stimulator. After treatment, the cell cycle
distribution of the chondrocytes was determined by flow cytometric
analysis using a fluorescence-activated cell sorting FACSCalibur
cytometer and a cell cycle assay kit. PI staining was performed
according to the manufacturer’s instructions. The percentage of
cells in the different phases was calculated by ModFit LT version
3.0 software, and the numbers of cell in the
G0/G1, S and G2/M phases were
determined.
RNA extraction and RT-PCR analysis
Total RNA from the treated cells was isolated with
TRIzol reagent (Invitrogen). Oligo(dT)-primed RNA (2 μg) was
reverse-transcribed with SuperScript II reverse transcriptase
(Promega) according to the manufacturer’s instructions. The
obtained cDNA was used to determine the mRNA levels of cyclin D1,
CDK4, CDK6, Rb and P16 by PCR with TaqDNA polymerase
(Fermentas). β-actin was used as an internal control. The primers
and the annealing temperature (°C) used for amplification of cyclin
D1, CDK4, CDK6, Rb, P16 and β-actin transcripts were as follows:
cyclin D1, sense, 5′-GAC ACC AAT CTC CTC AAC GAC-3′ and antisense,
5′-AGA CAA GAA ACG GTC CAG GTA G-3′ (216 bp, 55°C); CDK4, sense,
5′-CCT ACG GAC ATA CCT GGA CAA-3′ and antisense, 5′-GAG GCA ATC CAA
TGA GAT CAA-3′ (404 bp, 55°C); CDK6, sense, 5′-GTT TCA GCT TCT CCG
AGG TCT-3′ and anti-sense, 5′-CGT CAA GCA TTT CAG AAG GAG-3′ (469
bp, 55°C); Rb, sense, 5′-CTT TAT TGG CCT GTG CTC TTG-3′ and
antisense, 5′-ATT CCA TGA TTC GAT GCT CAC-3′ (225 bp, 53°C); P16,
sense, 5′-GCT CTC CTG CTC TCC TAT GGT-3′, and antisense, 5′-AGA AGT
TAT GCC TGT CGG TGA-3′ (268 bp, 54°C); β-actin, sense, 5′-GGG AAG
TGC TGG ATA G-3′ and antisense, 5′-GTG ATG TTT CGG ATG G-3′ (385
bp, 55°C).
Western blot analysis
After treatment, cells were lysed, and protein
concentrations were determined by BCA assay using bovine serum
albumin as a standard. Samples were loaded with 20 μg of
protein and separated by electrophoresis on 12% SDS polyacrylamide
gels. After electrophoresis, proteins were transferred to PVDF
membranes in 5% w/v nonfat dry milk using a semidry blotting
system, and detected with antibodies against cyclin D1, CDK4, CDK6,
pRb, P16 and β-actin and developed with ECL. The intensity of each
band was quantified utilizing the Image Lab gel analyzing system
and normalized to the band intensity of β-actin.
Statistical analysis
Statistical data are expressed as means ± SD.
Statistical analysis of the data was performed with the Student’s
t-test and one-way analysis of variance (ANOVA). Differences were
considered statistically significant at P<0.05.
Results
Optimization of EA treatment time
Without treatment, the passage 2 chondrocytes
proliferated normally, and there was no significant difference
between the four groups. After treatment with EA, the optical
densities (ODs) of cells receiving 60- and 120-min treatments were
significantly higher than the ODs of cells receiving 0-min
(P=0.000) and 15-min treatments (P=0.001). The OD of cells
receiving a 60-min treatment was significantly higher than the OD
of cells receiving a 30-min treatment (P= 0.000), but no
significant difference was noted between the OD of cells receiving
a 30-min treatment and the OD of cells receiving a 120-min
treatment (P=0.242) (Table
I).
 | Table IProliferation of chondrocytes as
detected by MTT assay. |
Table I
Proliferation of chondrocytes as
detected by MTT assay.
| Group | OD before
treatment | OD after
treatment |
|---|
| EA treatment for 0
min | 0.328±0.006 |
0.363±0.005d,e |
| EA treatment for 15
min | 0.327±0.009 |
0.369±0.003b,f |
| EA treatment for 30
min | 0.333±0.010 |
0.376±0.003a,d |
| EA treatment for 60
min | 0.332±0.004 |
0.393±0.006a,c,e |
| EA treatment for 120
min | 0.335±0.009 |
0.379±0.005a,c |
Effect of the EA treatment on
nocodazole-induced proliferation
The effect of the EA treatment on the
nocodazole-induced proliferation was assessed by MTT assay. Prior
to treatment, there was no difference between the different groups.
After treatment, the OD value of experimental group 1 was
significantly lower than the OD values of the control group,
experimental group 2 and experimental group 3 (P=0.000). Notably,
there were significantly more cells in the experimental group 2
compared with the control group (P=0.001) (Table II).
| Table IIEffect of nocodazole and EA on the
proliferation of chondrocytes detected by MTT assay. |
Table II
Effect of nocodazole and EA on the
proliferation of chondrocytes detected by MTT assay.
| Group | Nocodazole (nM) | EA treatment
(min) | OD before
treatment | OD after
treatment |
|---|
| Control | 0 | 0 | 0.335±0.010 | 0.364±0.005b |
| Experimental 1 | 50 | 0 | 0.337±0.008 | 0.348±0.006a |
| Experimental 2 | 0 | 60 | 0.329±0.005 |
0.391±0.007a–c |
| Experimental 3 | 50 | 60 | 0.336±0.009 | 0.370±0.006b |
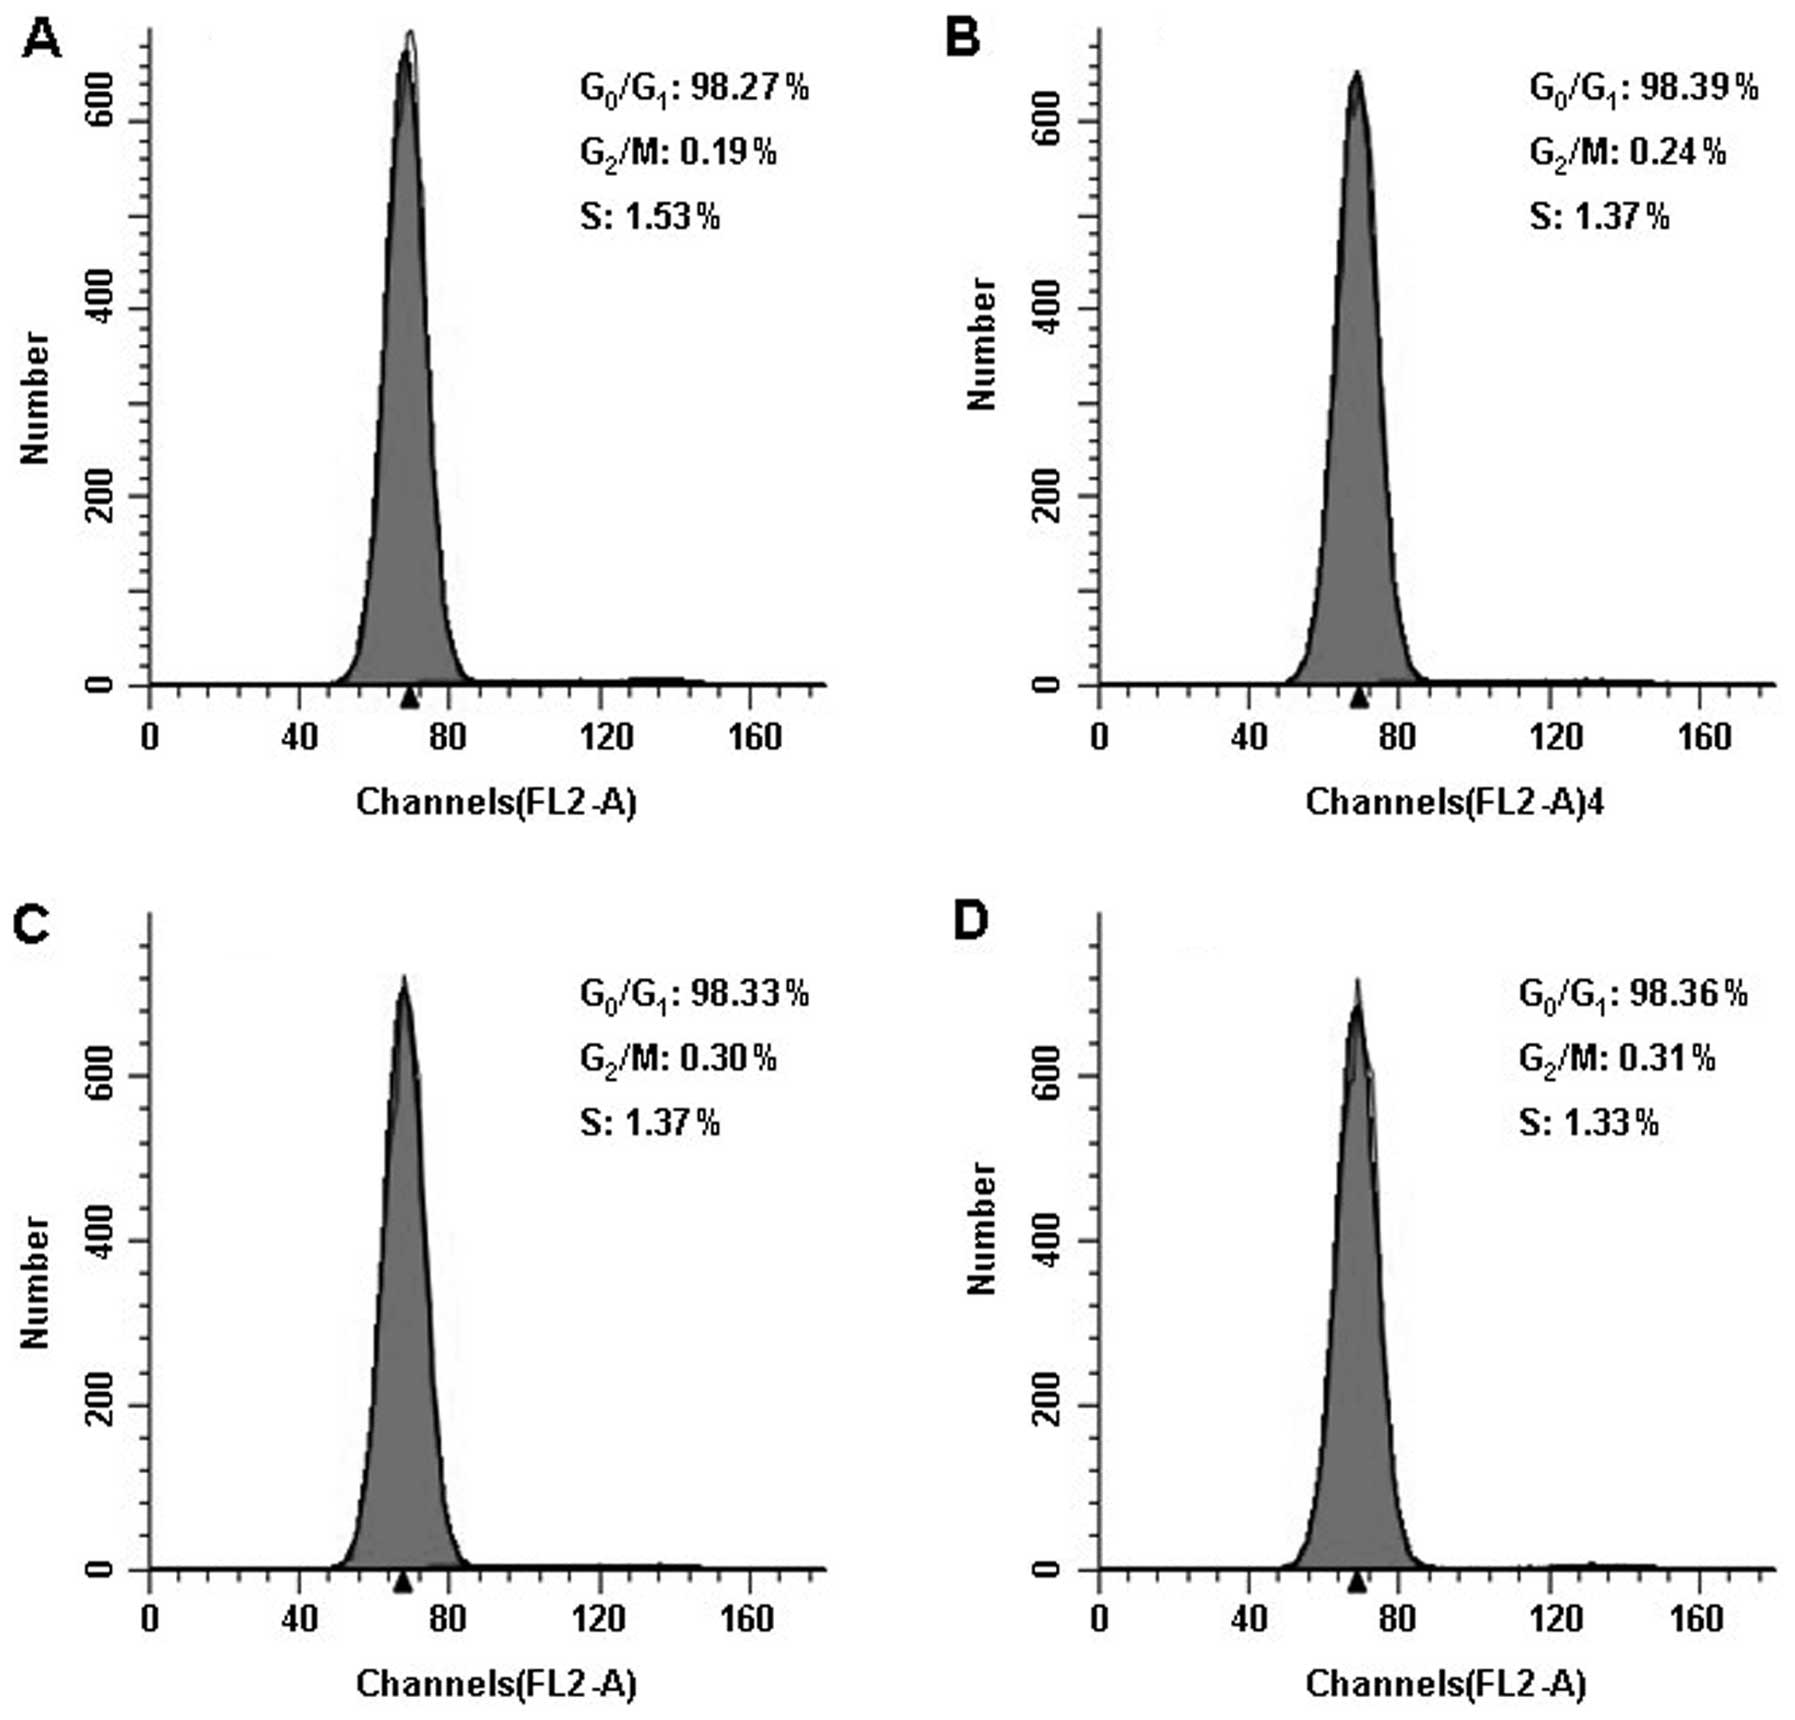
Cell cycle distribution of the treated
chondrocytes as determined by FACS
Before treatment, all cells were starved for 24 h to
synchronize the cell cycle stage (Fig. 1A–D). The FACS results showed that
the cell cycle distribution of the cells in the different groups
was similar. The G0/G1 ratio of cells in
experimental group 1 was significantly higher than the ratio in the
cells of experimental group 2 (P=0.000) following treatment, while
the G0/G1 ratios of cells in experimental
group 2 and 3 were significantly lower than that of the control
group (P=0.000, P=0.003). The S ratio of cells in experimental
group 1 was significantly lower than the ratios of cells of other
groups (P=0.000), and the S ratio of cells in experimental group 2
was significantly higher than the ratios of the control group
(P=0.000) and experimental group 3 (P=0.001). The G2/M
ratio of cells in experimental group 1 was significantly higher
than those of the control group (P=0.000) and experimental group 2
(P=0.002). The G2/M ratio of cells in the experimental
group 2 was higher than that of the control group (P=0.002)
(Fig. 1E–H and Table III).
| Table IIICell cycle distribution as detected
by FACS (%). |
Table III
Cell cycle distribution as detected
by FACS (%).
| Group |
G0/G1 | S |
G2/M |
|---|
| Before
treatment | | | |
| Control | 98.273±0.129 | 1.533±0.073 | 0.193±0.119 |
| Experimental
1 | 98.390±0.347 | 1.372±0.378 | 0.238±0.552 |
| Experimental
2 | 98.332±0.082 | 1.370±0.112 | 0.298±0.097 |
| Experimental
3 | 98.362±0.381 | 1.327±0.279 | 0.313±0.198 |
| After
treatment | | | |
| Control |
44.338±0.038b |
31.627±0.075b |
24.035±0.109b |
| Experimental
1 |
41.627±0.054a |
28.885±0.038a |
29.488±0.065a |
| Experimental
2 |
36.548±0.048a,b |
36.673±0.056a,b |
26.778±0.053a,b |
| Experimental
3 |
41.902±0.072a |
33.393±0.032a,b |
24.705±0.091b |
The mRNA expression of cyclin D1, CDK4,
CDK6, Rb and P16 in chondrocytes following EA treatment
To further explore the mechanism of the EA
treatment, we analyzed the mRNA expression levels of cyclin D1,
CDK4, CDK6, Rb and P16. The amplified products of cyclin D1, CDK4,
CDK6, Rb and P16 were clearly visible on the agarose gel (Fig. 2). Quantification of the PCR
products indicated that the levels of cyclin D1, CDK4, CDK6, Rb
were significantly higher in control group than in experimental
group 2 (P=0.002, P=0.001, P=0.001, P=0.001, respectively).
However, the P16 mRNA level in experimental group 2 was
significantly lower than that in control group (P=0.005) (Table IV).
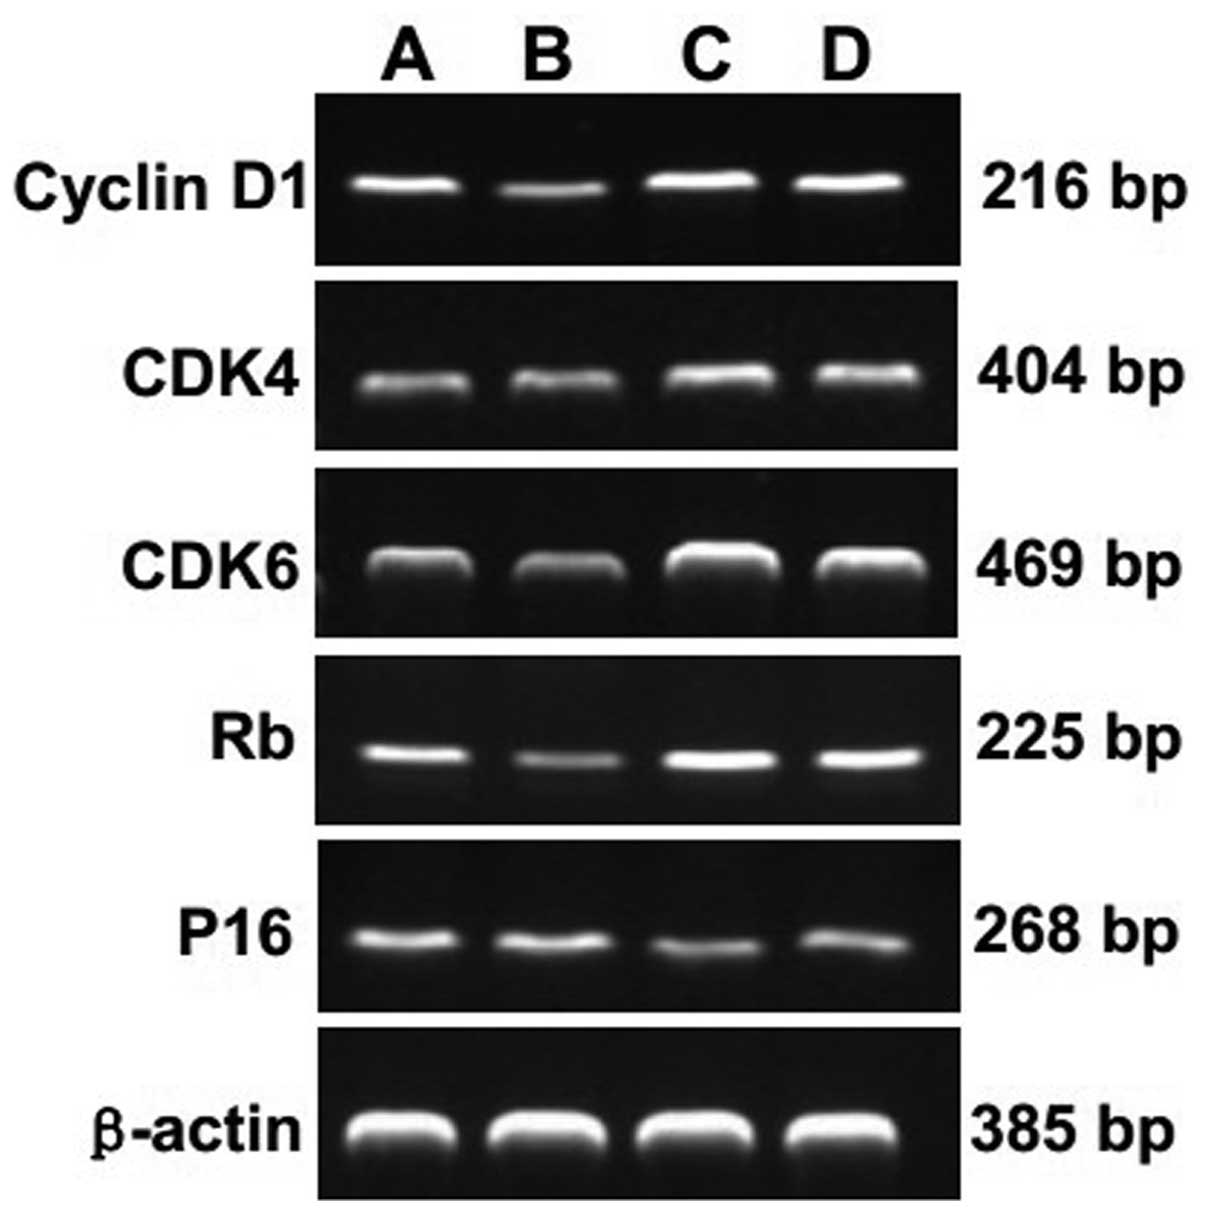 | Figure 2Effect of EA treatment and nocodazole
interference on the mRNA expression of cyclin D1, CDK4, CDK6, Rb
and P16 in passage 2 chondrocytes. Cells were treated with or
without EA and nocodazole for 24 h. The mRNA expression levels of
cyclin D1, CDK4, CDK6, Rb and P16 were determined by RT-PCR.
β-actin was used as the internal control. Data are representative
of three independent experiments. Lane A, control group; lane B,
experimental group 1; lane C, experimental group 2; lane D,
experimental group 3. |
| Table IVmRNA expression of cyclin D1, CDK4,
CDK6, Rb and P16 in the chondrocytes. |
Table IV
mRNA expression of cyclin D1, CDK4,
CDK6, Rb and P16 in the chondrocytes.
| Group | cyclin D1 | CDK4 | CDK6 | Rb | P16 |
|---|
| Control | 0.750±0.111 | 0.310±0.036d | 0.385±0.034d | 0.335±0.034c | 0.315±0.038 |
| Experimental 1 | 0.643±0.064 | 0.248±0.034a | 0.327±0.044b | 0.277±0.028a | 0.353±0.053 |
| Experimental 2 |
0.940±0.116a,c,e |
0.387±0.040a,c |
0.473±0.039a,c |
0.412±0.040a,c,e |
0.238±0.029b,c |
| Experimental 3 | 0.792±0.076d |
0.353±0.025b,c |
0.437±0.031b,c |
0.367±0.037b,c | 0.282±0.045c |
Protein expression of cyclin D1, CDK4,
CDK6, pRb and P16 in chondrocytes following EA treatment
The protein expression of cyclin D1, CDK4, CDK6, pRb
and P16 was also detected using western blotting. Quantification of
the western blotting bands showed that levels of cyclin D1, CDK4,
CDK6 and pRb proteins in experimental group 2 were significantly
higher than levels in the control group (P=0.000, P=0.000, P=0.001,
P=0.000, respectively). In contrast, the P16 protein level in
experimental group 2 was significantly lower than that in the
control group (P=0.000) (Fig. 3
and Table V).
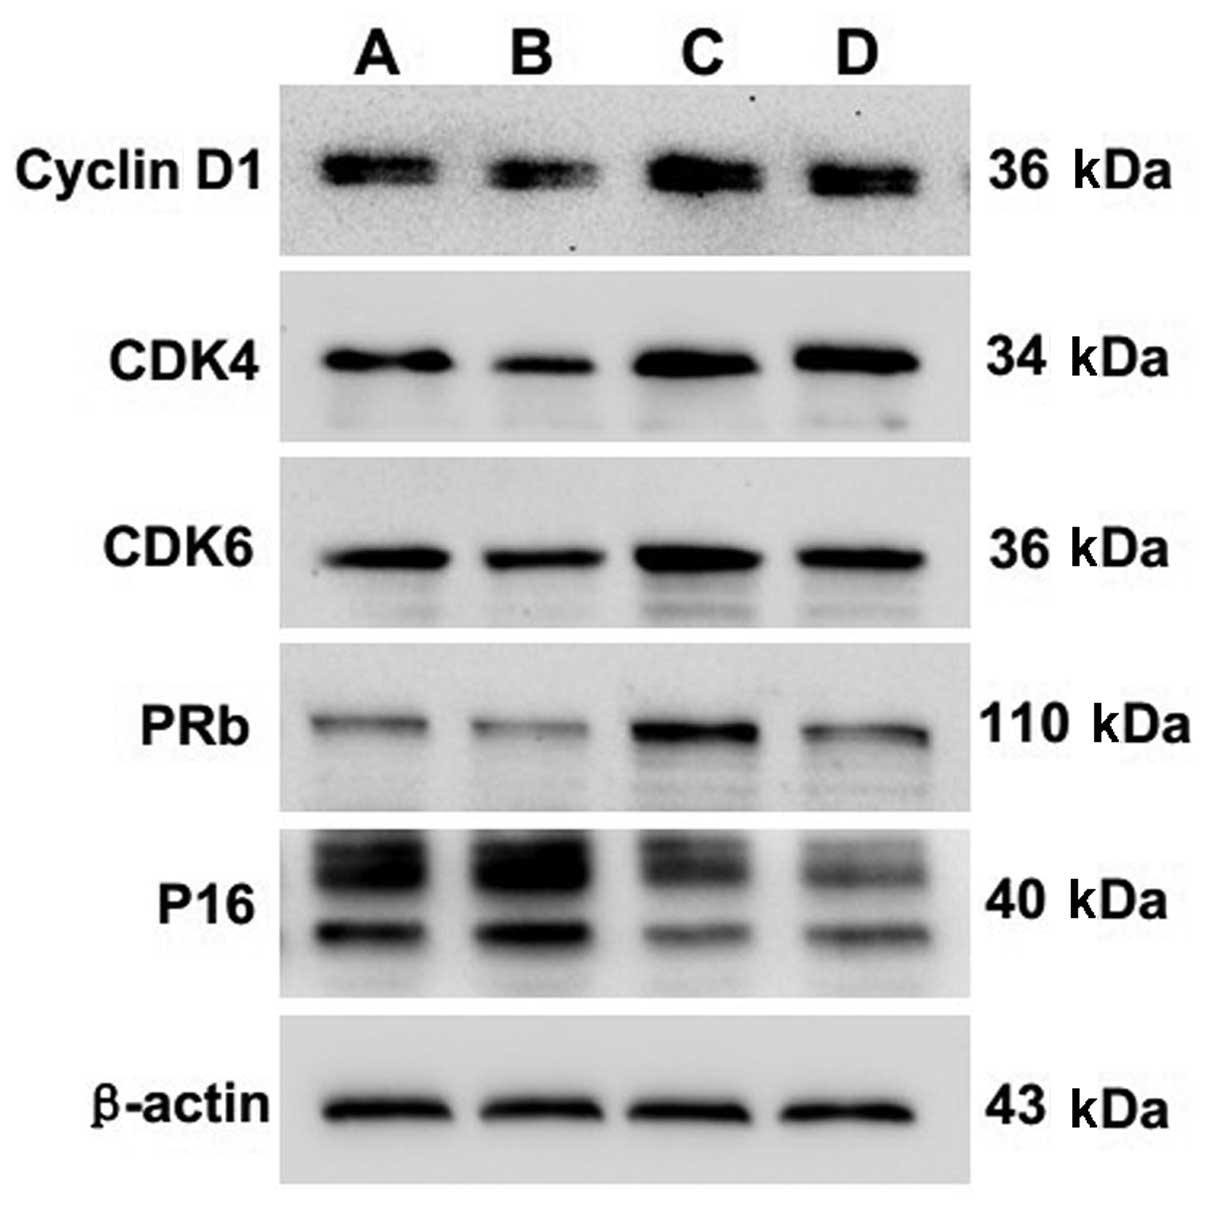 | Figure 3Effect of EA treatment and nocodazole
interference on the protein expression of cyclin D1, CDK4, CDK6,
pRb and P16 in passage 2 chondrocytes. Cells were treated with or
without EA and nocodazole for 24 h. The protein expression levels
of cyclin D1, CDK4, CDK6, pRb and P16 were analyzed by western
blotting. β-actin was used as the internal control. Data are
representative of three independent experiments. Lane A, control
group; lane B, experimental group 1; lane C, experimental group 2;
lane D, experimental group 3. |
| Table VProtein expression of cyclin D1,
CDK4, CDK6, pRb and P16 in the chondrocytes. |
Table V
Protein expression of cyclin D1,
CDK4, CDK6, pRb and P16 in the chondrocytes.
| Group | Cyclin D1 | CDK4 | CDK6 | pRb | P16 |
|---|
| Control | 0.078±0.012d | 0.378±0.025d | 0.425±0.024c | 0.065±0.005 | 0.167±0.008d |
| Experimental 1 | 0.067±0.008b | 0.305±0.021b | 0.317±0.029a | 0.053±0.010 | 0.177±0.005b |
| Experimental 2 |
0.107±0.010a,c |
0.647±0.054a,c,e |
0.628±0.050a,c,e |
0.095±0.015a,e |
0.112±0.008a,c,e |
| Experimental 3 |
0.097±0.008a,c |
0.540±0.072a,c |
0.482±0.022a,c | 0.071±0.009d |
0.135±0.010a,c |
Discussion
Osteoarthritis (OA), the most common age-related
cartilage and joint disorder (18), is a slowly progressive
degenerative disease characterized by degradation of the
extracellular matrix and cell death resulting in a gradual loss of
articular cartilage integrity (19,20). The only cell type present in
mature cartilage is the chondrocyte. This cell type is responsible
for repairing damaged cartilage tissue. We previously demonstrated
that chondrocytes can be obtained by mechanical and chemical
isolation methods and that the purity of isolated chondrocytes is
high (17,21). This provided us with the ability
to investigate the effect of EA on chondrocyte proliferation.
The working mode of EA is a disant wave and dense
wave alternating waveform. The frequency of the distant wave is one
fifth of the frequency of the dense wave; the duration time of the
distant wave is 5 sec and the duration time of the dense wave is 10
sec. The function uses low-frequency electric current stimulation
to change the distribution of hydronium between intracellular and
extracellular regions, to interfere with the signal transmission of
the organism, thus playing an effective role in cell proliferation.
Nocodazole is a drug, like colchicines, that specifically binds to
microtubules and interferes with spindle formation, thereby
blocking the cell cycle at the G2/M transition (22–24). In our study, we showed that EA
treatment efficiently promoted chondrocyte proliferation, and the
degree of the proliferative effect was dependent on the time of EA
treatment in a certain range. After nocodazole treatment,
chondrocyte proliferation was obviously inhibited in a
dose-dependent manner, but once the cells were treated with EA, the
inhibitory effect of nocodazole was weakened, suggesting that EA
treatment may function by promoting cartilage cells to pass through
the G1/S transition of the cell cycle.
There are four stages in the cell cycle:
G1, preparation for DNA synthesis; S, DNA synthesis;
G2, preparation for mitosis; and M, mitosis (25). Repetition of this cell cycle
carries out cell proliferation. The amount of DNA in a cell changes
during the cell cycle, allowing the different stages of the cycle
to be identified by analyzing DNA content. The DNA content is 2N in
G0 and G1 cells. After DNA synthesis in S
phase, the DNA content becomes 4N in the G2 and M phases
(26,27). FACS analysis, which measures the
DNA content of cells, is more sensitive to the changes during the
cell cycle than the MTT method. In the present study, we found that
after EA treatment, the G0/G1 and
G2/M ratios dropped, and the S ratio increased,
indicating that EA treatment promotes cell proliferation by
accelerating the G1/S transition. This conclusion is
also supported by our result that after nocodazole treatment, the S
phase cell ratio dramatically decreased and the G2/M
cell ratio increased.
Upstream signals are usually transduced by signaling
pathways and ultimately function on genes encoding cell cycle
regulating factors, leading to cell cycle changes by altering the
expression of these factors. The G1/S checkpoint that
exists at the end of G1 stage is the key point of
intracellular and extracellular signaling which integrates in the
nucleus, which stimulates cells to begin a new round of
proliferation, differentiation, death or exit the cell cycle into
the G0 phase. The G1/S transition is dependent on the
activity of cyclin D1-CDK4/6. Once activated, these CDK complexes
phosphorylate retinoblastoma (Rb) and related family members and
release sequestered E2F transcription factors, thereby promoting
the transcription of genes required for progression through the
cell cycle. Such progression is under the control of P16, which
causes transient or permanent cell cycle arrest in cells carrying
DNA damage. Our results showed that EA treatment effectively
enhanced the mRNA and protein levels of cyclin D1, CDK4, CDK6 and
(p)Rb and inhibited P16.
In summary, EA treatment effectively promotes
chondrocyte proliferation. The molecular mechanism of EA may act by
inducing the expression of cyclin D1, CDK4, CDK6 and Rb and
inhibiting P16, thereby accelerating G1/S transition and
promoting chondrocyte cell cycle progression. This may, in part,
explain its clinical effect in the treatment of osteoarthritis.
References
|
1
|
Yang X, Chen L, Xu X, Li C, Huang C and
Deng CX: TGF-β/Smad3 signals repress chondrocyte hypertrophic
differentiation and are required for maintaining articular
cartilage. J Cell Biol. 153:35–46. 2001.
|
|
2
|
Iannone F, De Bari C, Scioscia C, Patella
V and Lapadula G: Increased Bcl-2/p53 ratio in human osteoarthritic
cartilage: a possible role in regulation of chondrocyte metabolism.
Ann Rheum Dis. 64:217–221. 2005. View Article : Google Scholar : PubMed/NCBI
|
|
3
|
Zhou HW, Lou SQ and Zhang K: Recovery of
function in osteoarthritic chondrocytes induced by
p16INK4a-siRNA in vitro. Rheumatology. 43:555–568. 2004.
View Article : Google Scholar : PubMed/NCBI
|
|
4
|
Tetlow LC and Woolley DE: Histamine
stimulates the proliferation of human articular chondrocytes in
vitro and is expressed by chondrocytes in osteoarthritic cartilage.
Ann Rheum Dis. 62:991–994. 2003. View Article : Google Scholar : PubMed/NCBI
|
|
5
|
Hulleman E, Bijvelt JJ, Verkleij AJ,
Verrips CT and Boonstra J: Nuclear translocation of
mitogen-activated protein kinase p42MAPKduring the
ongoing cell cycle. J Cell Physiol. 180:325–333. 1999. View Article : Google Scholar : PubMed/NCBI
|
|
6
|
Ekholm SV, Zickert P, Reed SI and
Zetterberg A: Accumulation of cyclin E is not a prerequisite for
passage through the restriction point. Mol Cell Biol. 21:3256–3265.
2001. View Article : Google Scholar : PubMed/NCBI
|
|
7
|
Clurman BE and Roberts JM: Cell cycle and
cancer. J Natl Cancer Inst. 87:1499–1501. 1995. View Article : Google Scholar : PubMed/NCBI
|
|
8
|
Hirama T and Koeffler HP: Role of the
cyclin-dependent kinase inhibitors in the development of cancer.
Blood. 86:841–854. 1995.PubMed/NCBI
|
|
9
|
Kaptchuk TJ: Acupuncture: theory,
efficacy, and practice. Ann Intern Med. 136:374–383. 2002.
View Article : Google Scholar : PubMed/NCBI
|
|
10
|
No authors listed:. NIH Concensus
Conference. Acupuncture. JAMA. 280:1518–1524. 1998.PubMed/NCBI
|
|
11
|
Jubb RW, Tukmachi ES, Jones PW, Dempsey E,
Waterhouse L and Brailsford S: A blinded randomised trial of
acupuncture (manual and electroacupuncture) compared with a
non-penetrating sham for the symptoms of osteoarthritis of the
knee. Acupunct Med. 26:69–78. 2008. View Article : Google Scholar : PubMed/NCBI
|
|
12
|
Tukmachi E, Jubb R, Dempsey E and Jones P:
The effect of acupuncture on the symptoms of knee osteoarthritis -
an open randomised controlled study. Acupunct Med. 22:14–22. 2004.
View Article : Google Scholar : PubMed/NCBI
|
|
13
|
Vas J and White A: Evidence from RCTs on
optimal acupuncture treatment for knee osteoarthritis - an
exploratory review. Acupunct Med. 25:29–35. 2007. View Article : Google Scholar : PubMed/NCBI
|
|
14
|
Aoki E, Kasahara T, Hagiwara H, Sunaga M,
Hisamitsu N and Hisamitsu T: Electroacupuncture and moxibustion
influence the lipopolysaccharide-induced TNF-alpha production by
macrophages. In Vivo. 19:495–500. 2005.PubMed/NCBI
|
|
15
|
Takaoka Y, Ohta M, Ito A, et al:
Electroacupuncture suppresses myostatin gene expression: cell
proliferative reaction in mouse skeletal muscle. Physiol Genomics.
30:102–110. 2007. View Article : Google Scholar : PubMed/NCBI
|
|
16
|
Wu G, Peng J, Wu M, Li Y, Huang Y, Lin R,
Cai Q and Liu X: Experimental study of low-frequency
electroacupuncture-induced differentiation of bone marrow
mesenchymal stem cells into chondrocytes. Int J Mol Med. 27:79–86.
2011.PubMed/NCBI
|
|
17
|
Li X, Du M, Liu X, Wu M, Ye H, Lin J, Chen
W and Wu G: Millimeter wave treatment inhibits NO-induced apoptosis
of chondrocytes through the p38MAPK pathway. Int J Mol Med.
25:393–399. 2010.PubMed/NCBI
|
|
18
|
Heinegard D, Bayliss M and Lorenzo P:
Biochemistry and metabolism of normal and osteoarthritic cartilage.
Osteoarthritis. Brandt KD, Doherty M and Lohmander LS: Oxford
University Press; New York: pp. 74–84. 1998
|
|
19
|
Pritzker K: Pathology of osteoarthritis.
Osteoarthritis. Brandt KD, Doherty M and Lohmander LS: Oxford
University Press; New York: pp. 50–61. 1998
|
|
20
|
Kim HA and Blanco FJ: Cell death and
apoptosis in osteoarthritic cartilage. Curr Drug Targets.
8:333–345. 2007. View Article : Google Scholar : PubMed/NCBI
|
|
21
|
Li X, Du M, Liu X, Chen W, Wu M, Lin J and
Wu G: Millimeter wave treatment promotes chondrocyte proliferation
by upregulating the expression of cyclin-dependent kinase 2 and
cyclin A. Int J Mol Med. 26:77–84. 2010.PubMed/NCBI
|
|
22
|
Hsu SL, Yu CT, Yin SC, Tang MJ, Tien AC,
Wu YM and Huang CY: Caspase 3, periodically expressed and activated
at G2/M transition, is required for nocodazole-induced mitotic
checkpoint. Apoptosis. 11:765–771. 2006. View Article : Google Scholar : PubMed/NCBI
|
|
23
|
Song H, Kim SI, Ko MS, et al:
Overexpression of DRG2 increases G2/M phase cells and decreases
sensitivity to nocodazole-induced apoptosis. J Biochem.
135:331–335. 2004. View Article : Google Scholar : PubMed/NCBI
|
|
24
|
Ho YS, Duh JS, Jeng JH, et al:
Griseofulvin potentiates anti-tumorigenesis effects of nocodazole
through induction of apoptosis and G2/M cell cycle arrest in human
colorectal cancer cells. Int J Cancer. 91:393–401. 2001.PubMed/NCBI
|
|
25
|
Zhang M, Xie R, Hou W, et al: PTHrP
prevents chondrocyte premature hypertrophy by inducing
cyclin-D1-dependent Run×2 and Run×3 phosphorylation, ubiquitylation
and proteasomal degradation. J Cell Sci. 122:1382–1389.
2009.PubMed/NCBI
|
|
26
|
Hwang SG, Song SM, Kim JR, Park CS, Song
WK and Chun JS: Regulation of type II collagen expression by
cyclin-dependent kinase 6, cyclin D1, and p21 in articular
chondrocytes. IUBMB Life. 59:90–98. 2007. View Article : Google Scholar : PubMed/NCBI
|
|
27
|
Li TF, Chen D, Wu Q, et al: Transforming
growth factor-beta stimulates cyclin D1 expression through
activation of beta-catenin signaling in chondrocytes. J Biol Chem.
281:21296–21304. 2006. View Article : Google Scholar : PubMed/NCBI
|