Introduction
Duchenne muscular dystrophy is the most frequent
gender- specific genetic disease of the neuromuscular system and is
characterised by symmetric and highly progressive muscle wasting.
Degeneration of muscle fibers and subsequent fibrosis result in
gait disturbance in early childhood followed by the loss of
ambulation and severe cardiorespiratory complications in older
children (1). Primary genetic
abnormalities in the dystrophin gene cause the loss of a crucial
membrane cytoskeletal protein of 427 kDa that is normally located
in the subsarcolemmal region of the muscle fibers (2). Although considerable progress has
been made in the development of genetic and cell-mediated
approaches to eliminate the primary abnormality in
dystrophinopathies (3), there is
still the urgent need to address secondary alterations in the
highly complex pathology of X-linked muscular dystrophy (4,5).
One promising approach is the detailed molecular and cellular
analysis of genetic animal models of muscular dystrophy and the
subsequent evaluation of novel substances or treatment strategies
in experimental phenotypes (6).
In this respect, the X-linked muscular dystrophy (mdx) mouse is the
most widely used animal model of Duchenne muscular dystrophy for
studying secondary effects due to the reduction of the
dystrophin-glycoprotein complex (7–10).
A point mutation in exon 23 induces a loss in the
expression of the dystrophin isoform, Dp427, in muscle tissue from
mdx mice (11). However, the same
primary abnormality does not cause identical downstream effects in
different muscles, making the mdx mouse an extremely interesting
model system for studying secondary effects in dystrophinopathy. As
previously reported, whilst the extraocular and laryngeal muscles
are only mildly affected (12–14), the hind limb muscles exhibit a
moderate dystrophic phenotype (15–17) and the diaphragm muscle is severely
degenerated (18–20). The comparative analysis of
differentially affected muscles may thus be helpful in determining
how a single mutation in a muscle-specific gene can result in such
a variety of pathophysiological phenotypes.
Over the last few years, mass spectrometry
(MS)-based proteomics has been successfully applied to investigate
normal and pathologically altered skeletal muscle tissue (21–23), establishing a variety of novel
proteomic biomarkers of neuromuscular disorders (24). This has included the large-scale
proteomic profiling of various muscle tissues from mdx mice and has
revealed differential degrees of perturbed protein expression
patterns in dystrophin-deficient fibers (25). Gel electrophoresis-based
proteomics has been applied to evaluate dystrophic muscles from mdx
mice focusing on the cytosolic fraction from 1- to 6-month-old hind
limb muscle covering an isoelectric point (pI) range of 4–7
and using Coomassie and silver staining (26,27), crude extracts from gastrocnemius
muscle from 9-week-old hind limb tissue covering a pI range
of 3–10 and using Stains-All labelling (28), crude extracts from 9-week-old
diaphragm tissue covering a pI range of 3–10 and using hot
Coomassie staining (29), crude
extracts from 9-week-old diaphragm tissue covering a pI
range of 3–10 and using fluorescence two-dimensional difference in
gel electrophoresis (2D-DIGE) (30), crude extracts from 10-week-old
antisense oligomer-treated diaphragm tissue covering a pI
range of 3–10 and using 2D-DIGE (31), extracts from 6-week-old
gastrocnemius muscle covering a pI range of 3–10 and using
2D-DIGE (32), total extracts
from 22-month-old diaphragm covering a pI range of 3–10 and
using fluorescence labelling (33), total extracts from 22-month-old
tibialis anterior muscle covering a pI range of 3–10 and
using fluorescence labelling (34) and crude extracts from 9-week-old
extraocular muscle covering a pI range of 3–10 and using
fluorescence 2D-DIGE (35).
Recently, gel-free in vivo SILAC proteomics was carried out
with 3-week-old gastrocnemius muscle (36). In addition, proteomics has been
used to evaluate novel protein factors in serum (37,38) and dystrophic heart tissue
(39–42).
It is to be hoped that the establishment of a
detailed biomarker signature of X-linked muscular dystrophy will
improve our understanding of the pathobiochemical processes
underlying dystrophinopathy. A comprehensive list of secondary
effects would also be extremely useful for the biochemical
evaluation of experimental treatments, such as stem cell therapy or
exon-skipping approaches to ameliorate downstream alterations of
dystrophin deficiency (4,5). The underlying objective of this
study was the formation of an mdx reference map of differentially
affected muscles with the same primary abnormality but diverging
downstream effects. In humans, the equivalent mouse muscle tissue
subtypes investigated relate to i) soleus (SOL), a muscle of the
back part of the lower leg lying just beneath the gastrocnemius
that contains almost exclusively oxidative fibers; ii) extensor
digitorum longus (EDL), a muscle located in the lateral part of the
front of the leg that contains a large portion of glycolytic type
2B and 2X fibers; iii) flexor digitorum brevis (FDB), a muscle that
lies in the middle of the sole of the foot and contains a high
number of oxidative-glycolytic type 2A fibers; and iv) interosseus
(INT), muscles of the hand located near the metacarpal bones that
contain predominantly type 2 fibers (43–46). All four muscles have been widely
used to investigate alterations of muscle structure, function,
physiology and biochemistry in mdx mice.
However, with respect to routine biological
analyses, each of these muscle subtypes has strengths and
weaknesses. While EDL and SOL are well suited to study muscle
biochemistry, force and fatigue, FDB and INT can be enzymatically
dissociated into single fibers. The two latter muscles can quite
easily be studied on the single fiber level. Thus, many
observations on Ca2+ influx, subsarcolemmal
Ca2+ levels and the function of cation channels have
been made with INT (9,47,48) and FDB (47,49,50) muscles without taking into
consideration whether these findings can be generalised.
Accordingly, we included FDB and INT muscle preparations in our
proteomic analyses to evaluate whether they display similar
abnormalities as compared to other limb muscles from mdx mice.
Proteomics revealed an altered expression for 24, 17, 19 and 5
protein species in the dystrophic SOL, EDL, FDB and INT muscles,
respectively. These marked differences in the degree of protein
perturbation are possibly a result of dissimilar secondary
processes in the molecular pathogenesis of different subtypes of
muscles from mdx mice.
Materials and methods
Materials
Immobilised pH gradient strips of pH 3–10, IPG
buffers and electrophoresis-grade chemicals were obtained from
Amersham Biosciences/GE Healthcare (Little Chalfont, UK).
Acrylamide stock solutions were purchased as ultrapure protogel
mixtures from National Diagnostics (Atlanta, GA, USA). Fluorescent
ruthenium II bathophenathroline disulfonate for the production of
RuBPs dye was from Reagecon Diagnostics Ltd. (Shannon, Ireland).
Coomassie blue dye, Laemmli-type gel buffers and protein molecular
mass standards, as well as Bradford reagent for protein
quantification were from Bio-Rad Laboratories (Hemel-Hempstead,
UK). Chemiluminescence substrate and protease inhibitors were
purchased from Roche Diagnostics (Mannheim, Germany). For the
reproducible generation of peptide populations from 2D spots by
in-gel digestion, sequencing grade-modified trypsin was obtained
from Promega Corp. (Madison, WI, USA). LC-MS CHROMASOLV®
water and formic acid were from Fluka (Dorset, UK). Nitrocellulose
transfer stacks were obtained from Invitrogen Life Technologies
(Carlsbad, CA, USA). X-ray film was from Fuji Photo Film (Tokyo,
Japan). Antibodies were purchased from Abcam (Cambridge, UK;
ab77232 to myoglobin, ab9465 to actinin, ab11427 to parvalbumin,
ab6588 to collagen, ab75223 to phosphoglycerate kinase, ab14226 to
serpina and ab13496 to αB-crystallin) and Sigma (Dorset, UK; L9393
to laminin). All secondary antibodies were from Chemicon
International (Temecula, CA, USA). Ponceau S red staining solution,
DNase-I and all general chemicals were obtained from Sigma.
Genetic mouse model of Duchenne muscular
dystrophy
In analogy to patients suffering from X-linked
muscular dystrophy, the mutant mdx mouse is missing the Dp427
isoform of the membrane cytoskeletal protein, dystrophin (8), and exhibits a drastic reduction in
dystrophin-associated glycoproteins (51). The genetic basis of this
abnormality is a single base substitution within exon 23 of the
dystrophin gene (11). SOL, EDL,
FDB and INT muscles from 3-month-old mdx mice (C57BL/10 ScSn Dmdy
(mdx)/J) and age-matched wild-type (WT) mice (C57BL/10 ScSn) were
obtained from the BioResource Unit of the University of Greifswald,
Greifswald, Germany (52). The
mouse strains were originally obtained from the Jackson Laboratory
(Bar Harbor, ME, USA). Mice were kept under standard conditions and
all procedures were performed in accordance with the German
guidelines on the use of animals for scientific experiments
(approval by District Veterinary Office, Anklam, Germany). The
animals were sacrificed by cervical dislocation and muscle tissues
were immediately removed. The samples used for proteomic analysis
were quick-frozen in liquid nitrogen and those for histological
staining were frozen in petroleum ether at −90°C.
Histological Analyses
Frozen muscle tissue was cut into 7 μm cross
sections using a cryostat (Frigocut 2800N, Leica). The sections
were stained with hematoxylin and eosin (H&E) according to
standard protocols. Central and peripheral nuclei of muscle fibers
were counted. For evaluation, digital microscopic recordings with a
magnification of ×200, were analysed. Muscles specimens from six
mice per strain were investigated.
Proteomic analysis
For the proteomic analysis of mdx tissue, muscle
specimens were shipped to Ireland on dry ice and stored at −80°C
prior to usage. In order to obtain sufficient protein extracts, 30
dystrophic and 30 normal specimens from each skeletal muscle
investigated were pulverised by grinding the tissue pieces in
liquid nitrogen using a mortar and pestle. The ground muscle powder
was solubilised in lysis buffer with the ratio of 100 mg wet
weight/ml lysis buffer [7 M urea, 2 M thiourea, 4% CHAPS, 2% IPG
buffer pH 3–10, 2% (w/v) DTT]. To prevent excess protein
degradation, the lysis buffer was supplemented with a freshly
prepared protease inhibitor cocktail as previously descrbied
(29). Following gentle rocking
for 60 min, the suspensions were centrifuged at 4°C for 20 min at
15,000 × g (35) and the protein
concentration was determined as previously described (53).
2D gel electrophoresis
The high-resolution 2D gel electrophoretic
separation of the urea-soluble protein complement from normal vs.
dystrophic SOL, EDL, FDB and INT muscle tissue was carried out
using a total protein amount of 500 μg per analytical slab gel.
Using a reswelling tray from Amersham Biosciences/GE Healthcare,
IPG strips of pH 3–10 were rehydrated for 12 h with 0.45 ml of a
rehydration buffer containing 7 M urea, 2 M thiourea, 65 mM CHAPS,
10 mg/ml DTT, and 500 μg of muscle protein sample, as well as 1%
(v/v) ampholytes pH 3–10. As a tracking dye, the buffer was
complemented with 0.05% (w/v) bromophenol blue. Following placement
of the first-dimension strips (24 cm in length) gel-side up onto
the Ettan IPGphor manifold and coverage with 108 ml of dry-strip
cover fluid, gels were run on the IPGphor IEF system with the
following isoelectric focusing running conditions: 80 V for 4 h,
100 V for 2 h, 500 V for 1.5 h, 1,000 V for 1 h, 2,000 V for 1 h,
4,000 V for 1 h, 6,000 V for 2 h, 8,000 V for 2.5 h, and 500 V
holding step; and 8,000 V for 1 h if strips had been at the 500 V
holding step. Gel strips were then equilibrated for 30 min; using
during the first 15 min of equilibration a buffer system with 100
mM dithiothreitol and during the last 15 min of incubation an
equilibration buffer containing 0.25 M iodoacetamide. The second
dimension separation was carried out with an Ettan DALTtwelve
system from Amersham Biosciences/GE Healthcare using standard 12.5%
(w/v) slab gels. Following washing in sodium dodecyl
sulfate-containing running buffer, isoelectric focusing strips were
placed on top of second dimension gels and held in place with a 1%
(w/v) agarose sealing gel. The comparative proteomic profiling of
SOL, EDL, FDB and INT muscles required the employment of 32 slab
gels, which were run at 0.5 W/gel for 60 min and then 15 W/gel was
used until the blue dye front had disappeared from the bottom of
the gel.
Post-electrophoretic protein labelling
with fluorescent ruthenium II tris(bathophenanthroline disulfonate)
(RuBPs) dye
The staining of 2D gels was carried out with the
fluorescent dye, RuBPs, as previously described (54). A stock solution of RuBPs dye was
prepared as outlined by Rabilloud et al(55). Following fixation for 30 min in
30% ethanol and 10% acetic acid, the gels were washed three times
for 30 min in 20% ethanol and then stained for 6 h in 20% (v/v)
ethanol containing 2 μM of ruthenium chelate. The gels were
re-equilibrated twice for 10 min in distilled water and destained
overnight in 40% ethanol and 10% acetic acid prior to imaging
(41). Fluorescently labelled
proteins were visualised using a Typhoon Trio variable mode imager
(Amersham Biosciences/GE Healthcare). Gel analysis was performed
with Progenesis SameSpots analysis software from Nonlinear Dynamics
(Newcastle upon Tyne, UK) using the following parameters: ANOVA
p<0.05; n=4; and a power value >0.8. The 12.5% (w/v) slab
gels used in this study separated muscle-associated proteins
ranging in molecular mass from approximately 15–220 kDa. Proteins
in spots with a significant increase or decrease in abundance
(differing between the various groups with >2-fold change) were
identified by MS.
MS identification of muscle proteins
The mass spectrometric identification of proteins of
interest was carried out with 2D protein spots from
Coomassie-stained pick gels, following counter-staining of
RuBPs-labelled analytical gels. Standardised in-gel tryptic
digestion was used for the generation of representative peptide
mixtures (54). The excision of
gel plugs, washing and destaining of protein spots and treatment
with trypsin were performed by a previously optimised method
(56,57). Trypsin-generated peptides were
harvested by removing supernatants from digested gel plugs after
centrifugation. Further recovery was achieved by the addition of
30% acetonitrile/0.2% trifluoroacetic acid to the gel plugs for 10
min at 37°C with gentle agitation. The resulting supernatants were
pooled with the initially recovered peptides following trypsin
digestion (58). Peptide samples
were dried through vacuum centrifugation and concentrated fractions
were suspended in MS-grade distilled water and 0.1% formic acid,
spun down through spin filters and added to LC-MS vials for
identification by ion trap LC-MS analysis. Electrospray ionization
LC-MS/MS analysis was carried out as previously described (56) using a Model 6340 Ion Trap/LC-MS
apparatus from Agilent Technologies (Santa Clara, CA, USA). The
separation of peptides was performed with a nanoflow Agilent 1200
series system equipped with a Zorbax 300SB-C18 analytical reversed
phase column using HPLC-Chip technology. Mobile phases used were A,
0.1% formic acid; B, 50% acetonitrile and 0.1% formic acid. Samples
were loaded into the enrichment part of the chip at a capillary
flow rate set to 4 μl/min with a mixture of solvent A and solvent B
at a ratio of 19:1. Tryptic digests were eluted with a linear
gradient of 5–70% solvent B over 6 min, 70–100% solvent B over 1
min, 100–5% over 1 min (56). A
5-min post-time of solvent A was used to remove any potential
carry-over. The capillary voltage was set to 2,000 V. The flow and
temperature of the drying gas were 4 l/min and 300°C, respectively.
Database searches were carried out with Mascot MS/MS ion search
(Matrix Science Ltd., London, UK; NCBI database, release 20100212).
All searches used ‘Mus musculus’ as taxonomic category and
the following parameters: i) two missed cleavages by trypsin; ii)
mass tolerance of precursor ions ±2.5 kDa and product ions ±0.7
kDa; iii) carboxymethylated cysteins fixed modification; iv)
oxidation of methionine as variable modification; and v) at least
two matched distinct peptides. Mascot scores >50 are listed in
Tables I–IV. All pI-values and molecular
masses of identified proteins were compared to the relative
position of their corresponding 2D-spots on analytical slab
gels.
 | Table IList of muscle-associated proteins
with an altered abundance in the soleus muscle from mdx mice. |
Table I
List of muscle-associated proteins
with an altered abundance in the soleus muscle from mdx mice.
| Spot no. | Protein name | Accession no. | Mascot score | pI | Molecular mass
(Da) | Peptides
matched | Sequence coverage
(%) | Fold change |
|---|
| 1 | Myosin light chain
2 (MLC2) | AAA39796 | 401 | 4.71 | 18870 | 9 | 60 | 5.0 |
| 2 | Cadherin 13 | AAH21628 | 104 | 4.9 | 78474 | 2 | 4 | 4.4 |
| 3 | Aldolase A, isoform
2 | NP031464 | 136 | 8.31 | 39795 | 17 | 40 | 4.3 |
| 4 | αB-crystallin | NP034094 | 121 | 6.76 | 20056 | 3 | 28 | 4.2 |
| 5 | Myosin light chain
3 (MLC3) | EDL09001 | 268 | 5.03 | 22523 | 6 | 38 | 3.3 |
| 6 | Troponin C,
skeletal muscle | NP033420 | 190 | 4.07 | 18156 | 2 | 20 | 3.1 |
| 7 | Glutathione
S-transferase | NP034488 | 415 | 7.71 | 26069 | 9 | 42 | 2.8 |
| 8 | 14-3-3 Protein
γ | NP036611 | 145 | 4.8 | 28519 | 4 | 9 | 2.8 |
| 9 | αB-crystallin | NP034094 | 58 | 6.76 | 20056 | 1 | 14 | 2.8 |
| 10 | Collagen α-1 (VI)
chain | NP034063 | 224 | 5.2 | 109582 | 13 | 16 | 2.6 |
| 11 | Myosin light chain
2 (MLC2) | NP058034 | 272 | 4.82 | 19059 | 4 | 31 | 2.5 |
| 12 | Mg-dependent
phosphatase 1 | NP075886 | 98 | 6.29 | 18629 | 3 | 29 | 2.4 |
| 13 | Ferritin light
chain 1 | P29391 | 372 | 5.66 | 20848 | 6 | 44 | 2.3 |
| 14 | αB-crystallin | NP034094 | 141 | 6.76 | 20056 | 13 | 60 | 2.3 |
| 15 | 14-3-3 Protein
ζ | BAA13421 | 258 | 4.7 | 27911 | 4 | 18 | 2.2 |
| 16 | Myosin binding
protein C, slow | HQ848554 | 411 | 5.74 | 127046 | 9 | 10 | 2.1 |
| 17 | Myosin light chain
2 (MLC2) | NP058034.1 | 161 | 4.82 | 19059 | 5 | 44 | 2.1 |
| 18 |
Peroxiredoxin-1 | NP035164 | 170 | 8.26 | 22394 | 5 | 24 | 2.0 |
| 19 | Myosin light chain
1/3 (MLC1/3) | NP067260 | 514 | 4.98 | 20697 | 11 | 53 | 2.0 |
| 20 | Tumor metastatic
process-associated protein NM23 | AAA39826 | 141 | 8.44 | 18846 | 4 | 40 | −2.0 |
| 21 | Myoglobin | NP038621 | 161 | 7.07 | 17117 | 2 | 21 | −2.1 |
| 22 | Atp5b protein | BC037127 | 488 | 5.24 | 56632 | 7 | 20 | −2.2 |
| 23 | Creatine kinase
M-type | NP031736 | 97 | 6.58 | 43250 | 2 | 7 | −2.3 |
| 24 | Malate
dehydrogenase | AAA39509 | 132 | 8.93 | 36052 | 5 | 22 | −4.2 |
| Table IVList of muscle-associated proteins
with an altered abundance in the interosseus muscle from mdx
mice. |
Table IV
List of muscle-associated proteins
with an altered abundance in the interosseus muscle from mdx
mice.
| Spot no. | Protein name | Accession no. | Mascot score | pI | Molecular mass
(Da) | Peptides
matched | Sequence coverage
(%) | Fold change |
|---|
| 1 | Troponin I, fast
skeletal muscle | NP033431 | 301 | 8.65 | 21518 | 8 | 29 | 4.1 |
| 2 | Troponin I, fast
skeletal muscle | NP033431 | 245 | 8.65 | 21518 | 5 | 21 | 3.4 |
| 3 | αB-crystallin | NP034094 | 421 | 6.76 | 20056 | 9 | 56 | 2.2 |
| 4 | 40 kDa Protein | 1405340A | 164 | 4.80 | 32848 | 3 | 15 | 2.1 |
| 5 | Parvalbumin, α | NP038673 | 400 | 5.02 | 11923 | 7 | 63 | −2.2 |
Verification of key proteomic findings by
immunoblot analysis
In order to verify potential alterations in the
concentration of select muscle-associated proteins and to confirm
the findings from the comparative proteomic profiling of dystrophic
muscle specimens from mdx mice, immunoblotting of proteins of
interest was carried out. Following the electrophoretic transfer of
proteins onto nitrocellulose membranes, the sheets were blocked in
a fat-free milk protein solution for 1 h and then incubated
overnight with gentle agitation with primary antibody, sufficiently
diluted in blocking solution containing 5% (w/v) milk powder in
phosphate buffered saline [PBS; 0.9% (w/v) NaCl, 50 mM sodium
phosphate, pH 7.4] as previously described (56). Following washing with blocking
solution twice for 10 min, the blots were incubated for 1 h with
secondary peroxidase-conjugated antibodies, diluted in blocking
solution. Antibody-decorated bands in washed blots were visualised
by the enhanced chemiluminescence method following the
manufacturer’s recommendations. Densitometric scanning of
immunoblots was performed on a Computing Densitometer 300S
(Molecular Dynamics, Sunnyvale, CA, USA) with ImageQuant tools V3.0
software (29).
Results
Histological profiling of skeletal muscle
tissue from mdx mice
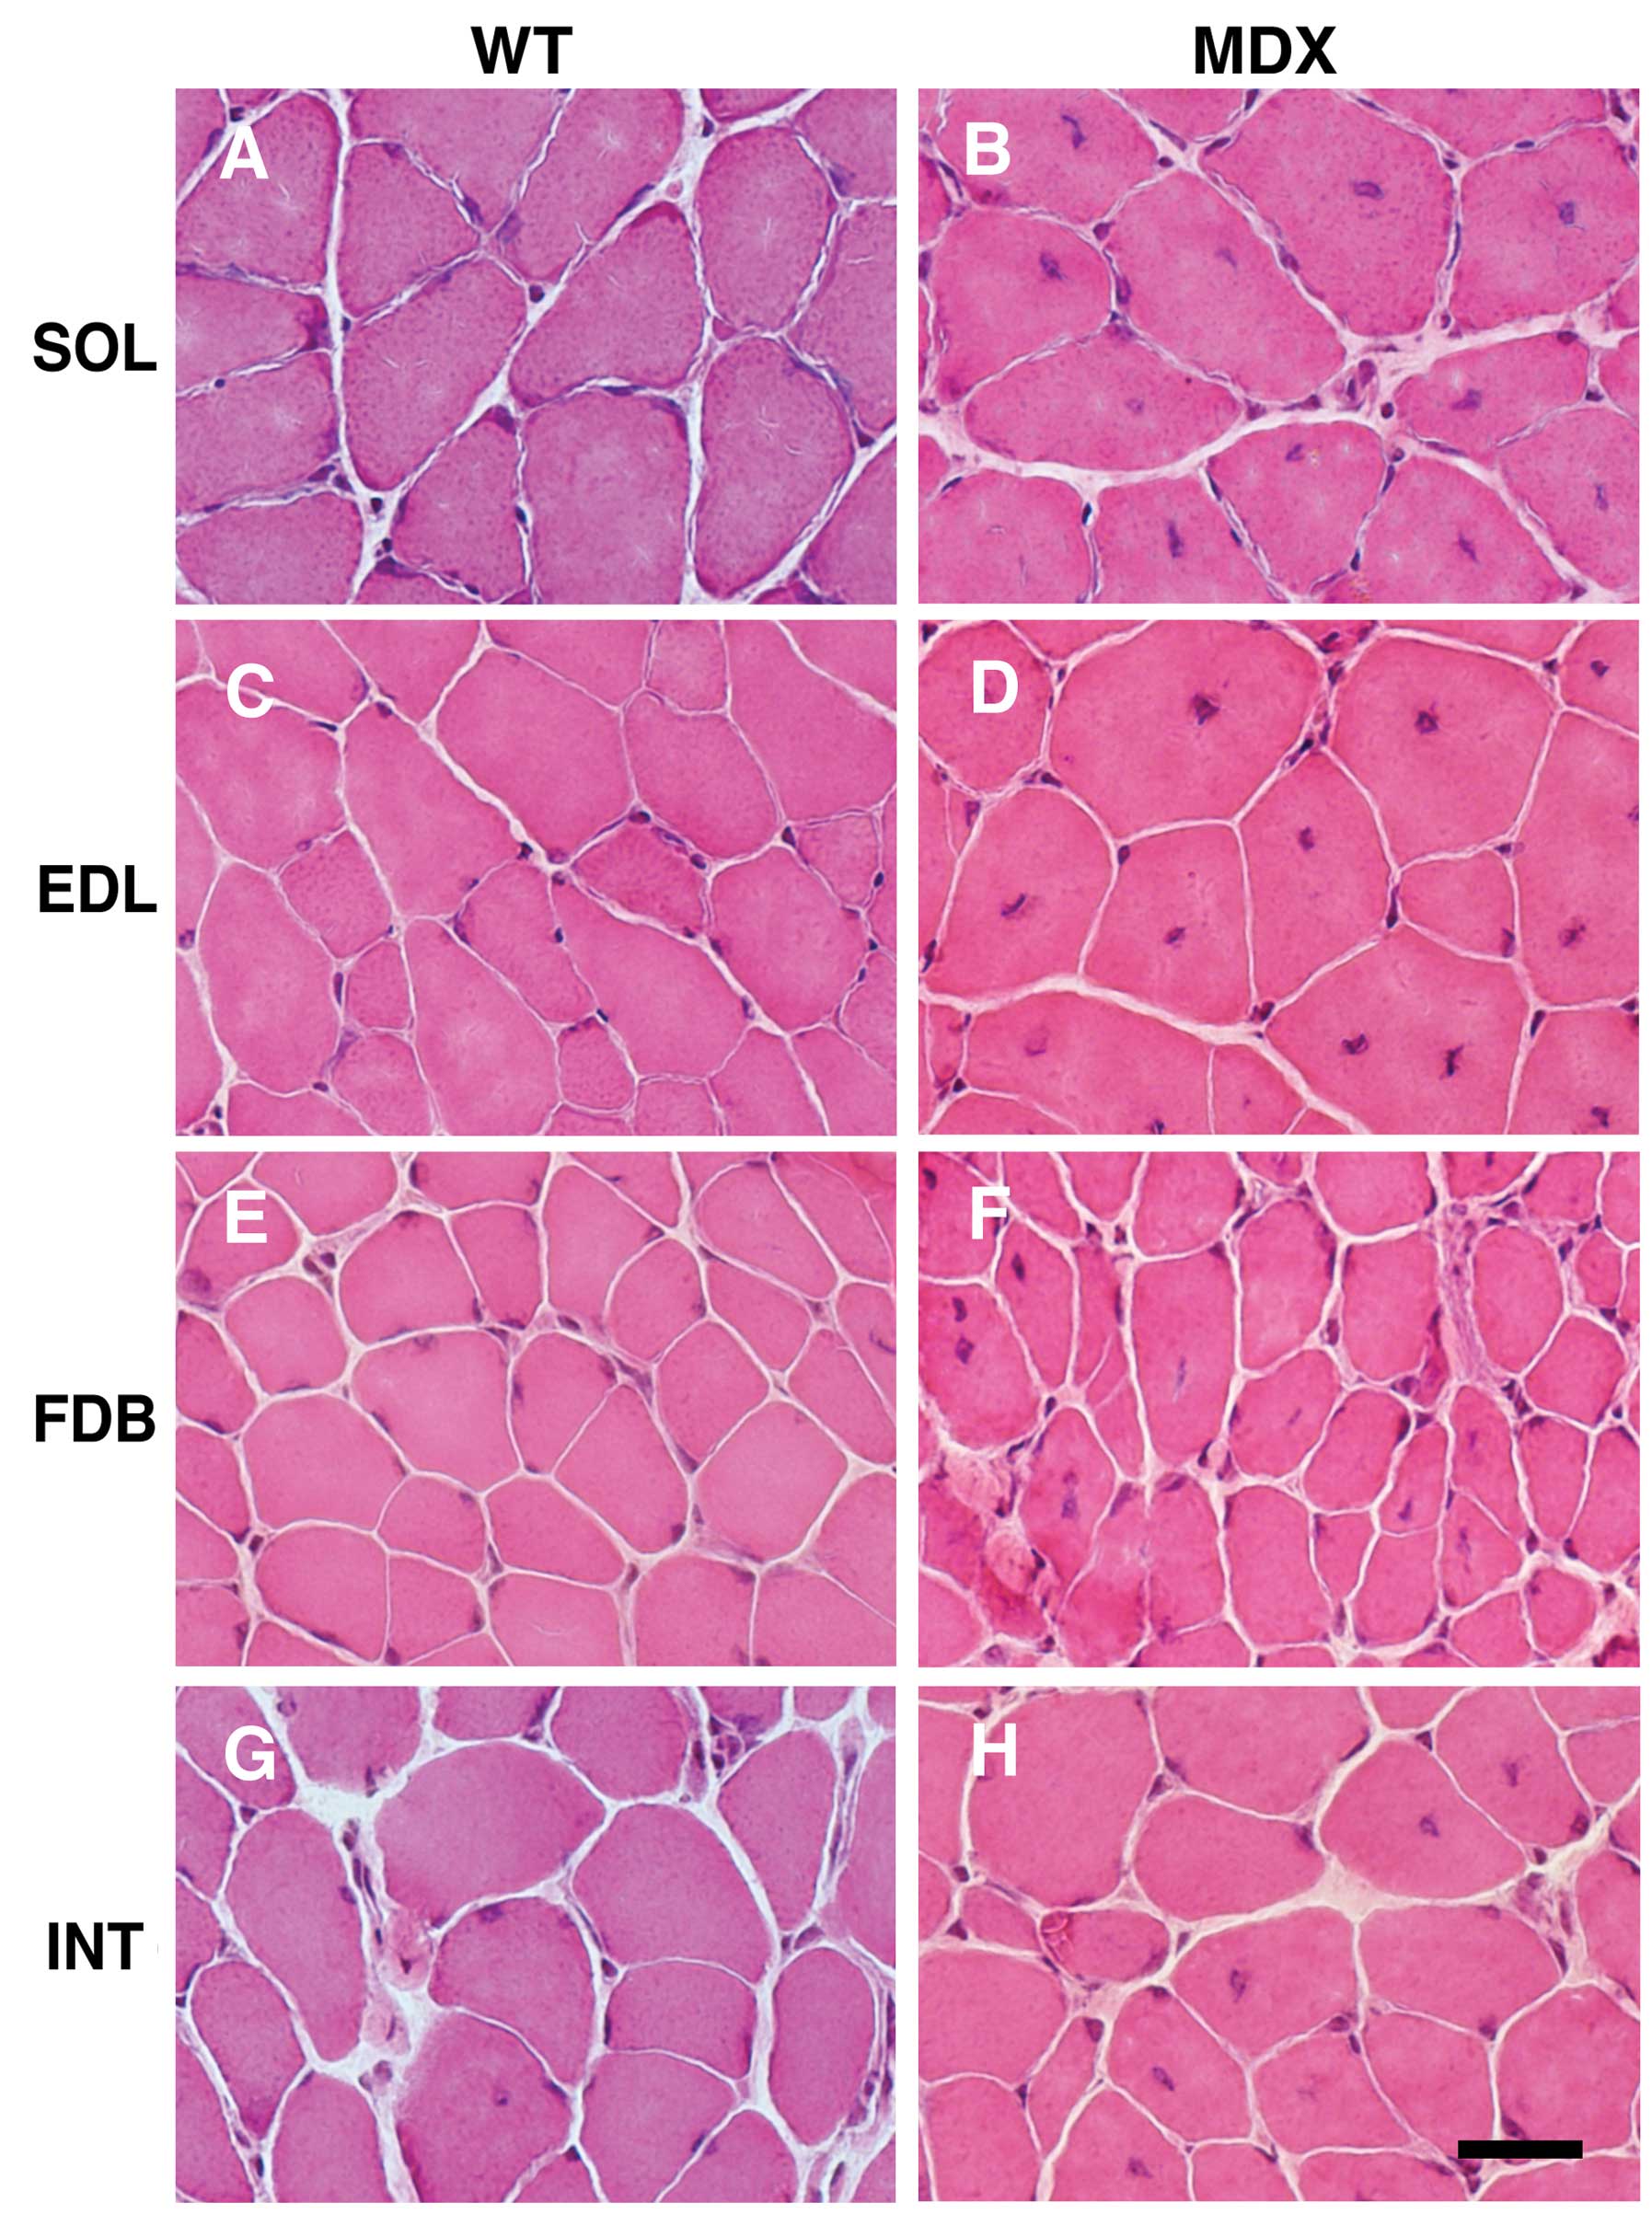
The histological examination of cross sections from
the SOL, EDL, FDB and INT muscles revealed central nucleation in
all tested types of skeletal muscle from mdx mice (Fig. 1B, D, F and H). In addition, the
muscles revealed fiber size variations and the occurrence of small,
rounded fibers. As expected, central nuclei were rarely observed in
the muscle fibers from WT mice (Fig.
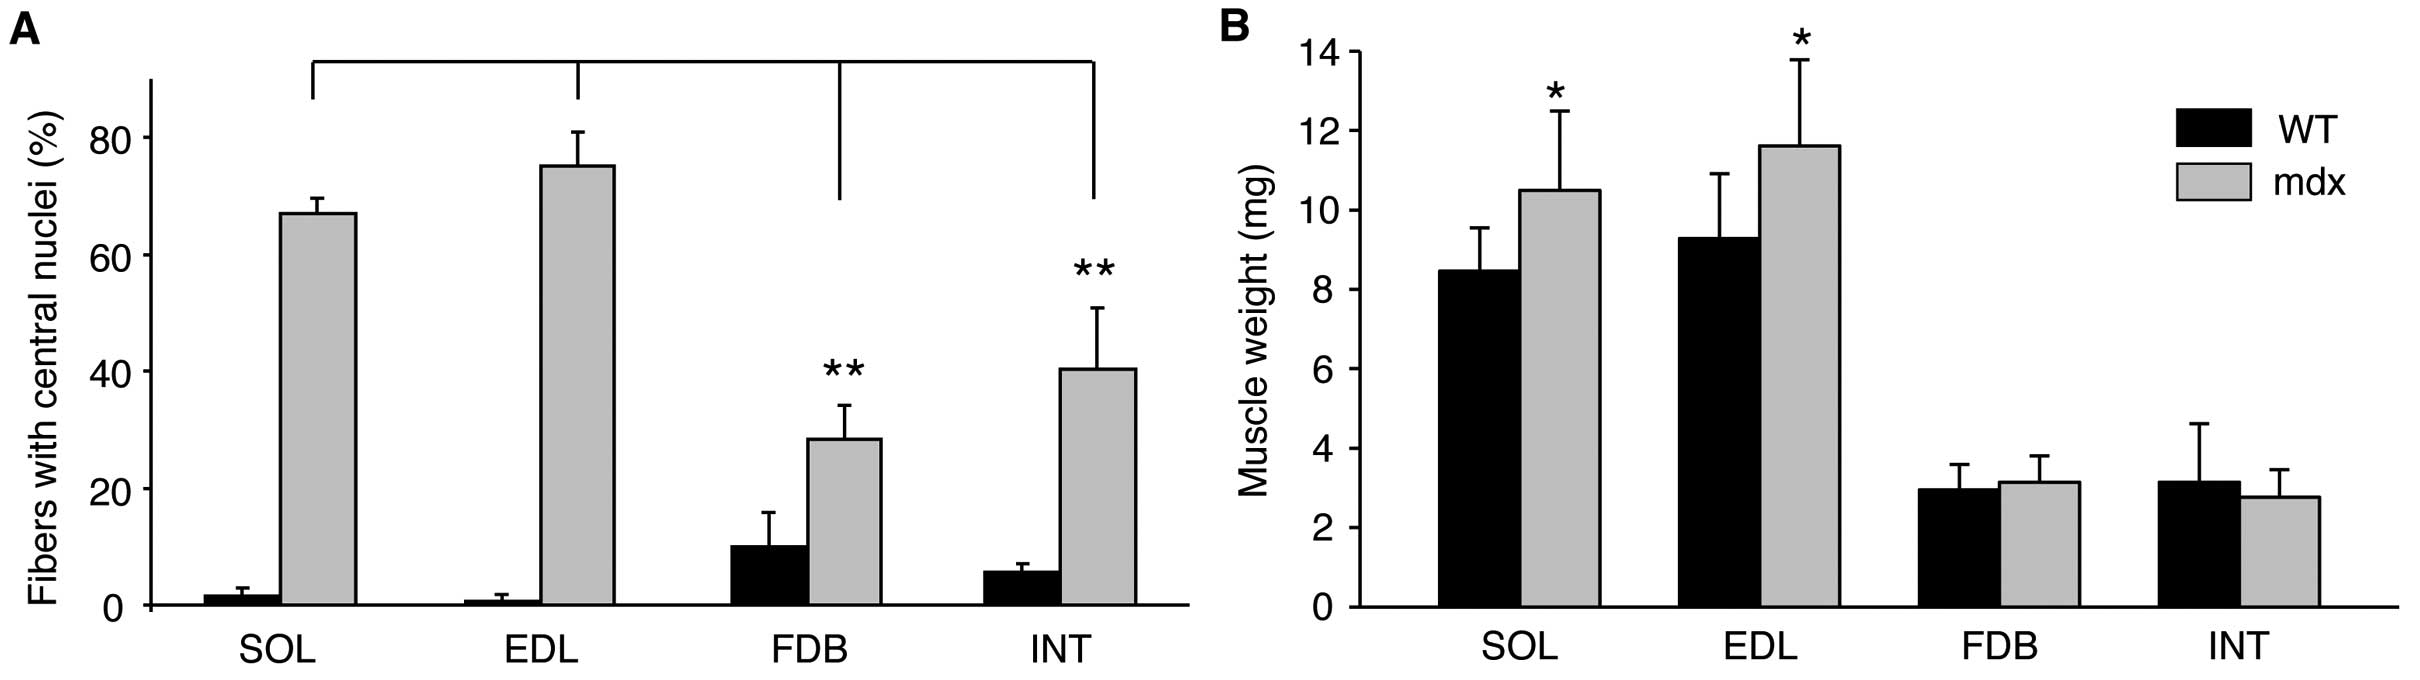
1A, C, E and G). Quantitative evaluation of central nucleation
revealed a significantly lower degree of nucleation in the FDB and
INT muscles compared with the SOL and EDL muscles (Fig. 2A). It is well known that
dystrophin-deficient muscle can develop a mild hypertrophy, at
least at certain stages. While the body weight of mdx mice was
almost identical to that of the WT mice (data not shown), the mass
of the EDL and SOL muscles from the mdx animals was on average
20–25% higher. By contrast, no evidence of hypertrophy was
observerd for the two smaller muscles, FDB and INT (Fig. 2B).
Comparative proteomic profiling of
skeletal muscle tissue from mdx mice
High-resolution 2D gel electrophoresis was used to
separate the urea-soluble portion of the assessable proteome from
normal vs. dystrophic SOL, EDL, FDB and INT muscle tissues.
Post-electrophoretic labelling of 2D protein spots was achieved
with the fluorescent dye, RuBPs, and protein species with a
significantly altered abundance in dystrophic preparations were
determined by densitometric scanning. MS was then employed to
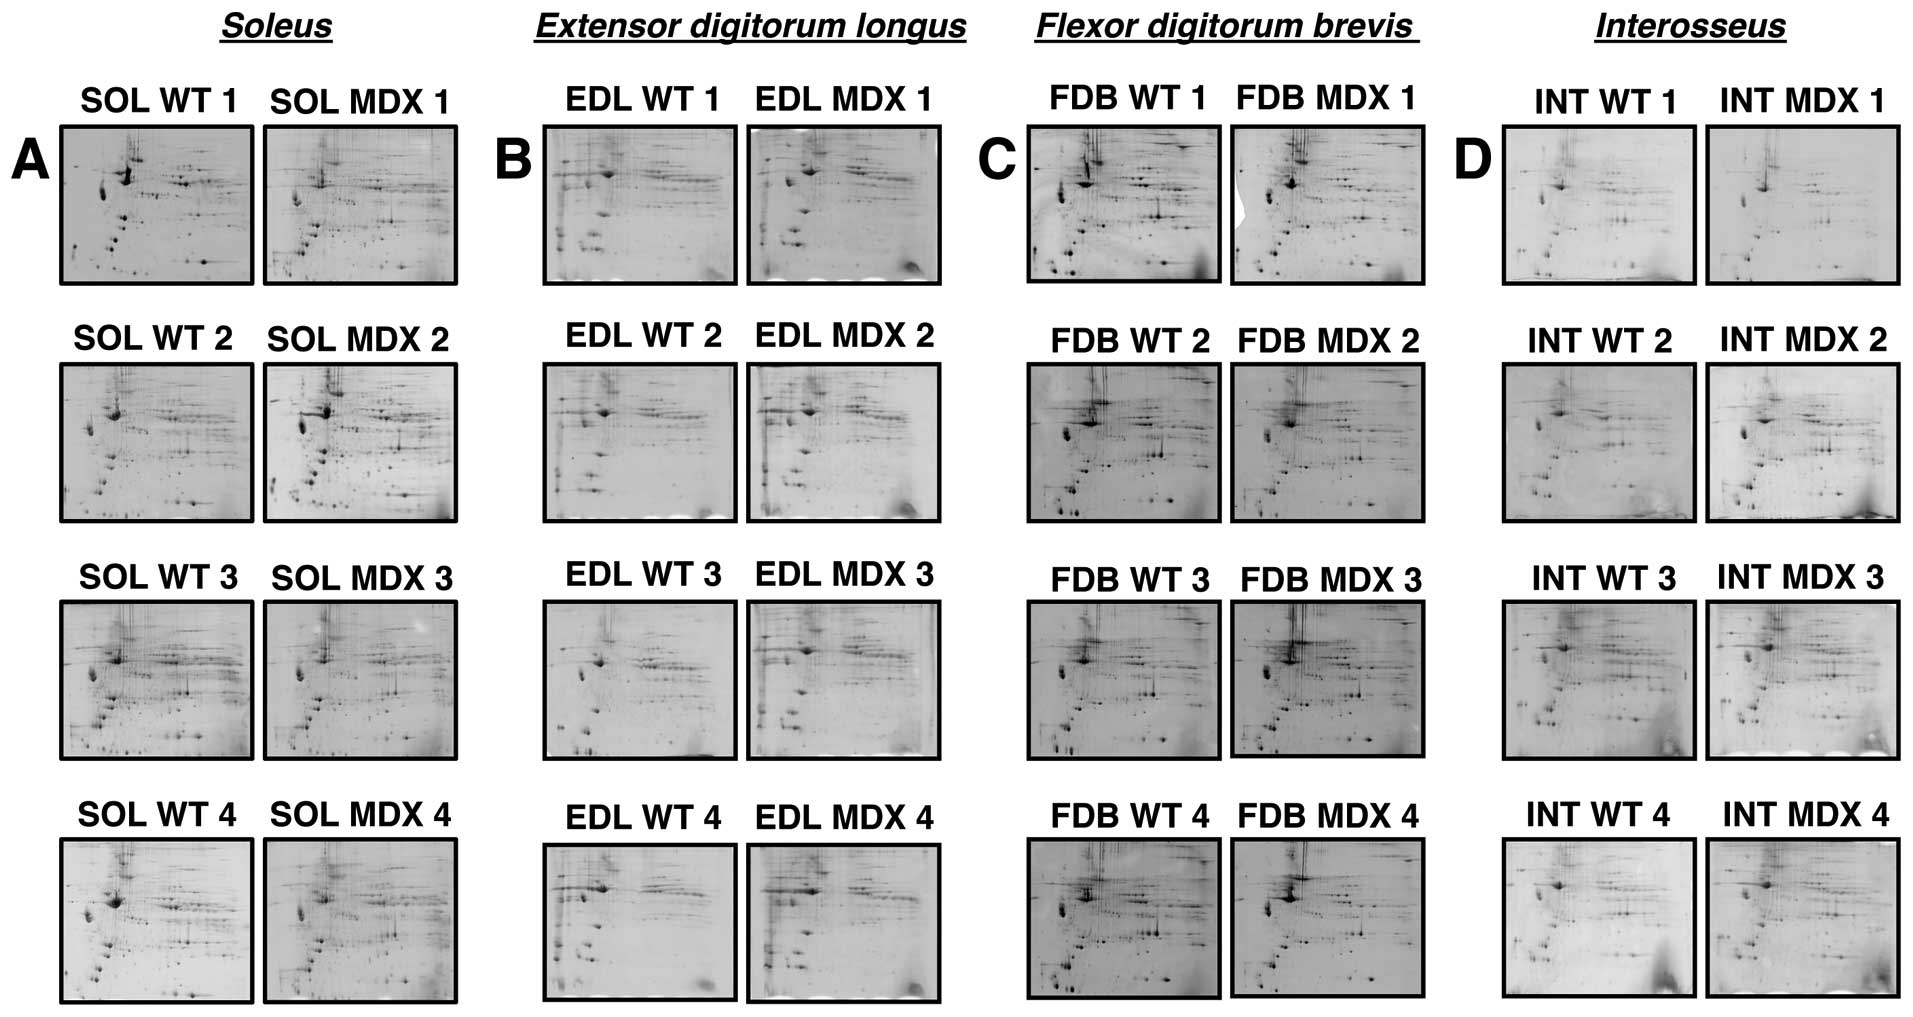
identify the muscle-associated proteins of interest. Fig. 3 summarizes analytical gels used to
evaluate whether marked differences exist in the degree of protein
perturbation between different subtypes of dystrophin-deficient
skeletal muscles. Individual panels A–D show four biological
repeats of gel electrophoretic analyses of normal (SOL WT 1–4) vs.
dystrophic (SOL MDX 1–4) SOL, normal (EDL WT 1–4) vs. dystrophic
(EDL MDX 1–4) EDL, normal (FDB WT 1–4) vs. dystrophic (FDB MDX 1–4)
FDB and normal (INT WT 1–4) vs. dystrophic (INT MDX 1–4) INT muscle
tissues, respectively. Since the overall 2D protein spot patterns
of WT vs. dystrophic specimens (MDX) were relatively comparable, a
detailed densitometric analysis for the determination of
significant differences in muscle-associated proteins was carried
out. With the help of a Typhoon Trio variable imager and Progenesis
2D analysis software, skeletal muscle proteomes from mdx mice were
compared. Figs. 4–7 represent master gels of the SOL, EDL,
FDB and INT muscles, respectively.
Proteomic analysis of SOL muscle from mdx
mice
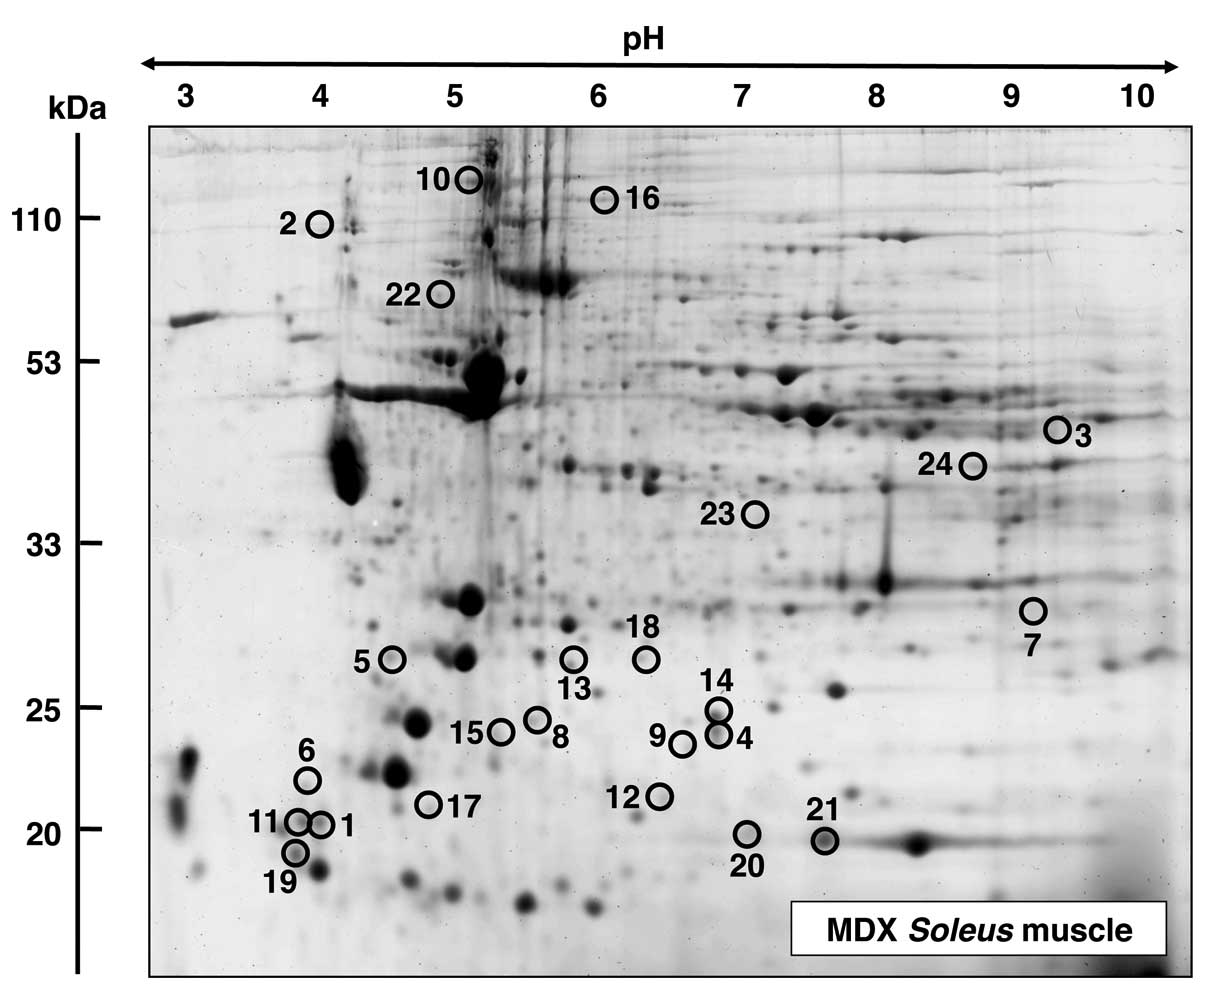
A fluorescent RuBPs-labelled master gel of mdx SOL
muscle is shown in Fig. 4. An
altered expression was observed for 24 protein species in the
dystrophin-deficient SOL preparations. Proteins with significant
changes in expression levels are marked by circles and are numbered
1–24 in the master gel. The mass spectrometric identification of
these muscle proteins with changes in expression is listed in
Table I. This table includes the
names of the identified muscle-associated proteins, their
international accession number, pI-values, their relative
molecular masses, number of matched peptide sequences, percentage
sequence coverage, Mascot scores and fold change of individual
proteins affected in the SOL muscle from mdx mice. Protein species
with an altered expression in the SOL muscle ranged in molecular
mass from 17 kDa (myoglobin) to 127 kDa (myosin binding protein)
and covered a pI-range from pI 4.7 (myosin light
chain) to 8.9 (malate dehydrogenase). As listed in Fig. 4 and Table I, proteomic profiling suggests a
dystrophy-associated increase in various myosin light chains
(MLCs), including MLC1/3, MLC2 and MLC3 (spots 1, 5, 11, 17 and
19), cadherin (spot 2), aldolase (spot 3), αB-crystallin (spots 4,
9 and 14), troponin C (TnC) (spot 6), glutathione transferase (spot
7), 14-3-3 protein (spots 8 and 15), collagen (spot 10) phosphatase
(spot 12), ferritin (spot 13), slow myosin binding protein C
(MyBP-C) (spot 16) and peroxiredoxin (spot 18). By contrast,
decreased concentrations were observed in the case of tumor
metastatic process-associated protein NM23 (spot 20), myoglobin
(spot 21), the ATP synthase Atp5b (spot 22), creatine kinase (spot
23) and malate dehydrogenase (spot 24).
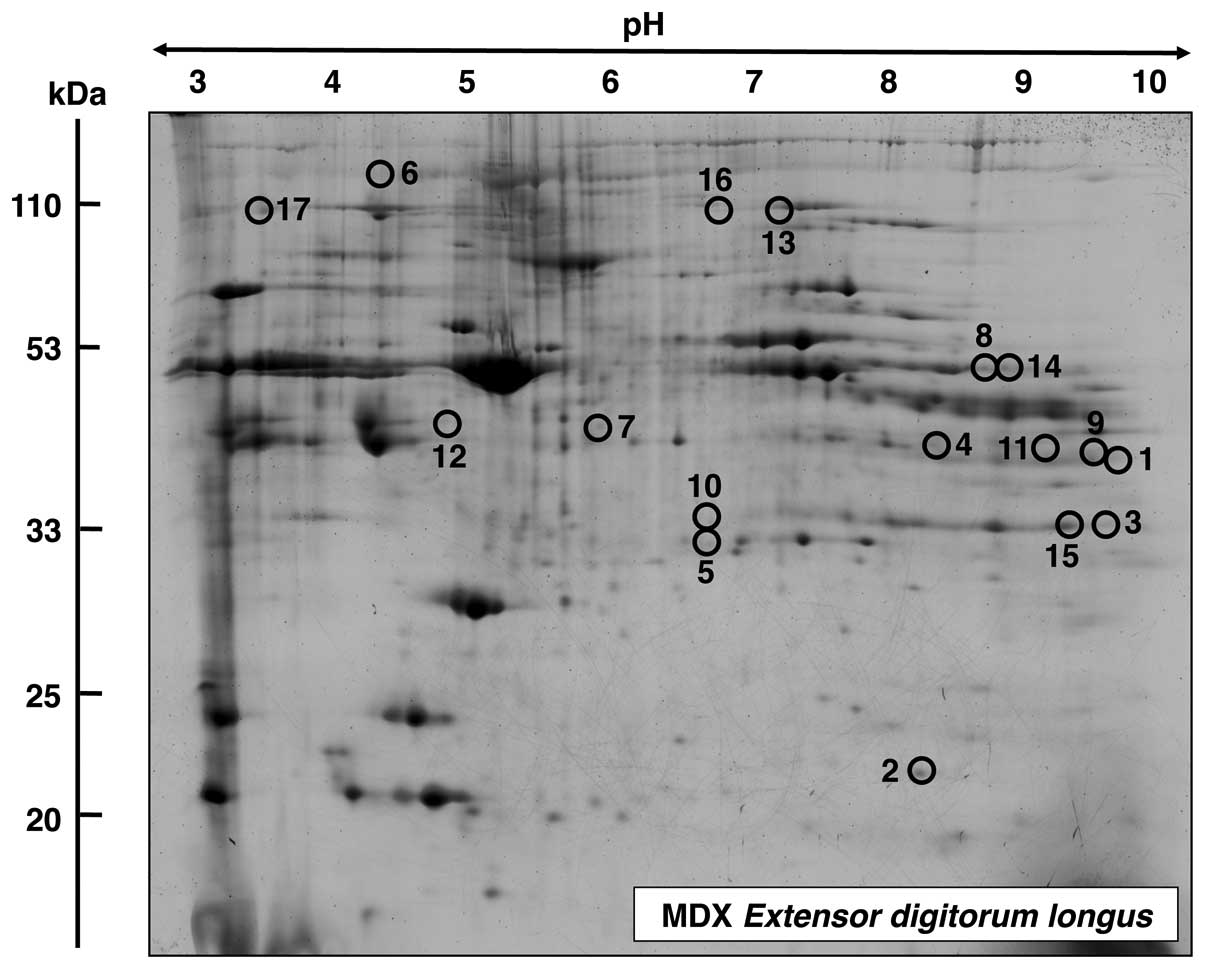
Proteomic analysis of EDL muscle from mdx
mice
A master gel of dystrophic EDL muscle is presented
in Fig. 5, illustrating an
altered expression in 17 protein species. The mass spectrometric
identification of these muscle-associated proteins is listed in
Table II. Proteins with an
altered density in EDL muscle ranged in molecular mass from 17 kDa
(myoglobin) to 224 kDa (myosin) and covered a pI-range from
pI 5.2 (actin) to pI 9.0 [troponin T (TnT)]. MS-based
proteomics revealed an increase in fast troponin TnT (spots 1 and
9), myoglobin (spot 2), phosphoglycerate mutase (spots 3 and 15),
glyceraldehyde-3-phosphate dehydrogenase (spot 4), triosephosphate
isomerase (spot 5), myosin (spot 6), lactate dehydrogenase (spot
7), phosphoglycerate kinase (spot 8), creatine kinase (spot 10),
malate dehydrogenase (spot 11), actin (spot 12), glycogen
phosphorylase (spot 13) and phosphoglycerate kinase (spot 14). A
decreased abundance was established for glycogen phosphorylase
(spot 16) and actinin (spot 17).
| Table IIList of muscle-associated proteins
with an altered abundance in the extensor digitorum longus muscle
from mdx mice. |
Table II
List of muscle-associated proteins
with an altered abundance in the extensor digitorum longus muscle
from mdx mice.
| Spot no. | Protein name | Accession no. | Mascot score | pI | Molecular mass
(Da) | Peptides
matched | Sequence coverage
(%) | Fold change |
|---|
| 1 | Troponin T, fast
skeletal muscle | AAB39743 | 66 | 9.01 | 29358 | 2 | 11 | 3.8 |
| 2 | Myoglobin | NP038621 | 547 | 7.07 | 17117 | 11 | 68 | 3.7 |
| 3 | Phosphoglycerate
mutase2 | NP061358 | 484 | 8.65 | 28983 | 11 | 49 | 3.4 |
| 4 |
Glyceraldehyde-3-phosphate
dehydrogenase | AAH85315 | 347 | 7.59 | 36099 | 7 | 30 | 3.0 |
| 5 | Triosephosphate
isomerase | AAB48543 | 90 | 5.62 | 22724 | 4 | 22 | 2.6 |
| 6 | Myosin-1 | NP109604 | 774 | 5.60 | 224131 | 19 | 11 | 2.6 |
| 7 | Lactate
dehydrogenase B chain | NP032518 | 775 | 5.70 | 36839 | 15 | 49 | 2.5 |
| 8 | Phosphoglycerate
kinase | AAA70267 | 299 | 7.53 | 44914 | 6 | 21 | 2.3 |
| 9 | Troponin T, fast
skeletal muscle | AAB39743 | 131 | 9.01 | 29358 | 6 | 31 | 2.3 |
| 10 | Creatine kinase
M-type | NP031736 | 114 | 6.58 | 43250 | 5 | 16 | 2.2 |
| 11 | Malate
dehydrogenase | AAA39509 | 313 | 8.93 | 36052 | 11 | 41 | 2.1 |
| 12 | Actin, α skeletal
muscle | NP001091 | 136 | 5.23 | 42372 | 10 | 31 | 2.1 |
| 13 | Glycogen
phosphorylase | NP035354 | 1047 | 6.65 | 97689 | 25 | 35 | 2.0 |
| 14 | Phosphoglycerate
kinase | AAA70267 | 109 | 7.53 | 44914 | 7 | 22 | 2.0 |
| 15 | Phosphoglycerate
mutase 2 | NP061358 | 637 | 8.65 | 28983 | 14 | 51 | 2.0 |
| 16 | Glycogen
phosphorylase | NP035354 | 54 | 6.65 | 97689 | 2 | 4 | −2.6 |
| 17 | α-actinin-3 | NP038484 | 374 | 5.31 | 103616 | 7 | 9 | −2.8 |
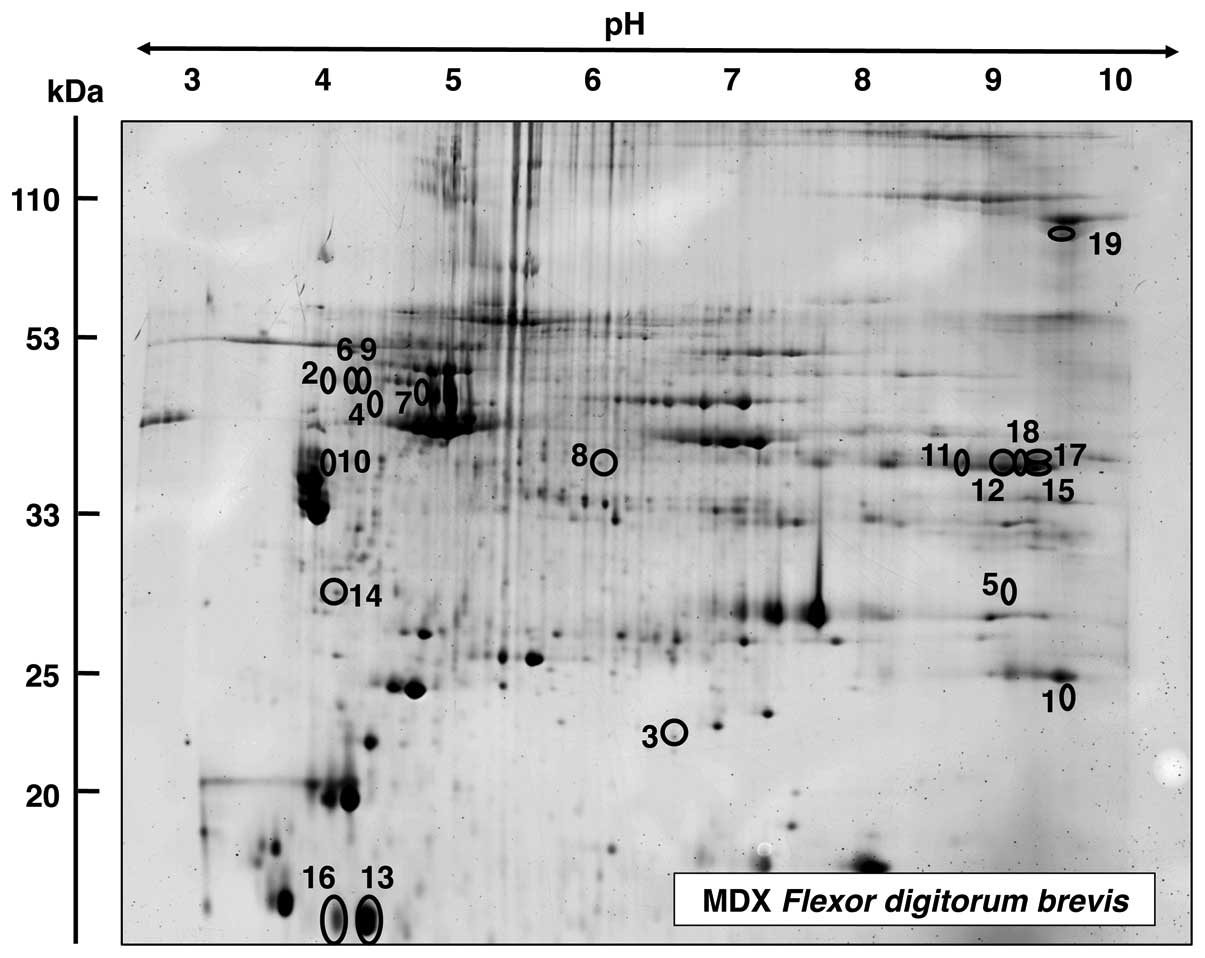
Proteomic analysis of FDB muscle from mdx
mice
The proteomic survey of dystrophic FDB muscle is
shown in Fig 6. Proteins with an
altered expression are marked in the master gel and numbered 1–19.
Table III lists the mass
spectrometric identification of these muscle-associated proteins.
Proteins ranged in molecular mass from 12 kDa (parvalbumin) to 130
kDa (collagen) and covered a pI-range from pI 4.9
(vimentin) to 9.2 (collagen). Mass spectrometric analyses revealed
an increased concentration in FDB muscle for fast troponin I (TpI)
(spot 1), serpina 1d protein (spots 2, 6 and 9), αB-crystallin
(spot 3), vimentin (spot 4), phosphoglycerate mutase (spot 5),
desmin (spot 7), leukocyte elastase inhibitor A (spot 8) and
tropomyosin (spot 10). Proteins with a decreased abundance in FDB
muscle were shown to be the glycolytic enzyme aldolase (spots 11,
12, 15, 17 and 18), parvalbumin (spots 13 and 16), 14-3-3 protein
(spot 14) and collagen (spot 19).
| Table IIIList of muscle-associated proteins
with an altered abundance in the flexor digitorum brevis muscle
from mdx mice. |
Table III
List of muscle-associated proteins
with an altered abundance in the flexor digitorum brevis muscle
from mdx mice.
| Spot no. | Protein name | Accession no. | Mascot score | pI | Molecular mass
(Da) | Peptides
matched | Sequence coverage
(%) | Fold change |
|---|
| 1 | Troponin I, fast
skeletal muscle | NP033431 | 57 | 8.65 | 21518 | 5 | 30 | 3.1 |
| 2 | Serpina 1d
protein | AAH21850 | 104 | 5.18 | 46140 | 9 | 24 | 2.7 |
| 3 | αB-crystallin | NP034094 | 324 | 6.76 | 20056 | 8 | 45 | 2.4 |
| 4 | Vimentin | CAA69019 | 261 | 4.96 | 51591 | 21 | 50 | 2.4 |
| 5 | Phosphoglycerate
mutase 2 | NP061358 | 75 | 8.65 | 28983 | 2 | 8 | 2.3 |
| 6 | Serpina 1d
protein | AAH21850 | 136 | 5.18 | 46140 | 5 | 11 | 2.3 |
| 7 | Desmin | NP034173 | 206 | 5.21 | 53523 | 10 | 32 | 2.2 |
| 8 | Leukocyte elastase
inhibitor A | NP079705 | 178 | 5.85 | 42722 | 9 | 30 | 2.1 |
| 9 | Serpina 1d
protein | AAH21850 | 131 | 5.18 | 46140 | 7 | 17 | 2.0 |
| 10 | Tropomyosin, β
chain | NP033442 | 176 | 4.66 | 32933 | 17 | 47 | 2.0 |
| 11 | Aldolase A, isoform
2 | NP001170778 | 202 | 8.31 | 39795 | 15 | 48 | −2.2 |
| 12 | Aldolase A, isoform
2 | NP001170778 | 249 | 8.31 | 39795 | 13 | 40 | −2.2 |
| 13 | Parvalbumin α | NP038673 | 228 | 5.02 | 11923 | 8 | 65 | −2.3 |
| 14 | 14-3-3 Protein
γ | AAC14345 | 116 | 4.80 | 28519 | 8 | 38 | −2.3 |
| 15 | Aldolase A, isoform
2 | NP001170778 | 163 | 8.31 | 39795 | 13 | 40 | −2.7 |
| 16 | Parvalbumin α | NP038673 | 219 | 5.02 | 11923 | 8 | 65 | −3.0 |
| 17 | Aldolase A, isoform
2 | NP001170778 | 139 | 8.31 | 39795 | 9 | 27 | −3.1 |
| 18 | Aldolase A, isoform
2 | NP001170778 | 215 | 8.31 | 39795 | 20 | 55 | −3.3 |
| 19 | Pro-α-2(I)
collagen | CAA41205 | 51 | 9.23 | 130046 | 2 | 2 | −3.4 |
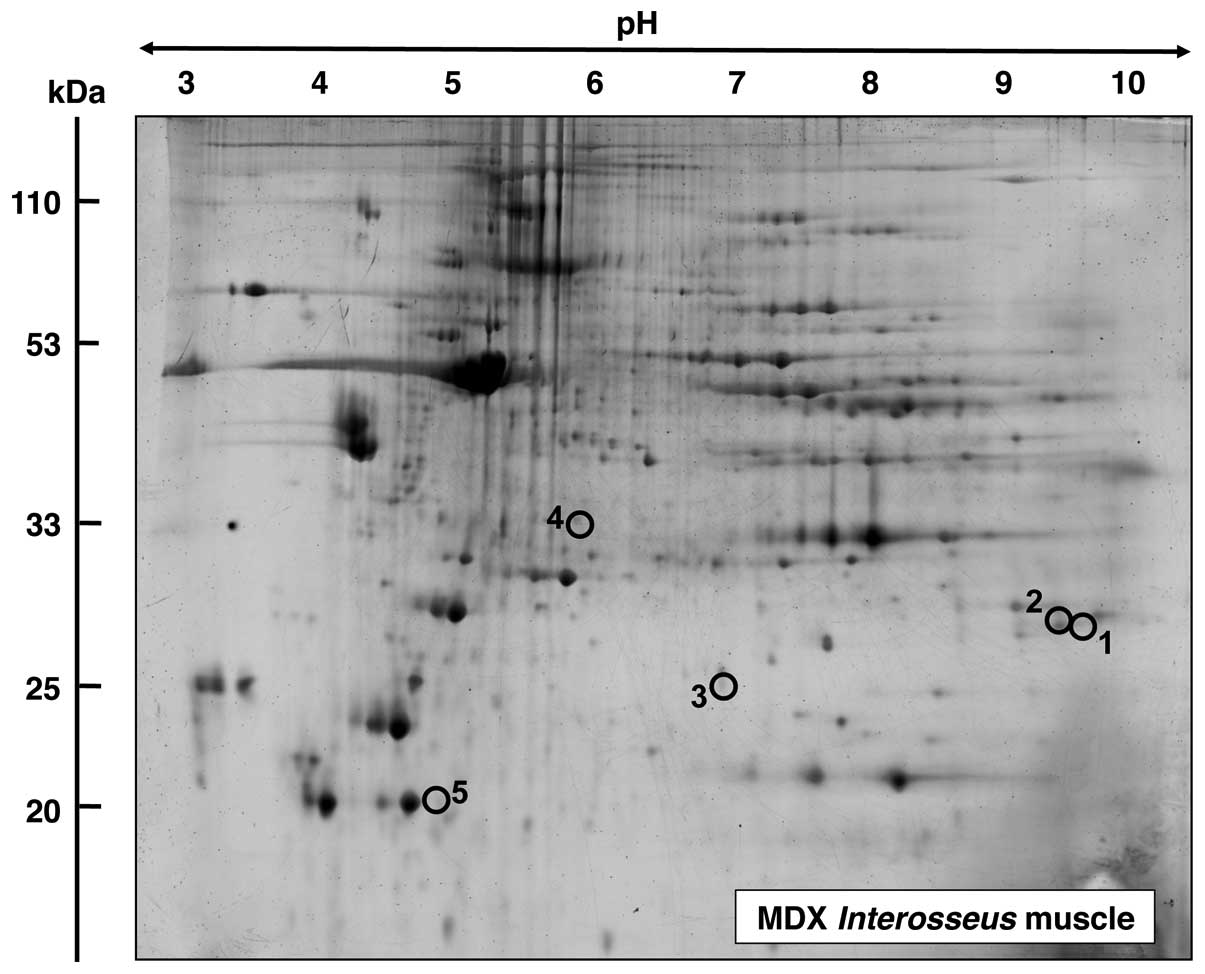
Proteomic analysis of INT muscle from mdx
mice
In contrast to the above listed findings of
considerable changes in the proteomes from dystrophic SOL, EDL and
FDB muscle, the mass spectrometric analysis of INT muscle revealed
only a limited number of altered proteins. In the master gel shown
in Fig. 7, proteins with a change
in expression are numbered 1–5. Table IV lists the proteomic
identification and fold change of these proteins in dystrophic INT
muscle. An increased expression level in INT muscle was shown for
fast TpI (spots 1 and 2), the molecular chaperone αB-crystallin
(spot 3) and the 40 kDa protein (spot 4). By contrast, the
cytosolic Ca2+-binding protein parvalbumin was found to
be decreased in the INT muscle.
Immunoblot analysis of mdx muscle
preparations
In order to verify key proteomic findings,
comparative immunoblot analysis was carried out. As shown in
Fig. 8, the altered abundance of
two marker proteins from each analysed muscle was confirmed by
antibody labelling. Panels A–D were stained with an antibody to
laminin for control purposes. The extracellular matrix protein
exhibited relatively comparable amounts in normal vs. dystrophic
specimens, with the exception of the SOL muscle which showed an
increased density in the mdx preparations. The reduced
concentration of myoglobin and increased concentration of collagen
in the SOL muscle (Fig. 8E and
I), the decreased levels of actinin and increased concentration
of phosphoglycerate kinase in EDL muscle (Fig. 8F and J), the lower levels of
parvalbumin and higher levels of serpina in the FDB muscle
(Fig. 8G and K) and the reduced
expression of parvalbumin and increased concentration of
αB-crystallin in the INT muscle (Fig.
8H and L) was verified by immunoblot analysis.
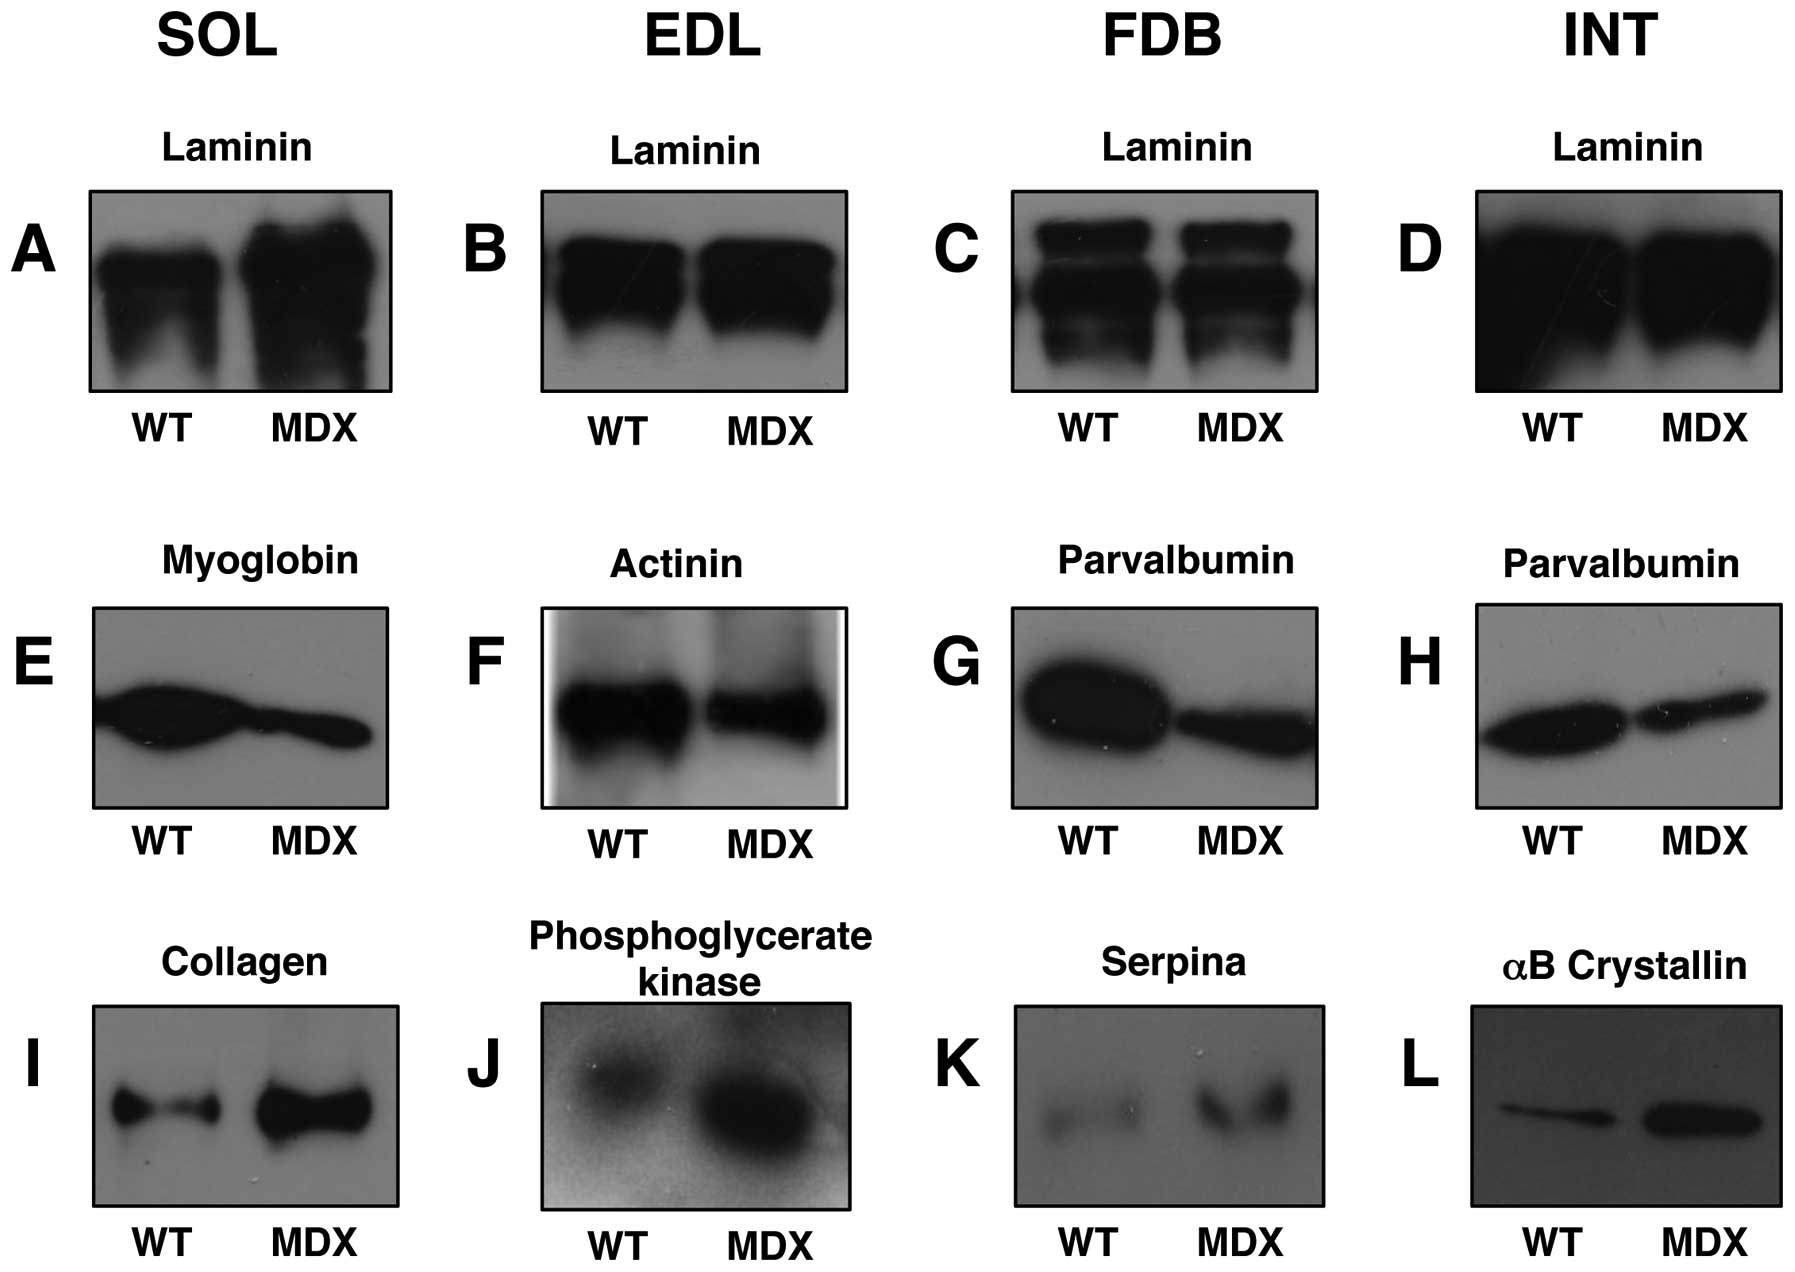 | Figure 8Immunoblot analysis of normal vs.
dystrophic skeletal muscle. Shown are representative immunoblots
with expanded views of antibody-decorated protein bands. Lanes 1
and 2, 3 and 4, 5 and 6 and 7 and 8 represent normal wild-type (WT)
vs. dystrophic (MDX) preparations from soleus (SOL; A, E and I),
extensor digitorum longus (EDL; B, F and J), flexor digitorium
brevis (FDB; C, G and K) and interosseus (INT; D, H and L) muscles,
respectively. Blots were labelled with antibodies to (A–D) laminin,
(E) myoglobin, (F) actinin, (G and H) parvalbumin, (I) collagen,
(J) phosphoglycerate kinase, (K) serpina and (L) αB-crystallin. |
Discussion
The proteomic survey of four subtypes of skeletal
muscle, i.e., SOL, EDL, FDB and INT muscle, presented in this study
revealed considerable differences in the extent of protein
perturbations in distinct muscles of the mdx model of Duchenne
muscular dystrophy. While 24, 17 and 19 protein species were
altered in the SOL, EDL and FDB muscles from mdx mice,
respectively, dystrophin-deficient INT muscle preparations showed
only alterations in fast TnI, αB-crystallin, the 40 kDa protein and
parvalbumin. This is an interesting finding from a global analysis
of protein expression patterns in dystrophinopathy and agrees with
the idea that the loss of dystrophin and concomitant reduction of
associated glycoproteins results in considerably different
secondary changes and cellular adaptations in individual skeletal
muscles, despite the fact that all contractile mdx tissues exhibit
the same primary genetic abnormality. Two accompanying observations
on INT muscle from mdx mice agree with the proteomic analyses.
Firstly, the number of fibers containing central nuclei was lower
in the INT compared with the SOL and EDL muscles. This is crucial,
since central nucleation is regarded as a reliable indicator of
recent muscle fiber regeneration. Secondly, INT and FDB muscles
from mdx mice did not show any increase in muscle mass, in contrast
to the SOL and EDL muscles. Hypertrophy of dystrophin-deficient
muscles has been observed in some models of Duchenne muscular
dystrophy, including the mdx mouse (59). However, the signaling pathways
causing muscle growth have not yet been fully elucidated (60,61). Nevertheless, both central
nucleation and the degree of hypertrophy are in line with a less
severe impairment of INT, compared with the SOL and EDL muscles
from mdx mice. Thus, results on the pathophysiology of
dystrophin-deficient muscle should be carefully interpreted if they
are merely obtained with INT fibers from mdx mice (9,47).
Previous proteomic studies of mdx muscle tissues
concur that the deficiency in the full-length Dp427 isoform of the
membrane cytoskeletal protein, dystrophin, results in disturbed
protein expression patterns in contractile tissues (26–36). Although earlier studies on mdx
muscle proteomics differ considerably on the listing of individual
proteins involved in the molecular pathogenesis of muscular
dystrophy (25), it is clear that
the disintegration of sarcolemmal integrity has severe consequences
for the overall function of affected muscle fibers. Interestingly,
severe dystrophic diaphragm muscle exhibits extensive alterations
in the expression of a large number of muscle proteins (29–31,33), while mildly affected dystrophic
extraocular muscle shows much less alterations in its proteome
(35). This demonstrates a
correlation between the pathophysiological phenotype of individual
muscles from mdx mice and the degree of proteome-wide changes. For
example, extraocular muscle fibers appear to be naturally
protected, possibly due to the upregulation of the autosomal
dystrophin-homologue, utrophin Up395 (12). In addition, different load-bearing
capacities and Ca2+-extrusion systems may render certain
subtypes of skeletal muscle less susceptible to fibrosis and
necrosis, despite the lack of dystrophin (12–14,62).
Muscle-associated proteins with an altered abundance
in mdx tissues are mostly involved in the contraction-relaxation
cycle, metabolite transport, muscle metabolism and the cellular
stress response. In the mildly affected dystrophic INT muscle, the
protein with the most significant increase in expression was fast
TpI (63), indicating a certain
degree of remodeling of the regulatory elements of the contractile
apparatus (64). Other changes in
protein expression in the dystrophic INT muscle were marginal,
compared with the other muscles examined. In the dystrophic SOL
muscle, various MLCs, such as isoforms MLC1/3, MLC2 and MLC3
(65), were shown to be
upregulated in the dystrophin-deficient fibers. The highly complex
myosin molecule of the contractile apparatus forms a hexameric
structure consisting of two MHC heavy chains and various MLC light
chains (66,67). Various combinations of myosin
heavy and light chains form a plethora of fiber type-specific
isoforms (68) and the MS-based
profiling of contractile fibers has shown that the actomyosin
apparatus is extremely plastic (69). Previous proteomic investigations
have demonstrated that neuromuscular activity has a profound effect
on myosin, actin, troponin and tropomyosin isoform expression
patterns (57,70). The drastic changes in the
dystrophic SOL muscle indicate that the dystrophic phenotype is
associated with considerable remodeling of the contractile
apparatus, including myosin, myosin binding proteins and
troponin.
Interestingly, the atypical GPI-anchored cadherin 13
protein is increased in dystrophic SOL muscle and may stimulate
angiogenesis (71). Altered
expression levels of glutathione S-transferase, αB-crystallin,
ferritin and peroxiredoxin indicate increased demands of
detoxification, cellular stress response, iron storage and
anti-oxidant activity in dystrophic fibers. Of note, specific
isoforms of 14-3-3 proteins are altered in muscular dystrophy,
which has been previously described for various neurodegenerative
processes (72). Possible
interactions of 14-3-3 proteins with signaling receptors, kinases
and phosphatase are disturbed in dystrophic SOL muscle. Reduced
levels of ATP synthase, myoglobin and malate dehydrogenase indicate
metabolic disturbances in dystrophic SOL muscle.
Apart from altered levels of contractile elements,
such as troponin, myosin, actin and actinin in dystrophic EDL
muscle, which demonstrated alterations in the actomyosin apparatus,
proteomic analysis revealed a striking increase in the expression
levels of key glycolytic enzymes. MS identified the affected
cytosolic proteins as triosephosphate isomerase,
glyceraldehyde-3-phosphate dehydrogenase, phosphoglycerate kinase
and phosphoglycerate mutase, which are involved in the reversible
conversion of dihydroxyacetone phosphate and
glyceraldehyde-3-phosphate, the generation of
1,3-bisphosphoglycerate and NADH, the production of ATP and
3-phosphoglycerate from ADP and 1,3-bisphosphoglycerate, and the
reversible conversion of 3-phosphoglycerate into
2-phosphoglycerate, respectively (73). The increase in several glycolytic
enzymes suggests a shift to more anaerobic metabolism. Of note, one
of the key regulatory enzymes of glycogen and glucose utilization
in muscle, glycogen phosphorylase, was also found to be increased
in contractile mdx tissue. A previous proteomic survey of
slow-twitching vs. fast-twitching skeletal muscles has confirmed
that fast muscles exhibit high concentrations of enzymes involved
in the glycolytic pathway and elevated levels of glycogen
phosphorylase (74). In addition,
the elevated expression of lactate dehydrogenase, an enzyme that
mediates the interconversion of the end product of glycolysis,
pyruvate, and lactate agrees with a glycolytic shift in dystrophic
EDL muscle. Skeletal muscles utilise anaerobic glycolysis, usually
for short to moderate duration activities of high intensity
(75); thus, a significant
increase in glycolytic enzymes indicates an increased utilization
of the glycolytic pathway in the bioenergetics of the
dystrophin-deficient EDL muscle.
In contrast to dystrophic EDL muscle, the dystrophic
FDB muscle exhibited a reduced expression in a key glycolytic
enzyme. The affected enzyme, skeletal muscle aldolase, mediates the
reversible biochemical breakdown of fructose-1,6-biphosphate into
dihydroxyacetone phosphate and glyceraldehyde-3-phosphate (73). In the gluconeogenic pathway,
muscle aldolase has been shown to form a complex with
fructose-1,6-biphosphatase and α-actinin on both sides of the
Z-line of skeletal muscle fibers. The tight association between
fructose-1,6-biphosphatase and aldolase is proposed to enable
efficient substrate channeling between these proteins (76). However, many glycolytic enzymes
are believed to have a multi-functional role in many cell types
(77). Thus, changes in
glycolytic enzymes may affect biological mechanisms other than the
anaerobic breakdown of glucose in skeletal muscle tissues (73). For example, enzymes with a primary
glycolytic function have been demonstrated to also being involved
in the regulation of apoptosis, metabolic integration, stimulation
of cell motility and transcriptional regulation (77). It is thus difficult to conclude
from changes in one glycolytic enzyme whether this relates to
distinct metabolic alterations in the dystrophic FDB muscle or
possibly shows adaptations in a glycolysis-unrelated biological
mechanism.
Altered expression levels in troponin and
tropomyosin, and the cytosolic Ca2+-binding protein
parvalbumin indicate disturbances in the contractile apparatus and
ion homeostasis, respectively. In analogy to dystrophic SOL muscle,
the apparent upregulation of the molecular chaperone αB-crystallin
in dystrophic FDB agrees with the concept of an enhanced cellular
stress response in muscular dystrophy (30). Interestingly, cytoskeletal
proteins, such as vimentin and desmin were found to be increased in
dystrophic muscle, which may be due to a compensatory mechanism of
dystrophin-lacking fibers that try to counteract structural
instabilities in the membrane cytoskeleton of dystrophic FDB
muscle. The increased levels of the serpina 1d protein may be the
basis of a novel biomarker of the dystrophic phenotype.
In conclusion, the comparative proteomic survey of
four frequently used muscles of the mdx mouse model of Duchenne
muscular dystrophy, SOL, EDL, FDB and INT muscles, has demonstrated
that high-resolution 2D gel electrophoresis in combination with
electrospray ionization MS is highly suitable for investigating
muscle subtype-specific alterations in the dystrophic skeletal
muscle proteome. The differences in the number and degree of
protein alterations in the analysed mdx muscles indicate that the
INT muscle is much less affected than SOL, EDL and FDB muscles. In
agreement with these findings are the lack of hypertrophy in INT
muscles of mdx mice and the reduced level of central nucleation
compared with SOL and EDL. Thus, the evaluation of future
pharmacological studies or experimental gene therapeutic approaches
for the treatment of dystrophinopathy should take into account that
the deficiency in dystrophin does not affect all skeletal muscle
subtypes in a similar manner. The individual histological,
biochemical and physiological properties of different muscles have
to be considered for the understanding of secondary abnormalities
and adaptations in muscular dystrophy.
Acknowledgements
This study was supported by project grants from
Muscular Dystrophy Ireland (MDI-125563), the European Commission
(FP7-REGPOT-2010, Grant no. 264143), Aktion Benni & Co e.V. and
a Hume postgraduate scholarship from NUI Maynooth, as well as
equipment grants from the Irish Health Research Board and the
Higher Education Authority.
Abbreviations:
|
EDL
|
extensor digitorum longus
|
|
FDB
|
flexor digitorum brevis
|
|
INT
|
interosseus
|
|
SOL
|
soleus
|
|
mdx
|
X-linked muscular dystrophy
|
|
2D
|
two-dimensional
|
|
RuBPs
|
ruthenium II tris(bathophenanthroline
disulfonate)
|
References
|
1
|
Bushby K, Finkel R, Birnkrant DJ, Case LE,
Clemens PR, Cripe L, Kaul A, Kinnett K, McDonald C, Pandya S,
Poysky J, Shapiro F, Tomezsko J and Constantin C: Diagnosis and
management of Duchenne muscular dystrophy, part 1: diagnosis, and
pharmacological and psychosocial management. Lancet Neurol.
9:77–93. 2010. View Article : Google Scholar : PubMed/NCBI
|
|
2
|
Dalkilic I and Kunkel LM: Muscular
dystrophies: genes to pathogenesis. Curr Opin Genet Dev.
13:231–238. 2003. View Article : Google Scholar : PubMed/NCBI
|
|
3
|
Guglieri M and Bushby K: Molecular
treatments in Duchenne muscular dystrophy. Curr Opin Pharmacol.
10:331–337. 2010. View Article : Google Scholar : PubMed/NCBI
|
|
4
|
Mosqueira M, Zeiger U, Förderer M,
Brinkmeier H and Fink RH: Cardiac and respiratory dysfunction in
Duchenne muscular dystrophy and the role of second messengers. Med
Res Rev. April 30–2013.(Epub ahead of print).
|
|
5
|
Partridge TA: Impending therapies for
Duchenne muscular dystrophy. Curr Opin Neurol. 24:415–422. 2011.
View Article : Google Scholar : PubMed/NCBI
|
|
6
|
Spurney CF, Gordish-Dressman H, Guerron
AD, Sali A, Pandey GS, Rawat R, Van Der Meulen JH, Cha HJ, Pistilli
EE, Partridge TA, Hoffman EP and Nagaraju K: Preclinical drug
trials in the mdx mouse: assessment of reliable and sensitive
outcome measures. Muscle Nerve. 39:591–602. 2009. View Article : Google Scholar : PubMed/NCBI
|
|
7
|
Banks GB and Chamberlain JS: The value of
mammalian models for duchenne muscular dystrophy in developing
therapeutic strategies. Curr Top Dev Biol. 84:431–453. 2008.
View Article : Google Scholar : PubMed/NCBI
|
|
8
|
Durbeej M and Campbell KP: Muscular
dystrophies involving the dystrophin-glycoprotein complex: an
overview of current mouse models. Curr Opin Genet Dev. 12:349–361.
2002. View Article : Google Scholar : PubMed/NCBI
|
|
9
|
Tutdibi O, Brinkmeier H, Rüdel R and Föhr
KJ: Increased calcium entry into dystrophin-deficient muscle fibres
of MDX and ADR-MDX mice is reduced by ion channel blockers. J
Physiol. 515:859–868. 1999. View Article : Google Scholar : PubMed/NCBI
|
|
10
|
Wells DJ and Wells KE: What do animal
models have to tell us regarding Duchenne muscular dystrophy? Acta
Myol. 24:172–180. 2005.PubMed/NCBI
|
|
11
|
Sicinski P, Geng Y, Ryder-Cook AS, Barnard
EA, Darlison MG and Barnard PJ: The molecular basis of muscular
dystrophy in the mdx mouse: a point mutation. Science.
244:1578–1580. 1989. View Article : Google Scholar : PubMed/NCBI
|
|
12
|
Dowling P, Lohan J and Ohlendieck K:
Comparative analysis of Dp427-deficient mdx tissues shows that the
milder dystrophic phenotype of extraocular and toe muscle fibres is
associated with a persistent expression of beta-dystroglycan. Eur J
Cell Biol. 82:222–230. 2003. View Article : Google Scholar
|
|
13
|
Marques MJ, Ferretti R, Vomero VU, Minatel
E and Neto HS: Intrinsic laryngeal muscles are spared from
myonecrosis in the mdx mouse model of Duchenne muscular dystrophy.
Muscle Nerve. 35:349–353. 2007. View Article : Google Scholar : PubMed/NCBI
|
|
14
|
Porter JD, Merriam AP, Khanna S, Andrade
FH, Richmonds CR, Leahy P, Cheng G, Karathanasis P, Zhou X, Kusner
LL, Adams ME, Willem M, Mayer U and Kaminski HJ: Constitutive
properties, not molecular adaptations, mediate extraocular muscle
sparing in dystrophic mdx mice. FASEB J. 17:893–895.
2003.PubMed/NCBI
|
|
15
|
Carnwath JW and Shotton DM: Muscular
dystrophy in the mdx mouse: histopathology of the soleus and
extensor digitorum longus muscles. J Neurol Sci. 80:39–54. 1987.
View Article : Google Scholar : PubMed/NCBI
|
|
16
|
Coulton GR, Morgan JE, Partridge TA and
Sloper JC: The mdx mouse skeletal muscle myopathy: I. A
histological, morphometric and biochemical investigation.
Neuropathol Appl Neurobiol. 14:53–70. 1988. View Article : Google Scholar : PubMed/NCBI
|
|
17
|
Torres LF and Duchen LW: The mutant mdx:
inherited myopathy in the mouse. Morphological studies of nerves,
muscles and end-plates. Brain. 110:269–299. 1987. View Article : Google Scholar : PubMed/NCBI
|
|
18
|
Stedman HH, Sweeney HL, Shrager JB,
Maguire HC, Panettieri RA, Petrof B, Narusawa M, Leferovich JM,
Sladky JT and Kelly AM: The mdx mouse diaphragm reproduces the
degenerative changes of Duchenne muscular dystrophy. Nature.
352:536–539. 1991. View
Article : Google Scholar : PubMed/NCBI
|
|
19
|
Dupont-Versteegden EE and McCarter RJ:
Differential expression of muscular dystrophy in diaphragm versus
hindlimb muscles of mdx mice. Muscle Nerve. 15:1105–1110. 1992.
View Article : Google Scholar : PubMed/NCBI
|
|
20
|
Lynch GS, Rafael JA, Hinkle RT, Cole NM,
Chamberlain JS and Faulkner JA: Contractile properties of diaphragm
muscle segments from old mdx and old transgenic mdx mice. Am J
Physiol. 272:C2063–C2068. 1997.PubMed/NCBI
|
|
21
|
Ohlendieck K: Proteomics of skeletal
muscle differentiation, neuromuscular disorders and fiber aging.
Expert Rev Proteomics. 7:283–296. 2010. View Article : Google Scholar : PubMed/NCBI
|
|
22
|
Gelfi C, Vasso M and Cerretelli P:
Diversity of human skeletal muscle in health and disease:
contribution of proteomics. J Proteomics. 74:774–795. 2011.
View Article : Google Scholar : PubMed/NCBI
|
|
23
|
Ohlendieck K: Skeletal muscle proteomics:
current approaches, technical challenges and emerging techniques.
Skelet Muscle. 1:62011. View Article : Google Scholar : PubMed/NCBI
|
|
24
|
Ohlendieck K: Proteomic identification of
biomarkers of skeletal muscle disorders. Biomark Med. 7:169–186.
2013. View Article : Google Scholar : PubMed/NCBI
|
|
25
|
Lewis C, Carberry S and Ohlendieck K:
Proteomic profiling of x-linked muscular dystrophy. J Muscle Res
Cell Motil. 30:267–269. 2009. View Article : Google Scholar : PubMed/NCBI
|
|
26
|
Ge Y, Molloy MP, Chamberlain JS and
Andrews PC: Proteomic analysis of mdx skeletal muscle: great
reduction of adenylate kinase 1 expression and enzymatic activity.
Proteomics. 3:1895–1903. 2003. View Article : Google Scholar : PubMed/NCBI
|
|
27
|
Ge Y, Molloy MP, Chamberlain JS and
Andrews PC: Differential expression of the skeletal muscle proteome
in mdx mice at different ages. Electrophoresis. 25:2576–2585. 2004.
View Article : Google Scholar : PubMed/NCBI
|
|
28
|
Doran P, Dowling P, Lohan J, McDonnell K,
Poetsch S and Ohlendieck K: Subproteomics analysis of
Ca+-binding proteins demonstrates decreased
calsequestrin expression in dystrophic mouse skeletal muscle. Eur J
Biochem. 271:3943–3952. 2004.
|
|
29
|
Doran P, Dowling P, Donoghue P, Buffini M
and Ohlendieck K: Reduced expression of regucalcin in young and
aged mdx diaphragm indicates abnormal cytosolic calcium handling in
dystrophin-deficient muscle. Biochim Biophys Acta. 1764:773–785.
2006. View Article : Google Scholar : PubMed/NCBI
|
|
30
|
Doran P, Martin G, Dowling P, Jockusch H
and Ohlendieck K: Proteome analysis of the dystrophin-deficient MDX
diaphragm reveals a drastic increase in the heat shock protein
cvHSP. Proteomics. 6:4610–4621. 2006. View Article : Google Scholar : PubMed/NCBI
|
|
31
|
Doran P, Wilton SD, Fletcher S and
Ohlendieck K: Proteomic profiling of antisense-induced exon
skipping reveals reversal of pathobiochemical abnormalities in
dystrophic mdx diaphragm. Proteomics. 9:671–685. 2009. View Article : Google Scholar : PubMed/NCBI
|
|
32
|
Gardan-Salmon D, Dixon JM, Lonergan SM and
Selsby JT: Proteomic assessment of the acute phase of dystrophin
deficiency in mdx mice. Eur J Appl Physiol. 111:2763–2773. 2011.
View Article : Google Scholar : PubMed/NCBI
|
|
33
|
Carberry S, Zweyer M, Swandulla D and
Ohlendieck K: Proteomics reveals drastic increase of extracellular
matrix proteins collagen and dermatopontin in the aged mdx
diaphragm model of Duchenne muscular dystrophy. Int J Mol Med.
30:229–234. 2012.
|
|
34
|
Carberry S, Zweyer M, Swandulla D and
Ohlendieck K: Profiling of age-related changes in the tibialis
anterior muscle proteome of the mdx mouse model of
dystrophinopathy. J Biomed Biotechnol. 2012:6916412012. View Article : Google Scholar : PubMed/NCBI
|
|
35
|
Lewis C and Ohlendieck K: Proteomic
profiling of naturally protected extraocular muscles from the
dystrophin-deficient mdx mouse. Biochem Biophys Res Commun.
396:1024–1029. 2010. View Article : Google Scholar : PubMed/NCBI
|
|
36
|
Rayavarapu S, Coley W, Cakir E, Jahnke V,
Takeda S, Aoki Y, Gordish-Dressman H, Jaiswal JK, Hoffman EP, Brown
KJ, Hathout Y and Nagaraju K: Identification of disease specific
pathways using in vivo SILAC proteomics in dystrophin deficient mdx
mouse. Mol Cell Proteomics. 12:1061–1073. 2013. View Article : Google Scholar : PubMed/NCBI
|
|
37
|
Alagaratnam S, Mertens BJ, Dalebout JC,
Deelder AM, van Ommen GJ, den Dunnen JT and ‘t Hoen PA: Serum
protein profiling in mice: identification of Factor XIIIa as a
potential biomarker for muscular dystrophy. Proteomics.
8:1552–1563. 2008. View Article : Google Scholar : PubMed/NCBI
|
|
38
|
Colussi C, Banfi C, Brioschi M, Tremoli E,
Straino S, Spallotta F, Mai A, Rotili D, Capogrossi MC and Gaetano
C: Proteomic profile of differentially expressed plasma proteins
from dystrophic mice and following suberoylanilide hydroxamic acid
treatment. Proteomics Clin Appl. 4:71–83. 2010. View Article : Google Scholar
|
|
39
|
Gulston MK, Rubtsov DV, Atherton HJ,
Clarke K, Davies KE, Lilley KS and Griffin JL: A combined
metabolomic and proteomic investigation of the effects of a failure
to express dystrophin in the mouse heart. J Proteome Res.
7:2069–2077. 2008. View Article : Google Scholar : PubMed/NCBI
|
|
40
|
Johnson EK, Zhang L, Adams ME, Phillips A,
Freitas MA, Froehner SC, Green-Church KB and Montanaro F: Proteomic
analysis reveals new cardiac-specific dystrophin-associated
proteins. PLoS One. 7:e435152012. View Article : Google Scholar : PubMed/NCBI
|
|
41
|
Lewis C, Jockusch H and Ohlendieck K:
Proteomic profiling of the Dystrophin-deficient MDX heart reveals
drastically altered levels of key metabolic and contractile
proteins. J Biomed Biotechnol. 2010:6485012010. View Article : Google Scholar : PubMed/NCBI
|
|
42
|
Holland A, Dowling P, Zweyer M, Swandulla
D, Henry M, Clynes M and Ohlendieck K: Proteomic profiling of
cardiomyopathic tissue from the aged mdx model of Duchenne muscular
dystrophy reveals a drastic decrease in laminin, nidogen and
annexin. Proteomics. May 23–2013.(Epub ahead of print).
|
|
43
|
Jarmey C: The Atlas of Musculo-skeletal
Anatomy. Lotus Publishing; Chichester: 2004
|
|
44
|
Lieber RL: Skeletal muscle Structure,
Function, and Plasticity. 3rd edition. Lippincott Williams &
Wilkins; Baltimore, MD: 2009
|
|
45
|
Stal P, Eriksson PO, Eriksson A and
Thornell LE: Enzyme-histochemical differences in fibre-type between
the human major and minor zygomatic and the first dorsal
interosseus muscles. Arch Oral Biol. 32:833–841. 1987. View Article : Google Scholar
|
|
46
|
Staron RS: Human skeletal muscle fiber
types: delineation, development, and distribution. Can J Appl
Physiol. 22:307–327. 1997. View Article : Google Scholar : PubMed/NCBI
|
|
47
|
Mallouk N, Jacquemond V and Allard B:
Elevated subsarcolemmal Ca2+in mdx mouse skeletal muscle
fibers detected with Ca2+-activated
K+channels. Proc Natl Acad Sci USA. 97:4950–4955.
2000.
|
|
48
|
Pritschow BW, Lange T, Kasch J,
Kunert-Keil C, Liedtke W and Brinkmeier H: Functional TRPV4
channels are expressed in mouse skeletal muscle and can modulate
resting Ca2+influx and muscle fatigue. Pflügers Arch.
461:115–122. 2011.PubMed/NCBI
|
|
49
|
Boittin FX, Shapovalov G, Hirn C and Rüegg
UT: Phospholipase A2-derived lysophosphatidylcholine triggers
Ca2+entry in dystrophic skeletal muscle fibers. Biochem
Biophys Res Commun. 391:401–406. 2010. View Article : Google Scholar : PubMed/NCBI
|
|
50
|
Teichmann MD, Wegner FV, Fink RH,
Chamberlain JS, Launikonis BS, Martinac B and Friedrich O:
Inhibitory control over Ca2+ sparks via mechanosensitive
channels is disrupted in dystrophin deficient muscle but restored
by mini-dystrophin expression. PLoS One. 3:e36442008.PubMed/NCBI
|
|
51
|
Ohlendieck K and Campbell KP:
Dystrophin-associated proteins are greatly reduced in skeletal
muscle from mdx mice. J Cell Biol. 115:1685–1694. 1991. View Article : Google Scholar : PubMed/NCBI
|
|
52
|
Krüger J, Kunert-Keil C, Bisping F and
Brinkmeier H: Transient receptor potential cation channels in
normal and dystrophic mdx muscle. Neuromuscul Disord. 18:501–513.
2008.PubMed/NCBI
|
|
53
|
Bradford MM: A rapid and sensitive method
for the quantitation of microgram quantities of protein utilizing
the principle of protein-dye binding. Anal Biochem. 72:248–254.
1976. View Article : Google Scholar : PubMed/NCBI
|
|
54
|
Gannon J, Staunton L, O’Connell K, Doran P
and Ohlendieck K: Phosphoproteomic analysis of aged skeletal
muscle. Int J Mol Med. 22:33–42. 2008.
|
|
55
|
Rabilloud T, Strub JM, Luche S, van
Dorsselaer A and Lunardi J: A comparison between Sypro Ruby and
ruthenium II tris (bathophenanthroline disulfonate) as fluorescent
stains for protein detection in gels. Proteomics. 1:699–704. 2001.
View Article : Google Scholar : PubMed/NCBI
|
|
56
|
Lewis C and Ohlendieck K: Mass
spectrometric identification of dystrophin isoform Dp427 by
on-membrane digestion of sarcolemma from skeletal muscle. Anal
Biochem. 404:197–203. 2010. View Article : Google Scholar : PubMed/NCBI
|
|
57
|
Donoghue P, Doran P, Wynne K, Pedersen K,
Dunn MJ and Ohlendieck K: Proteomic profiling of chronic
low-frequency stimulated fast muscle. Proteomics. 7:3417–3430.
2007. View Article : Google Scholar : PubMed/NCBI
|
|
58
|
Staunton L, Jockusch H, Wiegand C,
Albrecht T and Ohlendieck K: Identification of secondary effects of
hyperexcitability by proteomic profiling of myotonic mouse muscle.
Mol Biosyst. 7:2480–2489. 2011. View Article : Google Scholar : PubMed/NCBI
|
|
59
|
Kornegay JN, Childers MK, Bogan DJ, Bogan
JR, Nghiem P, Wang J, Fan Z, Howard JF Jr, Schatzberg SJ, Dow JL,
Grange RW, Styner MA, Hoffman EP and Wagner KR: The paradox of
muscle hypertrophy in muscular dystrophy. Phys Med Rehabil Clin N
Am. 23:149–172. 2012. View Article : Google Scholar : PubMed/NCBI
|
|
60
|
Andres-Mateos E, Brinkmeier H, Burks TN,
Mejias R, Files DC, Steinberger M, Soleimani A, Marx R, Simmers JL,
Lin B, Finanger Hedderick E, Marr TG, Lin BM, Hourde C, Leinwand
LA, Kuhl D, Foller M, Vogelsang S, Hernandez-Diaz I, Vaughan DK,
Alvarez de la Rosa D, Lang F and Cohn RD: Activation of
serum/glucocorticoid-induced kinase 1 (SGK1) is important to
maintain skeletal muscle homeostasis and prevent atrophy. EMBO Mol
Med. 5:80–91. 2013. View Article : Google Scholar : PubMed/NCBI
|
|
61
|
Gundersen K: Excitation-transcription
coupling in skeletal muscle: the molecular pathways of exercise.
Biol Rev Camb Philos Soc. 86:564–600. 2011. View Article : Google Scholar : PubMed/NCBI
|
|
62
|
Zeiger U, Mitchell CH and Khurana TS:
Superior calcium homeostasis of extraocular muscles. Exp Eye Res.
91:613–622. 2010. View Article : Google Scholar : PubMed/NCBI
|
|
63
|
Swartz DR, Yang Z, Sen A, Tikunova SB and
Davis JP: Myofibrillar troponin exists in three states and there is
signal transduction along skeletal myofibrillar thin filaments. J
Mol Biol. 361:420–435. 2006. View Article : Google Scholar
|
|
64
|
Gordon AM, Homsher E and Regnier M:
Regulation of contraction in striated muscle. Physiol Rev.
80:853–924. 2000.PubMed/NCBI
|
|
65
|
Gonzalez B, Negredo P, Hernando R and
Manso R: Protein variants of skeletal muscle regulatory myosin
light chain isoforms: prevalence in mammals, generation and
transitions during muscle remodelling. Pflügers Arch. 443:377–386.
2002.
|
|
66
|
Bozzo C, Spolaore B, Toniolo L, Stevens L,
Bastide B, Cieniewski-Bernard C, Fontana A, Mounier Y and Reggiani
C: Nerve influence on myosin light chain phosphorylation in slow
and fast skeletal muscles. FEBS J. 272:5771–5785. 2005. View Article : Google Scholar : PubMed/NCBI
|
|
67
|
Clark KA, McElhinny AS, Beckerle MC and
Gregorio CC: Striated muscle cytoarchitecture: an intricate web of
form and function. Annu Rev Cell Dev Biol. 18:637–706. 2002.
View Article : Google Scholar : PubMed/NCBI
|
|
68
|
Pette D and Staron RS: Myosin isoforms,
muscle fiber types, and transitions. Microsc Res Tech. 50:500–509.
2000. View Article : Google Scholar : PubMed/NCBI
|
|
69
|
Holland A and Ohlendieck K: Proteomic
profiling of the contractile apparatus from skeletal muscle. Expert
Rev Proteomics. (In press).
|
|
70
|
Donoghue P, Doran P, Dowling P and
Ohlendieck K: Differential expression of the fast skeletal muscle
proteome following chronic low-frequency stimulation. Biochim
Biophys Acta. 1752:166–176. 2005. View Article : Google Scholar : PubMed/NCBI
|
|
71
|
Philippova M, Banfi A, Ivanov D,
Gianni-Barrera R, Allenspach R, Erne P and Resink T: Atypical
GPI-anchored T-cadherin stimulates angiogenesis in vitro and in
vivo. Arterioscler Thromb Vasc Biol. 26:2222–2230. 2006. View Article : Google Scholar : PubMed/NCBI
|
|
72
|
Steinacker P, Aitken A and Otto M: 14-3-3
proteins in neurodegeneration. Semin Cell Dev Biol. 22:696–704.
2011. View Article : Google Scholar
|
|
73
|
Ohlendieck K: Proteomics of skeletal
muscle glycolysis. Biochim Biophys Acta. 1804:2089–2101. 2010.
View Article : Google Scholar : PubMed/NCBI
|
|
74
|
Gelfi C, Vigano A, De Palma S, Ripamonti
M, Begum S, Cerretelli P and Wait R: 2-D protein maps of rat
gastrocnemius and soleus muscles: a tool for muscle plasticity
assessment. Proteomics. 6:321–340. 2006. View Article : Google Scholar : PubMed/NCBI
|
|
75
|
Wells GD, Selvadurai H and Tein I:
Bioenergetic provision of energy for muscular activity. Paediatr
Respir Rev. 10:83–90. 2009. View Article : Google Scholar : PubMed/NCBI
|
|
76
|
Rakus D, Pasek M, Krotkiewski H and Dzugaj
A: Interaction between muscle aldolase and muscle fructose
1,6-bisphosphatase results in the substrate channeling.
Biochemistry. 43:14948149572004. View Article : Google Scholar : PubMed/NCBI
|
|
77
|
Kim JW and Dang CV: Multifaceted roles of
glycolytic enzymes. Trends Biochem Sci. 30:142–150. 2005.
View Article : Google Scholar : PubMed/NCBI
|