Introduction
P-glycoprotein (P-gp), the product of the multidrug
resistance protein 1 (MDR1) (or ABCB1) gene in
humans, is one of the most important and interesting members of the
numerous, highly conserved, widespread membrane transporters of the
ATP-binding cassette superfamily (1,2).
P-gp has been found to be constitutively expressed in epithelial
cells of tissues with excretory function, such as the intestine,
liver, kidneys, lungs, the blood-brain barrier and placenta, as
well as in blood cells such as lymphocytes, where P-gp expression
may limit tissue penetration of its substrates (3). The role of P-gp expression and
function in cells of the immune system in the treatment of HIV-1
infection has become a focus of research in recent years.
P-gp-expressing cells, such as CD4+ lymphocytes, the
primary target of HIV-1 infection, show limited intracellular
accumulation of antiretroviral drugs (4,5).
Therefore, the affinity of antiretroviral drugs to P-gp and the of
expression level of P-gp and other transporters in lymphocyte
subpopulations may be contributing factors in the response to
antiretroviral therapy (ART).
Although preliminary results have shown that P-gp is
expressed in peripheral blood CD4+ cells, there has been
controversy whether antiretroviral drugs inhibit P-gp, while
studies on P-gp expression in peripheral blood CD8+
cells of HIV-1-infected patients receiving antiretroviral regimens
are limited. It is possible that the in vivo interaction of
ART drugs with P-gp may reduce the intracellular drug
concentrations, resulting in the insufficient suppression of HIV-1
replication, providing additional diagnostic evidence for the
virologic response to ART during HIV-1 infection (6,7).
Therefore, this study was carried out to measure the expression of
P-gp in peripheral CD8+ T lymphocytes in HIV-1-infected
patients, to investigate how the levels of P-gp are affected by ART
in HIV-1 infection, and to assess the value of using P-gp
expression to predict the virologic response to ART in a cohort of
HIV-1-infected patients in China.
Materials and methods
Study subjects
Ninety-two HIV-1-infected patients on ART [58
patients treated with zidovudine (AZT) + lamivudine (3TC) +
efavirenz (EFV) and 34 patients treated with AZT + 3TC + nevirapine
(NVP)] and 49 HIV-1-infected ART-naïve patients who were
consecutively treated at Lanzhou General Hospital (Lanzhou, China)
and Tangdu General Hospital (Xi’an, China) participated in this
study to compare the effects of ART on the levels of
P-gp+CD8+ and CD4+ T cells. The
patients were monitored with blood tests at each clinical visit,
scheduled at baseline and every 3 months after the initiation of
therapy.
We selected another 48 HIV-1-positive patients for
which virologic and immunological data were available from baseline
to 24 months after therapy, in order to assess the value of P-gp in
predicting virologic response to ART. This group (26 patients
treated with AZT + 3TC + EFV and 22 patients treated with AZT + 3TC
+ NVP), hereafter termed as the extreme group, was divided into 2
subgroups: good virologic responders were defined as patients who
maintained a viral load below the detection limit of the assay
(<40 copies/ml) at 6 months of therapy and at 12 months of
follow-up. Poor virologic responders were defined as patients who
had detectable viral loads (>40 copies/ml) at 6 and 12 months.
For the patients in each group, we analyzed changes in
CD4+ T cell count and viral load every 3 months during
the follow-up and until 24 months.
As the control group for assessing the normal levels
of measured cells, we included 24 healthy blood donors who were
recruited at the same hospital. The local ethics committee approved
the study, and all participants, after having been fully informed
of the study procedures, provided written informed consent prior to
enrollment.
Measurement of blood CD4+ T
cell counts
The T lymphocyte subsets of all patients were
measured by a 4-colour FACSCalibur cytometer (BD Biosciences, San
Jose, CA, USA). The absolute CD4+ T cell number was
calculated from the product of white cell counts. All measurements
were made using the same flow cytometer and sample preparation over
the duration of the study.
Virologic assessment
Batch viral load measurements were performed at the
end of the study period on plasma samples which were stored at
−80°C. The COBAS® TaqMan 48 Analyzer (Roche Diagnostics,
Basel, Switzerland) was used for the detection and quantification
of HIV RNA in the plasma, following the manufacturer’s
instructions. RNA was extracted from 500 μl of plasma, following a
generic nucleic acid isolation protocol, based on the adsorption of
RNA molecules on a glass fiber and elution with an aqueous
solution. We calculated the HIV-1 RNA titer in the tested samples
based on the HIV-1 signal, the signal of the HIV-1 quantification
standard and the lot-specific calibration constants provided with
the COBAS TaqMan HIV-1 test. Reported values for the upper limit of
quantification (ULQ) and the lower limit of quantification (LLQ)
were 10,000,000 (7xlog10) and 40 (1.6xlog10)
copies/ml, respectively.
Isolation of peripheral blood mononuclear
cells (PBMCs)
PBMCs were isolated from venous blood samples and
separated with centrifugation on a Ficoll-Hypaque (Sigma-Aldrich,
St. Louis, MO, USA) density gradient. Following isolation, the
PBMCs were immediately cryopreserved in RPMI-1640 medium
supplemented with 10% FBS (both from Gibco-Invitrogen, Carlsbad,
CA, USA) and 10% dimethyl sulfoxide (Merck, Amsterdam, The
Netherlands) and stored in a liquid nitrogen tank. The frozen PBMCs
were thawed with a step-by-step, gradual dilution method, as
previously described (8). Cell
viability was >90%, as assessed by a trypan blue exclusion
assay.
Quantification of MDR1 mRNA expression by
quantitative reverse transcription PCR (qRT-PCR)
Total RNA from 3×10⁶ PBMCs was extracted
and purified using an RNeasy Mini Kit (Qiagen, Hilden, Germany)
according to the instructions provided by the manufacturer. For
first-strand cDNA synthesis, 0.5 μg of total RNA and 1 μl of
oligo(dT)18 primer were incubated with 2 μg of a 10-nM dNTP mix, 20
U RNase inhibitor, 4 μg of 5X reaction buffer and 200 U M-MuLV
reverse transcriptase (RT) (Revert Aid First Strand cDNA Synthesis
kit; Fermentas, Hanover, MD, USA), in a total volume of 20 μl, for
1 h at 42°C. Negative controls were obtained by replacing the
enzyme with water.
Quantitative PCR was performed on a
LightCycler® instrument (Roche Diagnostics, Meylan,
France) using the SYBR Premix Ex Taq II detection kit (Takara Bio
Inc., Otsu, Japan). PCR was performed in a 20 μl of solution,
consisting of 2.0 μl of the cDNA sample, 10.0 μl of 2X SYBR Premix
Ex Taq II buffer (containing Taq DNA polymerase, reaction buffer
and deoxynucleotide triphosphate mixture), 6.4 μl of nuclease-free
water and 0.8 μl of each primer (10 μM). The primers for the
amplification of MDR1 were described previously (9), and their sequences are shown in
Table I. Cycling parameters were
as follows: 30 sec at 95°C, followed by 40 cycles of 5 sec at 95°C,
20 sec at 60°C and 0 sec at 95°C, followed by 15 sec at 65°C and 0
sec at 95°C. Relative mRNA quantities were calculated using the
2−ΔΔCt method (10),
using the housekeeping gene coding for the TATAA-box binding
protein (TBP) for normalization, and are represented as fold
changes relative to the samples with the lowest mRNA expression. To
compare the mRNA expression level of MDR1 between the
subjects or subject groups, the ratio of the MDR1 transcript
level to the TBP transcript level was calculated. The mean
value (duplicate measurements) was shown in each case. The PCR
products were subjected to gel electrophoresis to ensure the size
of the specific amplicons of interest and to confirm the absence of
non-specific PCR products. To further confirm their sequences, the
resultant PCR products were further sequenced. The specificity of
each reaction was also assessed by carrying out melting curve
analysis, to ensure that only one product was present. All samples
were amplified in triplicate.
 | Table IPrimers used for qRT-PCR. |
Table I
Primers used for qRT-PCR.
| Gene | Primer
sequence | Length (bp) | GenBank Accession
no. |
|---|
| TBP | F:
TGCACAGGAGCCAAGAGTGAA | 132 | NM_003194 |
| R:
CACATCACAGCTCCCCACCA | | |
| MDR1 | F:
CACCCGACTTACAGATGATG | 81 | NM_000927 |
| R:
GTTGCCATTGACTGAAAGAA | | |
Detection of P-gp by ELISA
The CD8+ T cells were purified by a
negative selection method, using magnetic-activated cell sorting
(MACS; Miltenyi Biotec GmbH, Bergisch Gladbach, Germany) according
to the manufacturer’s instructions. The relative levels of P-gp in
the CD8+ T cells were quantified using ELISA kits
(Cusabio Biotech, Wuhan, China) according to the manufacturer’s
instructions. Each assay was carried out in triplicate wells.
Quantification of P-gp expression by flow
cytometry
To quantify P-gp protein expression, flow cytometry
analysis was performed on the stored PBMC samples using
fluorochrome-conjugated antibodies specific for the surface
markers, CD3, CD4, CD8 and P-gp. Approximately 1×10⁶
PBMCs, diluted in 2 ml phosphate-buffered saline (PBS) containing
1% FBS were transferred to 5-ml sterile tubes. The cells were
harvested following centrifugation at 1,500 rpm for 10 min at 4°C.
The following antibodies were used for staining: anti-CD3-PerCP,
anti-CD4-FITC, anti-CD8-APC (all from BD Biosciences) and mouse
anti-human ABCB1 PE-conjugated monoclonal antibody (eBioscience,
San Diego, CA, USA). The cells were incubated and stained at 4°C in
the dark for 30 min, and were then analyzed with a 4-colour
FACSCalibur cytometer. Image acquisition was performed using
CellQuest software (BD Biosciences), and data analyses were
performed using FlowJo software version 8.6 (Tree Star Inc.,
Ashland, OR, USA). Isotype control antibodies were used to separate
the infected from the control cells in the FITC, PerCP, PE and APC
fluorescence channels.
Rhodamine 123 (Rh123) efflux assay
P-gp activity was determined by estimating the
efflux of Rh123 (Sigma-Aldrich), a fluorescent dye that is a P-gp
substrate, as previously described (11). Briefly, 200 μl of purified cell
suspension was incubated with Rh123 (final concentration, 200
ng/ml) for 20 min under 5% CO2 at 37°C. After washing,
the cells were incubated in Rh123-free medium in the presence or
absence of cyclosporine A (CsA; Sigma-Aldrich), a P-gp-specific
competitive inhibitor (final concentration, 1, 000 ng/ml), for 30
min under 5% CO2 at 37°C. Finally, the cells were washed
in CsA-containing RPMI-1640 medium and stained with phycoerythrin
(PE)-conjugated, anti-CD3 and anti-CD8 antibodies (both from BD
Biosciences). After staining, the cells were washed twice,
resuspended in PBS and kept at 4°C in the dark for 20 min.
The data were analyzed with a FACSCalibur flow
cytometer using CellQuest software. The efflux of Rh123 from the
PBMCs was assessed by analyzing the changes in cellular
fluorescence in the presence or absence of CsA. The Rh123
fluorescence emits at a wavelength of 488 nm and was detected on
fluorescence channel (FL)1 of the flow cytometer. PE fluorescence
was detected on FL2. The forward- and side-scatter were used to
gate the cell population of lymphocytes. For each sample, 10,000
events were collected. The data were analyzed using the
Kolmogorov-Smirnov (KS) statistic, which measures the difference
between 2 distribution functions and generates a D-value, ranging
from 0 to 1.0. A higher D-value indicates a higher difference
between the distribution functions, and thus, a strong expression
of P-gp.
Statistical analysis
Data were summarized by computing the median and
interquartile range (IQR). Undetectable viral loads were assigned a
value of 20 RNA copies/ml (average of maximum and minimum
undetectable values). Differences between independent groups were
tested for statistical significance using the Mann-Whitney U test
or the Wilcoxon signed-rank test for paired data (time-paired data
in each group).
For each virologic and immunological parameter,
sensitivities, specificities, positive and negative predictive
values were assessed as to their ability to define the response to
treatment in the entire cohort (e.g., the sensitivity of high
levels of activated cells in identifying patients with a detectable
viral load during the follow-up months). The performance of these
evaluations was studied by receiver operating characteristic (ROC)
curves. ROC curves depict the true positive rate (sensitivity) vs.
the false positive rate [1 minus the specificity (1-specificity) or
true negative rate]. The area under the curve (AUC) was used to
measure discrimination, i.e., the ability of the test to correctly
classify good and poor responders. An AUC of 1 represents a perfect
test [sensitivity = 1 (100%), specificity = 1 (100%)]. Cut-off
values with the highest discrimination capacity between good and
poor responders were established. Confidence intervals (CI) of 95%
were used to depict uncertainty in the estimates of sensitivity and
specificity. All statistical analyses were performed using SPSS
16.0 software for Windows (SPSS Inc., Chicago, IL, USA). The
Spearman correlation coefficient was calculated to assess the
association between the proportion of P-gp-expressing
CD8+ T cells and other virologic or immunological
parameters. Coefficients of variation (%) were expressed as
(SD/mean) ×100. A value of P<0.05 was considered to indicate a
statistically significant difference.
Results
Patient characteristics
A total of 92 patients were enrolled in the initial
analysis, with more than half (79.7%) being male (Table II). The median age of the
HIV-1-infected patients on ART was 35 years (IQR, 22–55), the
median age of the HIV-1-infected ART-naïve patients was 33 years
(IQR, 19–46), and there were no significant differences in age
among the different groups. The median CD4+ T cell count
of the HIV-1-infected patients on ART was 217 cells/μl (IQR,
3–615), and the median HIV RNA level was 2.2 log10
copies/ml (IQR, 1.6–4.2). The median CD4+ T cell count
of the HIV-1-infected ART-naïve patients was 103 cells/μl (IQR,
6–231), and the median HIV RNA level was 3.8 log10
copies/ml (IQR, 2.6–5.5).
| Table IIDemographic and immunological
parameters of HIV-1-infected patients enrolled in this study. |
Table II
Demographic and immunological
parameters of HIV-1-infected patients enrolled in this study.
| Parameters | HIV-1-infected
patients on ART | HIV-1-infected
ART-naïve patients | Healthy blood
donors |
|---|
| No. | 92 | 49 | 24 |
| Age (years) | 35 (22–55) | 33 (19–46) | 28 (25–33) |
| Gender ratio
(male/female) | 74/18 | 38/11 | 14/10 |
| CD4+ T
cell count, cells/μl | 217 (3–615) | 103 (6–231) | 721 (620–839) |
| Viral load,
log10 copies/ml | 2.2 (1.6–4.2) | 3.8 (2.6–5.5) | N/A |
Of the 48 patients that had received ART for 2
years, 20 were categorized as good virologic responders and 28 as
poor virologic responders. The median ages were 40 years (IQR,
33–43) for the good responders, 42 years (IQR, 34–41) for the poor
responders, and 28 years (IQR, 25–33) for the healthy blood donors.
Median CD4+ T cell counts at baseline were estimated at
269.5 cells/μl (IQR, 210.3–339.8) for the good responders, 321
cells/μl (IQR, 228.3–341.3) for the poor responders (P>0.05),
and 721 cells/μl (IQR, 620–839) for the healthy blood donors
(P<0.05). Plasma RNA viral load at baseline was similar for good
and poor responders [4.5 log10 copies/ml (IQR, 4.2–4.8)
and 4.6 log10 copies/ml (IQR, 4.5–4.9), respectively,
P>0.05] (Table III). The
viral load of the good responders was maintained below the
detection limit for at least 12 months. By contrast, in the poor
responders, median viral loads were 3.0 log10 and 3.9
log10 copies/ml after 6 and 12 months of therapy,
respectively.
| Table IIIDemographic and immunological
parameters of the 48 HIV-1-infected patients, defined as the
extreme group. |
Table III
Demographic and immunological
parameters of the 48 HIV-1-infected patients, defined as the
extreme group.
| Parameters | Good virologic
responders | Poor virologic
responders | Healthy blood
donors |
|---|
| No. | 20 | 28 | 24 |
| Age (years) | 40 (33–43) | 42 (34–41) | 28 (25–33) |
| Gender ratio
(male/female) | 12/8 | 18/10 | 14/10 |
| CD4+ T
cells/μl | 269.5
(210.3–339.8) | 321
(228.3–341.3) | 721 (620–839) |
| Viral load
(log10 copies/ml) | 4.5 (4.2–4.8) | 4.6 (4.5–4.9) | N/A |
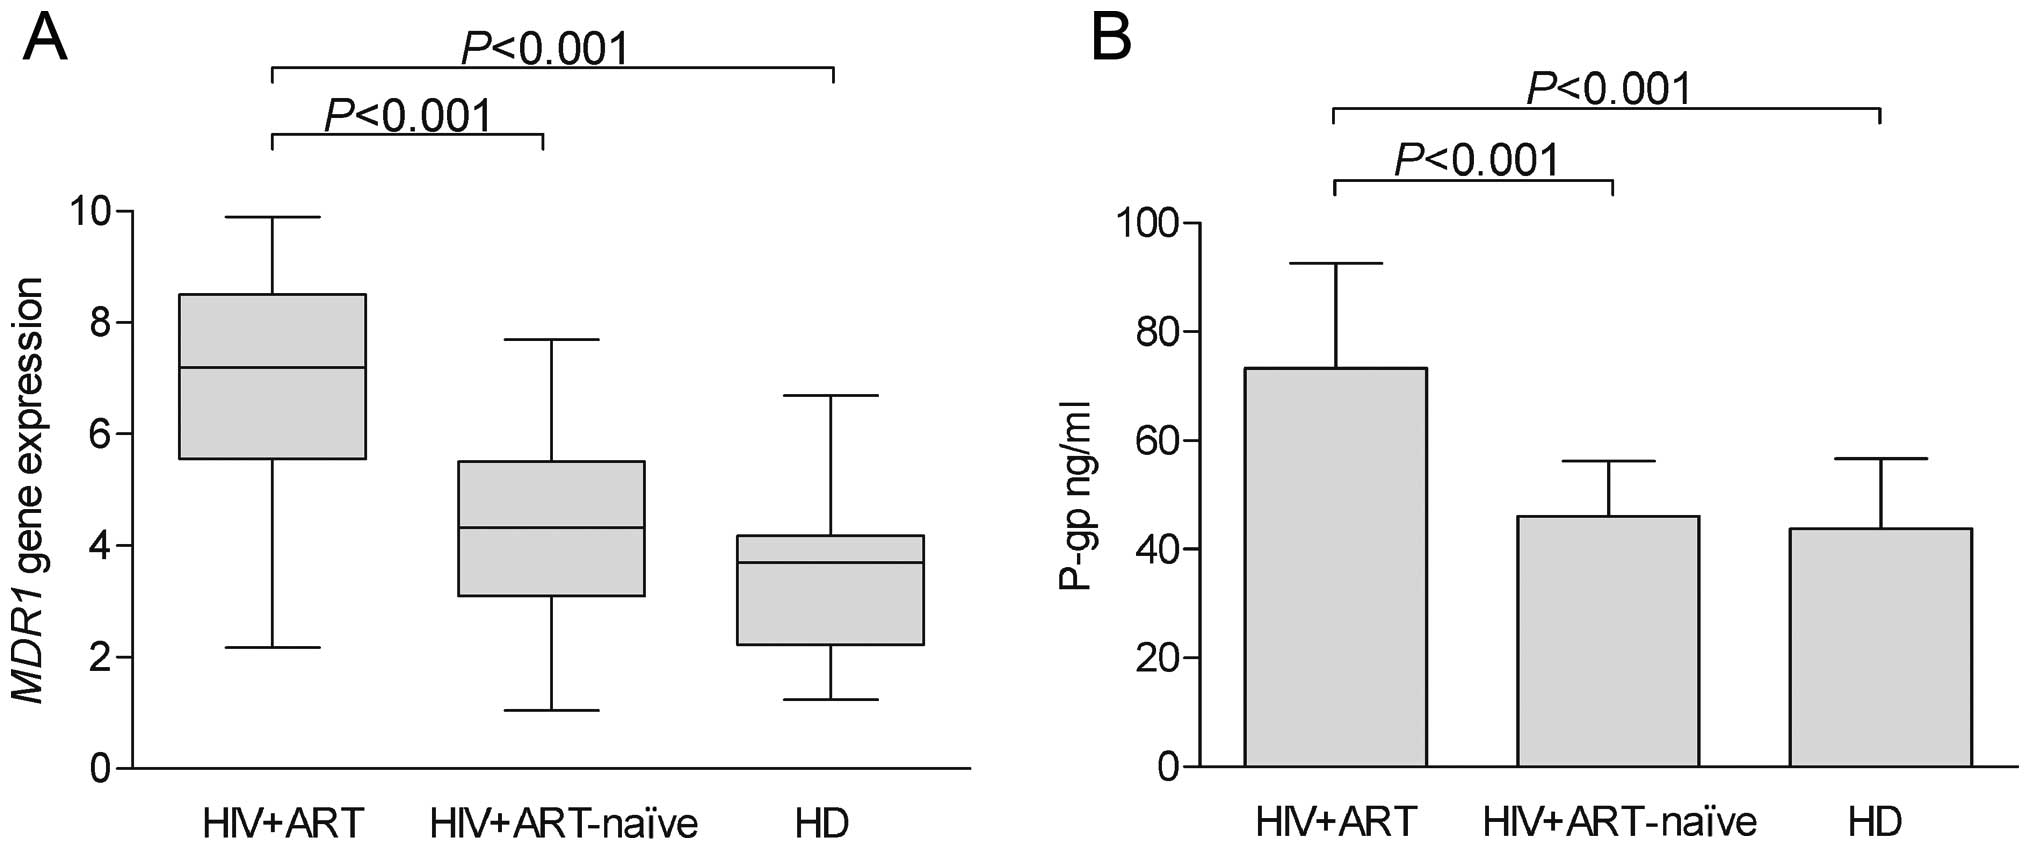
Expression of MDR1 transcripts
The relative mRNA levels for the MDR1 gene in
the HIV-1-infected patients on ART, the HIV-1-infected ART-naïve
patients and the healthy donors are shown in Fig. 1A. The MDR1 gene was
detected in all the groups analyzed. The mRNA levels of MDR1
were low in both the HIV-1-infected ART-naïve patients and the
healthy blood donors, and were significantly lower than those
observed in the HIV-1-infected patients on ART. As regards the
demographic and immunological characteristics of the patients,
MDR1 expression did not correlate with age, gender, or the
initial white blood cell count.
Expression of P-gp in CD8+ T
cells of HIV-1-infected patients
P-gp expression in the CD8+ T cells was
detected by ELISA in the 92 HIV-1-infected patients on ART, the 49
HIV-1-infected ART-naïve patients and the 24 healthy blood donors
(Fig. 1B). The levels of P-gp in
the HIV-1-infected patients on ART were significantly higher than
those observed in the HIV-1-infected ART-naïve patients and the
healthy blood donors.
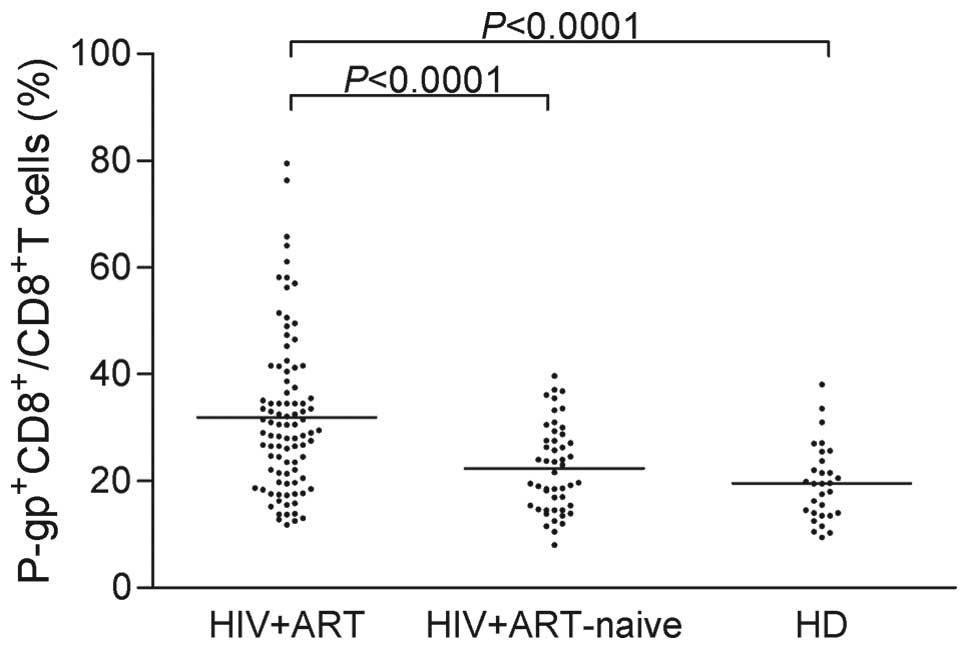
The expression of P-gp was further quantified by
flow cytometry in the same groups. As shown in Fig. 2, a high inter-individual
variability was observed in the samples from the 3 groups, with
coefficients of variation (CV) approaching 40%. Notably, the
highest degree of variability was observed for the HIV-1-infected
patients on ART (45.55%).
Despite the high variability in all 3 groups, the
expression level of P-gp was significantly higher in the
HIV-1-infected patients on ART compared with the HIV-1-infected
ART-naïve patients (P<0.0001) and the healthy blood donors
(P<0.0001). Specifically, the mean (± SD) values of the
expression of P-gp were as follows: 31.93±14.55 (IQR, 11.79–79.50)
in the HIV-1-infected patients on ART, 22.40±8.101 (IQR,
8.03–39.73) in the HIV-1-infected ART-naïve patients, and
19.57±7.124 (IQR, 9.42–38.12) in the healthy donors.
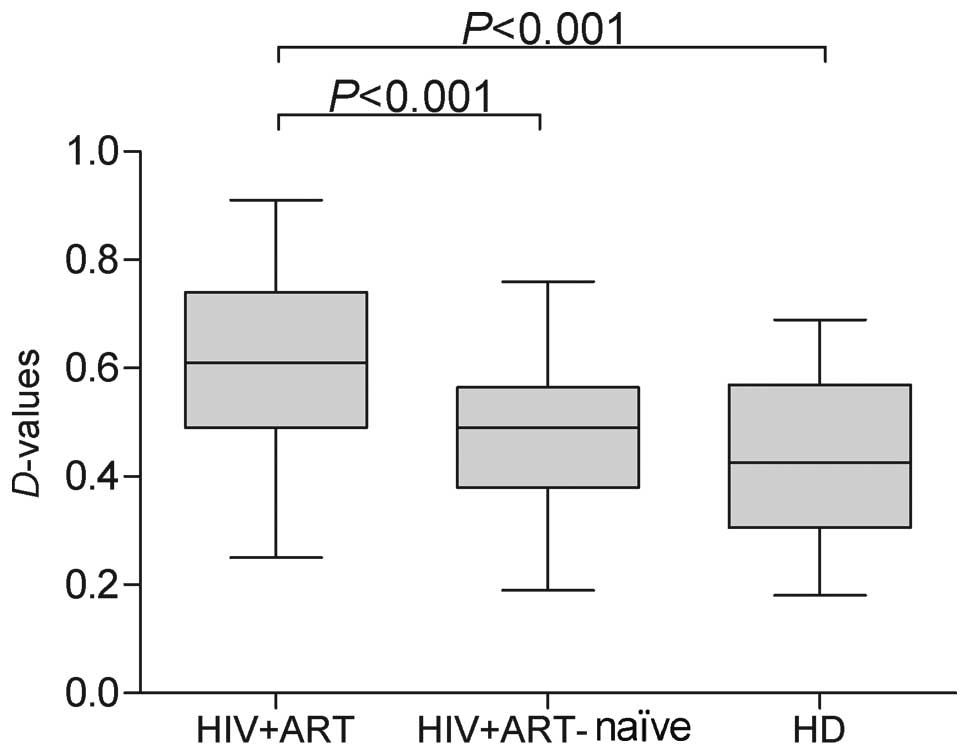
Comparison of P-gp activity in the
CD8+ T cells between the HIV-1-infected patients and
healthy donors
In order to evaluate the ability of P-gp to actively
pump drugs from the cytosol and plasma membrane into the
extracellular space, we analyzed the amounts of extruded Rh123 via
calculations of the D-value in CD8+ cells. We then
compared the P-gp activity in peripheral CD8+ cells
between healthy donors and HIV-1-infected patients. P-gp activity
tended to be higher in the HIV-1-infected patients on ART, and
statistically significant differences were noted in P-gp activity
(Fig. 3) between the
HIV-1-infected patients on ART and the HIV-1-infected ART-naïve
patients, as well as between the HIV-1-infected patients on ART and
the healthy donors (P<0.001 and P<0.001, respectively).
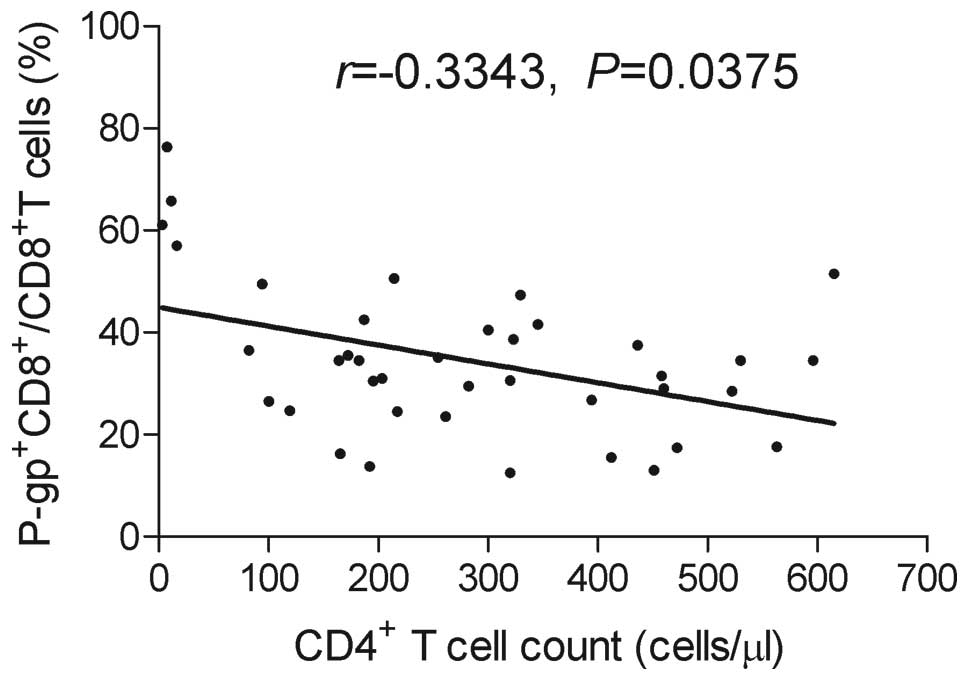
Correlation of
P-gp+CD8+ T cell with blood CD4+ T
cell count
To investigate whether the increase in P-gp
expression in peripheral blood CD8+ T lymphocytes
correlates with the blood CD4+ T cell count, we measured
the CD4+ T cells in the recruited patients. Due to the
limited availability of the material, it was not possible to
evaluate the CD4+ T cell numbers for all the
HIV-1-infected patients; the number of CD4+ T cells was
measured in 39 HIV-1-infected patients on ART. We found a
significant inverse correlation between
P-gp+CD8+ T cell and CD4+ T cell
counts in the HIV-1-infected patients on ART (Fig. 4). The correlation between these 2
cell populations was also investigated in the HIV-1-infected
ART-naïve group and the healthy donors group, but no significant
correlation was found (P>0.05, data not shown).
Correlation between expression of P-gp
and virologic parameters
Spearman’s correlation analysis was used to
determine whether the expression levels of P-gp are associated with
the level of plasma HIV RNA. The results revealed no evidence of
the prognostic value of P-gp expression in HIV-1 infection, since
no correlation was observed between P-gp expression and the level
of plasma HIV-RNA in HIV-1-infected patients on ART (P>0.05,
data not shown).
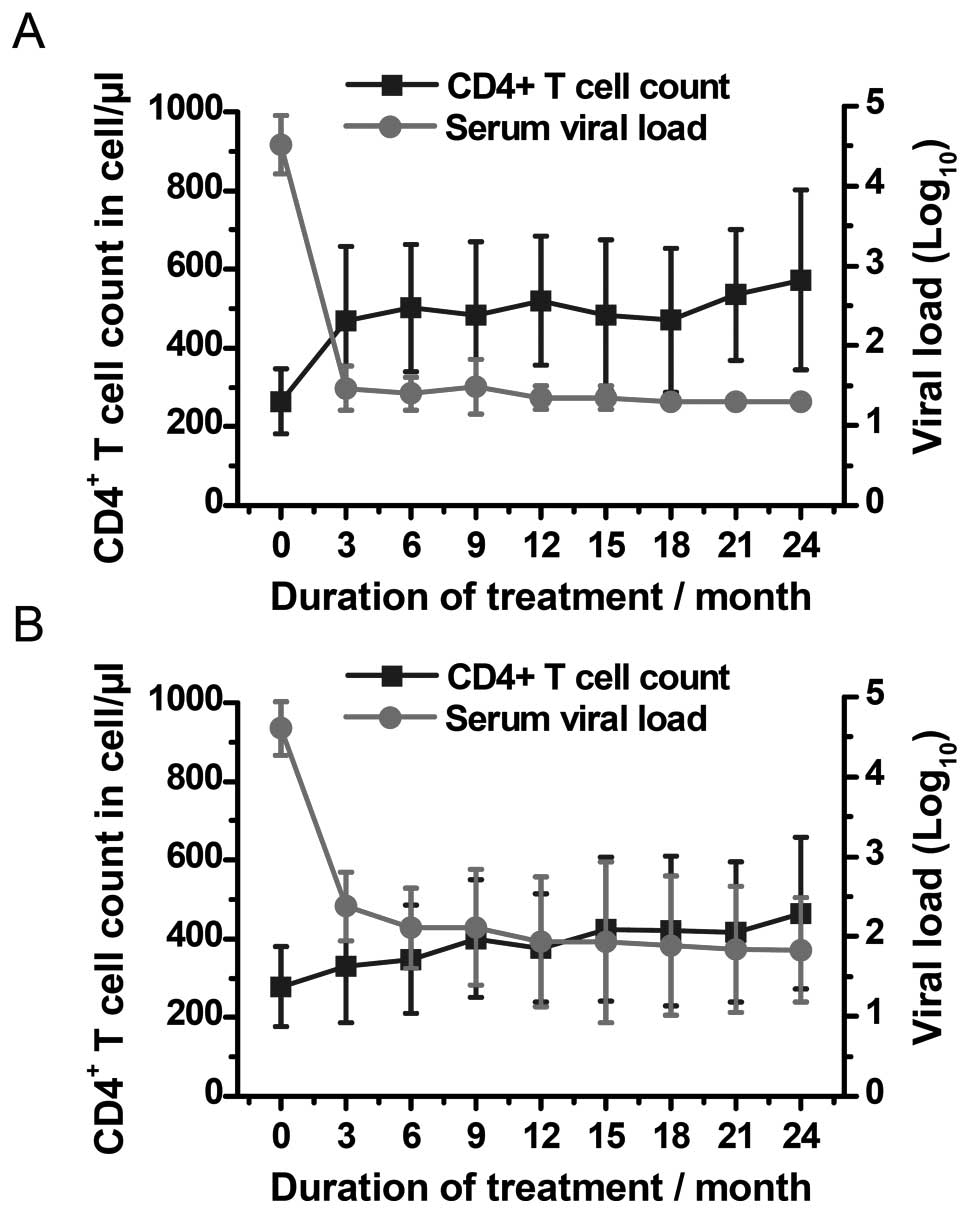
Changes in numbers of
P-gp+CD8+ T cells among good and poor
virologic responders
In the good-responder group, 6 the median levels of
CD4+ T cells increased steadily from 269.5 cells/μl at
baseline to 486.5 cells/μl at 24 months (P<0.0001) (Figs. 5A and 6A). At baseline, the median percentage
of P-gp+CD8+ T cells relative to the entire
population of CD8+ lymphocytes increased from 20% (IQR,
17.45–24.30%) to 30.31% (IQR, 26.29–42.32%) after 6 months of
therapy (P=0.0007), and finally, to 53.31% (IQR, 47.50–64.25%)
after 24 months of therapy (P<0.0001) (Fig. 7A). The expression levels of
P-gp+CD8+ T cells at baseline were comparable
to those observed in the healthy blood donors (P=0.45).
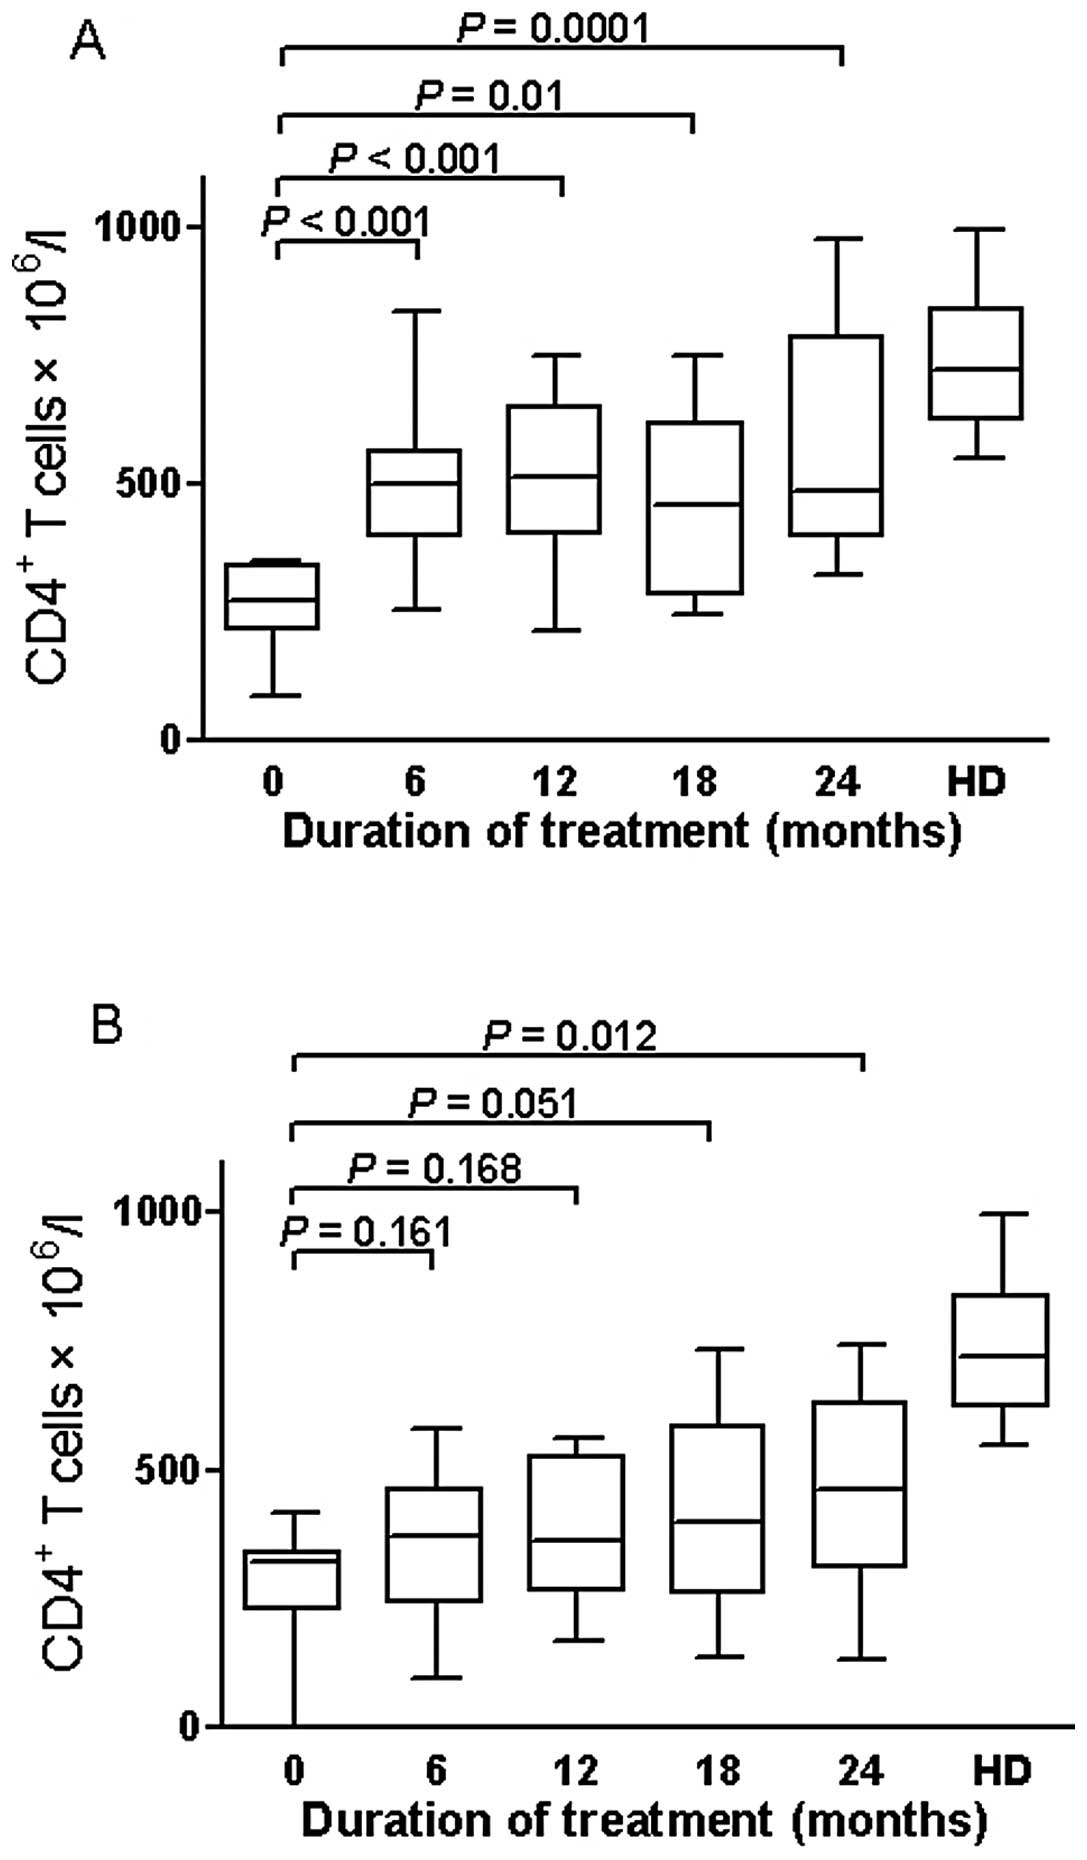 | Figure 6Changes in median CD4+ T
cell count of the extreme group (n=48), divided in good and poor
virologic responders. (A) In the good responders, median levels of
CD4+ T cell count increased steadily from 269.5 cells/μl
at baseline to 497 cells/μl at 6 months (P<0.0001), to 512.5
cells/μl at 12 months (P<0.0001), to 460 cells/μl at 18 months
(P<0.001), and to 486.5 cells/μl at 24 months (P<0.0001). (B)
In the poor responders, CD4+ T cell levels after 6, 12
and 18 months of therapy [370 (239.5–462.3); 361.5 (265.8–526.3);
398 (259.3–585) cells/μl] were similar to values observed at
baseline [321 (228.3–341.3) cells/l] (P=0.16; P=0.168; P=0.051),
then increased to 462.5 cells/μl at 24 months (P=0.012). Boxplots
represent the median, interquartile range (boxes) and the 5–95%
data range (whisker caps). Healthy blood donors (HD) were used as
controls. ART, antiretroviral therapy. |
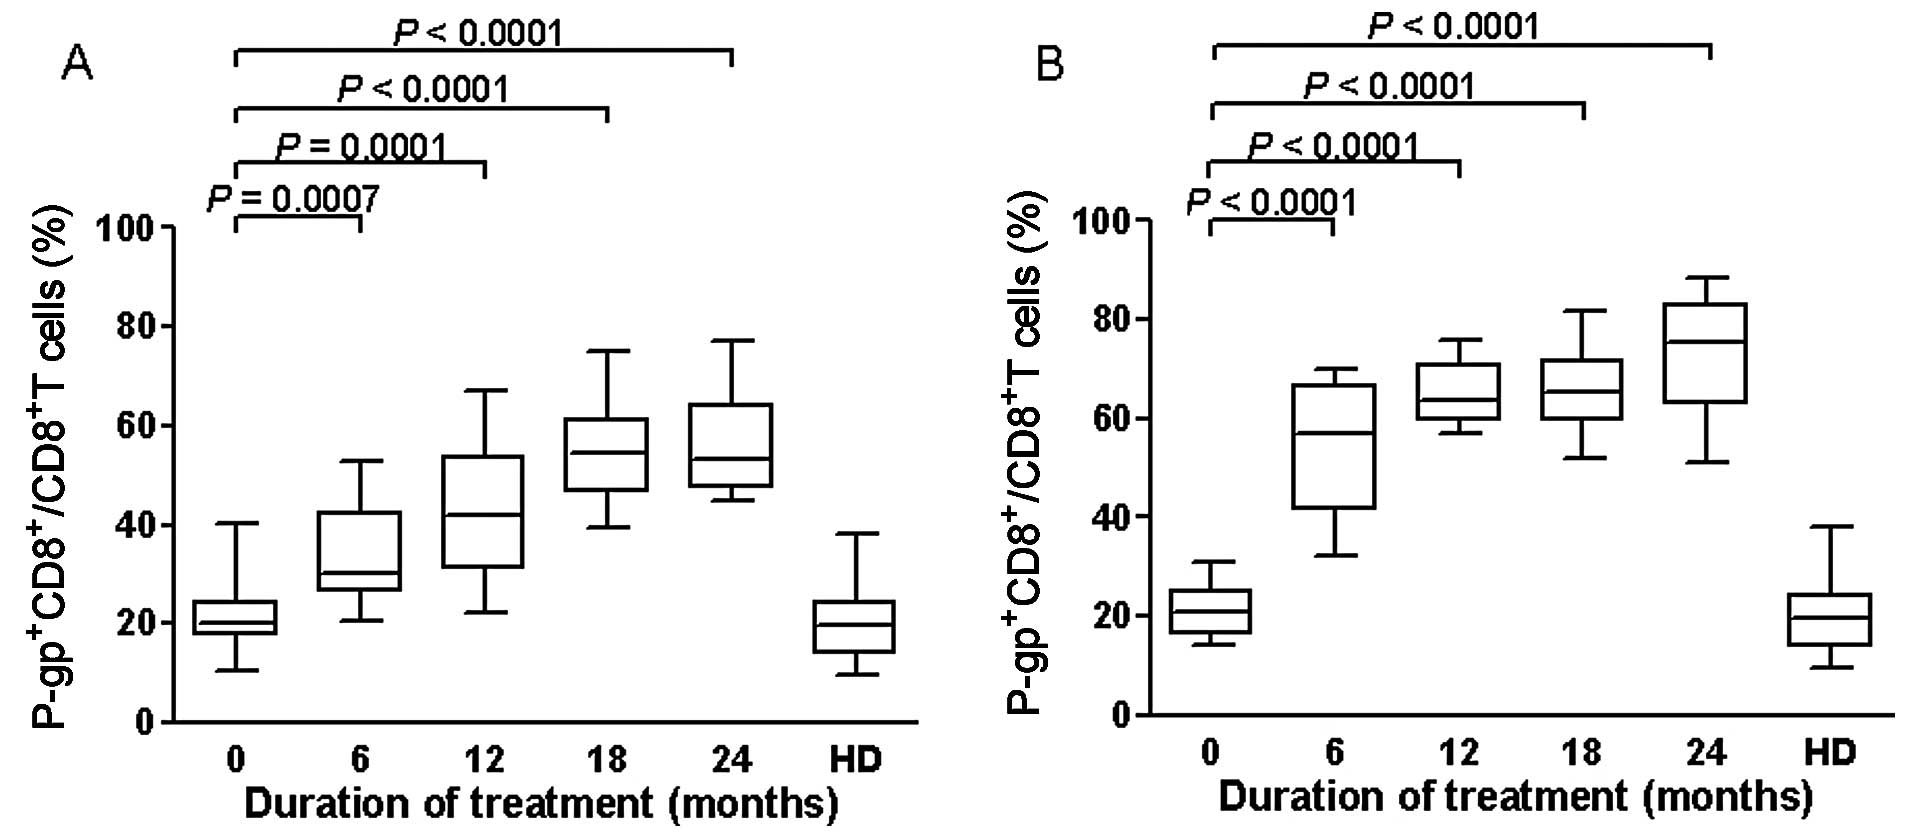 | Figure 7Effects of ART on expression of
P-gp+CD8+ T cells of the extreme group
(n=48), divided in good and poor virologic responders. Data are
expressed as percentages of P-gp+ cells within the
CD8+ lymphocytes subset. (A) In the good responders,
median levels of expression of P-gp+CD8+ T
cells at baseline were 20% (IQR, 17.45–24.30%), and they increased
to 30.31% (IQR, 26.29–42.32%) at 6 months of therapy (P=0.0007), to
41.81% (IQR, 31–53.75%) at 12 months (P=0.0001), to 54.48% (IQR,
46.55–61.25%) at 18 months (P<0.0001), and to 53.31% (IQR,
47.50–64.25%) at 24 months (P<0.0001). (B) In the poor
responders, levels of expression of P-gp+CD8+
T cells increased significantly from the baseline until 6
(P<0.0001), 12 (P<0.0001), 18 (P<0.0001) and 24 months of
ART therapy (P<0.0001). Boxplots represent the median,
interquartile range (boxes) and the 5–95% data range (whisker
caps). Comparisons of expression of P-gp+CD8+
T cells between different time points were performed with the
Mann-Whitney U test. Healthy blood donors (HD) were used as
controls. P-gp, P-glycoprotein; ART, antiretroviral therapy. |
In the poor-responder group, CD4+ T cell
levels at baseline were 321 cells/l (IQR, 228.3–341.3), and
increased to 462.5 cells/μl at 24 months of ART (P=0.012) (Figs. 5B and 6B). The relative percentage of
P-gp+CD8+ T cells relative to the entire
population of CD8+ lymphocytes reached 56.98% (IQR,
41.25–66.65%) at 6 months of therapy (P=0.0001 compared to the
beginning of ART), and 75.37% (IQR: 62.87–83.17%) at 24 months of
ART (P<0.0001) (Fig. 7B). The
median percentage of P-gp+CD8+ T cells was
comparable to that of the healthy blood donors (P=0.33) at
baseline.
Predictive value of immunological markers
for the response to treatment
We examined whether the absolute CD4+ T
cell count or the relative proportion of
P-gp+CD8+ cells can be used for
discriminating the response to treatment between the good- and
poor-responder groups. For each parameter, we plotted the true
positive rate (sensitivity) and the false positive rate
(1-specificity) in a ROC curve for various cut-off values (see
Fig. 8 for CD4+ T cell
count at 6 months and Fig. 9 for
P-gp+CD8+ cell percentages at 6 months). The
AUC was used to assess and compare the discriminatory power of the
2 markers in the good- and poor-responder groups (Table IV). The AUC of an ideal test
equals 1, whereas the AUC of a poor test equals 0.5. In the present
study, the P-gp+CD8+ cell percentage was the
best predictor of virologic response with an associated AUC value
equal to 0.885, 0.946, 0.814 and 0.852 at 6, 12, 18 and 24 months,
respectively. Absolute CD4 counts did not show any discriminatory
value for the response to treatment, with associated AUC values
close to 0.5 and P>0.5 for all months, apart from the 6th month
(Table IV and Fig. 8). The use of P-gp mean
fluorescence intensity (MFI) as a marker did not improve the
sensitivity and specificity of the discriminatory assay compared to
the P-gp+CD8+ T cell percentage (data not
shown).
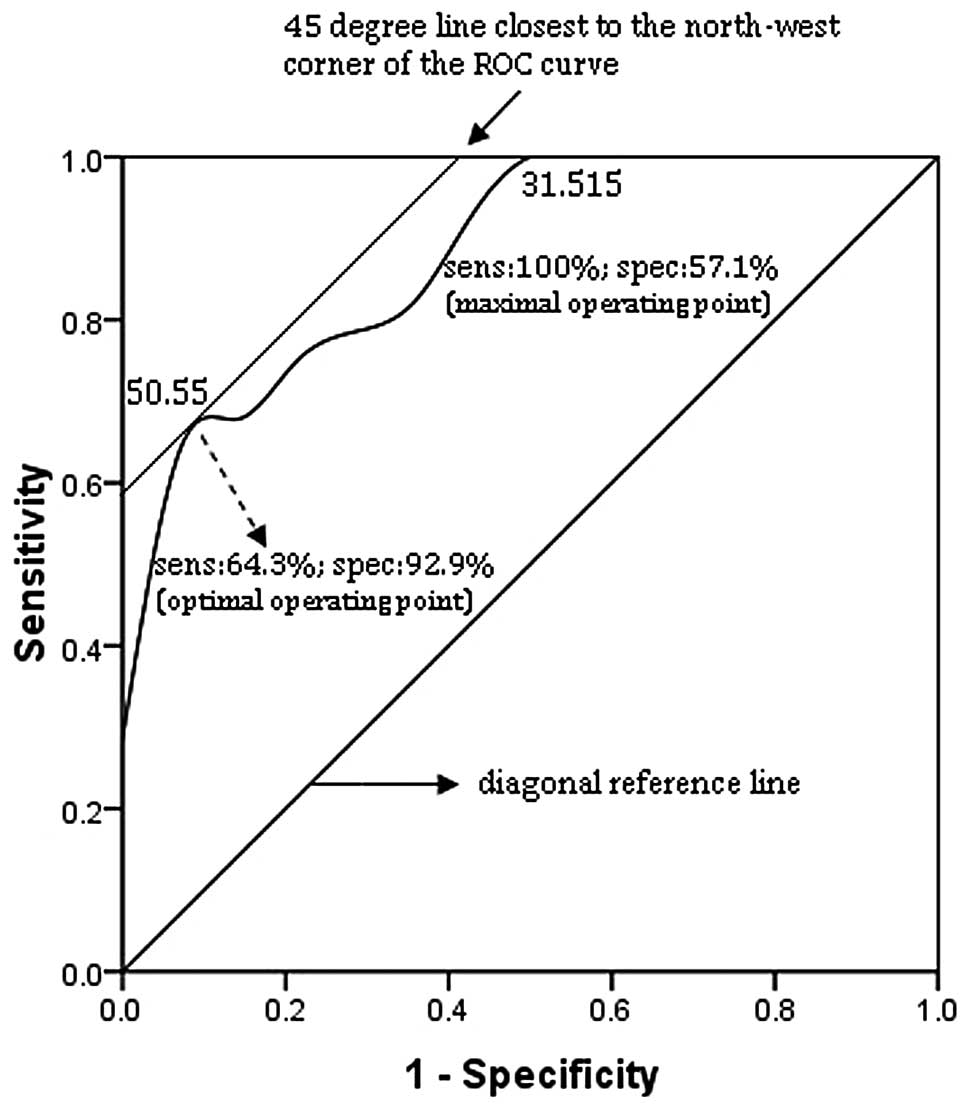
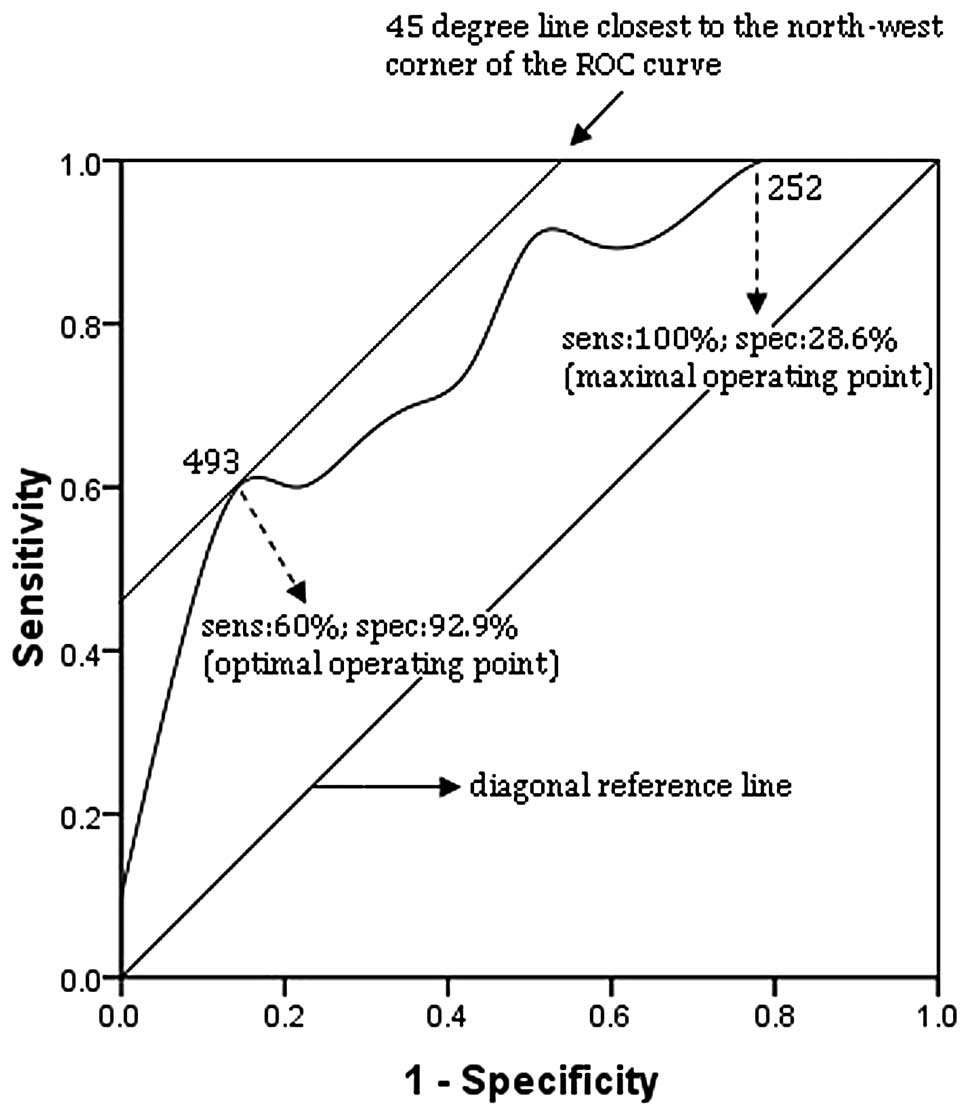 | Figure 8Receiver operating characteristic
(ROC) curve of blood CD4+ T cell counts at 6 months in
the extreme group (n=48). The correlation between sensitivity
(sens) and 1-specificity (spec) of each immunological parameter to
predict good or poor response to treatment was examined. ROC curves
were constructed by plotting the true positive rate (sens) against
the false positive rate (1-spec) for all possible cut-off values,
displayed along the curve. The smallest cut-off value in the curve
is the minimum observed value minus 1 and the largest cut-off value
is the maximum observed value plus 1. All the other cut-off values
are the average of 2 consecutive observed values. The area under
the curve (AUC) is 0.782. The optimal operating point (493) i.e.,
the cut-off yielding the highest test accuracy, is associated with
a relatively high false negative rate (sens, 60%; spec, 92.9%).
This point lies on a 45° line closest to the northwest corner
(sens, 100%; spec, 0%) of the ROC curve. For more efficient
screening of poor response to treatment, a maximal sensitivity
point may be preferred by using 252 as the optimal operating point
(sens, 100%; spec, 28.6%). |
| Table IVAUC, P-values and 95% CI
corresponding to each parameter analyzed on the ROC curve for its
discriminating value between good and poor responders within the
HIV-1-infected group (extreme group; n=48). |
Table IV
AUC, P-values and 95% CI
corresponding to each parameter analyzed on the ROC curve for its
discriminating value between good and poor responders within the
HIV-1-infected group (extreme group; n=48).
| Treatment time
points | Parameters | AUC | P-value | 95% CI |
|---|
| Month 6 | CD4+ T
cell count | 0.782 | 0.021 | 0.592–0.972 |
|
P-gp+CD8+ T cells
(%) | 0.885a | 0.001a | 0.766–1.004 |
| Month 12 | CD4+ T
cell count | 0.736 | 0.053 | 0.527–0.945 |
|
P-gp+CD8+ T cells
(%) | 0.946a | <0.001a | 0.854–1.039 |
| Month 18 | CD4+ T
cell count | 0.607 | 0.380 | 0.375–0.840 |
|
P-gp+CD8+ T cells
(%) | 0.814a | 0.005a | 0.652–0.975 |
| Month 24 | CD4+ T
cell count | 0.600 | 0.412 | 0.359–0.841 |
|
P-gp+CD8+ T cells
(%) | 0.852a | 0.002a | 0.713–0.991 |
A range of cut-off values between the optimal
operating point (i.e., the cut-off value yielding the best
trade-off between sensitivity and specificity) and the maximal
sensitivity point (highest possible sensitivity value) was
identified from the ROC curve of P-gp+CD8+
percentages at 6 months of ART. The results are presented in
Table V.
| Table VSensitivity and specificity of
P-gp+CD8+ cell percentages associated with
different cut-off values in predicting good and poor virologic
response to antiretroviral therapy (ART) in the HIV-1-infected
group (exteme group; n=48). |
Table V
Sensitivity and specificity of
P-gp+CD8+ cell percentages associated with
different cut-off values in predicting good and poor virologic
response to antiretroviral therapy (ART) in the HIV-1-infected
group (exteme group; n=48).
| | | Prediction of poor
response to ART in the HIV-1-infected group |
|---|
| | |
|
|---|
| Treatment time
point | Criterion for
choice of cut-off | Cut-off (%) | Sensitivity | Specificity |
|---|
| Month 6 | Optimal operating
point | 50.550 | 64.3 | 92.9 |
| Maximal sensitivity
point | 31.515 | 100 | 57.1 |
| Month 12 | Optimal operating
point | 56.500 | 100 | 85.7 |
| Maximal sensitivity
point | 56.500 | 100 | 85.7 |
| Month 18 | Optimal operating
point | 63.415 | 64.3 | 85.7 |
| Maximal sensitivity
point | 50.500 | 100 | 42.9 |
| Month 24 | Optimal operating
point | 63.270 | 78.6 | 78.6 |
| Maximal sensitivity
point | 50.615 | 100 | 42.9 |
Discussion
Drug interactions between anti-HIV drugs, as well as
viral resistance to ART drugs, represent a considerable limitation
to the safety and effectiveness of ART. As regards HIV-1 infection,
several studies have reported that a number of ATP-dependent
transport proteins, such as P-gp, breast cancer resistance protein
(BCRP), multidrug resistance-associated protein (MRP)1, MRP4 and
MRP5, are able to transport antiretroviral drugs (12–15). Although evidence for the central
role of other transporters in the pharmacokinetics of the
interaction with antiretroviral drugs is accumulating, the role of
P-gp is far from being elucidated, particularly in large clinical
cohorts of patients with HIV-1 infection.
HIV-1 infections are treated with HIV-protease
inhibitors (PIs), nucleosides (NRTIs), non-nucleosides (NNRTIs) and
nucleotide reverse transcriptase (NtRTIs) inhibitors. The combined
administration of different drugs in ART improves the disease
outcome, while increasing the likelihood of drug interactions. P-gp
represents an important site for drug interactions and the
induction of its activity can reduce the effectiveness of drugs
that are P-gp substrates. PIs are well established inducers of P-gp
(16–19), while data on P-gp modulation by
NRTIs and NNRTIs are limited and often conflicting, mainly due to
the difficulties in comparing induction results from different
assays.
The induction of P-gp expression by AZT in tumor
cell lines was found by Gollapudi and Gupta (20). Their study demonstrated that
HIV-1-infected T cells, as well as monocytic cell lines, have
increased levels of P-gp, while AZT accumulates in significantly
lower quantities in these cells compared to uninfected cells
(20). Likewise, a decrease in
AZT accumulation in P-gp-overexpressing CEM VBL100 cells with a
corresponding decline in sthe antiviral efficacy of the drug was
observed in another study (21).
Weiss et al (22) demonstrated the induction, with
different potencies, of P-gp activity by a number of NRTIs and
NNRTIs, such as EFV and NVP. In the Caco-2 cell line, the NNRTIs
NVP, EFV and delavirdine, which are not P-gp substrates, were shown
to induce the expression and activity of P-gp, with NVP being the
most potent inducer compared with the other 2 NNRTIs (23). Another study also reported the
P-gp-inducing properties of delavirdine, EFV and NVP (24); however, results from studies
aiming to assess whether these NNRTIs are also substrates and/or
inhibitors of P-gp are conflicting (25,26). Moreover, the few studies available
used different methods, resulting in restricted comparability and
ambiguous conclusions. In our study, the recruited patients who
were receiving the AZT + 3TC + EFV/NVP treatment showed higher
levels of of P-gp in their CD8+ T cells compared with
ART-naïve patients, which suggests that NRTIs/NNRTIs may have
P-gp-inducing properties and may contribute to drug resistance to
ART in HIV-1 infection.
The data from the present study indicate that there
is a high inter-individual variability in the protein expression of
P-gp in both HIV-1-infected patients (on ART or ART-naïve) and
healthy blood donors. The degree of variability in CD8+
T lymphocytes was higher in the patients on ART compared with the
ART-naïve patients and healthy donors, which suggests that the
therapy may contribute to the variability of the expression of this
transporter. However, the coefficient of variation of the measured
P-gp expression in the CD8+ cells of the HIV-1-infected
patients on ART was 29%, which is less than coefficients 61, 40 and
37% reported in previous studies (27–29); these discrepancies are possibly
due to different methods used to quantify the expression or to the
different study subjects. Although variations in P-gp levels in the
CD4+ population in our study were also reduced compared
to previous studies (data not shown), the tendency for
CD4+ cells to express lower levels of P-gp compared to
CD8+ cells is in agreement with previous studies
(30,31). Overall, the variability in
expression of P-gp in the lymphocyte subpopulations reported in our
study is similar or reduced compared to other studies. ART appears
to affect the expression of P-gp, since its expression was
significantly higher in HIV-1-infected patients on ART compared
with HIV-1-infected ART-naïve patients and healthy donors. This
result is in agreement with previous in vitro studies
demonstrating that the expression of ABC transporters in PBMCs is
increased in HIV-1 infection due to ART (32–34).
There was a significant inverse correlation between
P-gp+CD8+ T cell counts and CD4+
cell counts in HIV-1-infected patients on ART in our study. A
previous study (35) demonstrated
that the basal expression of P-gp in different cell populations
ranks as follows: CD56+ >CD8+
>CD4+. However, the ratio of
CD4+/CD8+ cells is reversed as
CD4+ T cells are continuously destroyed by the invading
virus in HIV-1 infections, and therefore, the expression of P-gp
may vary at different stages of the infection.
In our study, P-gp expression did not correlate with
viral load, although the transporter expression in HIV-1-infected
patients on ART was higher compared with HIV-1-infected ART-naïve
patients and healthy donors, which supports the hypothesis that
several factors may be involved in HIV infection. The role of
antiretroviral drugs in modulating the expression of ABC
transporters has not yet been elucidated. The possibility that both
therapy and HIV-1 infection may modulate the transporter expression
and translation cannot be ruled out. Moreover, increasing evidence
suggests that P-gp directly inhibits the replication of enveloped
viruses, and that P-gp expression may inhibit HIV-mediated membrane
fusion, as well as subsequent steps in the HIV-1 life cycle
(36–38). Overall, we cannot ascertain that
the lower viral loads observed in the good virologic responders are
related to ART-enhanced P-gp expression.
We also analyzed the changes in the levels of
CD4+ T cells, the plasma viral load and the percentages
of P-gp+CD8+ T cells throughout 24 months of
ART. The suppression of HIV-1 replication following ART induced
significant changes in P-gp expression in the majority of patients.
Our study provided evidence for a progressive increase in the
percentage of P-gp+CD8+ T cells, with
steadily increasing CD4+ T cell counts and a sharp
delcine in the plasma viral load, indicating that
P-gp+CD8+ T cells may represent a marker
monitoring the response to ART when the viral load decreases to
levels lower than the detection limit after antiretroviral
intervention.
We used ROC curves to assess the sensitivity and
specificity of the percentage of P-gp+CD8+
and CD4+ T cells to predict virologic response. We found
that the relative proportion of P-gp+CD8+ T
cells is a more efficient predictive marker compared to
CD4+ T cell counts. This result confirmed previous
findings that the percentage of P-gp+CD8+ T
cells constitutes a good marker of virologic response in
HIV-1-infected patients on ART.
There are certain limitations to the current study,
in particular, the small sample size and the fact that data on the
effects of viral suppression on CD8+ T cell counts in
patients who did not respond to ART was lacking. Future studies
including a group of patients who do not respond to ART are
required to provide crucial information on the effects of ART on
P-gp expression in HIV-1 infection. Furthermore, additional
time-series data on the expression of the transporter in patients
and healthy volunteers are required to define the exact effect of
drug-to-drug interactions on the expression of P-gp.
In conclusion, the results from the present study
suggest that P-gp expression varies among HIV-1-infected patients,
but is significantly increased upon ART in HIV-1-infected patients.
The overexpression of P-gp is affected during the initiation of ART
in HIV-1 infection and the P-gp+CD8+ T cell
count may provide an additional criterion for estimating the
response to ART. The relative proportion of
P-gp+CD8+ T cells appeared to provide a
sensitive estimate of the virologic response to ART in comparison
to the blood CD4+ T cell count. P-gp expression and its
correlation to the virologic and immunological parameters of
HIV-infected patients warrants further investigation using a larger
study group to determine the effects of P-gp expression on clinical
outcome.
Acknowledgements
The authors would like to thank all the subjects who
generously participated in this study. This study was supported by
a grant from the Social Development Scientific Project of Natural
Science Foundation of Shaanxi Province (No. 2012SF2-01-5).
References
|
1
|
Aller SG, Yu J, Ward A, et al: Structure
of P-glycoprotein reveals a molecular basis for poly-specific drug
binding. Science. 323:1718–1722. 2009. View Article : Google Scholar : PubMed/NCBI
|
|
2
|
Namanja HA, Emmert D, Davis DA, et al:
Toward eradicating HIV reservoirs in the brain: inhibiting
P-glycoprotein at the blood-brain barrier with prodrug abacavir
dimers. Am Chem Soc. 134:2976–2980. 2012. View Article : Google Scholar : PubMed/NCBI
|
|
3
|
Thiebaut F, Tsuruo T, Hamada H, et al:
Cellular localization of the multidrug-resistance gene product
P-glycoprotein in normal human tissues. Proc Natl Acad Sci USA.
84:7735–7738. 1987. View Article : Google Scholar : PubMed/NCBI
|
|
4
|
Choudhuri S and Klaassen CD: Structure,
function, expression, genomic organization, and single nucleotide
polymorphisms of human ABCB1 (MDR1), ABCC (MRP), and ABCG2 (BCRP)
efflux transporters. Int J Toxicol. 25:231–259. 2006. View Article : Google Scholar
|
|
5
|
Moon YJ, Zhang S and Morris ME: Real-time
quantitative polymerase chain reaction for BCRP, MDR1, and MRP1
mRNA levels in lymphocytes and monocytes. Acta Haematol.
118:169–175. 2007. View Article : Google Scholar : PubMed/NCBI
|
|
6
|
Kock K, Grube M, Jedlitschky G, et al:
Expression of adenosine triphosphate-binding cassette (ABC) drug
transporters in peripheral blood cells: relevance for physiology
and pharmacotherapy. Clin Pharmacokinet. 46:449–470. 2007.
View Article : Google Scholar : PubMed/NCBI
|
|
7
|
Varatharajan L and Thomas SA: The
transport of anti-HIV drugs across blood-CNS interfaces: summary of
current knowledge and recommendations for further research.
Antiviral Res. 82:A99–A109. 2009. View Article : Google Scholar : PubMed/NCBI
|
|
8
|
Rehermann B and Naoumov NV: Immunological
techniques in viral hepatitis. J Hepatol. 46:508–520. 2007.
View Article : Google Scholar : PubMed/NCBI
|
|
9
|
Giraud C, Declèves X, Perrot JY, et al:
High levels of P-glycoprotein activity in human lymphocytes in the
first 6 months of life. Clin Pharmacol Ther. 85:289–295. 2009.
View Article : Google Scholar : PubMed/NCBI
|
|
10
|
Livak KJ and Schmittgen TD: Analysis of
relative gene expression data using real-time quantitative PCR and
the 2(-Delta Delta C(T)) method. Methods. 25:402–440. 2001.
View Article : Google Scholar : PubMed/NCBI
|
|
11
|
Chaudhary PM, Mechetner EB and Roninson
IB: Expression and activity of the multidrug resistance
P-glycoprotein in human peripheral blood lymphocytes. Blood.
80:2735–2739. 1992.PubMed/NCBI
|
|
12
|
Lee CG and Gottesman MM: HIV-1 protease
inhibitors and the MDR1 multidrug transporter. J Clin Invest.
101:287–288. 1998. View Article : Google Scholar : PubMed/NCBI
|
|
13
|
Srinivas RV, Middlemas D, Flynn P and
Fridland A: Human immunodeficiency virus protease inhibitors serve
as substrates for multidrug transporter proteins MDR1 and MRP1 but
retain antiviral efficacy in cell lines expressing these
transporters. Antimicrob Agents Chemother. 42:3157–3162. 1998.
|
|
14
|
Huisman MT, Smit JW and Schinkel AH:
Significance of P-glycoprotein for the pharmacology and clinical
use of HIV protease inhibitors. AIDS. 14:237–242. 2000. View Article : Google Scholar : PubMed/NCBI
|
|
15
|
Janneh O, Owen A, Chandler B, et al:
Modulation of the intracellular accumulation of saquinavir in
peripheral blood mononuclear cells by inhibitors of MRP1, MRP2, Pgp
and BCRP. AIDS. 19:2097–2102. 2005. View Article : Google Scholar : PubMed/NCBI
|
|
16
|
Perloff MD, von Moltke LL, Marchand JE and
Greenblatt DJ: Ritonavir induces P-glycoprotein expression,
multidrug resistance-associated protein (MRP1) expression, and drug
transporter-mediated activity in a human intestinal cell line. J
Pharm Sci. 90:1829–1837. 2001. View Article : Google Scholar
|
|
17
|
Perloff ES, Duan SX, Skolnik PR, et al:
Atazanavir: effects on P-Glycoprotein transport and CYP3A
metabolism in vitro. Drug Metab Dispos. 33:764–770. 2005.
View Article : Google Scholar : PubMed/NCBI
|
|
18
|
Huang L, Wring SA, Wooley JL, et al:
Induction of P-glycoprotein and cytochrome P450 3A by HIV protease
inhibitors. Drug Metab Dispos. 29:754–760. 2001.PubMed/NCBI
|
|
19
|
Mukwaya G, MacGregor T, Hoelscher D, et
al: Interaction of ritonavir-boosted tipranavir with loperamide
does not result in loperamideassociated neurologic side effects in
healthy volunteers. Antimicrob Agents Chemother. 49:4903–4910.
2005. View Article : Google Scholar : PubMed/NCBI
|
|
20
|
Gollapudi S and Gupta S: Human
immunodeficiency virus I-induced expression of P-glycoprotein.
Biochem Biophys Res Commun. 171:1002–1007. 1990. View Article : Google Scholar : PubMed/NCBI
|
|
21
|
Antonelli G, Turriziani O, Cianfriglia M,
et al: Resistance of HIV-1 to AZT might also involve the cellular
expression of multidrug resistance P-glycoprotein. AIDS Res Hum
Retroviruses. 8:1839–1844. 1992. View Article : Google Scholar : PubMed/NCBI
|
|
22
|
Weiss J, Rose J, Storch CH, et al:
Modulation of human BCRP (ABCG2) activity by anti-HIV drugs. J
Antimicrob Chemother. 59:238–245. 2007. View Article : Google Scholar : PubMed/NCBI
|
|
23
|
Stormer E, von Moltke LL, Perloff MD and
Greenblatt DJ: Differential modulation of P-glycoprotein expression
and activity by non-nucleoside HIV-1 reverse transcriptase
inhibitors in cell culture. Pharm Res. 19:1038–1045. 2002.
View Article : Google Scholar : PubMed/NCBI
|
|
24
|
Chandler B, Almond L, Ford J, et al: The
effects of protease inhibitors and nonnucleoside reverse
transcriptase inhibitors on P-glycoprotein expression in peripheral
blood mononuclear cells in vitro. J Acquir Immune Defic Syndr.
33:551–556. 2003. View Article : Google Scholar
|
|
25
|
De Maat MMR, Ekhart GC, Huitema ADR, et
al: Drug interactions between antiretroviral drugs and comedicated
agents. Clin Pharmacokinet. 42:223–282. 2003.PubMed/NCBI
|
|
26
|
Sankatsing SU, Beijnen JH, Schinkel AH, et
al: P-glycoprotein in human immunodeficiency virus type 1 infection
and therapy. Antimicrob Agents Chemother. 48:1073–1081. 2004.
View Article : Google Scholar : PubMed/NCBI
|
|
27
|
Andreana A, Aggarwal S, Gollapudi S, et
al: Abnormal expression of a 170-kilodalton P-glycoprotein encoded
by MDR1 gene, a metabolically active efflux pump, in
CD4+ and CD8+ T cells from patients with
human immunodeficiency virus type 1 infection. AIDS Res Hum
Retroviruses. 12:1457–1462. 1996. View Article : Google Scholar : PubMed/NCBI
|
|
28
|
Lucia MB, Cauda R, Landay AL, et al:
Transmembrane P-glycoprotein (P-gp/P-170) in HIV infection:
analysis of lymphocyte surface expression and drug-unrelated
function. AIDS Res Hum Retroviruses. 11:893–901. 1995. View Article : Google Scholar : PubMed/NCBI
|
|
29
|
Ford J, Hoggard PG, Owen A, et al: A
simplified approach to determining P-glycoprotein expression in
peripheral blood mononuclear cell subsets. J Immunol Methods.
274:129–137. 2003. View Article : Google Scholar : PubMed/NCBI
|
|
30
|
Chong AS, Markham PN, Gebel HM, et al:
Diverse multidrug-resistance-modification agents inhibit cytolytic
activity of natural killer cells. Cancer Immunol Immunother.
36:133–139. 1993. View Article : Google Scholar : PubMed/NCBI
|
|
31
|
Ludescher C, Pall G, Irschick EU and Gastl
G: Differential activity of P-glycoprotein in normal blood
lymphocyte subsets. Br J Haematol. 101:722–727. 1998. View Article : Google Scholar : PubMed/NCBI
|
|
32
|
Hayashi K, Pu H, Tian J, et al: HIV-Tat
protein induces P-glycoprotein expression in brain microvascular
endothelial cells. J Neurochem. 93:1231–1241. 2005. View Article : Google Scholar : PubMed/NCBI
|
|
33
|
Jorajuria S, Dereuddre-Bosquet N,
Naissant-Storck K, et al: Differential expression levels of MRP1,
MRP4, and MRP5 in response to human immunodeficiency virus
infection in human macrophages. Antimicrob Agents Chemother.
48:1889–1891. 2004. View Article : Google Scholar : PubMed/NCBI
|
|
34
|
Turriziani O, Gianotti N, Falasca F, et
al: Expression levels of MDR1, MRP1, MRP4, and MRP5 in peripheral
blood mononuclear cells from HIV infected patients failing
antiretroviral therapy. J Med Virol. 80:766–771. 2008. View Article : Google Scholar : PubMed/NCBI
|
|
35
|
Klimecki WT, Futscher BW, Grogan TM and
Dalton WS: P-glycoprotein expression and function in circulating
blood cells from normal volunteers. Blood. 83:2451–2458.
1994.PubMed/NCBI
|
|
36
|
Raviv Y, Puri A and Blumenthal R:
P-glycoprotein-overexpressing multidrug-resistant cells are
resistant to infection by enveloped viruses that enter via the
plasma membrane. FASEB J. 14:511–515. 2000.
|
|
37
|
Lee CG, Ramachandra M, Jeang KT, et al:
Effect of ABC transporters on HIV-1 infection: inhibition of virus
production by the MDR1 transporter. FASEB J. 14:516–522.
2000.PubMed/NCBI
|
|
38
|
Speck RR, Yu XF, Hildreth J and Flexner C:
Differential effects of p-glycoprotein and multidrug resistance
protein-1 on productive human immunodeficiency virus infection. J
Infect Dis. 186:332–340. 2002. View
Article : Google Scholar : PubMed/NCBI
|