Introduction
Pregnancies with a macrosomic fetus comprise a
subgroup of high-risk pregnancies, which have been variously
defined as pregancies in which the birth weight of the newborn is
greater than 4,000, 4,500 or 5,000 g, while this fails to take
gestational age and gender into consideration (1,2).
Another definition of macrosomia as a birth weight >90th
percentile for gestation or >97.75th percentile of a reference
population corrected for gestational age and gender has been
proposed. However, in light of the substantially increased adverse
birth outcomes associated with a birth weight > 4,500 g, as well
as its ease of use, this definition has been widely adopted
(3,4). Maternal obesity, impaired glucose
tolerance and gestational diabetes contribute to infant macrosomia;
furthermore, the risk is higher in aboriginal populations (5–7).
Macrosomia affects 50% of pregnancies complicated by maternal
diabetes (8,9). It is also associated with problems
at birth and has life-long health implications for the infant,
including an increased risk of developing cardiovascular disease
and diabetes in adulthood (10–12). Although the incidence of
macrosomia is high amongst women with diabetes, there is currently
no reliable method to predict who will deliver macrosomic infants.
Understanding the factors that affect this placental growth is
essential for the development of novel therapies. The study of
circulating nucleic acid in maternal plasma may provide solutions
for determining the development of macrosomia; for example, fetal
macrosomia in pregnancies complicated by diabetes has been shown to
accompany an increase in the levels of fetal deoxyribonucleic acid
(DNA) and proteins in animal model systems (13).
MicroRNAs (miRNAs or miRs) are newly identified
molecules that are common 18–25 nucleotide-long, non-coding RNA
molecules that post-transcriptionally regulate gene expression by
base-pairing with the 3′ untranslated region of complementary
messenger RNA targets. miRNAs have been identified in animal cells
and have been reported to play a role in numerous vital processes,
including embryonic development, cellular differentiation and
proliferation and apoptosis (14,15). They are produced in cells and
tissues and have also been detected in the circulation recently.
The aberrant expression of miRNAs has been associated with disease
development and the recent discovery of miRNAs in serum and plasma
has stimulated interest in their potential for use as circulating
biomarkers (16). There is an
increasing number of publications describing circulating miRNA
biomarkers of breast, colon, gastric, lung, oral, ovarian,
pancreatic, prostate, tongue and squamous cell cancers (17), stroke and neurological disorders
(18), diabetes, heart failure
and lupus erythematosus (19,20). Plasma/serum miRNA biomarkers have
the advantage of stabilization and relative abundance, and their
small size and consistent structure enables the application of
quantitative multiplex assays using quantitative polymerase chain
reaction (qPCR).
Circulating miRNA profiles or ‘signatures’ are
altered in several disease states; thus, they are effective tools
for the diagnosis and prognosis of diseases, including
cardiovascular disease (21) and
different forms of cancer (22–24). Establishing the plasma miRNA
signature of pregnant women may therefore provide a non-invasive
method for predicting fetal macrosomia.
In this study, we used TaqMan Low-Density Arrays
(TLDAs) and reverse transcription qPCR (RT-qPCR) to profile the
plasma miRNAs differentially expressed in pregnant women with fetal
macrosomia and women with normal pregnancies as the controls, and
explored the potency of plasma miRNA expression profiles as an
early diagnostic biomarker for fetal macrosomia.
Materials and methods
Sample collection and processing
Peripheral blood samples from 45 pregnant women
collected during their second trimester (18–28 weeks of gestational
age) were selected; the neonates of these women were later
diagnosed with macrosomia at delivery. Another 30 samples from
women with normal healthy pregnancies were collected during the
same trimester as the controls. Furthermore, an additional 16
samples from pregnant women with preeclampsia at their second
gestational ages (22–28 weeks) were also collected for differential
diagnosis by qPCR (some of them were later diagnosed with
preeclampsia). All the samples were recruited from Zhongda
Hospital, Southeast University (Nanjing, China) and Wuxi Maternity
and Child Health Care Hospital (Wuxi, China) between November 2011
and July 2013. Among the collected samples, 10 samples from
pregnant women with fetal macrosomia and 10 samples from women with
normal pregnancies (control) were selected and pooled as samples
for use in TLDAs. Samples from 35 pregnant women with fetal
macrosomia and from 20 women with normal pregnancies were used in
RT-qPCR for validation of the array data. Although there is no
consensus on the definition of fetal macrosomia, in light of the
substantially increased adverse birth outcomes associated with a
birth weight >4,500 g, as well as its ease of use, this
definition has been widely adopted (4). In the present study, the diagnosis
of macrosomia was in accordance with this standard. This study was
approved by the Ethics Committee of Zhongda Hospital, Southeast
University and written informed consent was obtained from all the
pregnant women prior to participation.
EDTA blood was centrifuged at 1,600 × g for 10 min
at 4°C, and plasma was transferred to new tubes followed by further
centrifugation at 16,000 × g for 10 min at 4°C. The separated
plasma samples were subjected to RNA isolation or placed in a −80°C
freezer for short-term storage. Two plasma pools of the macrosomia
and control groups were created by combining 10 samples (50 μl of
sample) and mixing by inversion and 500 μl of each of these pools
were used to extract RNA for TLDAs.
RNA extraction
Total RNA containing small RNA was extracted from
500 ml of plasma using TRIzol® LS Reagent (Invitrogen,
Carlsbad, CA, USA) and the miRNeasy Mini kit (Qiagen, Hilden,
Germany) with some modifications according to Ng’s report (25). Briefly, TRIzol LS Reagent was
added to the plasma samples in volumetric ratios as previously
described (26). Following phase
separation by the addition of chloroform and centrifugation, 1.5
vol of 100% ethanol was added to the aqueous phase, and the mixture
was loaded onto the miRNeasy column (Qiagen) according to the
manufacturer’s instructions. The final elution volume was 30 μl.
The concentrations of all RNA samples were quantified using the
Qubit® RNA HS Assay kit with the Qubit 2.0 fluorometer
(Life Technologies, Grand Island, NY, USA) according to the
manufacturer’s instructions. The concentration of the RNA extracted
from the plasma ranged from 3.68 to 53.84 ng/ml.
miRNA profiling using TLDAs
The ABI TaqMan miRNA Low-Density Arrays (Applied
Biosystems, Foster City, CA, USA) were selected as the platform for
global miRNA expression profiling. Approximately 500 ng of total
RNA was reverse transcribed into complementary DNA (cDNA) using the
TaqMan microRNA reverse transcription kit and the miRNA Megaplex™
RT pool set A and B, a set of 2 pre-defined pools of up to 380
stem-loop RT primers per pool that enable the simultaneous
synthesis of cDNA for mature miRNAs. The cDNA products were loaded
onto TaqMan Human microRNA A + B Cards Set version 3.0, enabling
the simultaneous quantification of 754 human miRNAs. TLDAs were
performed on the ABI 7900HT Instrument (Applied Biosystems).
Normalization was performed with the small nuclear RNAs (snRNAs)
U44, U48 and U6. Quantitative miRNA expression data were acquired
and normalized using ABI 7900HT SDS software (Applied
Biosystems).
RT-qPCR
RT-qPCR was used to detect and quantify individual
miRNAs on real-time PCR instruments, ABI 7500 (Life Technologies).
cDNA was synthesized from total RNA using specific stem-loop
primers according to the miRNA reverse transcription protocol. The
20-μl PCR reaction mixture included 2 μl of RT product, 10 μl of
SYBR® Premix Ex Taq™ PCR master mix (2X concentration),
1 μl of the forward and reverse primers each and 6 μl of
nuclease-free water. The primer sequences are presented in Table I. The reactions were carried out
with a 10-min incubation at 95°C followed by 40 cycles of 95°C for
15 sec and 60°C for 1 min. All reactions were run in triplicate,
and the average threshold cycle and SD values were calculated. The
CT value is defined as the fractional cycle number at which the
fluorescence exceeds the defined threshold. The data were analyzed
with automatic settings for assigning the baseline. U6 snRNA levels
were used as an internal normalization control and the expression
level of the miRNAs was calculated using the ΔΔCT method.
 | Table IDNA sequences of the primers used for
RT-qPCR. |
Table I
DNA sequences of the primers used for
RT-qPCR.
| Name | DNA sequence
(5′→3′) |
|---|
| miR-451a-RT
primer |
GTCGTATCCAGTGCAGGGTCCGAGGTATTCGCACTGGATACGACAACTCA |
| miR-451a-Forward
primer |
GAAACCGTTACCATTACTGAG |
| miR-16-5p-RT
primer |
GTCGTATCCAGTGCAGGGTCCGAGGTATTCGCACTGGATACGACCGCCAA |
| miR-16-5p-Forward
primer |
GTAGCAGCACGTAAATATTGGC |
| miR-181a-5p-RT
primer |
GTCGTATCCAGTGCAGGGTCCGAGGTATTCGCACTGGATACGACACTCAC |
| miR-181a-5p-Forward
primer |
GAACATTCAACGCTGTCGGTGA |
| miR-661-RT
primer |
GTCGTATCCAGTGCAGGGTCCGAGGTATTCGCACTGGATACGACACGCGC |
| miR-661-Forward
primer |
GTGCCTGGGTCTCTGGCCTGCG |
| miR-200c-3p-RT
primer |
GTCGTATCCAGTGCAGGGTCCGAGGTATTCGCACTGGATACGACTCCATC |
| miR-200c-3p-Forward
primer |
GTAATACTGCCGGGTAATGATG |
| miR-221-3p-RT
primer |
GTCGTATCCAGTGCAGGGTCCGAGGTATTCGCACTGGATACGACGAAACC |
| miR-221-3p-Forward
primer |
GAGCTACATTGTCTGCTGGGT |
| miR-143-3p-RT
primer |
GTCGTATCCAGTGCAGGGTCCGAGGTATTCGCACTGGATACGACGAGCTA |
| miR-143-3p-Forward
primer |
GTGAGATGAAGCACTGTAGC |
| miR-141-3p-RT
primer |
GTCGTATCCAGTGCAGGGTCCGAGGTATTCGCACTGGATACGACCCATCT |
| miR-141-3p-Forward
primer |
GTAACACTGTCTGGTAAAGATG |
| miR-18a-5p-RT
primer |
GTCGTATCCAGTGCAGGGTCCGAGGTATTCGCACTGGATACGACCTATCT |
| miR-18a-5p-Forward
primer |
GTAAGGTGCATCTAGTGCAGA |
| miR-523-3p-RT
primer |
GTCGTATCCAGTGCAGGGTCCGAGGTATTCGCACTGGATACGACACCCTC |
| miR-523-3p-Forward
primer |
GGAACGCGCTTCCCTATAGAGG |
| miR-125a-3p-RT
primer |
GTCGTATCCAGTGCAGGGTCCGAGGTATTCGCACTGGATACGACGGCTCC |
| miR-125a-3p-Forward
primer |
GACAGGTGAGGTTCTTGGGAG |
| miR-30a-3p-RT
primer |
GTCGTATCCAGTGCAGGGTCCGAGGTATTCGCACTGGATACGACGCTGCA |
| miR-30a-3p-Forward
primer |
GCTTTCAGTCGGATGTTTGCA |
| Universal Reverse
primer |
GTGCAGGGTCCGAGGT |
| U6-RT primer |
AACGCTTCACGAATTTGCGT |
| U6-Forward
primer |
CTCGCTTCGGCAGCACA |
| U6-Reverse
primer |
AACGCTTCACGAATTTGCGT |
Statistical analysis
For RT-qPCR data, the relative expression levels of
each target miRNA (Log2 relative level) were calculated according
to the difference in CT values between the target miRNAs and U6
snRNA (ΔCT). CT values <35 were indicative of expression.
Statistical analysis was performed using SPSS software version 16.0
(SPSS, Inc., Chicago, IL, USA) and GraphPad Prism 5 (GraphPad
Software Inc., La Jolla, CA, USA). A P-value <0.05 was
considered to indicate a statistically significant difference
(Student’s t-test). For individual differentially expressed miRNAs,
a receiver operating characteristic (ROC) curve was generated. The
area under the curve (AUC) and 95% confidence intervals (CI) were
calculated to determine the specificity and sensitivity of the
miRNAs to predict fetal macrosomia.
Results
Demographics
The maternal characteristics are shown in Table II. The maternal age and
pre-gestational body mass index (BMI) of the macrosomia group were
higher than of those of the control group, and some women had a
family history of hypertension and/or previous abortion; these data
were consistent with those previous reported (27). No significant differences in
gestational weight gain (GWG) were found between the pregnant women
with fetal macrosomia and the women with normal pregnancies
(controls) in this study. The maternal characteristics were
consistent between the samples used for TLDAs and RT-qPCR.
| Table IIEpidemiological characteristics of
pregnant women with fetal macrosomia and healthy controls. |
Table II
Epidemiological characteristics of
pregnant women with fetal macrosomia and healthy controls.
| TLDA | qPCR
validation |
|---|
|
|
|
|---|
| Case | Control | P-value | Case | Control | P-value |
|---|
| Number of
samples | 10 | 10 | - | 35 | 20 | - |
| Maternal age
(years) | 28.34±4.67 | 25.31±3.41 | <0.001 | 28.53±5.18 | 25.27±3.82 | <0.001 |
| BMI
(kg/m2) | 22.64±2.38 | 19.58±2.32 | <0.001 | 22.75±2.72 | 19.41±1.74 | <0.001 |
| Previous abortion
(%) | 0 | 0 | - | 1.5% | 0 | - |
| Nulliparous | 90.0% | 100% | - | 82.7% | 94.0% | - |
| Family history of
hypertension and diabetes | 19% | 0 | 21% | 0 | - | |
| Birth weight
(kg) | 4.87±0.43 | 3.27±0.41 | <0.001 | 4.70±0.40 | 3.22±0.32 | <0.001 |
| GWG (kg) | 15.56±4.3 | 14.18±4.26 | 0.456 | 15.42±4.6 | 14.23±4.14 | 0.492 |
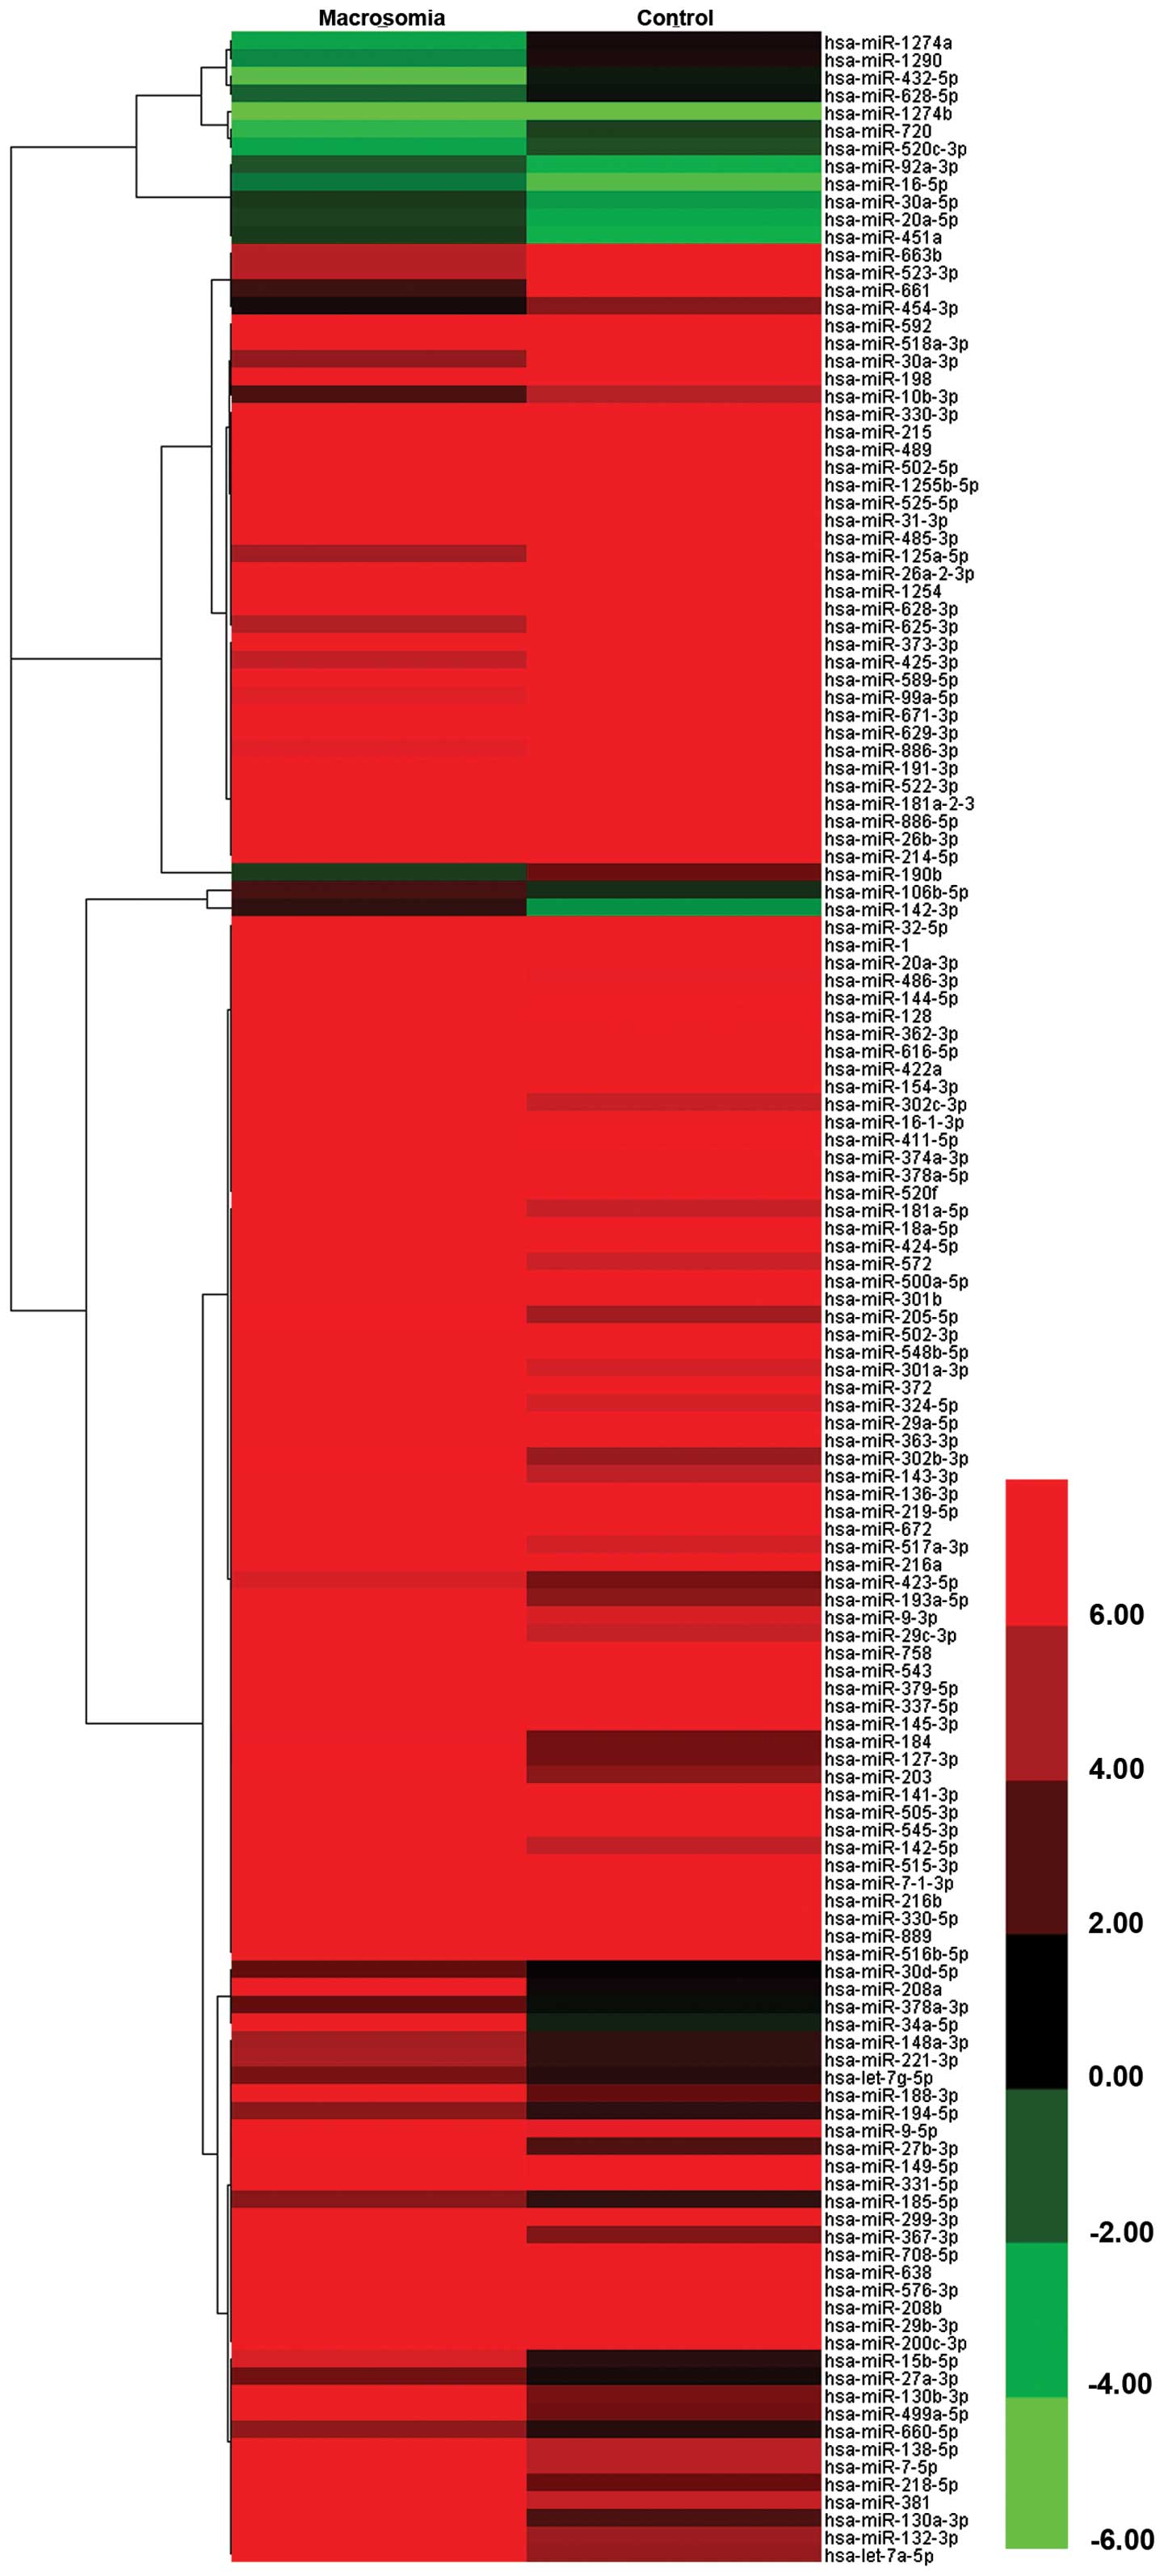
miRNA expression profiling of plasma in
pregnancies with fetal macrosomia by TLDA
TaqMan Human miRNA Low-Density Array analysis was
performed to identify circulating miRNAs exhibiting altered levels
in pregnant women with fetal macrosomia, and plasma miRNAs were
compared with the normal pregnancy controls. A total of 274 miRNAs
incorporated in the array were detected; among these, 196 miRNAs
were co-expressed; 223 and 248 miRNAs were detected in the plasma
in pregnancies with fetal macrosomia and the healthy controls,
respectively. To identify macrosomia-specific candidate miRNAs, the
differential expression of miRNAs between the 2 groups was required
to meet 2 criteria: i) CT values <35 to enable reliable
detection; and ii) miRNA levels exhibiting ≥4-fold difference (ΔΔCT
≥2 or ΔΔCT ≤-2) between the macrosomia and control groups. A total
of 143 miRNAs met these criteria, 43 of which were upregulated and
100 were downregulated in the pregnant women with fetal macrosomia
compared with the normal pregnancy controls (Fig. 1). The top 20 differentially
expressed miRNAs are listed in Table III.
| Table IIITop 20 differentially expressed
miRNAs between pregnant women with fetal macrosomia and normal
controls. |
Table III
Top 20 differentially expressed
miRNAs between pregnant women with fetal macrosomia and normal
controls.
| Upregulated in case
group compared with control | ΔΔCT | Downregulated in
case group compared with control | ΔΔCT |
|---|
| hsa-miR-661 | −15.1039 | hsa-miR-34a-5p | 17.00549 |
| hsa-miR-663b | −12.3943 | hsa-miR-208a | 16.0467 |
| hsa-miR-523-3p | −12.2455 |
hsa-miR-499a-5p | 13.6248 |
| hsa-miR-198 | −9.74231 |
hsa-miR-130b-3p | 13.47667 |
| hsa-miR-592 | −8.84758 | hsa-let-7a-5p | 12.7783 |
|
hsa-miR-518a-3p | −8.50963 | hsa-miR-132-3p | 12.6045 |
| hsa-miR-330-3p | −7.40832 | hsa-miR-138-5p | 11.94246 |
| hsa-miR-502-5p | −7.13427 | hsa-miR-7-5p | 11.74449 |
| hsa-miR-215 | −6.94627 | hsa-miR-381 | 11.6779 |
| hsa-miR-489 | −6.88626 | hsa-miR-9-5p | 10.87772 |
| hsa-miR-485-3p | −6.44884 | hsa-miR-331-5p | 10.59712 |
| hsa-miR-525-5p | −6.27043 | hsa-miR-149-5p | 10.59156 |
|
hsa-miR-26a-2-3p | −6.12089 | hsa-miR-299-3p | 10.18141 |
| hsa-miR-1254 | −5.94441 | hsa-miR-708-5p | 9.921302 |
| hsa-miR-373-3p | −5.61778 |
hsa-miR-200c-3p | 9.433656 |
|
hsa-miR-1255b-5p | −5.3922 | hsa-miR-29b-3p | 9.103284 |
| hsa-miR-432-5p | −5.14086 | hsa-miR-208b | 8.918743 |
| hsa-miR-31-3p | −5.04041 | hsa-miR-576-3p | 8.858621 |
| hsa-miR-589-5p | −4.83138 | hsa-miR-638 | 8.628476 |
| hsa-miR-1274a | −4.30028 | hsa-miR-545-3p | 8.504154 |
Among these differentially expressed miRNAs between
the pregnant women with fetal macrosomia and the normal pregnancy
controls, 12 miRNAs were selected for further analysis according to
TLDA results and the reults of previous reports studies (28–30). Four selected miRNAs (miR-661,
miR-523-3p, miR-125a-5p and miR-30a-3p) were upregulated and 8
miRNAs were downregulated (miR-181a-5p, miR-200c-3p, miR-143-3p,
miR-221-3p, miR-16-5p, miR-141-3p, miR-18a-5p and miR-451a), which
contained not only significantly differentially expressed miRNAs,
but also moderately differentially expressed miRNAs. Among these,
miR-661, miR-523-3p, miR-200c-3p and miR-141-3p were significantly
differentially expressed, while the other miRNAs were moderately
differentially expressed; the majority of these miRNAs are related
to obesity (miR-143-3p, miR-221-3p, miR-125a-5p, miR-16-5p
(28-30) and cancer (miR-141-3p, miR-181a-5p,
miR-18a-5p, miR-30a-3p) (31).
miR-451a was highly abundant in red blood cells. It is also the
most abundant miRNA in the sequencing data of our previously
published study on abormal pregnacy (32).
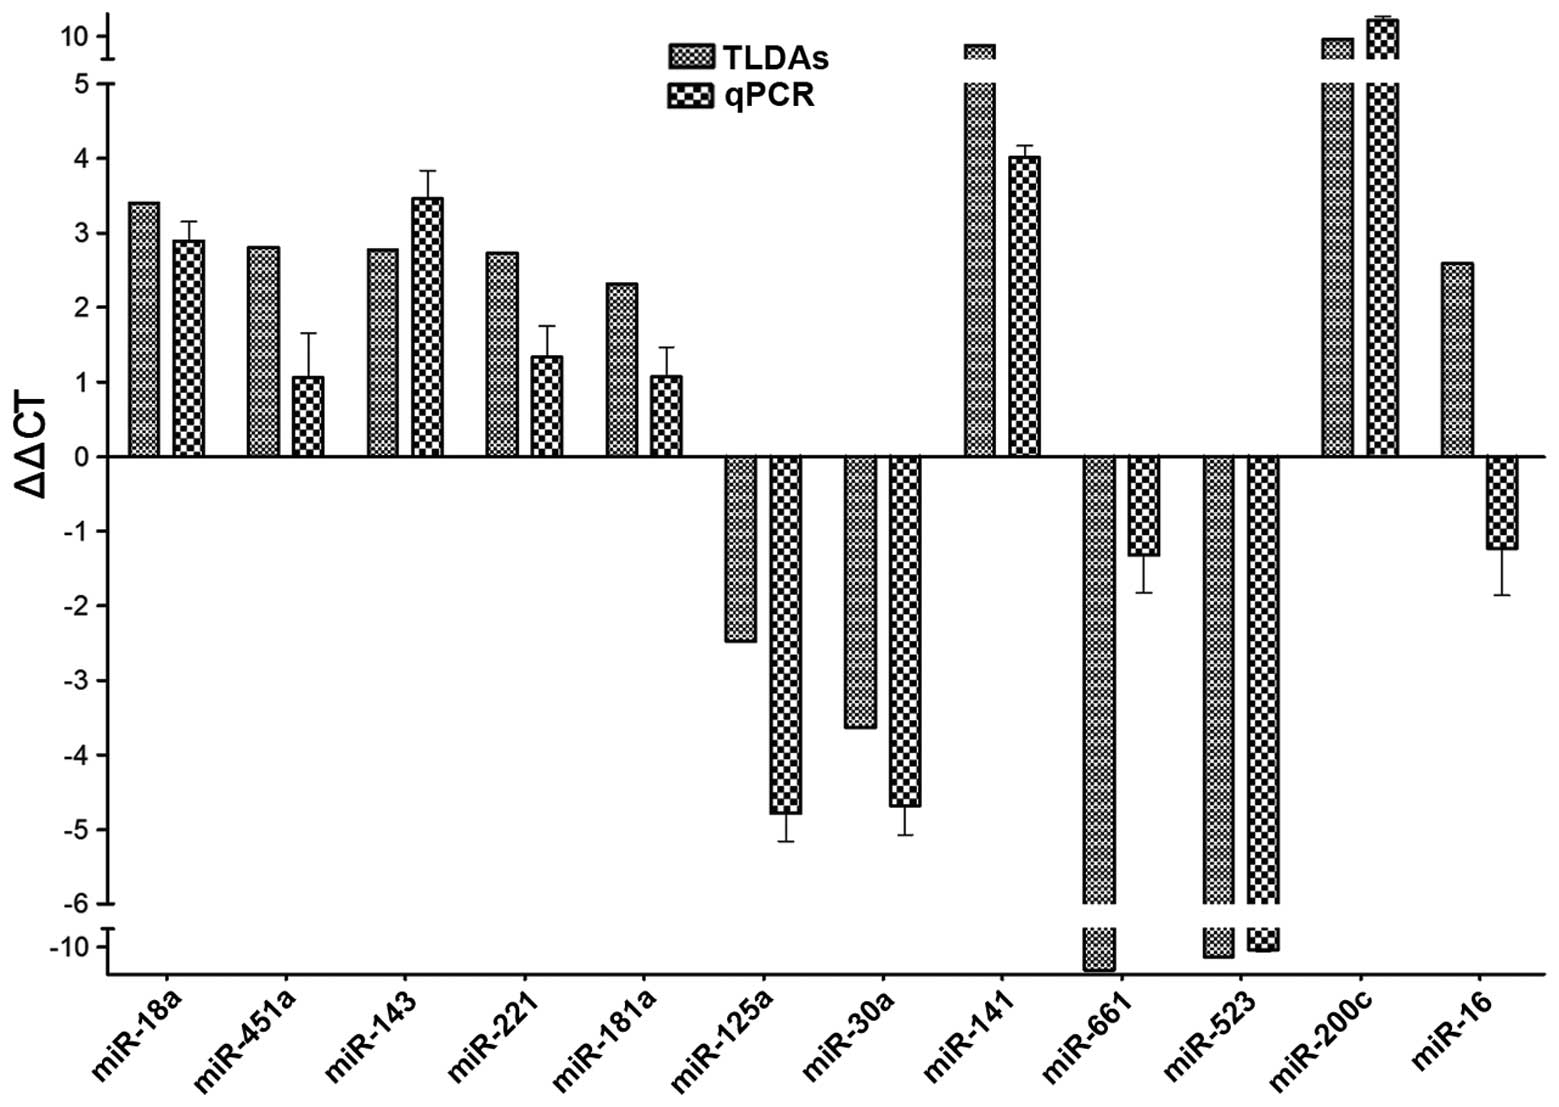
Fig. 2 shows the
qPCR confirmation results, which indicated that the differential
expression obtained in the majority of the selected miRNAs between
pregnant women with fetal macrosomia and the normal controls were
consistent. The results confirmed the upregulated miRNAs,
miR-523-3p, miR-125a-5p, miR-30a-3p and miR-661; and miR-221-3p,
miR-451a, miR-143-3p, miR-18a-5p, miR-141-3p, miR-181a-5p and
miR-200c-3p were confirmed as downregulated miRNAs in the plasma
from pregnant women with macrosomia, while opposite results were
obtained by RT-qPCR as regards miR-16-5p when compared with the
TLDA results.
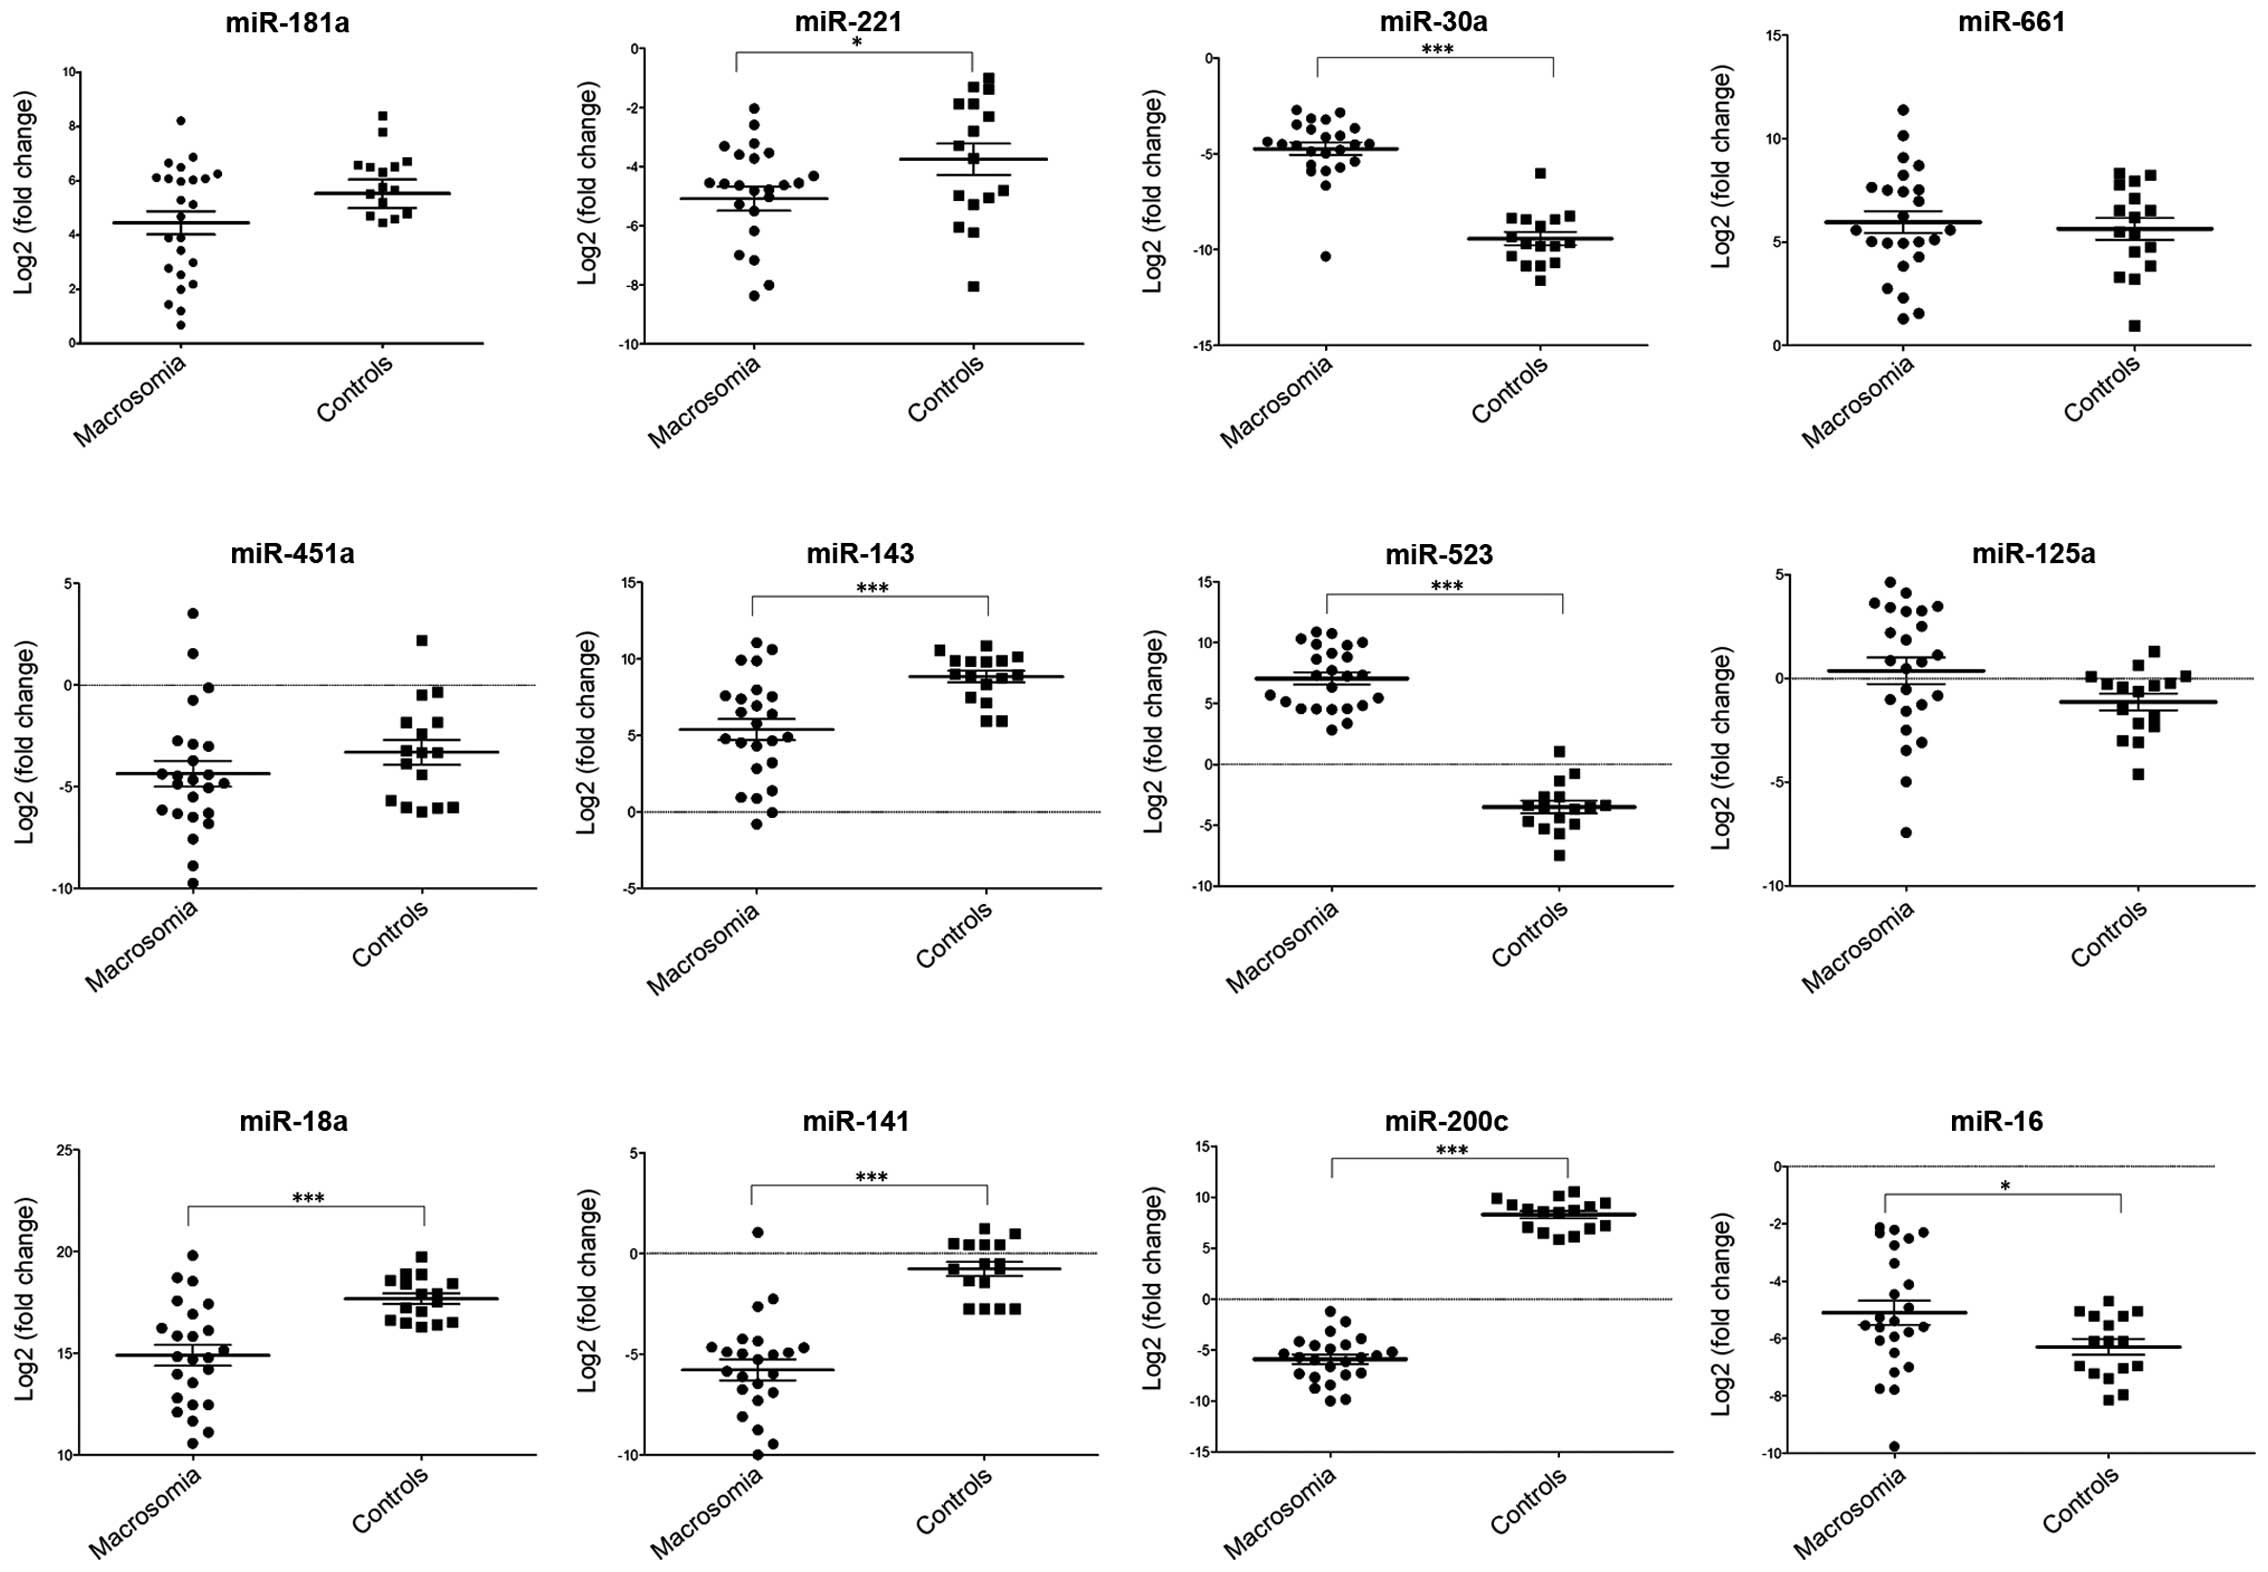
RT-qPCR of miRNA expression in plasma
from pregnant women with fetal macrosomia
The majority of the miRNAs selected for verification
were confirmed and quantified by RT-qPCR. Although no reliable
endogenous control miRNA has been identified in studying
circulating miRNAs (33,34), U6 snRNA is still the most common
choice. Therefore, we used U6 snRNA as the endogenous control in
this study and the expression levels of the miRNAs were normalized
to U6 snRNA [Log2 (fold change)]. The expression levels of
miR-221-3p, miR-143-3p, miR-18a-5p, miR-141-3p and miR-200c-3p were
significantly lower in the plasma from women with fetal macrosomia
compared with the normal controls (P<0.001, P<0.05, t-test).
The levels of miR-523-3p, miR-30a-3p and miR-16-5p were
significantly higher in the plasma from pregnant women with fetal
macrosomia, while no significant differences were detected in the
expression levels of miR-181a-5p, miR-661, miR125a and miR-451a.
The results are shown in Fig.
3.
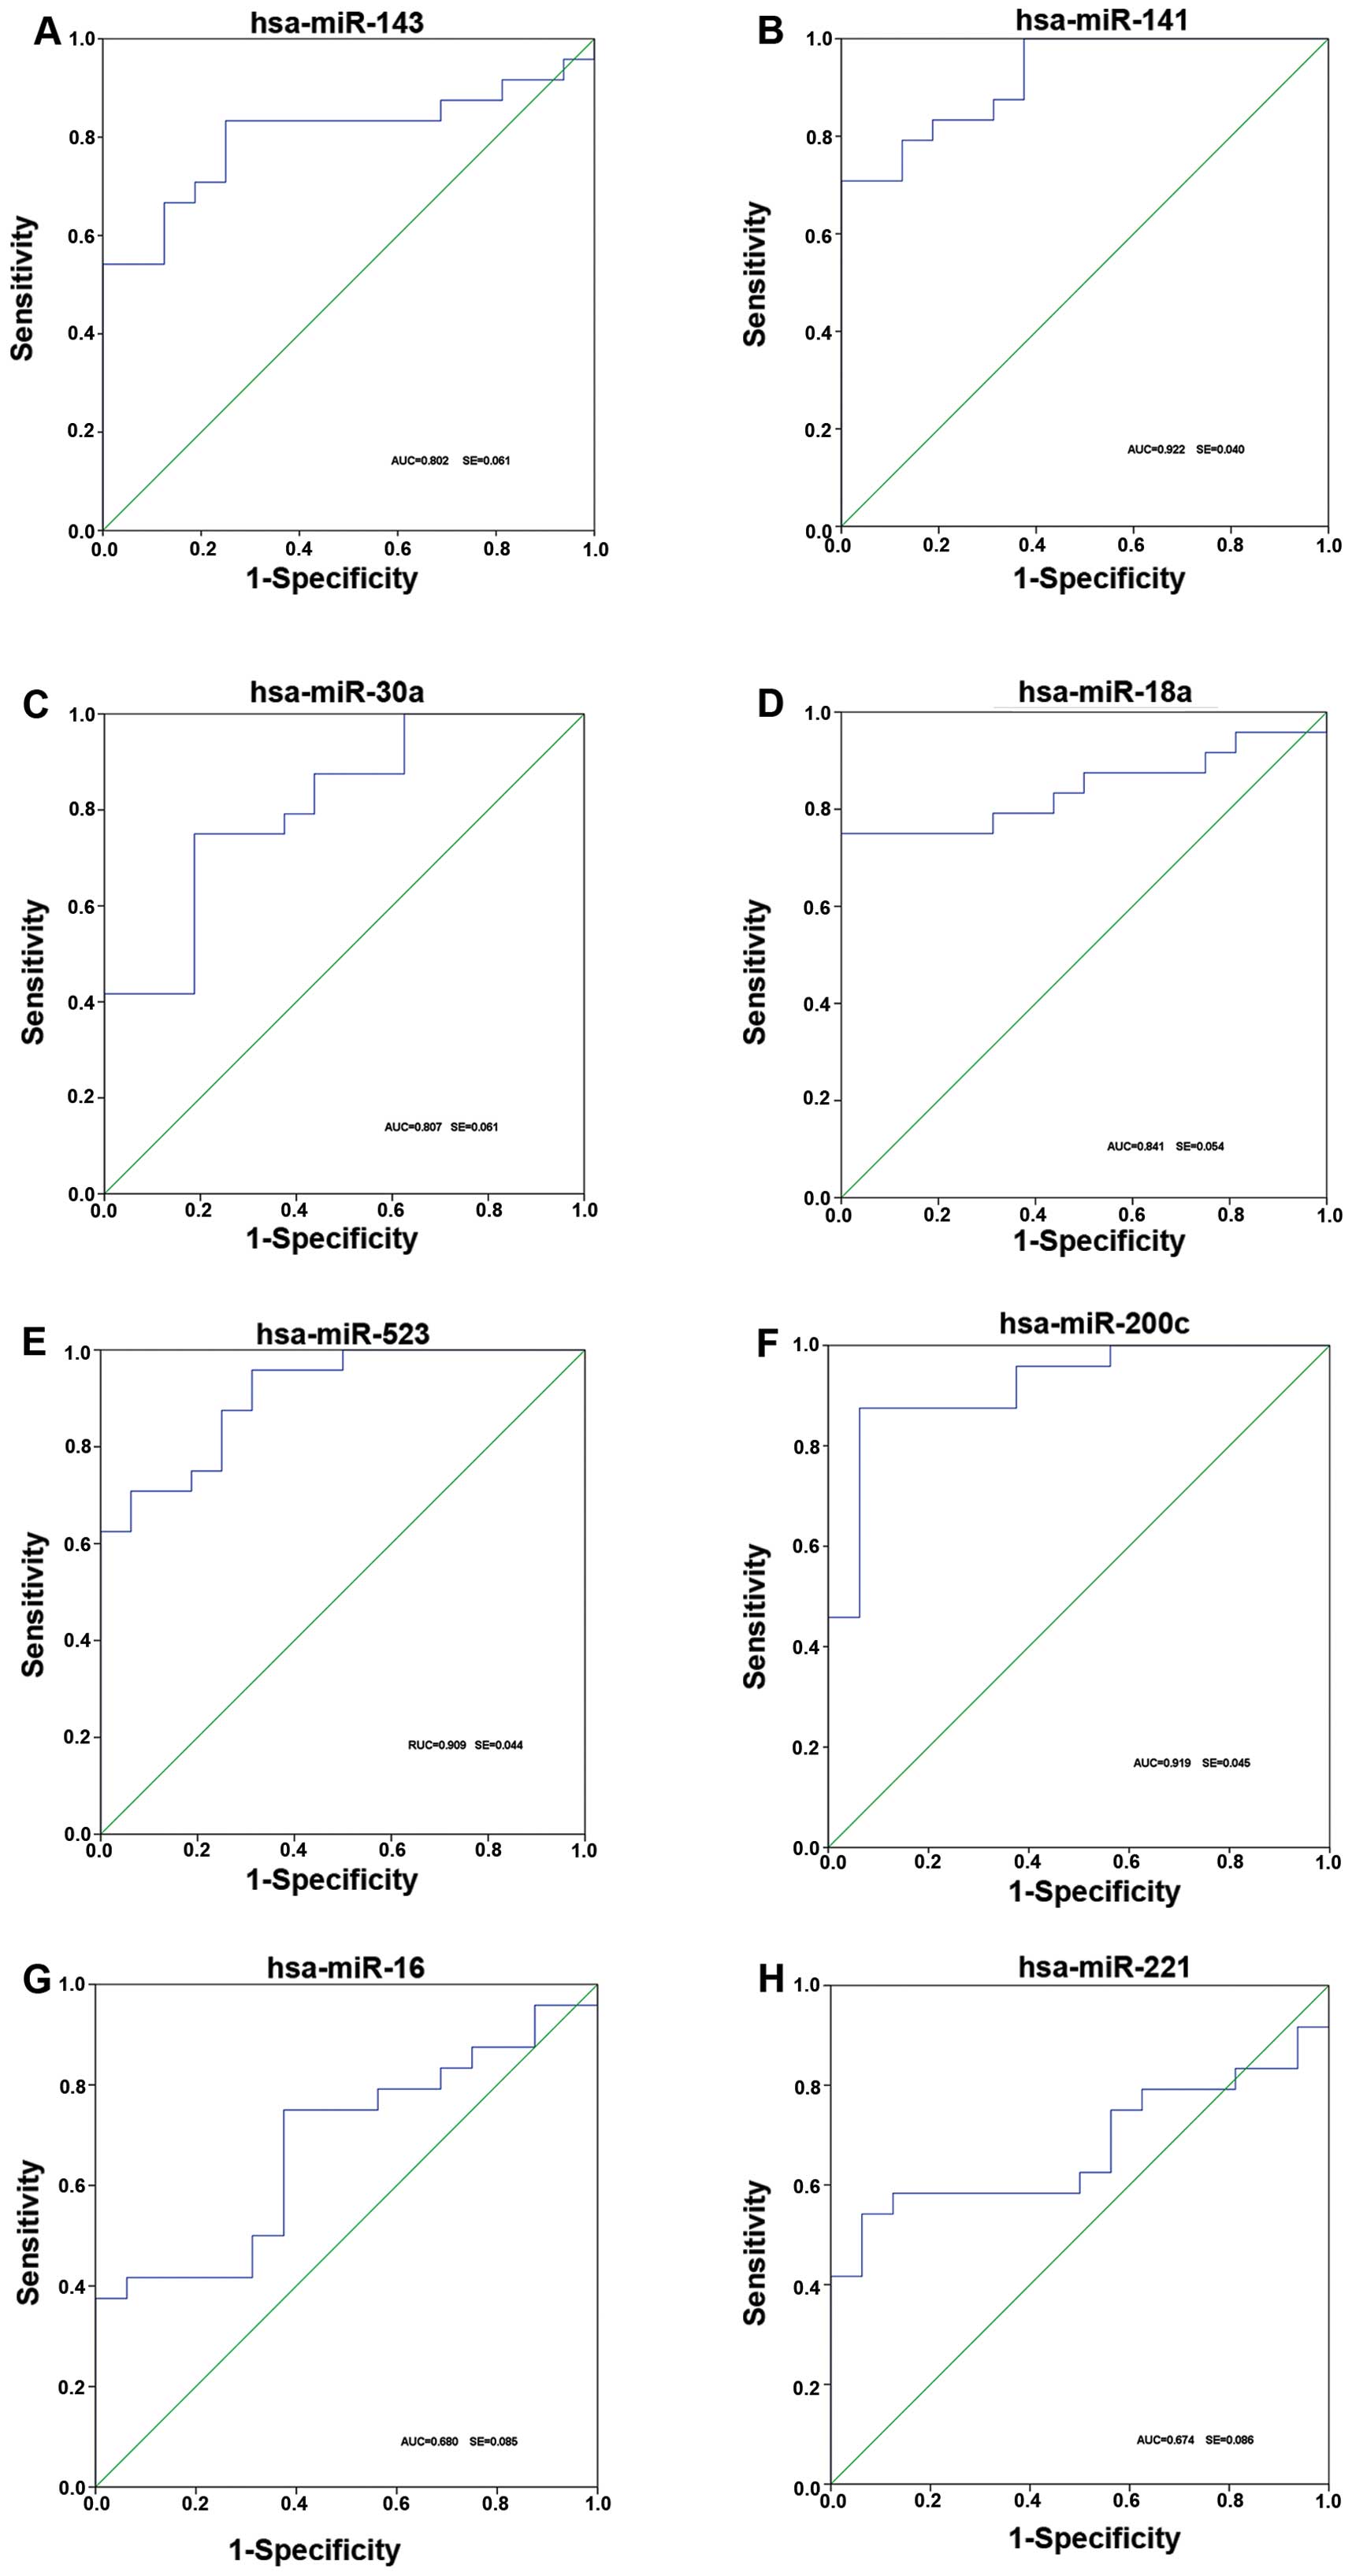
Evaluation of the diagnostic potential of
miRNAs for fetal macrosomia
To investigate the characteristics of these miRNAs
as potential diagnostic biomarkers of fetal macrosomia, ROC curve
analysis was performed on the miRNAs exhibiting significant
differences in expression. The ROC curves of miR-30a-3p, miR-143-3p
and miR-18a-5p exhibited a moderate distinguishing efficiency with
an AUC value of 0.807 (95% CI), 0.802 (95% CI) and 0.841 (95% CI),
respectively (Fig. 4A, C and D).
miR-221-5p and miR-16-5p showed a relatively lower distinguishing
efficiency with an AUC value of 0.680 (95% CI) and 0.674 (95% CI)
(Fig. 4G and H), while
miR-523-3p, miR200c and miR141 exhibited a higher distinguishing
efficiency with an AUC value of 0.909 (95% CI), 0.948 (95% CI) and
0.940 (95% CI), respectively, which reflected a marked difference
between the pregnant women with fetal macrosomia and those with
normal pregnancy (controls) (Fig. 4B,
E and F).
To verify the specificity of the miRNAs for fetal
macrosomia, the 3 miRNAs with higher distinguishing efficiency from
the plasma pools of abnormal pregnancy due to preeclampsia were
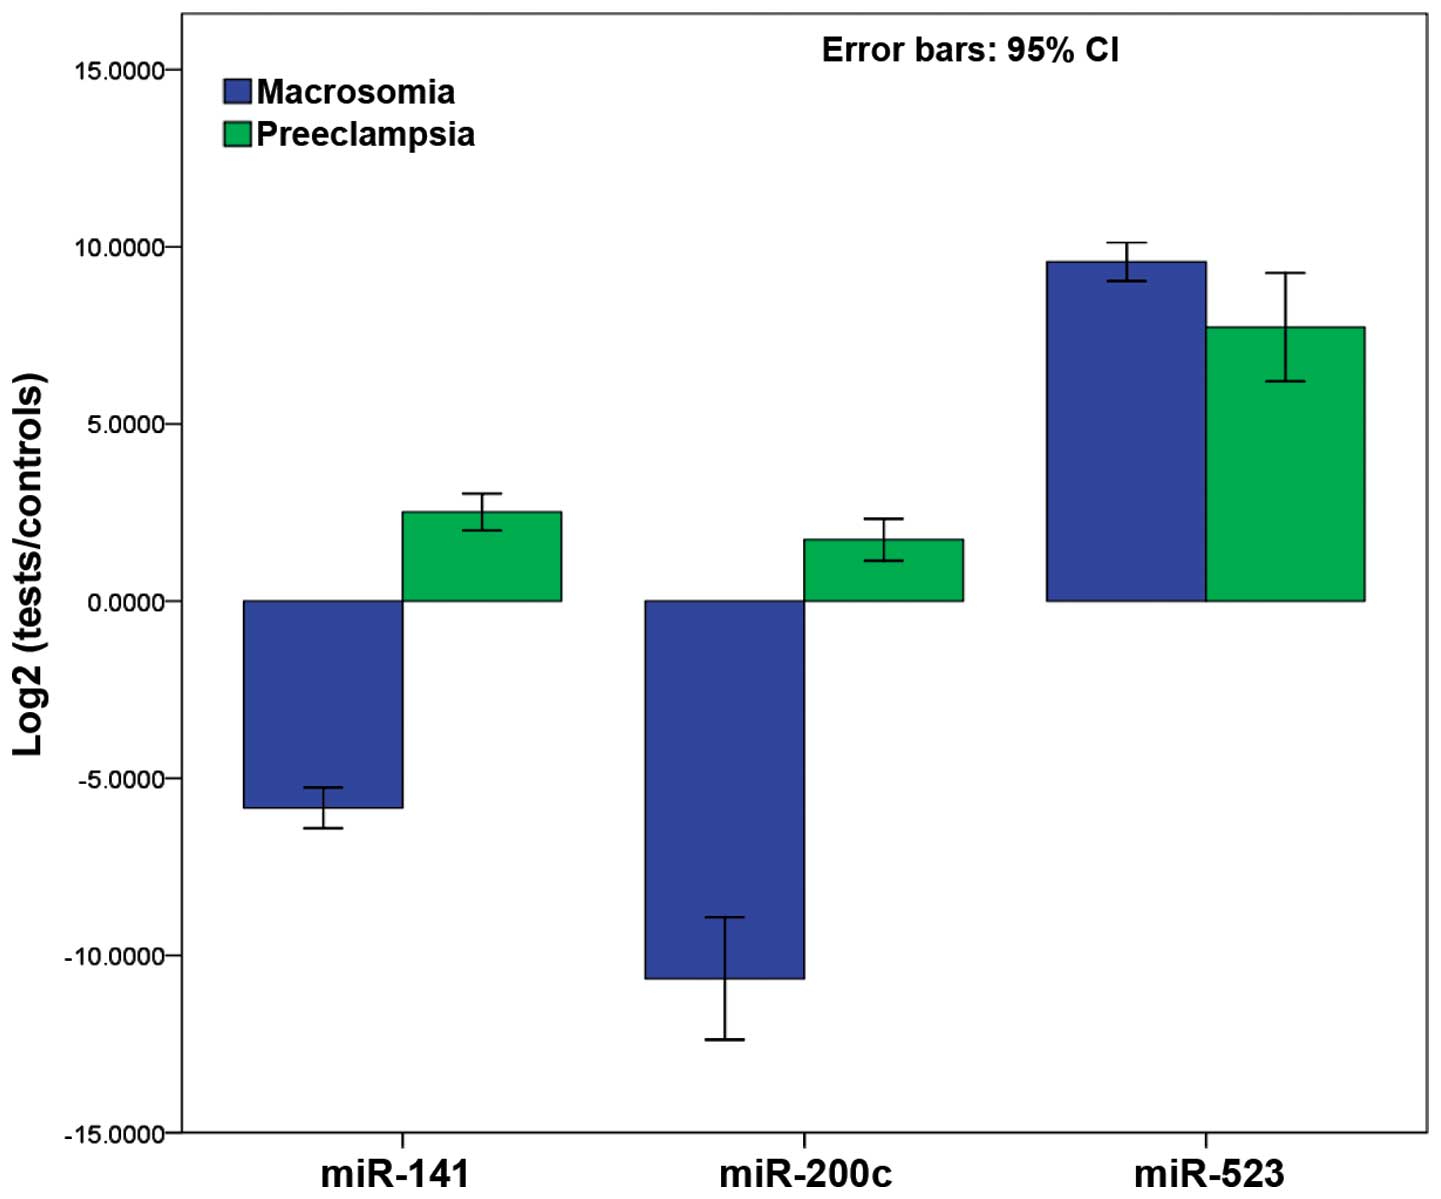
also detected. Fig. 5 shows the
results of the comparison between pregnant women with fetal
macrosomia and pregnant women with preeclampsia. More specifically,
miR-141-3p and miR-200c-3p showed significant differences, whereas
no significant differences were observed for miR-523-3p (P=0.076).
All 3 miRNAs were found to be upregulated in the pregnant women
with preeclampsia, while miR-141-3p and miR-200c-3p were
downregulated in the pregnant women with fetal macrosomia.
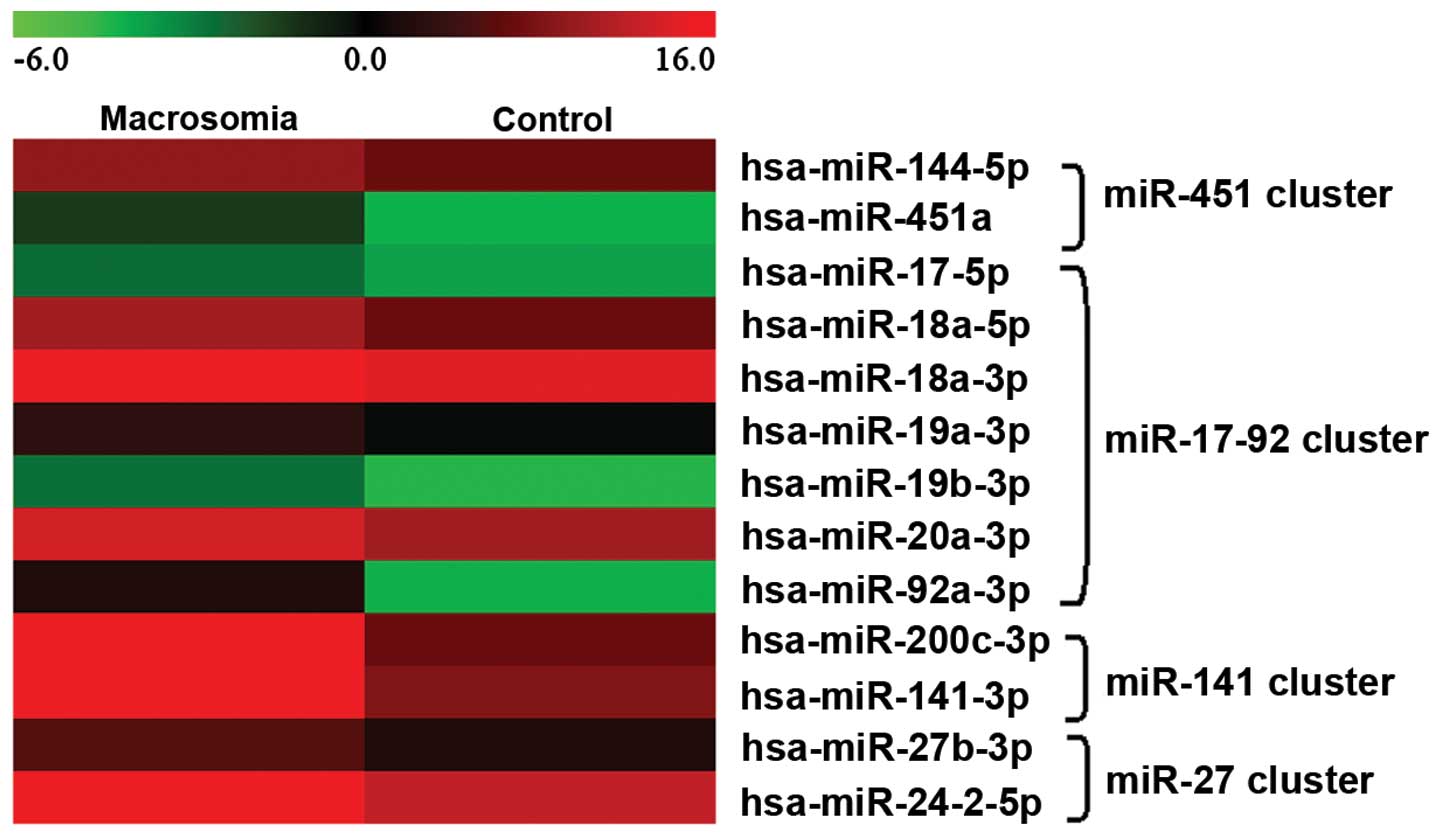
Four miRNA clusters were found to be differentially
expressed in the maternal plasma of pregnant women with fetal
macrosomia. A comparison of their expression levels indicated that
the expression levels of the cluster members changed with a similar
trend (Fig. 6). The results of
ROC curve analysis revealed that the combination of the miRNA
cluster members showed greater sensitivity and specificity. This
suggested that the combination of the miRNA cluster members showed
greater distinguishing efficiency for the diagnosis of fetal
macrosomia. Furthermore, ROC curve analysis showed greater
distinguishing efficiency when the miRNAs were combined with BMI
and GWG (data not shown).
Effect of pre-pregnancy BMI and GWG on
fetal macrosomia
In this study, the effects of BMI and GWG on fetal
macrosomia were also investigated. BMI is a measure of relative
weight based on an individual’s mass and height, and has been
reported to be related to obesity, diabetes mellitus, etc. The
question addressed in the present study was whether a woman’s
aberrant BMI level is associated with a greater risk of delivering
an overweight newborn. Significant birth weight differences were
found between the pregnant women with different BMIs (P<0.001),
particularly those with a BMI >25 or BMI <18. GWG is another
relevant factor that may be associated with fetal macrosomia. In
this study, the results revealed that pregnant women with a GWG
<10 or a GWG >20 were at a greater risk of carrying a
macrosomic fetus (data not shown).
Discussion
In the present study, circulating miRNAs in maternal
plasma in pregnancies with fetal macrosomia were detected and
analyzed. Although miRNAs have been extensively investigated as
novel and non-invasive diagnostic and prognostic markers in various
types of cancer and abnormal pregnancies (32,35–37), to the best of our knowledge, this
is the first comprehensive survey on maternal circulating miRNA
expression profiles in maternal plasma from pregnant women with
fetal macrosomia. We investigated circulating miRNAs in the
maternal plasma from pregnant women with fetal macrosomia by TLDAs.
Differentially expressed miRNAs were profiled, and some of them
were validated by RT-qPCR.
Although the concentration of circulating miRNAs in
maternal plasma is rare, 274 types of miRNAs were detected with
TLDA. Among these, a total of 196 miRNAs were co-expressed; 27 and
52 miRNAs were detected only in the plasma of carriers of
macrosomic fetuses and healthy controls, respectively. Forty
additional individual plasma samples were detected by RT-qPCR as
validation since only 2 pooled samples (each included 10 individual
samples) were measured by TLDA. Twelve miRNAs were selected for
RT-qPCR based on the TLDA results; consistent results were obtained
for all of the miRNAs apart from miR-16-5p (Fig. 1). This inconformity may be mainly
due to the individual differences of the investigated plasma
samples.
To evaluate the efficiency of these selected
dysregulated miRNAs for the diagnosis of fetal macrosomia, ROC
curves were constructed for each miRNA. miR-141-3p, miR-523-3p, and
miR-200c-3p showed the ability to distinguish fetal macrosomia from
normal control pregnancy efficiently, with an AUC value >0.9. In
addition, miR-141-3p and miR-200c-3p showed the ability to
distinguish fetal macrosomia from other types of abnormal
pregnancy, such as preeclampsia. These miRNAs may thus be potential
biomarkers for the detection and diagnosis of fetal macrosomia and
other complications associated with pregnancy. However, the
biological mechanisms of the dysregulation of these miRNAs and
their therapeutic potential in fetal macrosomia require further
investigation.
We also analyzed the expression of miRNA clusters.
Of note, the results revealed that cluster members showed similar
changes in expression in pregnancy (Fig. 6). miRNA clusters are largely
present in metazoan genomes with the diversity of their
distribution (38). A number of
miRNAs are linked as clusters on chromosomes and are often
transcribed from genomic DNAs as a single polycistronic transcript
to provide the opportunity for different miRNAs to target several
categories of genes simultaneously (39,40). Accumulating evidence suggests that
clustered miRNAs are always transcribed as polycistrons and have
similar expression patterns (41). In this study, we observed the
characteristics of miRNA cluster expression patterns. Four miRNA
clusters, the miR-451, miR-17-92, miR-27 and miR-141 clusters were
found to be significantly differentially expressed in the plasma
from pregnant women with fetal macrosomia. Although their
expression levels differed, the results revealed that the changes
in the expession of the cluster members showed a similar trend when
compared to the expression patterns.
Maternal obesity, impaired glucose tolerance,
gestational diabetes and high BMI may all contribute to infant
macrosomia (6,9). In this study, we detected the miRNA
expression and analyzed the correlation between BMI and miRNA
expression levels. miRNAs, such as miR-143-3p and miR-221-3p have
been reported to be related to obesity and diabetes (28–31), as miRNA-143 inhibits
insulin-stimulated AKT activation and impairs glucose metabolism.
These miRNAs were also found to be significantly differentially
expressed in the plasma of pregnant women with fetal macrosomia in
this study, while opposite trends in expression were observed in
our study. For instance, miR-143-3p has shown an upregulated
expression in obesity (30),
while its expression was downregulated in the pregnant women with
fetal macrosomia in our study. We hypothesized that miRNAs may show
a compensatory reverse expression in childhood and in adulthood
compared with the embryonic phase.
GWG is also greatly considered a factor that may be
related to abnormal pregnancy. Although no significant differences
in GWG were observed between the macrosomia and the control groups
in this study, surprisingly, it was found that infants with the
highest birth weight were delivered by women with the lowest GWG.
Therefore, the association between GWG, miRNAs and macrosomia
requires further investigation.
The differentially expressed miRNAs which were
detected by TLDA with a ΔΔCT value >2.0 or < −2.0 in pregnant
women with fetal macrosomia compared with the normal pregnancy
controls, were regarded as macrosomia-specific plasma miRNAs. We
collected their experimentally validated target sites from the
miRTarBase database (42). Those
genes targeted by >2 miRNAs were regarded as target genes of
maternal plasma miRNAs. We analyzed functions and functional
relationships of these target genes using Gene Ontology Analysis
and Kyoto Encyclopedia of Genes and Genomes (KEGG). The results
revealed that genetic disorders, immunological disease, cell
signaling, cancer and cell cycle were the enriched pathways of
maternal plasma miRNA target genes (data not shown). These pathways
are closely related to pregnancy progression. Therefore, maternal
plasma miRNAs may participate in the regulation of pregnancy
through these pathways.
This study had several limitations which should be
noted. Firstly, only partially dysregulated miRNAs were selected
and evaluated, while other differentially expressed miRNAs were not
detected in this study. More efficient biomarkers and significant
miRNAs may still be detected for research on fetal macrosomia.
Secondly, our study is a preliminary investigation of miRNA
expression levels associated with abnormal pregnancy, fetal
macrosomia in particular, and provides a platform for related
research. More information is required on biomarkers, including
exact differences in individual pregnancies, as well as in
situations of other types of abnormal pregnancy. More importantly,
the functions and miRNA regulatory pathways should be thoroughly
investigated. Furthermore, additional research conducted on larger
numbers of pregnant women (abnormal pregnancies and normal
controls) and non-pregnant healthy controls is required to validate
our findings.
In conclusion, TLDAs revealed the dysregulation of
143 miRNAs in the maternal plasma from pregnant women with fetal
macrosomia. miR-141-3p and miR-200c-3p were shown to be able to
distinguish pregnancies with fetal macrosomia from healthy
pregnancies and other types of abnormal pregnancy with high
sensitivity and specificity. Strong correlations were observed
between miRNA expression levels and BMI. It was also revealed that
the expression of miRNA clusters showed the same changing trend in
fetal macrosomia. This suggests that altered levels of miRNAs in
maternal plasma have great potential to serve as non-invasive and
mechanistically relevant biomarkers for the detection and diagnosis
of abnormal pregnancies.
Acknowledgements
This study was supported by projects 61271055,
61271054 and 61372164 of the National Natural Science Foundation of
China.
References
|
1
|
Boulet SL, Alexander GR, Salihu HM and
Pass M: Macrosomic births in the united states: determinants,
outcomes, and proposed grades of risk. Am J Obstet Gynecol.
188:1372–1378. 2003. View Article : Google Scholar : PubMed/NCBI
|
|
2
|
Henriksen T: The macrosomic fetus: a
challenge in current obstetrics. Acta Obstet Gynecol Scand.
87:134–145. 2008. View Article : Google Scholar : PubMed/NCBI
|
|
3
|
Schwartz R and Teramo KA: What is the
significance of macrosomia? Diabetes Care. 22:1201–1205. 1999.
View Article : Google Scholar : PubMed/NCBI
|
|
4
|
Haram K, Pirhonen J and Bergsjø P:
Suspected big baby: a difficult clinical problem in obstetrics.
Acta Obstet Gynecol Scand. 81:185–194. 2002. View Article : Google Scholar : PubMed/NCBI
|
|
5
|
Ehrenberg HM, Mercer BM and Catalano PM:
The influence of obesity and diabetes on the prevalence of
macrosomia. Am J Obstet Gynecol. 191:964–968. 2004. View Article : Google Scholar : PubMed/NCBI
|
|
6
|
Jang HC, Cho NH, Min YK, Han IK, Jung KB
and Metzger BE: Increased macrosomia and perinatal morbidity
independent of maternal obesity and advanced age in Korean women
with GDM. Diabetes Care. 20:1582–1588. 1997. View Article : Google Scholar : PubMed/NCBI
|
|
7
|
Yu Z, Sun JQ, Haas JD, Gu Y, Li Z and Lin
X: Macrosomia is associated with high weight-for-height in children
aged 1–3 years in Shanghai. China. Int J Obes (Lond). 32:55–60.
2008. View Article : Google Scholar
|
|
8
|
Segregur J, Buković D, Milinović D, et al:
Fetal macrosomia in pregnant women with gestational diabetes. Coll
Antropol. 33:1121–1127. 2009.
|
|
9
|
Suhonen L, Hiilesmaa V, Kaaja R and Teramo
K: Detection of pregnancies with high risk of fetal macrosomia
among women with gestational diabetes mellitus. Acta Obstet Gynecol
Scand. 87:940–945. 2008. View Article : Google Scholar : PubMed/NCBI
|
|
10
|
Vohr BR and Boney CM: Gestational
diabetes: the forerunner for the development of maternal and
childhood obesity and metabolic syndrome? J Matern Fetal Neonatal
Med. 21:149–157. 2008. View Article : Google Scholar : PubMed/NCBI
|
|
11
|
Ornoy A: Prenatal origin of obesity and
their complications: Gestational diabetes, maternal overweight and
the paradoxical effects of fetal growth restriction and macrosomia.
Reprod Toxicol. 32:205–212. 2011. View Article : Google Scholar : PubMed/NCBI
|
|
12
|
Van Assche FA, Holemans K and Aerts L:
Long-term consequences for offspring of diabetes during pregnancy.
Br Med Bull. 60:173–182. 2001. View Article : Google Scholar
|
|
13
|
Kim YS, Yoon YJ, Jatoi I and Kim Y: Fetal
macrosomia in experimental maternal diabetes. Am J Obstet Gynecol.
139:27–32. 1981.PubMed/NCBI
|
|
14
|
Bartel DP: MicroRNAs: genomics,
biogenesis, mechanism, and function. Cell. 116:281–297. 2004.
View Article : Google Scholar : PubMed/NCBI
|
|
15
|
Mattick JS and Makunin IV: Non-coding RNA.
Hum Mol Genet. 15(Spec 1): R17–R29. 2006. View Article : Google Scholar : PubMed/NCBI
|
|
16
|
Mitchell PS, Parkin RK, Kroh EM, et al:
Circulating microRNAs as stable blood-based markers for cancer
detection. Proc Natl Acad Sci USA. 105:10513–10518. 2008.
View Article : Google Scholar : PubMed/NCBI
|
|
17
|
Reid G, Kirschner MB and van Zandwijk N:
Circulating microRNAs: Association with disease and potential use
as biomarkers. Crit Rev Oncol Hematol. 80:193–208. 2011. View Article : Google Scholar
|
|
18
|
Tan KS, Armugam A, Sepramaniam S, et al:
Expression profile of microRNAs in young stroke patients. PLoS One.
4:e76892009. View Article : Google Scholar : PubMed/NCBI
|
|
19
|
Zampetaki A, Willeit P, Drozdov I, Kiechl
S and Mayr M: Profiling of circulating microRNAs: from single
biomarkers to re-wired networks. Cardiovasc Res. 93:555–562. 2012.
View Article : Google Scholar :
|
|
20
|
Wang G, Tam LS, Li EK, et al: Serum and
urinary free microRNA level in patients with systemic lupus
erythematosus. Lupus. 20:493–500. 2011. View Article : Google Scholar : PubMed/NCBI
|
|
21
|
Corsten MF, Dennert R, Jochems S, et al:
Circulating microRNA-208b and microRNA-499 reflect myocardial
damage in cardiovascular disease. Circ Cardiovasc Genet. 3:499–506.
2010. View Article : Google Scholar : PubMed/NCBI
|
|
22
|
Ng EK, Tsang WP, Ng SS, et al:
MicroRNA-143 targets DNA methyltransferases 3A in colorectal
cancer. Br J Cancer. 101:699–706. 2009. View Article : Google Scholar : PubMed/NCBI
|
|
23
|
Huang Z, Huang D, Ni S, Peng Z, Sheng W
and Du X: Plasma microRNAs are promising novel biomarkers for early
detection of colorectal cancer. Int J Cancer. 127:118–126. 2010.
View Article : Google Scholar
|
|
24
|
Chen X, Ba Y, Ma L, et al:
Characterization of microRNAs in serum: a novel class of biomarkers
for diagnosis of cancer and other diseases. Cell Res. 18:997–1006.
2008. View Article : Google Scholar : PubMed/NCBI
|
|
25
|
Ng EK, Tsui NB, Lau TK, Leung TN, Chiu RW,
Panesar NS, Lit LC, Chan KW and Lo YM: mRNA of placental origin is
readily detectable in maternal plasma. Proc Natl Acad Sci USA.
100:4748–4753. 2003. View Article : Google Scholar : PubMed/NCBI
|
|
26
|
Fanson BG, Osmack P and Di Bisceglie AM: A
comparison between the phenol-chloroform method of RNA extraction
and the QIAamp viral RNA kit in the extraction of hepatitis C and
GB virus-C/hepatitis G viral RNA from serum. J Virol Methods.
89:23–27. 2000. View Article : Google Scholar : PubMed/NCBI
|
|
27
|
Liu J, Leng J, Tang C, Liu G, Hay J, Wang
J, Wen S, Li Z and She Y: Maternal glucose level and body mass
index measured at gestational diabetes mellitus screening and the
risk of macrosomia: results from a perinatal cohort study. BMJ
Open. 4:e0045382014. View Article : Google Scholar : PubMed/NCBI
|
|
28
|
Prats-Puig A, Ortega FJ, Mercader JM, et
al: Changes in circulating microRNAs are associated with childhood
obesity. J Clin Endocrinol Metab. 98:E1655–E1660. 2013. View Article : Google Scholar : PubMed/NCBI
|
|
29
|
Ortega FJ, Mercader JM, Catalán V, et al:
Targeting the circulating microRNA signature of obesity. Clin Chem.
59:781–792. 2013. View Article : Google Scholar : PubMed/NCBI
|
|
30
|
Jordan SD, Krüger M, Willmes DM, et al:
Obesity-induced overexpression of miRNA-143 inhibits
insulin-stimulated AKT activation and impairs glucose metabolism.
Nat Cell Biol. 13:434–446. 2011. View
Article : Google Scholar : PubMed/NCBI
|
|
31
|
Fu T, Choi SE, Kim DH, et al: Aberrantly
elevated microRNA-34a in obesity attenuates hepatic responses to
FGF19 by targeting a membrane coreceptor β-Klotho. Proc Natl Acad
Sci USA. 109:16137–16142. 2012. View Article : Google Scholar
|
|
32
|
Yang Q, Lu J, Wang S, Li H, Ge Q and Lu Z:
Application of next-generation sequencing technology to profile the
circulating microRNAs in the serum of preeclampsia versus normal
pregnant women. Clin Chim Acta. 412:2167–2173. 2011. View Article : Google Scholar : PubMed/NCBI
|
|
33
|
Davoren PA, McNeill RE, Lowery AJ, Kerin
MJ and Miller N: Identification of suitable endogenous control
genes for microRNA gene expression analysis in human breast cancer.
BMC Mol Biol. 9:762008. View Article : Google Scholar : PubMed/NCBI
|
|
34
|
Xie T, Liang J, Guo R, Liu N, Noble PW and
Jiang D: Comprehensive microRNA analysis in bleomycin-induced
pulmonary fibrosis identifies multiple sites of molecular
regulation. Physiol Genomics. 43:479–487. 2011. View Article : Google Scholar : PubMed/NCBI
|
|
35
|
Cortez MA, Welsh JW and Calin GA:
Circulating microRNAs as noninvasive biomarkers in breast cancer.
Recent Results Cancer Res. 195:151–161. 2012. View Article : Google Scholar : PubMed/NCBI
|
|
36
|
Bianchi F, Nicassio F, Marzi M, et al: A
serum circulating miRNA diagnostic test to identify asymptomatic
high-risk individuals with early stage lung cancer. EMBO Mol Med.
3:495–503. 2011. View Article : Google Scholar : PubMed/NCBI
|
|
37
|
Chen X, Hu Z, Wang W, et al:
Identification of ten serum microRNAs from a genome-wide serum
microRNA expression profile as novel noninvasive biomarkers for
nonsmall cell lung cancer diagnosis. Int J Cancer. 130:1620–1628.
2012. View Article : Google Scholar
|
|
38
|
Zhang Y, Zhang R and Su B: Diversity and
evolution of microRNA gene clusters. Sci China C Life Sci.
52:261–266. 2009. View Article : Google Scholar : PubMed/NCBI
|
|
39
|
Kim VN and Nam JW: Genomics of microRNA.
Trends Genet. 22:165–173. 2006. View Article : Google Scholar : PubMed/NCBI
|
|
40
|
Xu J and Wong C: A computational screen
for mouse signaling pathways targeted by microRNA clusters. RNA.
14:1276–1283. 2008. View Article : Google Scholar : PubMed/NCBI
|
|
41
|
Baskerville S and Bartel DP: Microarray
profiling of microRNAs reveals frequent coexpression with
neighboring miRNAs and host genes. RNA. 11:241–247. 2005.
View Article : Google Scholar : PubMed/NCBI
|
|
42
|
Hsu SD, Lin FM, Wu WY, et al: miRTarBase:
a database curates experimentally validated microRNA-target
interactions. Nucleic Acids Res. 39:D163–D169. 2011. View Article : Google Scholar
|