Introduction
The tree shrew (Tupaia belangeri, family
Tupaiidae) is a small mammal native to tropical forests, broadly
distributed across Southeast Asia (1). It is classified as Scandentia, a
separate taxonomic group of mammals and which probably diverged
from the primate order (Primates) approximately 85 million years
ago (2,3). It has been suggested that tree
shrews can potentially be used as an animal model for the study of
some human diseases (2). Over the
past decades, tree shrew breeding has been on the increase in
laboratories (4–7) and tree shrews have been used as
experimental animal models for the study of diseases of the nervous
system, visual system and viral infection diseases, such as the
human hepatitis virus, herpes simplex virus and influenza virus
(7–12).
However, the genetic background of the tree shrew is
largely unidentified as only few tree shrew genes have been fully
sequenced. In the GenBank database, there are less than 200
molecules with coding information (partial or complete). To date,
there is no record available for the full-length sequence of the
tree shrew β-actin (tsACTB) gene. In addition, few antibodies and
detecting kits are available for characterizing the tree shrew
genome. Due to the lack of genetic and immune background
information, the wide application of the tree shrew as a model for
the study of human diseases has been greatly impeded.
Housekeeping genes are a group of typically
constitutive genes that are required for the maintenance of basic
cellular function. When examining human samples, some housekeeping
genes are frequently used as an internal reference, such as β-actin
(ACTB), 18S ribosomal RNA (18S rRNA),
glyceraldehyde-3-phosphate dehydrogenase (GAPDH), heat-shock
protein-90 (Hsp90), β-tubulin, β-2-microglobulin and others
(13–15). However, as regards the tree shrew,
most of the sequences of these genes remain unrevealed.
The actin family is an essential component of the
cytoskeleton involved in a wide range of cellular functions, such
as cell migration, division, junction formation, cell shape
regulation, vesicle trafficking, transcriptional regulation and
chromatin remodeling. The family is composed of six isoforms, four
of which are muscle-specific, including one γ-isoform for smooth
muscle and three α-isoforms for skeletal, cardiac and smooth
muscles, respectively; the other two are ubiquitously expressed in
the cytoplasm, including the β- and γ-isoform (16–18). All isoforms are remarkably similar
to each other, with over 93% identity in the amino acid sequence
between them (16). Among them,
β-actin is a member of the conserved cytoskeleton structural
proteins, which are abundant and widely distributed in all
eukaryotic cells and play critical roles in cell migration, cell
division, wound healing, embryonic development and the immune
response (18,19).
In this study, we reported the full-length cDNA
sequence of β-actin in the tree shrew and performed phylogenetic
analysis of ACTB by constructing a cladogram, further
verifying the tsACTB sequence by measuring its expression
profiles with quantitative polymerase chain reaction (qPCR) and
western blot analysis. Our data provide novel proteomic information
on the genetic background of the tree shrew, and enhance the
potential of the future use of the tree shrew as a model for the
study of human diseases.
Materials and methods
Ethics statement
All procedures related to the use of animals were
reviewed and approved by the Review Committee of Guangxi University
of Chinese Medicine, Nanning, China in accordance with the
Institutional Animal Care and Use regulations and rules.
Tree shrew sampling
Four tree shrews (subfamily of Tupaia belangeri
Chinensis) including one male and three females, purchased from
Kunming Medical University, Kunming, China were used in this study.
All procedures, including animal care, blood collection and tissue
collection protocols were conducted in accordance with the
Institutional Animal Care and Use regulations and rules.
RACE and sequencing
The 3′- and 5′-rapid amplification of cDNA ends
(RACE) was used to clone the tsACTB gene sequence. In brief,
total RNA was isolated from the blood samples using TRIzol Reagent
(Life Technologies, Carlsbad, CA, USA). The concentration of the
RNA was calculated according to the absorbance at 260 and 280 nm
which was measured using a Take3 model plate with an Epoch
microplate reader (BioTek, Winooski, VT, USA). Based on the
published nucleotide sequences of the partial tree shrew
ACTB gene (GenBank accession no. AF110103.1), we designed
two gene-specific primers (GSP) for the 5′-RACE and 3′-RACE
reaction, respectively (Table I).
First-strand cDNA was synthesized using the SMARTer RACE cDNA
Amplification kit (Clontech, Mountain View, CA, USA); while the
amplifications were performed with LA Taq DNA Polymerase (Takara,
Dalian, China). The PCR products was electrophoresed on a 1%
agarose gel, and then purified using the Gel Extraction kit (CWBio,
Beijing, China). Subsequently, the RACE products were linked to the
pMD-18T vector (Takara) in accordance with the established
protocols, and the constructed plasmids were then sent for
sequencing (Life Technologies, Guangzhou, China).
 | Table IPrimers used in this study. |
Table I
Primers used in this study.
| Primer | Sequence (5′→3′) | Application |
|---|
| tsACTB-GSP3RACE |
CCTGAAGTACCCCATCGAGCACGG | 3′-RACE
amplification |
| tsACTB-GSP5RACE |
ATTTGCGCTCAGGGGGAGCGATG | 5′-RACE
amplification |
| tsACTB-STDf |
CTGACCCTGAAGTACCCCATCGAG | Standard plasmid
construction |
| tsACTB-STDr |
CGTACTCCTGCTTGCTGATCCAC | Standard plasmid
construction |
| tsACTB01 (efficiency,
105%) | Forward:
CACGGCATTGTCACCAACT | RT-qPCR |
| Reverse:
TCAGTCAGCAGCACAGGAT | |
| tsACTB02 (efficiency,
101%) | Forward:
CCTGTATGCCTCTGGTCGTA | RT-qPCR |
| Reverse:
CCACATAGCACAACTTCTCCTT | |
| tsACTB03
(efficiency, 105%) | Forward:
CACTCTTCCAGCCATCTT | RT-qPCR |
| Reverse:
TGTCCACATCACACTTCAT | |
| tsACTB04
(efficiency, 99%) | Forward:
AGGAGAAGTTGTGCTATGT | RT-qPCR |
| Reverse:
ATGGAGTTGAAGGTGGTT | |
Phylogenetic analysis
Alignment was performed using the Clustalw2 program.
The phylogenetic tree was computed and constructed by the
neighbor-joining method with 5,000 bootstrap replicates, as
previously described (20).
Values >50% were indicated. All ACTB sequences used in this
study are available in GenBank (National Institutes of Health,
Bethesda, MD, USA). Their accession numbers are as follows:
NM_001101.3, KC215183, NM_001009945.1, AB188274.1, NM_001033084.1,
NM_007393.3, NM_031144.3, NM_001172909.1, NM_001281595.1,
NM_173979.3, U39357.1, NM_001081838.1, NM_205518.1, NM_001133354.1,
NM_001195845.1, NM_001244575.1, NM_001101683.1, NM_213719.1,
NM_001088953.1, AF025305.1 and AF012125.1.
Organ and tissue collection
The animals were anesthetized with an injection of
10% chloral hydrate (0.2 ml/100 g) in the abdominal cavity. Warm
physiological saline solution was injected through the abdominal
vein to expel blood from the organs. When paled, the organ was
isolated, weighed and then cut into small tissue sections. These
tissue sections were sorted and kept in RNAstore Reagent for the
extraction of total RNA, and in Protease Inhibitor Cocktail Buffer
(both from CWBio) for protein extraction processes.
Cell culture and collection
According to the datasheet of anti-ACTB antibody
(GTX109639; GeneTex, Irvine, CA, USA), the human cell lines, 293T
(GNHu17) and HeLa (TCHu187; both from Cell Bank of Shanghai
Institutes for Biological Sciences), were used as positive
controls. The cells were cultured in RPMI-1640 medium containing
10% fetal bovine serum (FBS). The cells were collected following a
general protocol. In brief, cells were detached from the vessel
with Trypsin-EDTA (Life Technologies, Carlsbad, CA, USA) and then
washed with phosphate buffer solution.
Construction of standard plasmid for
absolute Qpcr
Primers (Table I)
were designed based on the sequence (GenBank accession no.
KC215183) and then synthesized (Life Technologies, Guangzhou,
China). First-strand cDNA was synthesized using the ProtoScript
First Strand cDNA Synthesis kit (New England Biolabs, Beijing,
China). The fragment for the standard plasmid was amplified using
LA Taq DNA Polymerase (Takara). PCR products were electrophoresed
on a 1% agarose gel, and purified using the Gel Extraction kit
(CWBio). Subsequently, the purified PCR products were cloned into
the pMD-18T Vector (Takara). The constructed plasmid was
transformed into DH5α E. coli cells and multiplied through
propagation of the DH5α E. coli bacteria, and then extracted
and purified from bacteria using the TIANprep Mini Plasmid kit
(Tiangen, Beijing, China). The purified plasmid was measured by the
absorbance method of 260/280 nm, and diluted to a series of
concentration gradients: 1010, 109,
108, 107, 106 and 105
copies.
Reverse transcription and qPCR
The mRNA expression of tsACTB in various
types of tissue was detected using the absolute qPCR method
following the MIQE guidelines, as previously described (21). In brief, total RNA was isolated
using TRIzol Reagent (Life Technologies, Carlsbad, CA, USA) from
the isolated tissues and measured using the absorbance method of
260/280 nm. The PrimeScript II 1st Strand cDNA Synthesis kit
(Takara) was used to synthesize the first-strand cDNA from total
RNA. The qPCR reactions were carried out using SYBR Premix Ex Taq
II (Takara) in the MasterCycler Ep Realplex4 (Eppendorf,
Hamburg, Germany). For each reaction, 2 μl cDNA and a final
concentration of 50 nmol/l of each primer were used. The cycling
profile consisted of an initial denaturation at 95°C for 5 min
followed by 40 cycles of 95°C for 20 sec, 55°C for 30 sec, 72°C for
20 sec, followed by melt curve analysis.
Protein extraction and western blot
analysis
Tissue protein extraction was carried out using the
Tissue Protein Extraction kit, and cellular protein was extracted
using the Mammalian Protein Extraction kit (both from CWBio). The
total protein concentration was measured using the Pierce BCA
Protein Assay kit (Thermo Scientific, Rockford, IL, USA) with an
Epoch microplate reader (BioTek). Sodium dodecyl
sulfate-polyacrylamide gel electrophoresis (SDS-PAGE) and western
blot analysis were performed following the standard protocol. The
sample was loaded with total protein of 10 μg/lane. The
anti-ACTB antibody (GTX109639) and secondary HRP-conjugated IgG
antibody (GTX213110-01) (both from GeneTex) were applied. Images of
the blots were obtained using the Pierce ECL Plus Western Blotting
Substrate (Thermo Scientific) in a 4000MM Pro Image Station
(Carestream Health, Inc., Rochester, NY, USA).
Data analysis, software and statistical
analysis
The primers used in this study were designed by the
Primer3 online program, as previously described (22,23). The Clustalw2 online program
(24) was used to align and score
gene/protein sequences. BioEdit (25) was used to build the alignment
graph. MEGA5 (20) was used to
compute and construct the phylogenetic tree. The nucleic acid
concentration was measured and calculated using Gen5 software
(BioTek). Realplex software (Eppendorf, Hamburg, Germany) was used
to analyze the results from qPCR. From the results of western blot
analysis, graphs were created and analyzed using Molecular Imaging
Software (Carestream Health, Inc.). A statistical comparison was
carried out with One-Way Analysis of Variance (ANOVA) using the
agricolae package (26) in R
(27). Charts were built using
ggplot2 (28), scales (29) and gridExtra (30) packages in R (27). Charts and graphs were created
using Inkscape (31) and the GNU
Image Manipulation Program (GIMP) (32).
Results
Full-length cDNA sequence of tsACTB
We identified full-length cDNA sequences of
tsACTB from three individual tree shrew specimens. The three
sequences were the same. The full-length amino acid sequence of
tsACTB was deduced based on its full-length cDNA sequence.
The sequence is a cDNA 1,866 bp in length and encodes a protein
with 375 amino acids. This is similar to other animals. We
deposited the tsACTB cDNA and uploaded the amino acid
sequences into GenBank with the accession number: KC215183. To the
best of our knowledge, ours is the first study to identify the
full-length sequence of tsACTB.
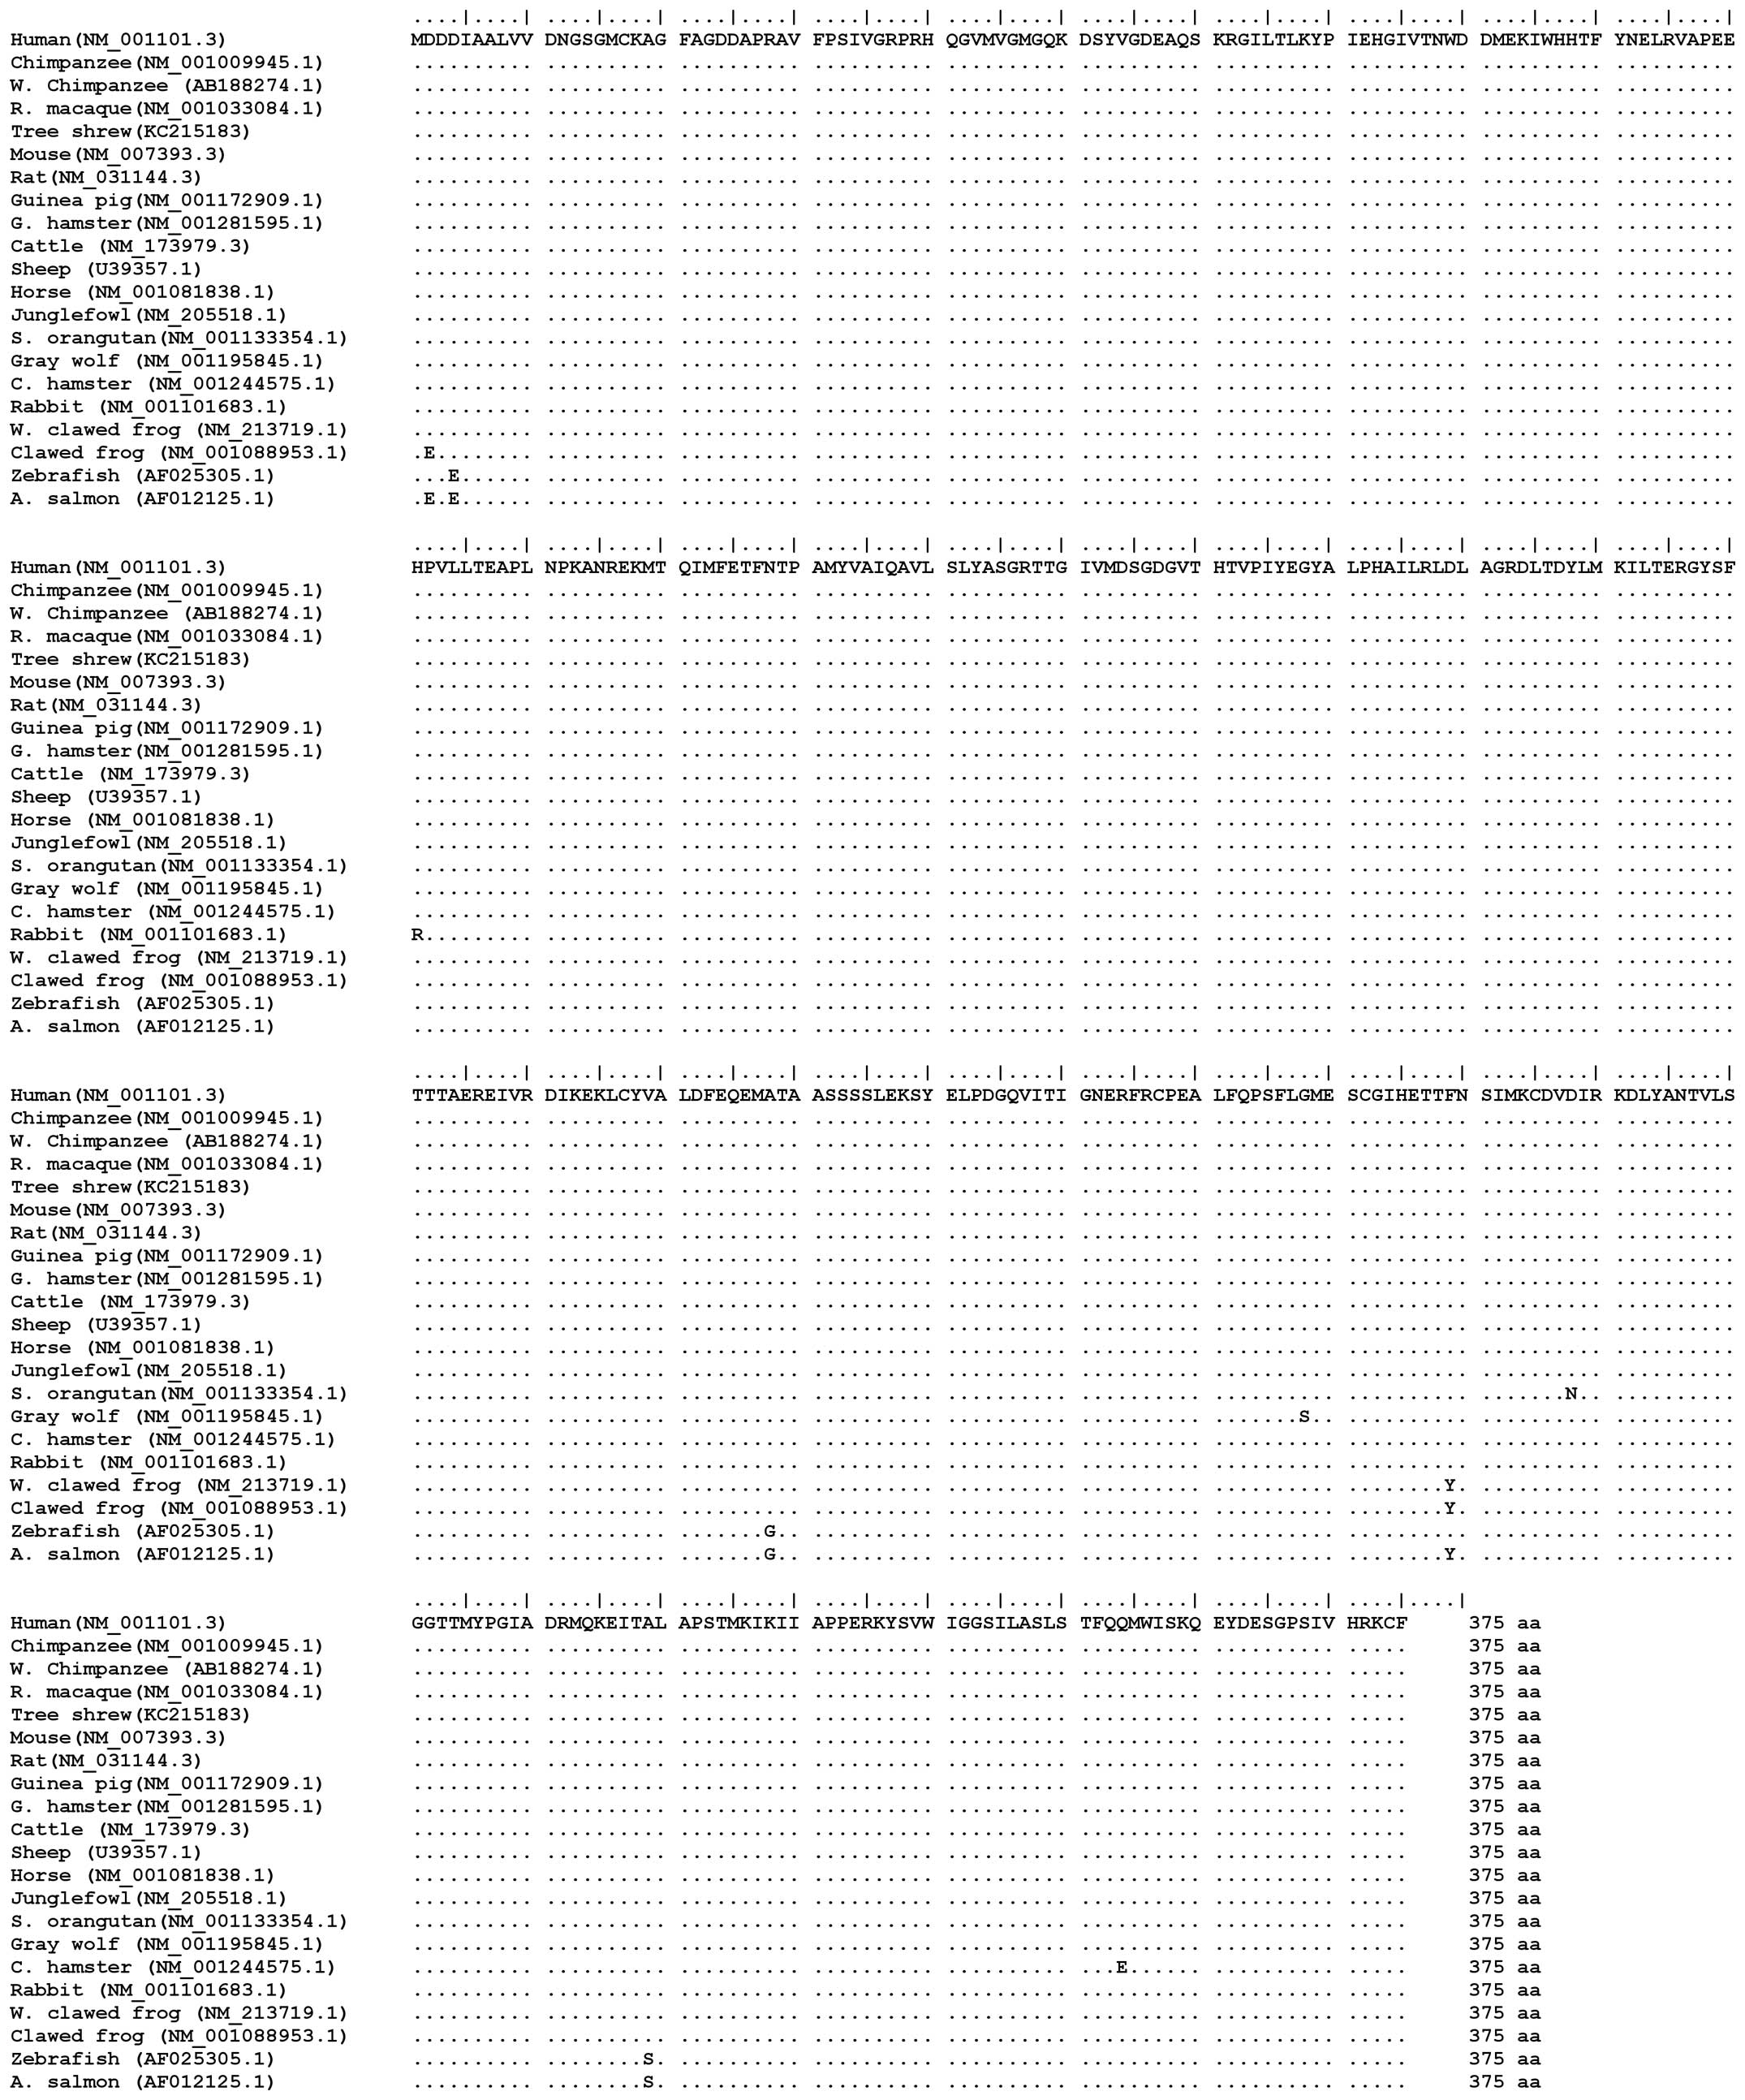
Phylogenetic analysis
To further examine the association between the tree
shrew and other species, we compared the tsACTB with
ACTB of other animals which can be found in GenBank. The
multiple sequence alignment (MSA) results (Fig. 1) revealed that there was no
difference in the ACTB amino acid sequence between the tree shrew
and humans. Among the different species examined, the ACTB amino
acid sequences were exactly the same or differed only in one or two
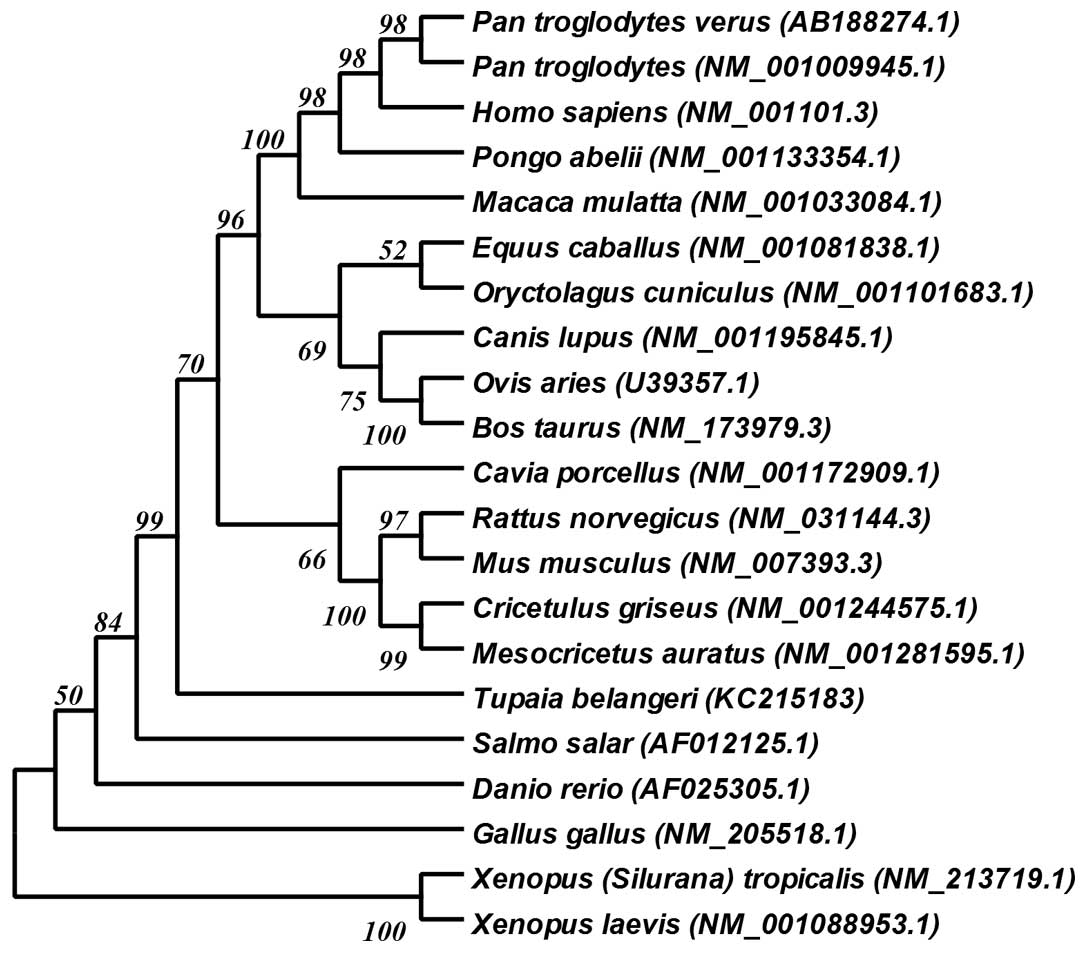
amino acid sequences. With the full-length cDNA sequence of
tsACTB from our study, we were able to construct a
phylogenetic tree (Fig. 2) using
the genetic database from GenBank. Due to the extremely conserved
amino acid sequence of ACTB, we constructed this phylogenetic tree
with the open reading frame (ORF) of ACTB.
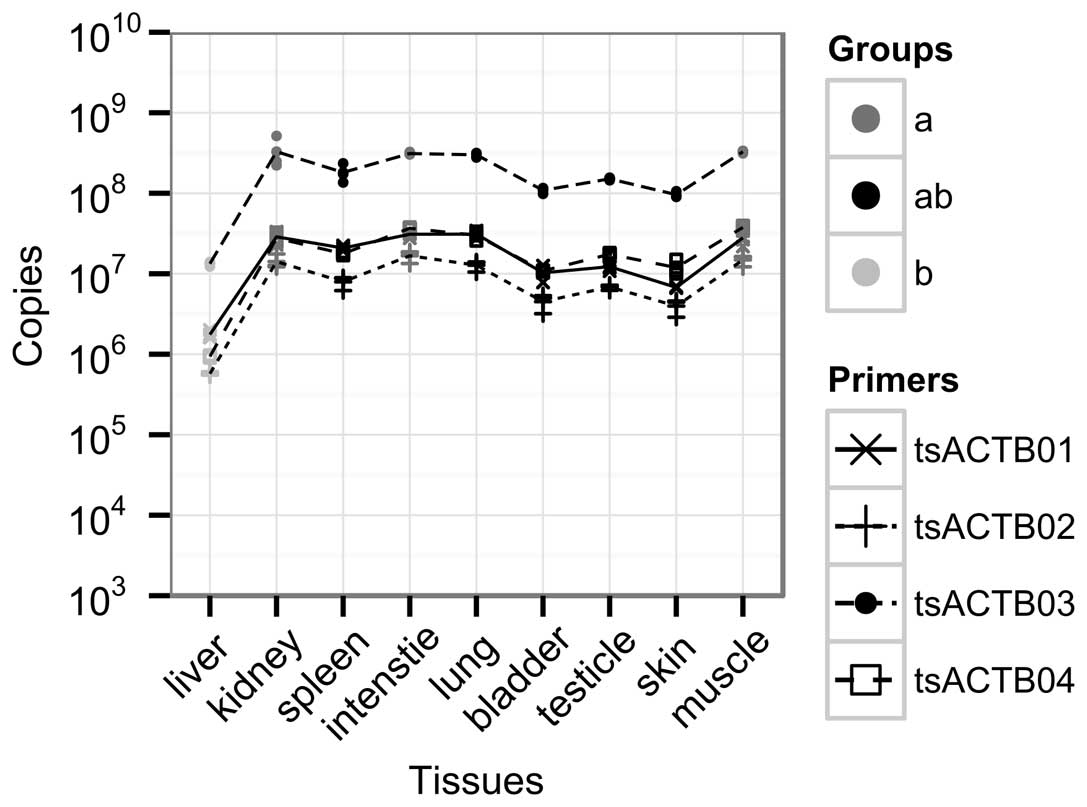
Expression profile analysis of tsACTB in
tree shrew tissue
To further determine the tsACTB expression
pattern in the tree shrew, qPCR was used to measure the mRNA
expression levels of ACTB in various types of tissue from
the tree shrew (Fig. 3). We
designed four pairs of primers (Table
I) to detect tsACTB expression patterns based on the
full-length cDNA sequence. The amplification efficiencies of the
four pairs of primers are shown in Table I. These pairs of primers are
similar in their amplification efficiencies (99–105%). The levels
of ACTB expression calculated by the tsACTB03 primer pair
were higher than the other three primer pairs, but were similar to
those of the other three primer pairs. The expression levels of
tsACTB in various types of tissue were compared by One-Way
ANOVA followed by Duncan’s multiple range test, with a significance
level of P=0.05. According to this statistical analysis, the
expression of ACTB can be grouped into two cross groups,
marked as ‘a’ and ‘b’, and the crossed parts are marked as ‘ab’
(Fig. 3). The levels of
ACTB in the same group did not differ significantly.
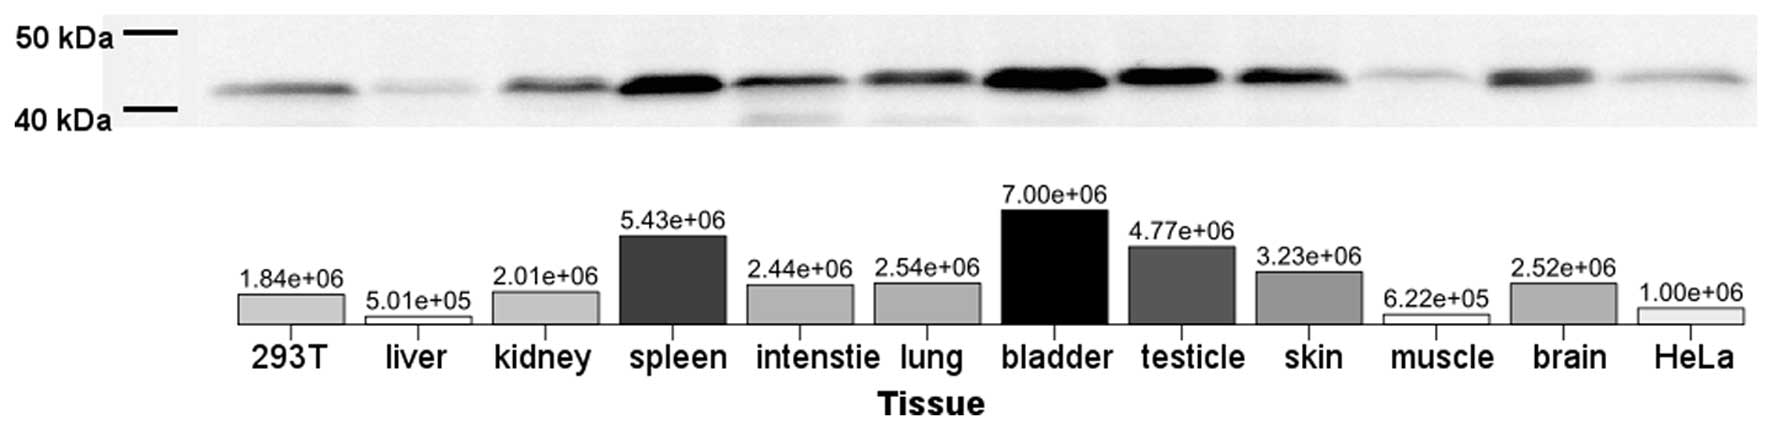
Expression pattern of ACTB in the tree
shrew
The total identity of ACTB in the amino acid
sequence suggests the possibility of the identification of the
tsACTB molecule with anti-ACTB antibody which reacts with human
ACTB. To assess the ACTB protein expression, western blot analysis
was performed to detect tsACTB using an anti-ACTB antibody for
humans. All examined tissues expressed the ACTB protein (Fig. 4). The highest level of tsACTB
expression in tree shrew tissue was observed in the spleen, bladder
and testicles. The lowest levels of tsACTB expression in tree shrew
tissue were observed in the liver and muscle (Fig. 4).
Discussion
In this study, we reported the full-length cDNA
sequence of ACTB in the tree shrew and performed evolution and
sequence analysis. We then identified the sequence using qPCR and
verified the protein expression of tsACTB by western blot analysis.
Phylogenetic analysis revealed that the tree shrew is classified as
Scandentia between the order of Primates and Insectivora. The
tsACTB amino acid sequence was found to be completely equal to the
ACTB sequence of several species (Fig. 1), including the human, chimpanzee,
macaque, mouse, rat guinea pig, hamster cattle, sheep, horse and
jungle fowl species. Due to the fact the molecule of ACTB is highly
conserved in all species, we constructed a phylogeny tree with the
ORF of the ACTB cDNA sequence instead of its amino acid
sequence, even though phylogenetic associations are usually
analyzed with the amino acid sequence of the molecule. As shown in
the cladogram (Fig. 2), the
closest phylogenetic relatives to the tree shrew, not belonging to
the order of Primates, are the rabbit (Oryctolagus
cuniculus) and horse (Equus caballus), which is
consistent with the results of previous studies on the tree shrew
MHC gene (33,34). Our results support the current
classification of the tree shrew, namely that the tree shrew is a
small-sized mammal phylogenetically closer to humans than other
small-sized experimental animals, such as the mouse, rat, rabbit
and guinea pig, but phylogenetically farther than non-human
primates, such as the chimpanzee and monkey.
ACTB, a housekeeping gene in humans, mice,
rats and other experimental animals, is widely used as an internal
reference in quantitative methods, including qPCR and western blot
analysis, which are two popularly methods used for the
quantification of the mRNA and protein content, respectively. In
this study, tsACTB expression was verified to widely and richly
exist in each examined tissue of the tree shrew by both qPCR and
western blot analysis, although the expression levels varied among
the different types of tissue from the tree shrews. Moreover,
tsACTB mRNA and protein expression levels were not completely
parallel. For instance, our data indicated that the muscle tissue
from the tree shrew had significantly high mRNA levels of
tsACTB expression and significantly low protein expression
levels (Figs. 3 and 4). We also observed that the levels of
tsACTB detected by the tsACTB03 primer pair were higher than those
detected by the other three qPCR primer pairs (Fig. 3). A possible reason for this is
that the product length of the tsACTB primer pair was only 87 bp,
which was shorter than the products of the tsACTB01 (104 bp),
tsACTB02 (236 bp), and tsACTB04 (208 bp) primer pairs (data not
shown). Another possible reason is the high homology of the six
isoforms of the actin family and this primer pair may amplify other
non-specific isoforms of the actin family. However, as the majority
of the cDNA sequences of the tree shrew, including other isoforms
of actin family members, are still unknown, the actual reason
remains to be revealed.
One of the most crucial steps in experimental design
is selecting an internal control gene to normalize the gene
expression data according to the objective of the experiment. Our
data may prove to be a helpful reference and may aid in the
selection of an internal reference in future studies using tree
shrews. If experiments are carried out using samples, the
reliability of tsACTB expression before and after treatment
must be verified in advance. According to our data, tsACTB
is a suitable candidate only for comparing expression levels in
different types of tissue (the tissue types verified to express
similar levels). The primers for used for qPCR and anti-ACTB
antibody (human) were good tools for the detection of the mRNA and
protein epxression of ACTB in the tree shrew.
Acknowledgments
The authors would like to thank the Laboratory of
Molecular Medicine Teaching (Guangxi Medical University) for
assistance with qPCR, and would also like to thank Miss Aolei Su
and Yinge Qin (Guangxi University of Chinese Medicine) for provding
animal care. This study was supported by the National Natural
Science Foundation of China (grant no. 31160190), the Guangxi
Department of Science and Technology (grant nos. GKG1140003B51 and
GKG13470036) and the Guangxi Department of Education [grant no.
GJKY(2003)8].
References
|
1
|
Fuchs E and Corbach-Söhle S: Tree Shrews.
The UFAW Handbook on the Care and Management of Laboratory and
Other Research Animals. Wiley-Blackwell; Oxford: pp. 262–275. 2010,
View Article : Google Scholar
|
|
2
|
Kumar S and Hedges SB: A molecular
timescale for vertebrate evolution. Nature. 392:917–920. 1998.
View Article : Google Scholar : PubMed/NCBI
|
|
3
|
Roberts TE, Lanier HC, Sargis EJ and Olson
LE: Molecular phylogeny of treeshrews (Mammalia: Scandentia) and
the timescale of diversification in Southeast Asia. Mol Phylogenet
Evol. 60:358–372. 2011. View Article : Google Scholar : PubMed/NCBI
|
|
4
|
Shimada A: Studies on Tupaia glis Diard as
an experimental animal: its breeding and growth. Jikken Dobutsu.
22(Suppl): S351–S357. 1973.
|
|
5
|
Schwaier A: Tupaias (tree shrews) - a new
animal model for gallstone research; first observations of
gallstones. Res Exp Med (Berl). 176:15–24. 1979. View Article : Google Scholar
|
|
6
|
MacArthur KL, Wu CH and Wu GY: Animal
models for the study of hepatitis C virus infection and
replication. World J Gastroenterol. 18:2909–2913. 2012. View Article : Google Scholar : PubMed/NCBI
|
|
7
|
Yang EB, Cao J, Su JJ and Chow P: The tree
shrews: useful animal models for the viral hepatitis and
hepatocellular carcinoma. Hepatogastroenterology. 52:613–616.
2005.PubMed/NCBI
|
|
8
|
Yang ZF, Zhao J, Zhu YT, et al: The tree
shrew provides a useful alternative model for the study of
influenza H1N1 virus. Virol J. 10:1112013.PubMed/NCBI
|
|
9
|
Walter E, Keist R, Niederöst B, Pult I and
Blum HE: Hepatitis B virus infection of tupaia hepatocytes in vitro
and in vivo. Hepatology. 24:1–5. 1996.PubMed/NCBI
|
|
10
|
Yan RQ, Su JJ, Huang DR, Gan YC, Yang C
and Huang GH: Human hepatitis B virus and hepatocellular carcinoma.
I. Experimental infection of tree shrews with hepatitis B virus. J
Cancer Res Clin Oncol. 122:283–288. 1996. View Article : Google Scholar : PubMed/NCBI
|
|
11
|
Xie ZC, Riezu-Boj JI, Lasarte JJ, et al:
Transmission of hepatitis C virus infection to tree shrews.
Virology. 244:513–520. 1998. View Article : Google Scholar : PubMed/NCBI
|
|
12
|
Cao J, Yang EB, Su JJ, Li Y and Chow P:
The tree shrews: adjuncts and alternatives to primates as models
for biomedical research. J Med Primatol. 32:123–130. 2003.
View Article : Google Scholar : PubMed/NCBI
|
|
13
|
de Kok JB, Roelofs RW, Giesendorf BA, et
al: Normalization of gene expression measurements in tumor tissues:
comparison of 13 endogenous control genes. Lab Invest. 85:154–159.
2005. View Article : Google Scholar
|
|
14
|
Eisenberg E and Levanon EY: Human
housekeeping genes are compact. Trends Genet. 19:362–365. 2003.
View Article : Google Scholar : PubMed/NCBI
|
|
15
|
Greer S, Honeywell R, Geletu M,
Arulanandam R and Raptis L: Housekeeping genes; expression levels
may change with density of cultured cells. J Immunol Methods.
355:76–79. 2010. View Article : Google Scholar : PubMed/NCBI
|
|
16
|
Perrin BJ and Ervasti JM: The actin gene
family: function follows isoform. Cytoskeleton (Hoboken).
67:630–634. 2010. View
Article : Google Scholar
|
|
17
|
Gunning P, Weinberger R and Jeffrey P:
Actin and tropomyosin isoforms in morphogenesis. Anat Embryol
(Berl). 195:311–315. 1997. View Article : Google Scholar
|
|
18
|
Bunnell TM, Burbach BJ, Shimizu Y and
Ervasti JM: β-Actin specifically controls cell growth, migration,
and the G-actin pool. Mol Biol Cell. 22:4047–4058. 2011. View Article : Google Scholar : PubMed/NCBI
|
|
19
|
Nowak D, Skwarek-Maruszewska A,
Zemanek-Zboch M and Malicka-Blaszkiewicz M: Beta-actin in human
colon adenocarcinoma cell lines with different metastatic
potential. Acta Biochim Pol. 52:461–468. 2005.PubMed/NCBI
|
|
20
|
Tamura K, Peterson D, Peterson N, Stecher
G, Nei M and Kumar S: MEGA5: molecular evolutionary genetics
analysis using maximum likelihood, evolutionary distance, and
maximum parsimony methods. Mol Biol Evol. 28:2731–2739. 2011.
View Article : Google Scholar : PubMed/NCBI
|
|
21
|
Bustin SA, Benes V, Garson JA, et al: The
MIQE guidelines: minimum information for publication of
quantitative real-time PCR experiments. Clin Chem. 55:611–622.
2009. View Article : Google Scholar : PubMed/NCBI
|
|
22
|
Untergasser A, Cutcutache I, Koressaar T,
et al: Primer3 - new capabilities and interfaces. Nucleic Acids
Res. 40:e1152012. View Article : Google Scholar
|
|
23
|
Koressaar T and Remm M: Enhancements and
modifications of primer design program Primer3. Bioinformatics.
23:1289–1291. 2007. View Article : Google Scholar : PubMed/NCBI
|
|
24
|
Goujon M, McWilliam H, Li W, et al: A new
bioinformatics analysis tools framework at EMBL-EBI. Nucleic Acids
Res. 38:W695–W699. 2010. View Article : Google Scholar : PubMed/NCBI
|
|
25
|
Hall TA: BioEdit: a user-friendly
biological sequence alignment editor and analysis program for
Windows 95/98/NT. Nucleic Acids Symposium Series. 41:95–98.
1999.
|
|
26
|
Mendiburu FD: agricolae: Statistical
Procedures for Agricultural Research. R package version 1.1-4.
2013, Available at: http://CRAN.R-Project.org/package=agricolae.
|
|
27
|
R Core Team: R: A language and environment
for statistical computing. R Foundation for Statistical Computing;
Vienna, Austria: 2013
|
|
28
|
Wickham H: ggplot2: Elegant Graphics for
Data Analysis. Springer; New York: 2009, View Article : Google Scholar
|
|
29
|
Wickham H: scales: Scale functions for
graphics. R package version 0.2.3. 2012, Available at: http://CRAN.R-project.org.package=scales.
|
|
30
|
Auguie B: gridExtra: functions in Grid
graphics. R package version 0.9.1. 2012, Available at: http://CRAN.R-project.org/package=gridExtra.
|
|
31
|
The Inkscape Team: Inkscape: an open
source vector graphics e ditor. Version 0.48.4. 2012, Available at:
http://www.inkscape.org.
|
|
32
|
Kimball S and Mattis P: GIMP: GNU Image
Manipulation Program. Version 2.8.6. 2013, Available at: http://www.gimp.org.
|
|
33
|
Flügge P, Fuchs E, Günther E and Walter L:
MHC class I genes of the tree shrew Tupaia belangeri.
Immunogenetics. 53:984–988. 2002. View Article : Google Scholar : PubMed/NCBI
|
|
34
|
Zhang XH, Dai ZX, Zhang GH, Han JB and
Zheng YT: Molecular characterization, balancing selection, and
genomic organization of the tree shrew (Tupaia belangeri) MHC class
I gene. Gene. 522:147–155. 2013. View Article : Google Scholar : PubMed/NCBI
|