Introduction
The phospholipase gene family encodes enzymes that
hydrolyze phospholipids into fatty acids and other micromolecules.
This gene family is classified into four major classes, namely,
phospholipase PLA, PLB, PLC and PLD (1), based on the types of catalytic
reaction of phospholipids. The majority of coding enzymes play
crucial roles in lipid metabolism (2), cell proliferation (3), muscle contraction (4-6)
and in the inflammation process (5). The PLA class includes two
subfamilies, namely PLA1 and PLA2. PLA1 cleaves the SN-1 acyl chain
and is a major component of snake venom (7,8),
whereas PLA2 cleaves the SN-2 acyl chain and releases arachidonic
acid, which mediates anti-inflammatory and inflammatory responses
(9). The PLA2 gene family is
divided into nine groups based on their function: PLA2G3, PLA2G4,
PLA2G5, PLA2G6, PLA2G7, PLA2G10, PLA2G12, PLA2G15 and PLA2G16
(10). The coding enzymes of
these genes are important in platelet activity (11,12) and B-cell activity (13,14). The dysfunction of one or more of
these genes leads to stroke (14)
and other neurological diseases (15–17). However, all the functions of these
genes have not yet been fully elucidated.
A number of studies have focused on the association
between the PLA2 gene family and various physiological and
pathological conditions. The results of a clinical trial
demonstrated that high levels of sPLA2 mass in the circulation are
not associated with a high risk of cardiovascular disease (18), which is not consistent with some
earlier basal medical studies (11). Apart from potential flaws during
study design, the differences in the results obtained may be
attributed to genetic alterations reflecting a greater sensitivity
to cardiovascular risk. In addition, certain studies have performed
phylogenetic analyses (19).
However, the available information is still insufficient partly due
to methodological limitations and gene data inclusion criteria.
In the present study, we analyzed the functions and
phylogenetic background of the PLA2 gene family. We aimed to
firstly determine the phylogenetic background of the PLA2 gene
family in vertebrates using the neighbor-joining (NJ), minimum
evolution (ME) and maximum parsimony (MP) methods, as well as the
Bayesian information criterion, and secondly, to detect the
positive selection sites of the PLA2 gene family to define the
structure and biological activity of the gene by site-directed
mutagenesis, which may provide possible therapeutic targets. The
data presented in this study provide insight into the phylogenetic
relationships and functional differentiation of the phospholipase
and PLA2 gene families.
Materials and methods
Data collection
We searched and downloaded natural and intact amino
acid and gene sequences of the phospholipase and PLA2 families from
the NCBI database (http://www.ncbi.nlm.nih.gov/gene/). These sequences
included human, house mouse, Norway rat, pig, dog, chicken, cattle,
African clawed frog, Sumatran orangutan and zebrafish
sequences.
Sequence alignment
We used the EBI web tool, MUSCLE (20), to align the sequences of the
phospholipase and PLA2 family proteins. Rearranged gene sequences
were generated according to the new amino acid alignment. The
results of the amino acid alignment were placed in an aligned CDS
fasta file using the EMBL web tool, PAL2NAL (21) (http://www.bork.embl.de/pal2nal/), which can form
multiple codon alignments from matching amino acid sequences. The
format was converted with the use of MEGA4.0. software (22).
Phylogenetic analysis
The full alignment of sequences was used for the
phylogenetic analysis. Akaike Information Criterion in
PAUP* version 4.0 (23) was applied to evaluate the most
appropriate model of amino acid substitution for early
tree-building analyses. ML optimizations and distance methods were
valued by the PhyML program in PAUP* version 4.0
(24). The most appreciated
evolution type, GTR+I+G, was computed for the PLA2 gene family
using Modeltest version 3.7 (25). Phylogenetic trees were
reconstructed using the Bayesian method from the DNA alignment with
the use of MrBayes version 3.1.2 software (26,27) according to the best-fit predictive
model. The parameters for tree generation were as follows:
2×10⁶ generations of the PLA2 gene family were included
with sampling every 1,000 generations, and with four chains (three
cold, one heated); the first 250,000 generations (250 trees) were
discarded from every run for the two families (phospholipase and
PLA2). Analyses with the NJ, ME and MP methods were performed using
MEGA4.0. software (22).
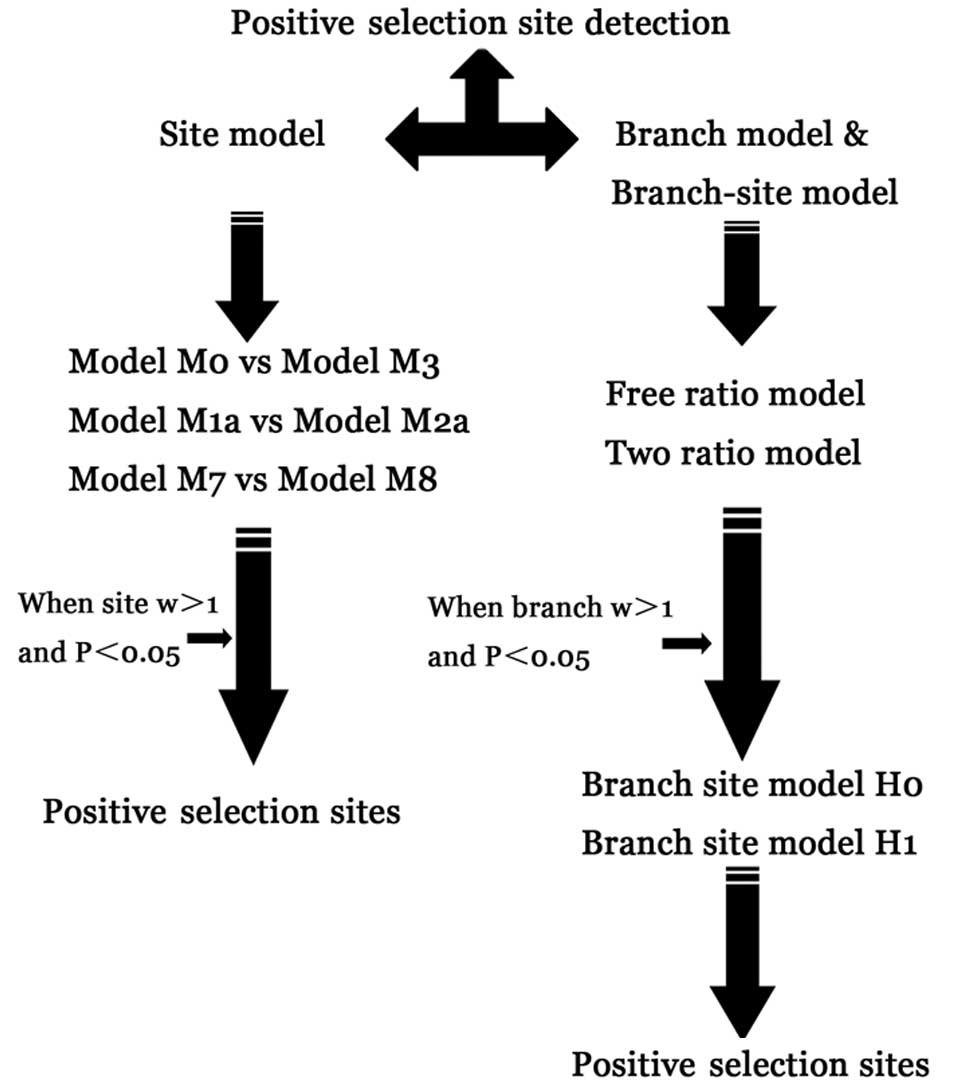
Estimation of positive selection
sites
Selective pressures of HA and NA genes were detected
by CODEML in the PAML package version 4.4 (28). Three codon-based likelihood
methods were run as branch, site and branch-site models. P<0.05
was used to determine whether or not the alternative hypothesis was
significant. In these analyses, ML estimates of the selection
pressure were based on the ratio dN/dS (ω), where dN and dS are the
non-synonymous and synonymous substitution rates, respectively,
which vary across codons; the probability of each codon being under
positive selection was estimated. Positive selection sites can
occur in very short episodes or on only a few sites during the
evolution of duplicated genes when ω >1 (29). All alignments resulted from the
PAL2NAL web tool. The parameter estimates (ω) and likelihood scores
were calculated for three pairs of models: M0 (one ratio) vs. M3
(discrete); M1a (nearly neutral) vs. M2a (positive selection); and
M7 (β) vs. M8 (β + ω). The likelihood ratio test (LRT) was used to
compare the fit to the data of two nested models, assuming that
twice the log likelihood difference between the two models (2ΔL)
follows a χ2 distribution with a number of degrees of
freedom equal to the difference in the number of free parameters
(30). Naive empirical Bayes and
empirical Bayes selection criteria implemented in PAML4 were used
to identify sites under positive selection or relaxed purifying
selection in the foreground group with significant LRTs. Each
branch group was also labeled as a foreground group. The flow of
positive selective site detection is presented in Fig. 1.
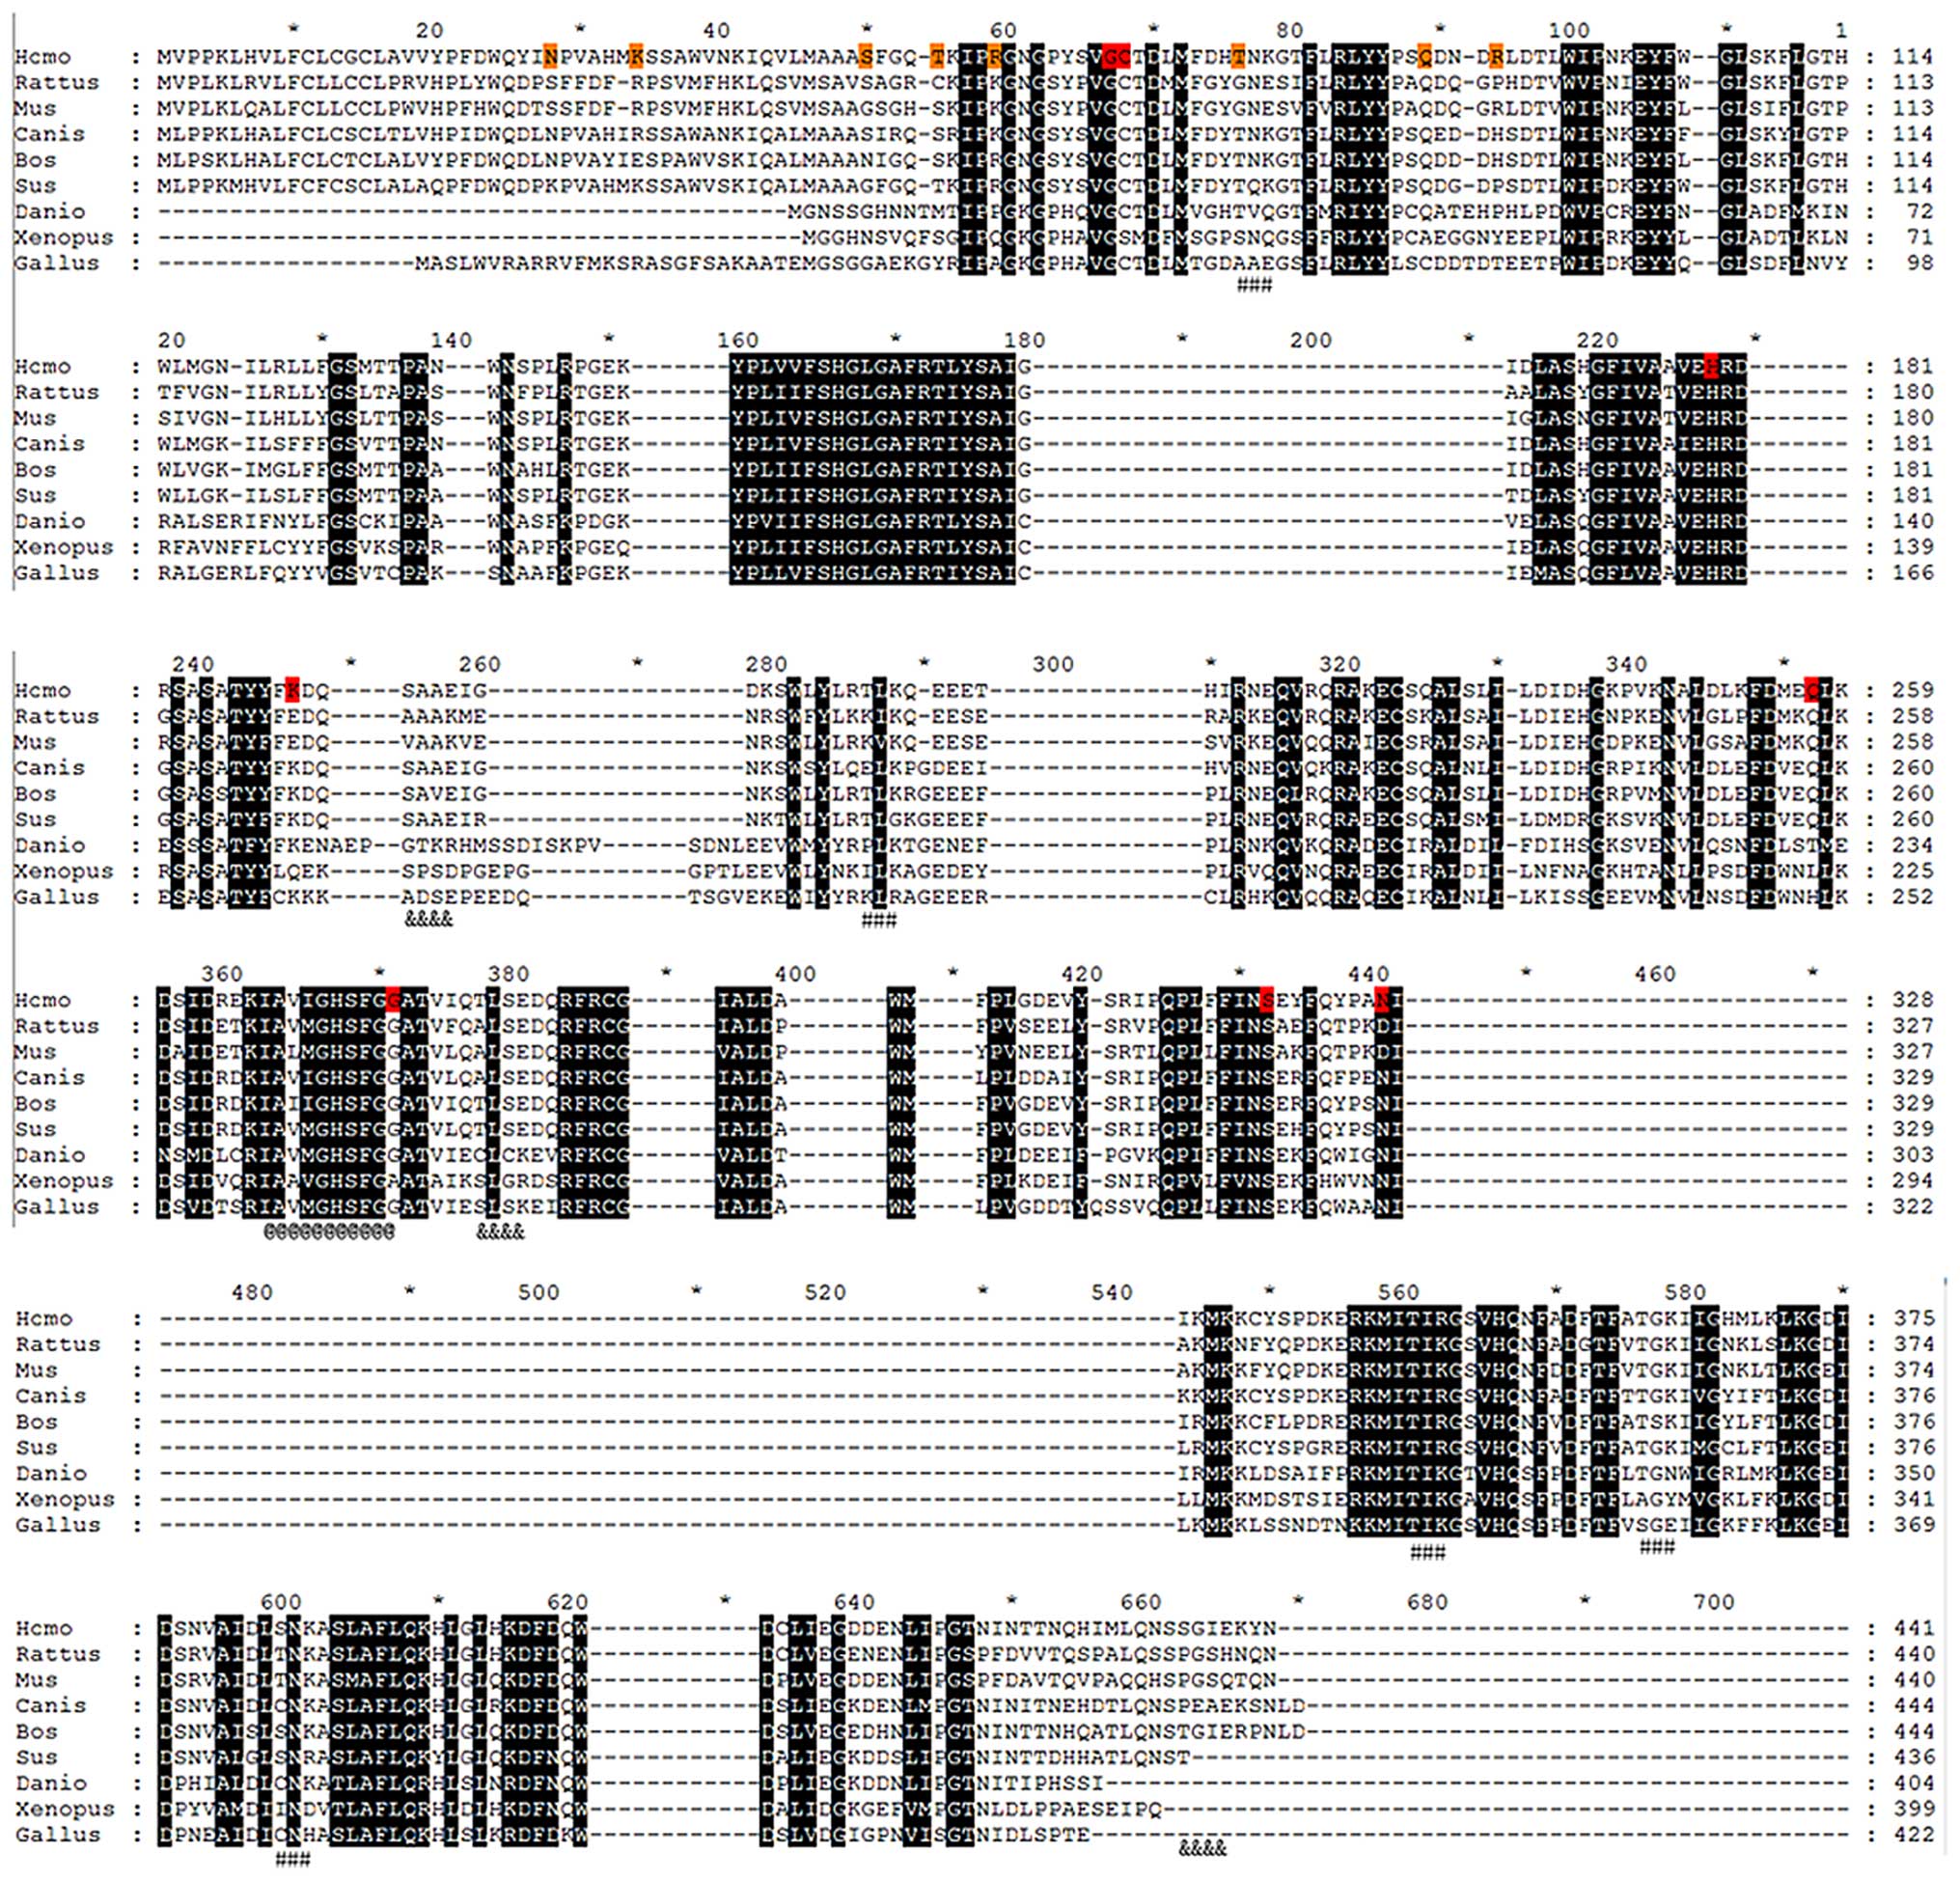
Protein structure analysis and positive
selection site marking
The protein sequence liner and 3D structure of PLA2
based on PLA2G7_Homo were created by the online tool,
PredictProtein (31) (www.predictprotein. org), and I-TASSER (32–34) (http://zhanglab.ccmb.med.umich.edu/I-TASSER/).
Functional areas were marked in Figs.
3 and 4.
Results
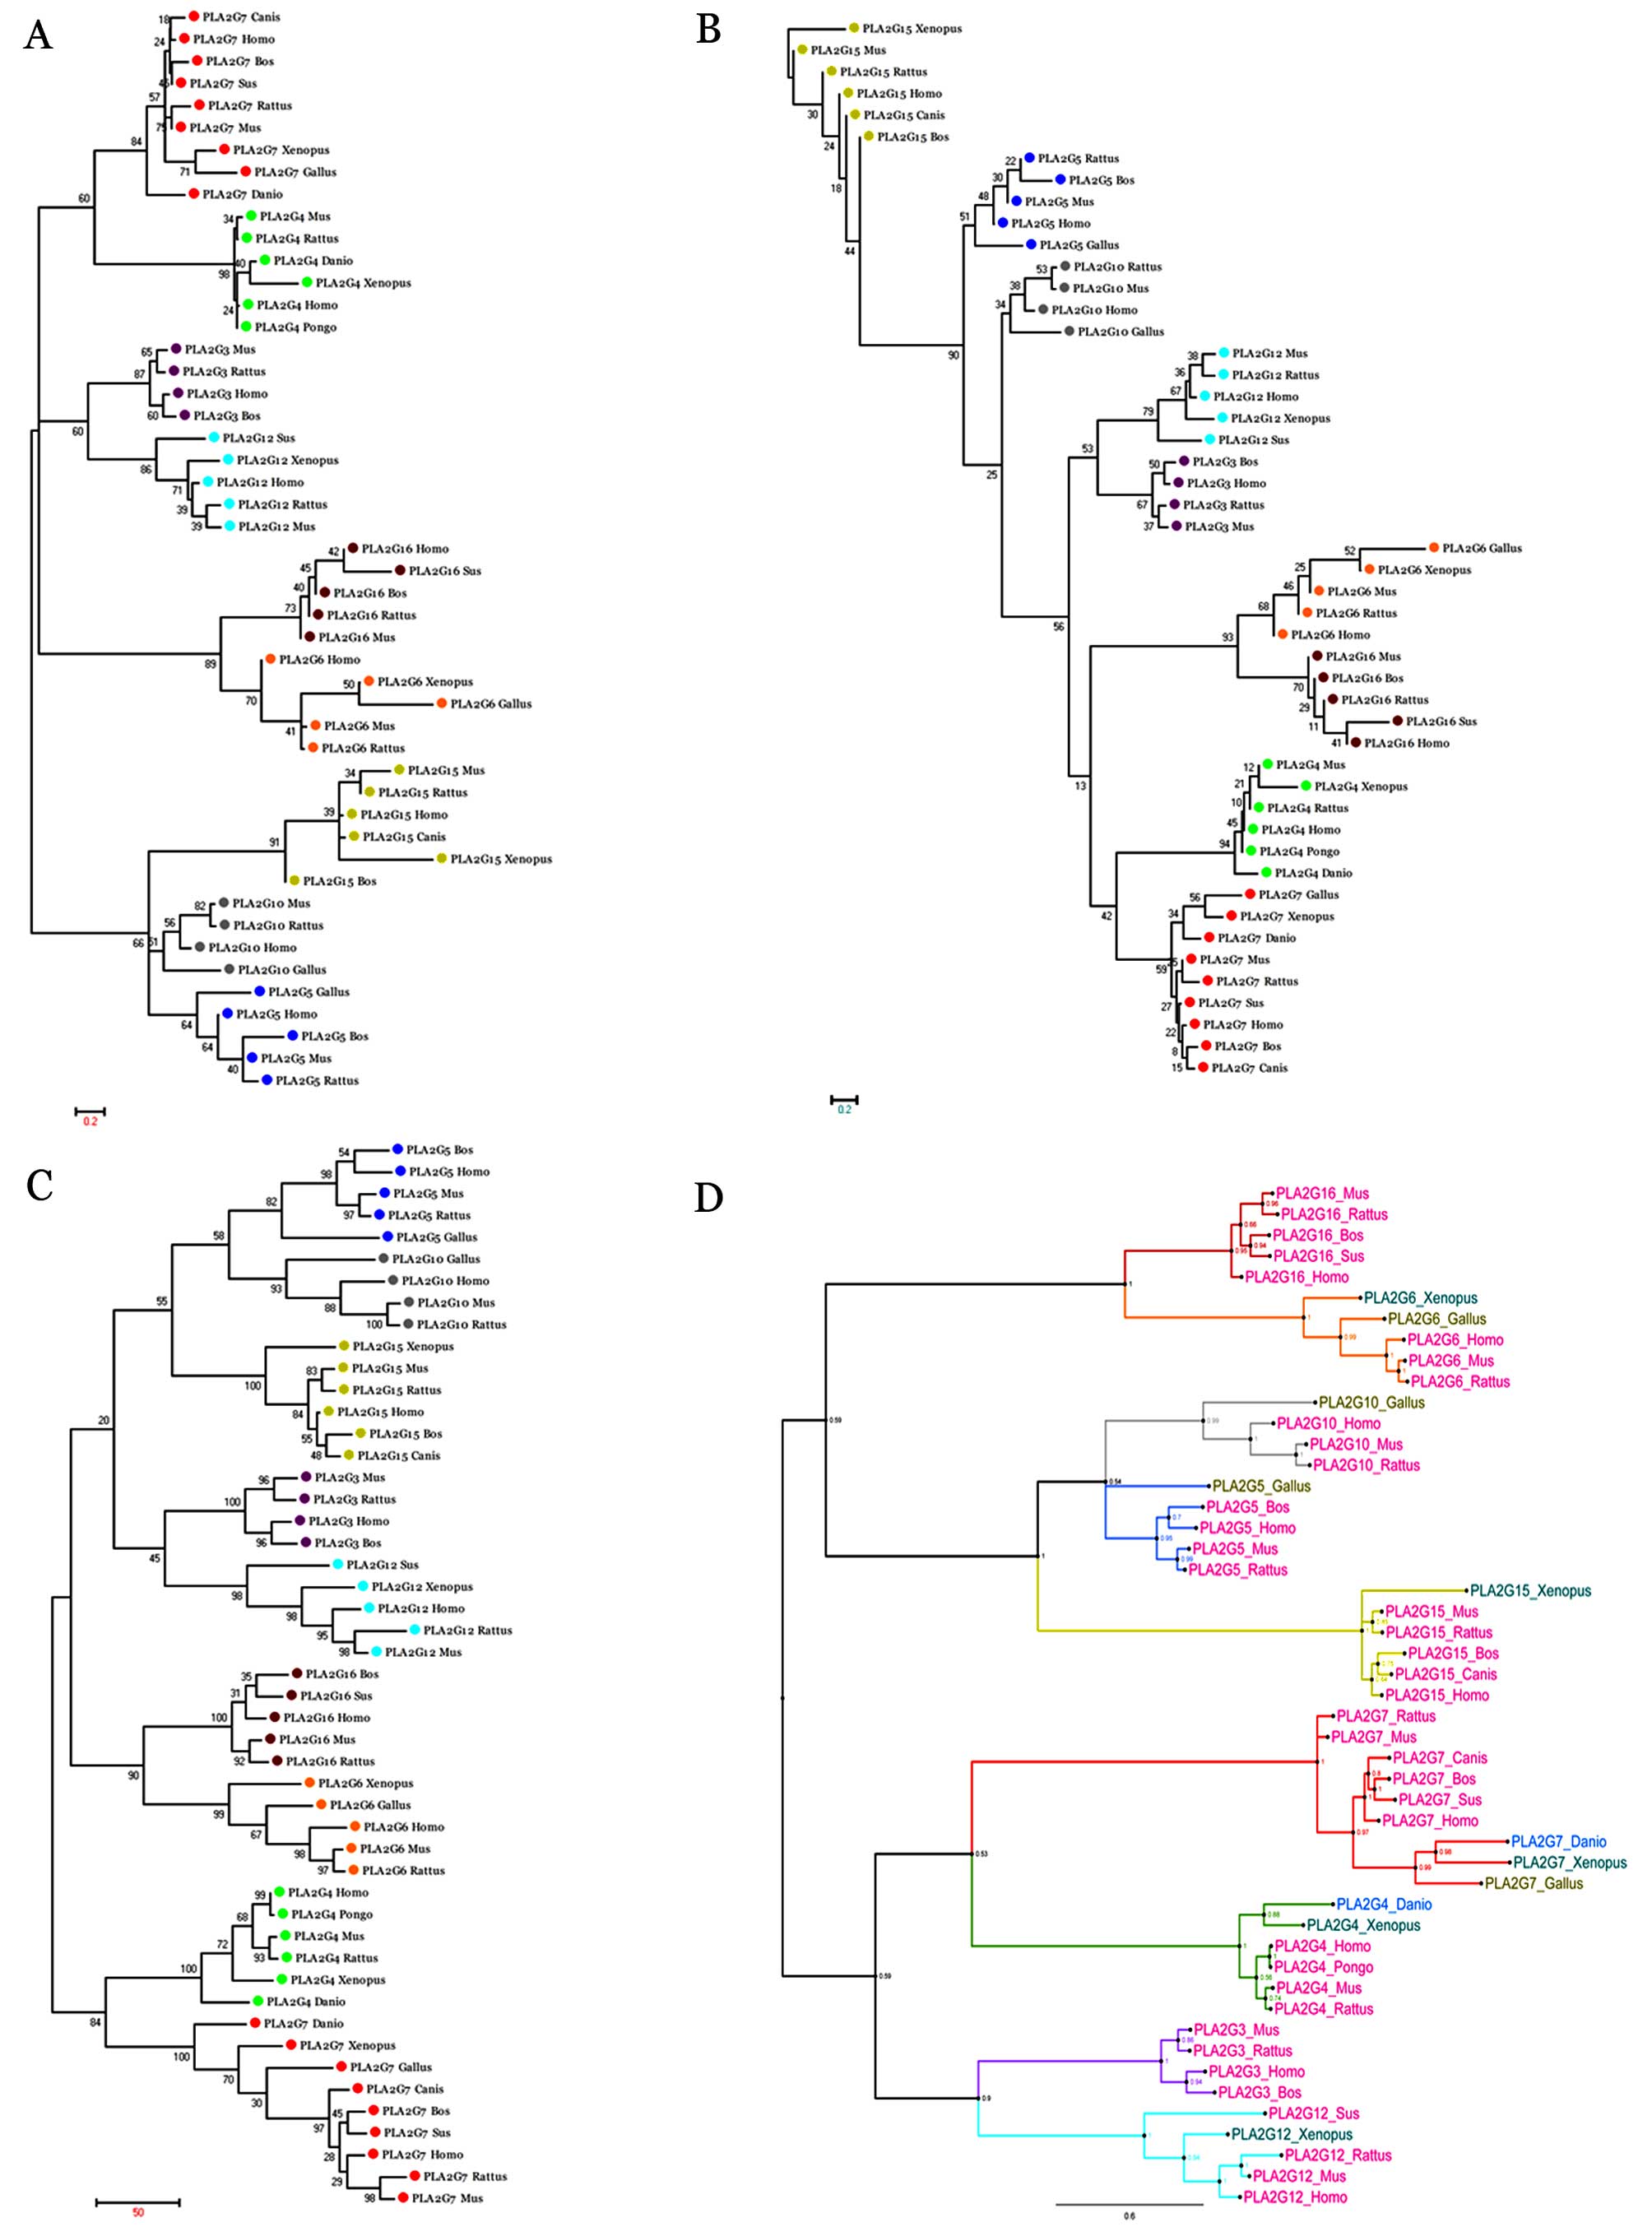
Phylogenetic analysis of PLA2 gene family
in vertebrates
A total of 49 sequences from 10 species were used to
reconstruct a phylogenetic tree for the PLA2 gene family using the
NJ, ME, MP methods, as well as the Bayesian information criterion
with bootstrap value detection. The details of the included data
are presented in Table I. A total
of 25 nodes (56.81% in total) showed bootstrap values ≥95% and 34
nodes (77.27% in total) had bootstrap values ≥80% in the Bayes
building tree (Fig. 2D). In each
subgroup, mammal data, including data from the Sumatran orangutan,
pig, Norway rat, human, house mouse, dog and cattle were gathered.
The data from the African clawed frog, chicken and zebrafish were
much more original than those from mammals, indicating that the
taxonomy of host organisms reflects the phylogenetic background of
the PLA2 gene family. The vertebrate PLA2 gene family was sorted
into nine lineages according to the type of reaction for catalyzing
phospholipids. PLA2G7 seems to be the most distant lineage in this
gene family, indicating a large number of structural changes
accumulating on them. Furthermore, all the groups were divided into
two major clades; clade 1 included PLA2G16, PLA2G6, PLA2G10, PLA2G5
and PLA2G15, whereas clade 2 included PLA2G7, PLA2G4, PLA2G3 and
PLA2G12. Closer lineages were observed between PLA2G16 and PLA2G6,
PLA2G7 and PLA2G4, PLA2G3 and PLA2G12, well as among PLA2G10,
PLA2G5 and PLA2G15. Moreover, the phylogenetic relationships
obtained by the NJ, ME and MP methods were different (Fig. 2A–C).
 | Table IData on PLA2 subfamily in
vertebrates. |
Table I
Data on PLA2 subfamily in
vertebrates.
| Abb | Species | Country | Year | NCBI-PID | NCBI-GID | Chromosome | Taxonomic
groups |
|---|
| PLA2G7_Xenopus | African clawed
frog | USA | 2002 | NP_001017267.1 | NM_001017267.2 | Un | Amphibians |
| PLA2G7_Sus | Pig | Belgium | 2009 | NP_001106484.1 | NM_001113013.1 | 7 | Mammals |
| PLA2G7_Rattus | Norway rat | Sweden | 2012 | NP_001009353.1 | NM_001009353.1 | 9 | Mammals |
| PLA2G7_Mus | House mouse | China | 2013 | NP_038765.2 | NM_013737.5 | 17 | Mammals |
| PLA2G7_Homo | Human | China | 2013 | NP_001161829.1 | NM_001168357.1 | 6 | Mammals |
| PLA2G7_Gallus | Chicken | USA | 1995 | NP_990300.1 | NM_204969.1 | 3 | Birds |
| PLA2G7_Danio | Zebrafish | China | 2004 | NP_998354.1 | NM_213189.1 | 20 | Fish |
| PLA2G7_Canis | Dog | USA | 1995 | NP_001003198.1 | NM_001003198.1 | 12 | Mammals |
| PLA2G7_Bos | Cattle | USA | 2009 | NP_777003.2 | NM_174578.4 | 23 | Mammals |
| PLA2G6_Xenopus | African clawed
frog | USA | 2002 | NP_001072661.1 | NM_001079193.1 | Un | Amphibians |
| PLA2G6_Rattus | Norway rat | Germany | 2012 | NP_001005560.1 | NM_001005560.1 | 7 | Mammals |
| PLA2G6_Mus | House mouse | Japan | 2013 | NP_001185954.1 | NM_001199025.1 | 15 | Mammals |
| PLA2G6_Homo | Human | Brazil | 2013 | NP_003551.2 | NM_003560.2 | 22 | Mammals |
| PLA2G6_Gallus | Chicken | Austria | 2008 | NP_001124210.1 | NM_001130738.1 | 1 | Birds |
| PLA2G5_Rattus | Norway rat | UK | 2004 | NP_058870.1 | NM_017174.1 | 5 | Mammals |
| PLA2G5_Mus | House mouse | USA | 2013 | NP_001116426.1 | NM_001122954.1 | 4 | Mammals |
| PLA2G5_Homo | Human | USA | 2013 | NP_000920.1 | NM_000929.2 | 1 | Mammals |
| PLA2G5_Gallus | Chicken | - | - | NP_001264973.1 | NM_001278044.1 | 21 | Birds |
| PLA2G5_Bos | Cattle | USA | 2009 | NP_001179981.1 | NM_001193052.1 | 2 | Mammals |
| PLA2G4_Xenopus | African clawed
frog | USA | 2002 | NP_001080867.1 | NM_001087398.1 | Un | Amphibians |
| PLA2G4_Rattus | Norway rat | USA | 2011 | NP_598235.2 | NM_133551.2 | 13 | Mammals |
| PLA2G4_Pongo | Sumatran
orangutan | - | - | NM_001132692.1 | NP_001126164.1 | 1 | Mammals |
| PLA2G4_Mus | House mouse | Japan | 2013 | NP_032895.1 | NM_008869.3 | 1 | Mammals |
| PLA2G4_Homo | Human | Japan | 2013 | NP_077734.1 | NM_024420.2 | 1 | Mammals |
| PLA2G4_Danio | Zebrafish | USA | 2013 | NP_571370.1 | NM_131295.2 | 2 | Fish |
| PLA2G3_Rattus | Norway rat | Singapore | 2013 | NP_001099485.1 | NM_001106015.1 | 14 | Mammals |
| PLA2G3_Mus | House mouse | Japan | 2013 | NP_766379.2 | NM_172791.2 | 11 | Mammals |
| PLA2G3_Homo | Human | Spain | 2013 | NP_056530.2 | NM_015715.3 | 22 | Mammals |
| PLA2G3_Bos | Cattle | USA | 2009 | NP_001074379.1 | NM_001080910.1 | 17 | Mammals |
| PLA2G16_Sus | Pig | Japan | 2007 | NP_001231443.1 | NM_001244514.1 | 2 | Mammals |
| PLA2G16_Rattus | Norway rat | France | 2001 | NP_058756.2 | NM_017060.2 | 1 | Mammals |
| PLA2G16_Mus | House mouse | Japan | 2012 | NP_644675.2 | NM_139269.2 | 19 | Mammals |
| PLA2G16_Homo | Human | USA | 2012 | NP_009000.2 | NM_007069.3 | 11 | Mammals |
| PLA2G16_Bos | Cattle | China | 2012 | NP_001068748.1 | NM_001075280.2 | 29 | Mammals |
|
PLA2G15_Xenopus | African clawed
frog | USA | 2002 | NP_001089365.1 | NM_001095896.1 | Un | Amphibians |
| PLA2G15_Rattus | Norway rat | Japan | 2005 | NP_001004277.1 | NM_001004277.2 | 19 | Mammals |
| PLA2G15_Mus | House mouse | USA | 2013 | NP_598553.1 | NM_133792.2 | 8 | Mammals |
| PLA2G15_Homo | Human | Canada | 2010 | NP_036452.1 | NM_012320.3 | 16 | Mammals |
| PLA2G15_Canis | Dog | USA | 2007 | NP_001002940.1 | NM_001002940.1 | 5 | Mammals |
| PLA2G15_Bos | Cattle | USA | 2009 | NP_776985.2 | NM_174560.2 | 18 | Mammals |
|
PLA2G12_Xenopus | African clawed
frog | USA | 2003 | NP_001017096.1 | NM_001017096.2 | Un | Amphibians |
| PLA2G12_Sus | Pig | Japan | 2007 | NP_001230267.1 | NM_001243338.1 | 14 | Mammals |
| PLA2G12_Rattus | Norway rat | USA | 2002 | NP_001102035.1 | NM_001108565.1 | 2 | Mammals |
| PLA2G12_Mus | House mouse | Italy | 2011 | NP_075685.2 | NM_023196.4 | 3 | Mammals |
| PLA2G12_Homo | Human | Canada | 2010 | NP_110448.2 | NM_030821.4 | 4 | Mammals |
| PLA2G10_Rattus | Norway rat | France | 1999 | NP_058872.1 | NM_017176.2 | 10 | Mammals |
| PLA2G10_Mus | House mouse | Japan | 2013 | NP_036117.1 | NM_011987.2 | 16 | Mammals |
| PLA2G10_Homo | Human | Iran | 2013 | NP_003552.1 | NM_003561.1 | 16 | Mammals |
| PLA2G10_Gallus | Chicken | - | - | NP_001171686.1 | NM_001184757.1 | 14 | Birds |
Analysis of positive selection sites of
the PLA2 gene family in vertebrates
Positive selection sites were also computed under
site, branch and branch-site models for the PLA2 gene family.
During site model computing, only P<0.05 and ω>1 indicated
the presence of possible positive selection sites. As a result,
only M7/M8 met the criteria (P=0.00000, w=2.52322) and showed the
following eight positive selection sites: 28N, 34K, 50S, 54T, 58R,
75T, 88Q and 92R (all positive selection sites mentioned in this
manuscript refer to amino acids of PLA2G7) (Table II).
| Table IIParameter estimates and likelihood
scores of PLA2 for site models in PAML. |
Table II
Parameter estimates and likelihood
scores of PLA2 for site models in PAML.
| Model | np | Estimates of
parameters | lnL | LRT pairs | df | 2ΔlnL | p-value | Positively selected
sites BEB (%) |
|---|
| M0:one ratio | 94 | ω=0.16513 | −41914.67 | M0/M3 | 4 | 366.4
5.04128E-78 | | None |
| M3:discrete | 98 |
p0=0.18381,
p1=0.61322, p2=0.20297,
ω0=0.06840
ω1=0.14537,ω2=0.42278 | −41731.47 | |
| M1a:neutral | 95 |
p0=0.92349,
p1=0.07651,ω0=0.15503,
ω1=1.00000 | −41830.79 | M1a/M2a | 2 | 0 | 1.00000 | 33M (55.5), 34K
(52.8) |
| M2a:selection | 97 |
p0=0.92349,
p1=0.03595, p2=0.04056,
ω0=0.15503, ω1=1.00000,
ω2=1.00000 | −41830.79 | |
| M7:β | 95 | p=2.25732,
q=10.02539 | −45800.80 | M7/M8 | 2 | 8103.86 | 0.00000 | 28N (65.8), 34K
(53.7), 50S (60.4), 54T (64.6), 58R (64.9), 75T (70.0), 88Q (77.2),
92R (50.1) |
| M8:β and ω | 97 |
p0=0.99999, p=0.17653,
q=1.31411, p1=0.00001, ω=2.52322 | −41748.87 | |
Additional calculations were performed to confirm
and supplement the results. The branch model was used for positive
branch selection. The free-ratio model was significantly higher
than the one-ratio model (2ΔlnL=694.2, p=1.306E-93, df=185),
indicating heterogeneous selection among branches. Two-ratio models
were used using the selected 12 branches; the results revealed that
two models (Td and Tf) were significantly different (Pd=3.978E-08,
Pf=0.017) at ω>1. Subsequently, branch-site models were used to
search for amino acid sites that underwent positive selection in
the statistically significant foreground branches Td and Tf
(Table III).
| Table IIIParameter estimates and likelihood
scores of PLA2 for site models in PAML parameter estimates and
likelihood scores of PLA2 for branch models in PAML. |
Table III
Parameter estimates and likelihood
scores of PLA2 for site models in PAML parameter estimates and
likelihood scores of PLA2 for branch models in PAML.
| Model | np | Estimates of
parameters | lnL | LRT pairs | df | 2ΔlnL | p-value |
|---|
| Fr:free ratios | 185 | | −41567.57 | M0/Fr | 91 | 694.2 |
1.306E-93 |
| Tx:two ratios |
| Ta | 95 |
ω0=0.1649,
ωa=3.6122 | −41913.33 | M0/Ta | 1 | 2.68 | 0.102 |
| Tb | 95 |
ω0=0.1645,
ωb=49.9559 | −41914.34 | M0/Tb | 1 | 0.66 | 0.417 |
| Tc | 95 |
ω0=0.1651,
ωc=21.4714 | −41917.97 | M0/Tc | 1 | 6.6 | 0.010 |
| Td | 95 |
ω0=0.1594,
ωd=37.8875 | −41899.59 | M0/Td | 1 | 30.16 |
3.978E-08 |
| Te | 95 |
ω0=0.1652,
ωe=59.5984 | −41914.39 | M0/Te | 1 | 0.56 | 0.454 |
| Tf | 95 |
ω0=0.1666,
ωf=87.3449 | −41911.84 | M0/Tf | 1 | 5.66 | 0.017 |
| Tg | 95 |
ω0=0.1656,
ωg=51.0797 | −41914.47 | M0/Tg | 1 | 0.4 | 0.527 |
| Th | 95 |
ω0=0.1650,
ωh=34.3683 | −41914.62 | M0/Th | 1 | 0.1 | 0.752 |
| Ti | 95 |
ω0=0.1653,
ωi=49.6517 | −41914.51 | M0/Ti | 1 | 0.3 | 0.584 |
| Tj | 95 |
ω0=0.1650,
ωj=37.3306 | −41914.52 | M0/Tj | 1 | 0.3 | 0.584 |
| Tk | 95 |
ω0=0.1650,
ωk=21.5084 | −41914.66 | M0/Tk | 1 | 0.02 | 0.888 |
| Tl | 95 |
ω0=0.1655,
ωl=24.4651 | −41914.55 | M0/Tl | 1 | 0.24 | 0.624 |
Calculation parameters were set as model=2 and
Nsite=2 in PAML package version 4.4. The H1 vs. H0 models of the
two branches were differed significantly. Eight amino acid sites
were found in branch df: 276G, 191K, 327D, 319S, 66G, 67C, 179G and
257Q (Table IV).
| Table IVParameter estimates and likelihood
scores of PLA2 for branch-site models in PAML. |
Table IV
Parameter estimates and likelihood
scores of PLA2 for branch-site models in PAML.
| Model | np | Estimates of
parameters | lnL | LRT pairs | df | 2ΔlnL | p-value | Positively selected
sites BEB (%) |
|---|
| BSa1 | 97 |
p0=0.78310,
p1=0.05618, p2a=0.14996,
p2b=0.01076, ω0=0.15077,
ω1=1.00000, b:ω2a=0.15077,
ω2b=1.00000, f:ω2a=999.00000,
ω2b=999.00000 | −41811.53 | BSa1/BSa0-fix | 1 | 17.62 | 2.70E-05 | 276G
(61.7)
191K (58.8)
327D (58.7)
319S (58.2) |
| BSa0-fix | 96 |
p0=0.64515,
p1=0.04724, p2a=0.28662,
p2b=0.02099
ω0=0.15015, ω1=1.00000,
b:ω2a=0.15015, ω2b=0.15015,
f:ω2a=1.00000, ω2b=1.00000 | −41820.34 | |
| BSb1 | 97 |
p0=0.89293,
p1=0.07409, p2a=0.03045,
p2b=0.00253, w0=0.15484,
ω1=1.00000, b:ω2a=0.15484,
ω2b=1.00000, f:ω2a=111.98807,
ω2b=111.98807 | −41828.90 | BSb1/BSb0-fix | 1 | 3.34 | 6.76E-02 | 66G
(88.2)
67C (89.7)
179H (75.9)
257Q (58.0) |
| BSb0-fix | 96 |
p0=0.89547,
p1=0.07423, p2a=0.02798,
p2b=0.00232, w0=0.15479,
ω1=1.00000, b:ω2a=0.15479,
ω2b=1.00000, f:ω2a=1.00000,
ω2b=1.00000 | −41830.57 | |
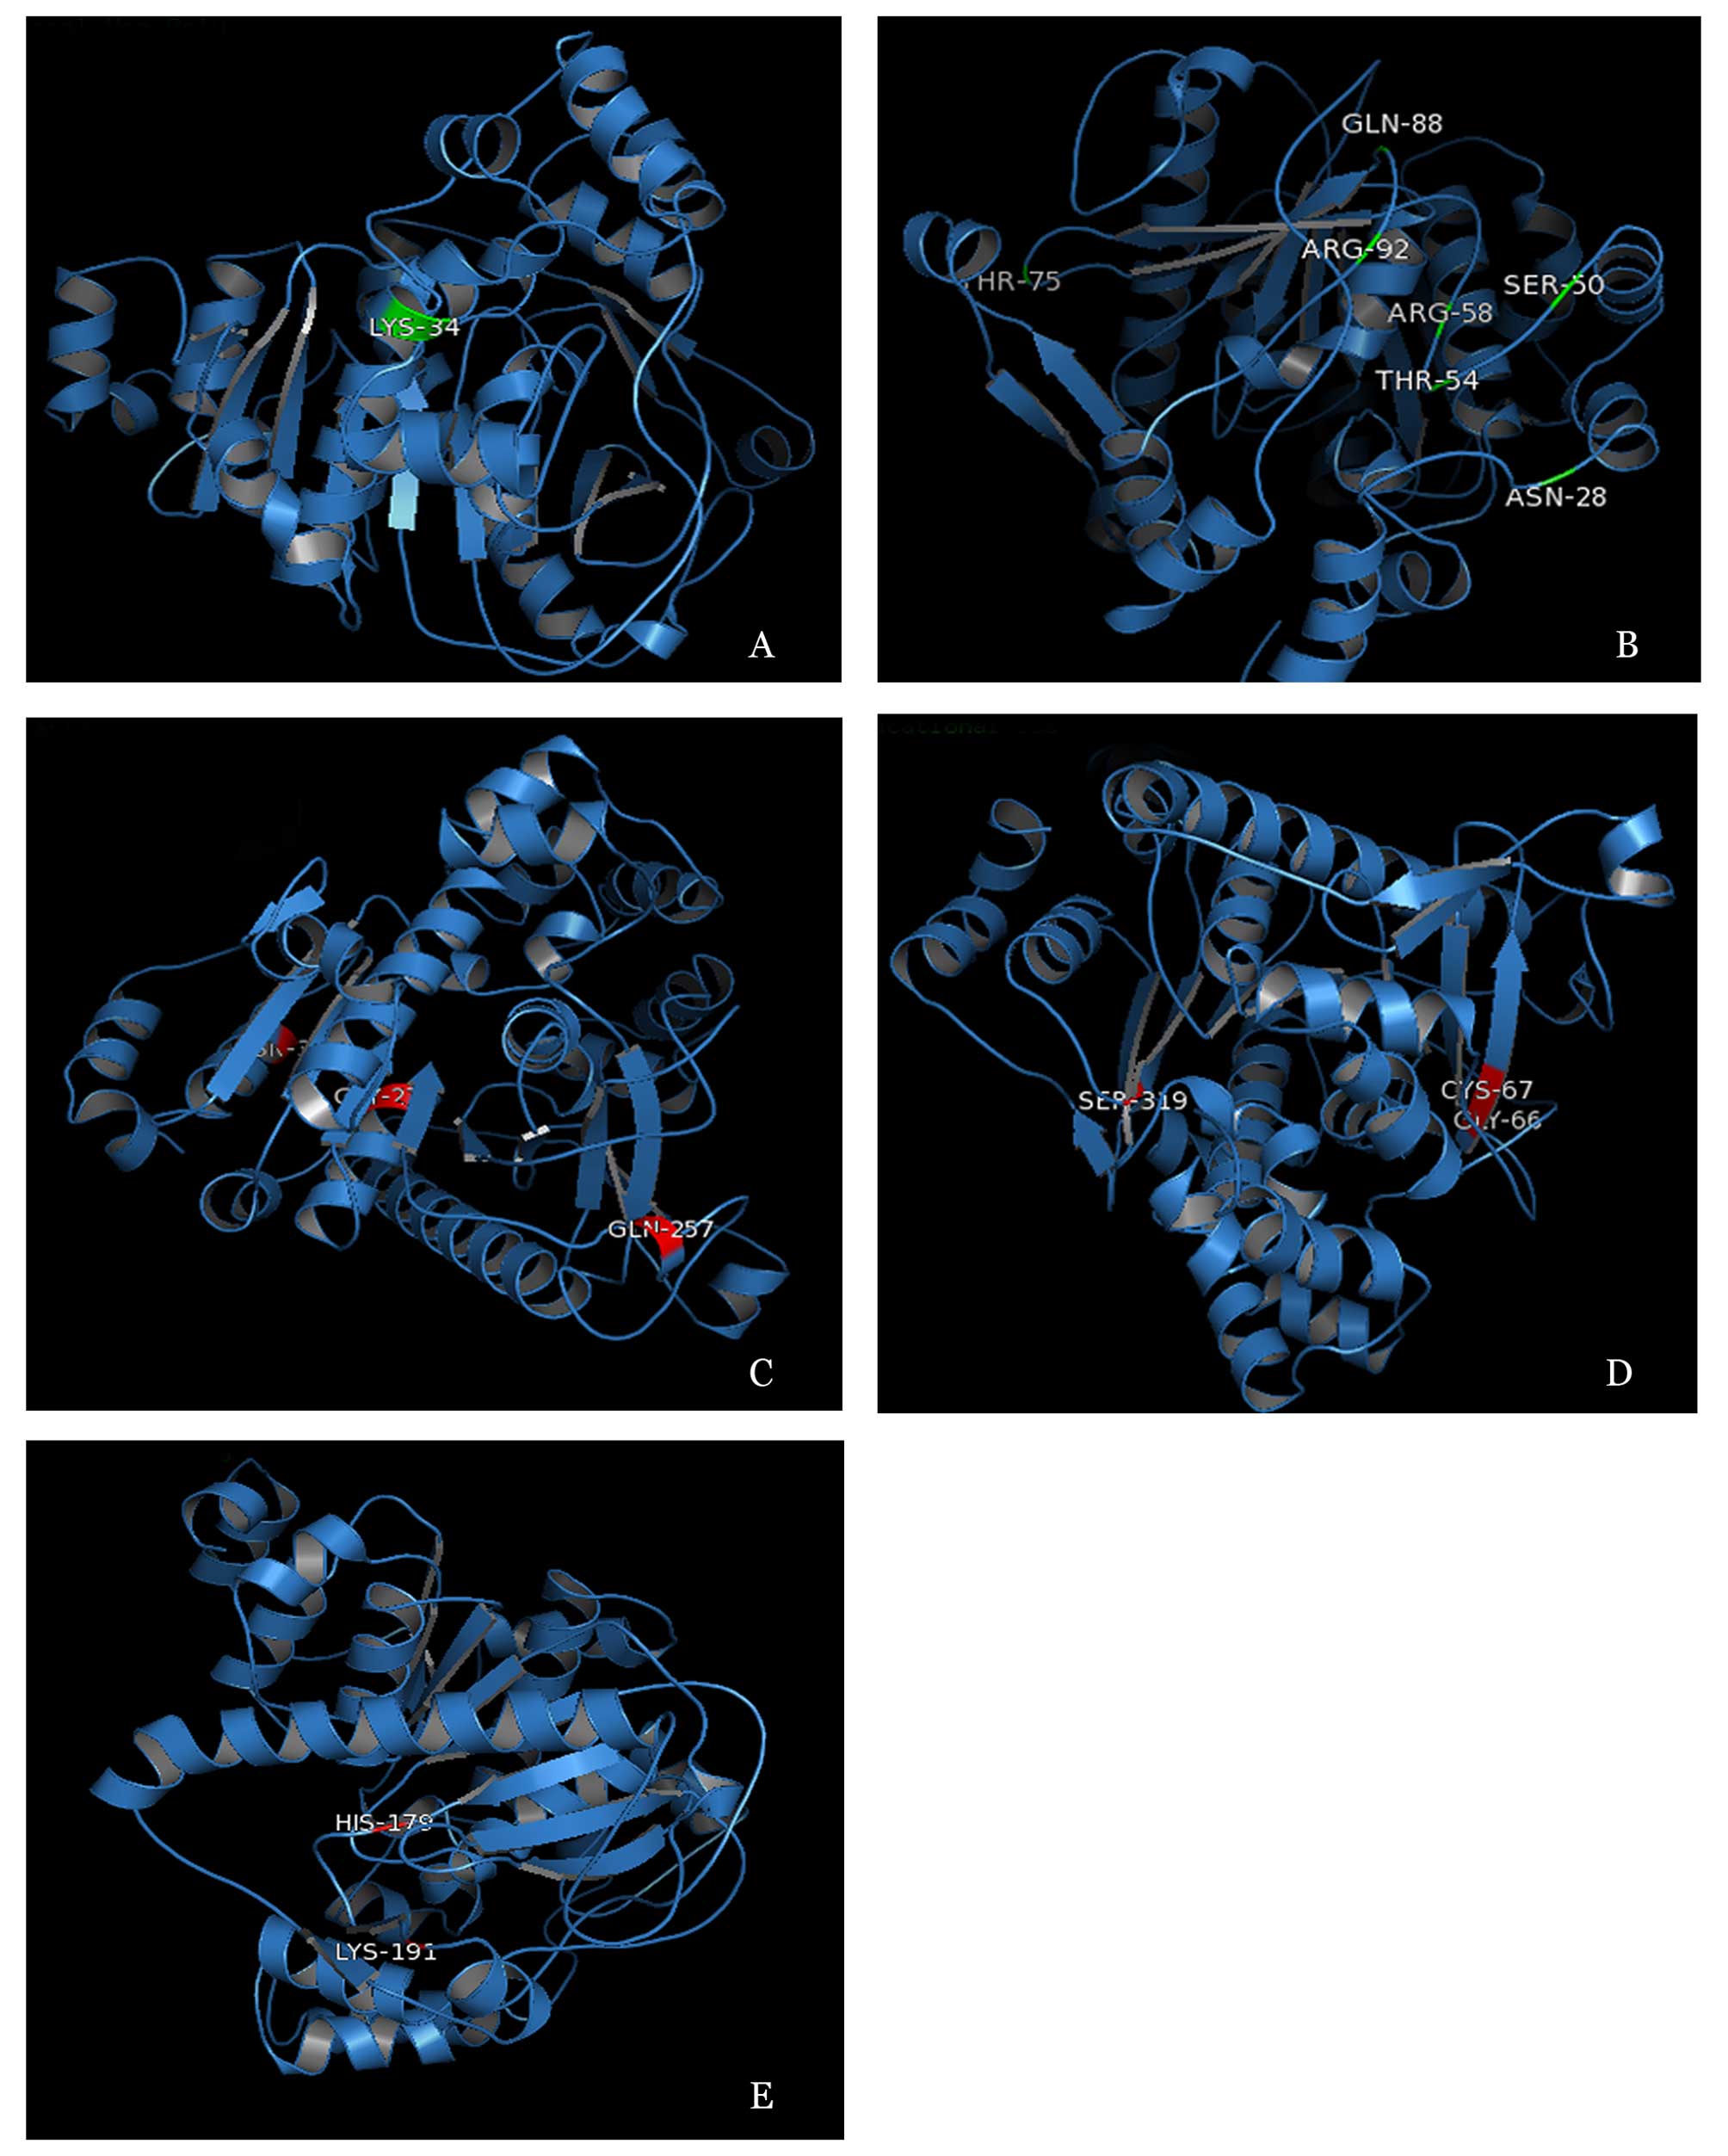
Using I-TASSER (32–34) (http://zhanglab.ccmb.med.umich.edu/I-TASSER/), four
positive selection sites, 327D, 257Q, 276G and 34s, were located in
α-helix; three positive selection sites, 66G, 67C and 319S, were
located in β-sheet; and nine positive selection sites, 28N, 50S,
54T, 58R, 75T, 88Q, 92R, 179H and 191K, were located in random
coil. All details of the positive selection sites are presented in
Table V. A planar structure of
all positive selection sites is presented in Fig. 3. Positive selection sites, which
were detected by site models are three-dimensionally presented in
Fig. 4A and B. Positive selection
sites, which were detected by branch and branch-site models, are
three-dimensionally presented in Fig.
4C–E.
| Table VPositive selection sites by site
model, branch model and site-branch model. |
Table V
Positive selection sites by site
model, branch model and site-branch model.
| Location | Amino acid | Secondary
struscture | Posterior
probability (%) | Model |
|---|
| 28 | Asn | Random coil | 65.8 | Site model |
| 34 | Lys | α-helix | 53.7 | Site model |
| 50 | Ser | Random coil | 60.4 | Site model |
| 54 | Thr | Random coil | 64.6 | Site model |
| 58 | Arg | Random coil | 64.9 | Site model |
| 66 | Gly | β-pleated
sheet | 88.2 | Branch model and
branch-site model |
| 67 | Cys | β-pleated
sheet | 89.7 | Branch model and
branch-site model |
| 75 | Thr | Random coil | 70.0 | Site model |
| 88 | Gln | Random coil | 77.2 | Site model |
| 92 | Arg | Random coil | 50.1 | Site model |
| 179 | His | Random coil | 75.9 | Branch model and
branch-site model |
| 191 | Lys | Random coil | 58.8 | Branch model and
branch-site model |
| 257 | Gln | α-helix | 58.0 | Branch model and
branch-site model |
| 276 | Gly | α-helix | 61.7 | Branch model and
branch-site model |
| 319 | Ser | β-pleated
sheet | 58.2 | Branch model and
branch-site model |
| 327 | Asn | α-helix | 58.7 | Branch model and
branch-site model |
Distribution of positive selection
sites
The functional areas on the AA sequence of
PLA2G7_Homo were predicted by PredictProtein. The positive
selection site 276G was located in the serine active site, 75T was
located in the protein kinase C phosphorylation site and 191K was
located near the casein kinase II phosphorylation site.
Discussion
Available natural and complete sequences of the
phospholipase gene family in humans and the PLA2 gene family of
vertebrates from the NCBI database were included in the present
study. The phospholipase and PLA2 gene families showed different
phylogenetic backgrounds and relationships according to the method
used for determination (the NJ, ME, MP methods and the Bayesian
information criterion). This difference may be attributed to the
weakness of these methods. The NJ method focuses on one final
topology with branch length estimates, and the observed differences
between sequences are inaccurate reflections of the evolutionary
distances (35). The construction
of an ME tree is time consuming, and examining all topologies is
difficult (36). The MP method
lacks statistical consistency and does not guarantee the production
of a true tree with high probability, given sufficient data
(37). Bayesian analysis, which
is widely accepted as the most valuable method in phylogenetic
analysis and the estimation of positive selection sites, was also
employed (26).
The PLA2 family is the most complex gene family of
phospholipases (38,39). The majority of PLA2 genes encode
secreted enzymes with physiological features involved in catalyzing
platelet activity (40),
controlling lipid metabolism (2)
and mediating inflammations (5).
The dysfunction of these genes may lead to stroke (14).
The PLA2G7 coding enzyme, Lp-PLA2, has attracted
considerable attention due to its crucial function in platelet
gathering in cardiovascular and cerebrovascular diseases (11). Lp-PLA2 is a new biological marker
for detecting vasculitis (41).
Unlike multiple clinical trials and diagnostic estimations of
Lp-PLA2 mass and activity in the circulation (18), data on the phylogenetic background
of the PLA2 gene family and the positive selection of amino acid
residues on PLA2G7 genes are limited (42–44).
According to the PLA2 phylogenetic tree built using
the Bayesian information criterion, PLA2G7 is one of the most
evolutionarily distant members of PLA2 proteins, an indication of a
fast-evolving lineage with numerous structural changes. Moreover,
lineage-specific expansion and divergence events were not observed
from low-order to high-order vertebrates. The first duplication of
the PLA2G7 group led to the emergence of lineages in the Norway rat
and the house mouse, and the residual mammals shared duplication
with birds, fish and amphibians. Thus, at least two duplications
are present in mammals. Moreover, the PLA2G4 family presented the
closest lineage to the PLA2G7 family, indicating that PLA2G4 may be
another gene that mediates platelet gathering.
In the present study, we identified specific amino
acid residues of PLA2G7, which are targets of positive selection.
According to the site model result, eight positive selection sites,
28N, 34K, 50S, 54T, 58R, 75T, 88Q and 92R, were found, and eight
amino acid sites, 276G, 191K, 327D, 319S, 66G, 67C, 179G and 257Q,
were found by the branch and branch-site models. No identical
positive selection sites were found among the site, branch and
branch-site models.
Functional structure, the protein kinase C
phosphorylation site (45), the
casein kinase II phosphorylation site (46) and the serine active site (47) were widely scattered along the
PLA2G7 peptide chain. The serine active site is a conserved region
centered on a serine residue and has the function of catalyzing
fatty acid transfer between phosphatidylcholine and cholesterol.
According to the Bayesian analysis, a positive selection site,
276G, was located on serine active region, indicating its similar
function. It has been previoulsy demonstrated that Lp-PLA2 mediates
atherosclerosis by promoting platelet gathering and adherence to
vessels (48) and a previous
study (49) suggests that, apart
from promoting platelet gathering, Lp-PLA2 may also alter
cholesterol metabolism in atherosclerosis. Protein kinase C can
modify the function of a protein by increasing or decreasing the
protein's activity, stabilizing it or marking it for destruction.
The positive selection site, 75T, located on the protein kinase C
phosphorylation site, indicated its function on altering Lp-PLA2
activity. Casein kinase II is a protein kinase that phosphorylates
many different proteins and is relevant to changes in macrophage
gene expression during atherosclerosis (50). We found that 191K was located near
the casein kinase II phosphorylation site, indicating that Lp-PLA2
may also increase macrophage gene expression in atherosclerosis.
However, further validation of such sites is required in order to
obtain richer experimental data.
In conclusion, the PLA2 gene family is the most
complex gene family among the phospholipases. A number of studies,
including clinical trials have focused on the diagnostic estimation
of the mass and activity of PLA2 coding enzymes in the circulation
(18,51,52); however, phylogenetic analyses of
the PLA2 gene family and positive selection amino acid residues on
PLA2G7 genes are limited. The present study focused on the
phospholipase and PLA2 gene families employing phylogenetic
analysis using the NJ, ME and MP methods, as well as the Bayesian
information criterion. Positive selection sites were detected for
the PLA2 family using site, branch and branch-site models. A total
of 49 sequences from 10 different species were selected for the
analysis. Phylogenetic analysis of the PLA2 gene family in
vertebrates suggests that PLA2G5 is the origin of this gene family,
and that PLA2G7 is one of the most evolutionarily distant PLA2
proteins. Eight positive selection sites were detected using the
site model, whereas eight positive selection sites were detected
using the branch and branch-site models.
References
|
1
|
Heinrikson RL, Krueger ET and Keim PS:
Amino acid sequence of phospholipase A2-alpha from the venom of
Crotalus adamanteus. A new classification of phospholipases A2
based upon structural determinants. J Biol Chem. 252:4913–4921.
1977.PubMed/NCBI
|
|
2
|
de Beer FC and Webb NR: Inflammation and
atherosclerosis: Group IIa and Group V sPLA2 are not redundant.
Arterioscler Thromb Vasc Biol. 26:1421–1422. 2006. View Article : Google Scholar : PubMed/NCBI
|
|
3
|
Starkl P, Marichal T and Galli SJ: PLA2G3
promotes mast cell maturation and function. Nat Immunol.
14:527–529. 2013. View
Article : Google Scholar : PubMed/NCBI
|
|
4
|
Mackenzie LS, Lymn JS and Hughes AD:
Linking phospholipase C isoforms with differentiation function in
human vascular smooth muscle cells. Biochim Biophys Acta.
1833.3006–3012. 2013.
|
|
5
|
Clark JD, Schievella AR, Nalefski EA and
Lin LL: Cytosolic phospholipase A2. J Lipid Mediat Cell Signal.
12:83–117. 1995. View Article : Google Scholar : PubMed/NCBI
|
|
6
|
Johansson P and Thesleff S: A comparison
of the effects of phos-pholipase C and tetrodotoxin on spike
generation in muscle. Eur J Pharmacol. 4:347–348. 1968. View Article : Google Scholar : PubMed/NCBI
|
|
7
|
Jackson TN, Sunagar K, Undheim EA, et al:
Venom down under: dynamic evolution of Australian elapid snake
toxins. Toxins (Basel). 5:2621–2655. 2013. View Article : Google Scholar
|
|
8
|
Margres MJ, Aronow K, Loyacano J and
Rokyta DR: The venom-gland transcriptome of the eastern coral snake
(Micrurus fulvius) reveals high venom complexity in the
intragenomic evolution of venoms. BMC Genomics. 14(531): 2013
|
|
9
|
Dennis EA: Diversity of group types,
regulation, and function of phospholipase A2. J Biol Chem.
269:13057–13060. 1994.PubMed/NCBI
|
|
10
|
Smith AD and Winkler H: Lysosomal
phospholipases A1 and A2 of bovine adrenal medulla. Biochem J.
108:867–874. 1968.PubMed/NCBI
|
|
11
|
Pan YH, Yu BZ, Berg OG, Jain MK and
Bahnson BJ: Crystal structure of phospholipase A2 complex with the
hydrolysis products of platelet activating factor: equilibrium
binding of fatty acid and lysophospholipid-ether at the active site
may be mutually exclusive. Biochemistry. 41:14790–14800. 2002.
View Article : Google Scholar : PubMed/NCBI
|
|
12
|
Ohtsuki T, Watanabe H, Toru M and Arinami
T: Lack of evidence for associations between plasma
platelet-activating factor acetyl-hydrolase deficiency and
schizophrenia. Psychiatry Res. 109:93–96. 2002. View Article : Google Scholar : PubMed/NCBI
|
|
13
|
Hixon MS, Ball A and Gelb MH:
Calcium-dependent and -independent interfacial binding and
catalysis of cytosolic group IV phospholipase A2. Biochemistry.
37:8516–8526. 1998. View Article : Google Scholar : PubMed/NCBI
|
|
14
|
Retraction: CDP-choline significantly
restores phosphatidylcholine levels by differentially affecting
phospholipase A2 and CTP: phosphocholine cytidylyltransferase after
stroke. J Biol Chem. 288(7549): 2013
|
|
15
|
Fitzpatrick AL, Irizarry MC, Cushman M,
Jenny NS, Chi GC and Koro C: Lipoprotein-associated phospholipase
A2 and risk of dementia in the Cardiovascular Health Study.
Atherosclerosis. 235:384–391. 2014. View Article : Google Scholar : PubMed/NCBI
|
|
16
|
Gui YX, Xu ZP, Wen-Lv Q, Liu HM, Zhao JJ
and Hu XY: Four novel rare mutations of PLA2G6 in Chinese
population with Parkinson's disease. Parkinsonism Relat Disord.
19:21–26. 2013. View Article : Google Scholar
|
|
17
|
Farooqui AA, Ong WY and Horrocks LA:
Inhibitors of brain phospholipase A2 activity: their
neuropharmacological effects and therapeutic importance for the
treatment of neurologic disorders. Pharmacol Rev. 58:591–620. 2006.
View Article : Google Scholar : PubMed/NCBI
|
|
18
|
Holmes MV, Simon T, Exeter HJ, et al:
Secretory phospholipase A(2)-IIA and cardiovascular disease: a
mendelian randomization study. J Am Coll Cardiol. 62:1966–1976.
2013. View Article : Google Scholar : PubMed/NCBI
|
|
19
|
Ohno M, Menez R, Ogawa T, et al: Molecular
evolution of snake toxins: is the functional diversity of snake
toxins associated with a mechanism of accelerated evolution? Prog
Nucleic Acid Res Mol Biol. 59:307–364. 1998. View Article : Google Scholar : PubMed/NCBI
|
|
20
|
Edgar RC: MUSCLE: a multiple sequence
alignment method with reduced time and space complexity. BMC
Bioinformatics. 5(113): 2004
|
|
21
|
Suyama M, Torrents D and Bork P: PAL2NAL:
robust conversion of protein sequence alignments into the
corresponding codon alignments. Nucleic Acids Res. 34:W609–W612.
2006. View Article : Google Scholar : PubMed/NCBI
|
|
22
|
Kumar S, Tamura K and Nei M: MEGA3:
Integrated software for Molecular Evolutionary Genetics Analysis
and sequence alignment. Brief Bioinform. 5:150–163. 2004.
View Article : Google Scholar : PubMed/NCBI
|
|
23
|
Posada D: Using MODELTEST and
PAUP* to select a model of nucleotide substitution. Curr
Protoc Bioinformatics. Chapter 6: Unit 6.5. 2003.
|
|
24
|
Guindon S and Gascuel O: A simple, fast,
and accurate algorithm to estimate large phylogenies by maximum
likelihood. Syst Biol. 52:696–704. 2003. View Article : Google Scholar : PubMed/NCBI
|
|
25
|
Posada D and Crandall KA: MODELTEST:
testing the model of DNA substitution. Bioinformatics. 14:817–818.
1998. View Article : Google Scholar
|
|
26
|
Ronquist F and Huelsenbeck JP: MrBayes 3:
Bayesian phylogenetic inference under mixed models. Bioinformatics.
19:1572–1574. 2003. View Article : Google Scholar : PubMed/NCBI
|
|
27
|
Huelsenbeck JP and Ronquist F: MRBAYES:
Bayesian inference of phylogenetic trees. Bioinformatics.
17:754–755. 2001. View Article : Google Scholar : PubMed/NCBI
|
|
28
|
Yang Z: PAML 4: phylogenetic analysis by
maximum likelihood. Mol Biol Evol. 24:1586–1591. 2007. View Article : Google Scholar : PubMed/NCBI
|
|
29
|
Yang Z, Wong WS and Nielsen R: Bayes
empirical bayes inference of amino acid sites under positive
selection. Mol Biol Evol. 22:1107–1118. 2005. View Article : Google Scholar : PubMed/NCBI
|
|
30
|
Nielsen R and Yang Z: Likelihood models
for detecting positively selected amino acid sites and applications
to the HIV-1 envelope gene. Genetics. 148:929–936. 1998.PubMed/NCBI
|
|
31
|
Rost B, Yachdav G and Liu J: The
PredictProtein server. Nucleic Acids Res. 32:W321–W326. 2004.
View Article : Google Scholar : PubMed/NCBI
|
|
32
|
Roy A, Yang J and Zhang Y: COFACTOR: an
accurate comparative algorithm for structure-based protein function
annotation. Nucleic Acids Res. 40:W471–W477. 2012. View Article : Google Scholar : PubMed/NCBI
|
|
33
|
Roy A, Kucukural A and Zhang Y: I-TASSER:
a unified platform for automated protein structure and function
prediction. Nat Protoc. 5:725–738. 2010. View Article : Google Scholar : PubMed/NCBI
|
|
34
|
Zhang Y: I-TASSER server for protein 3D
structure prediction. BMC Bioinformatics. 9(40): 2008
|
|
35
|
Saitou N and Nei M: The neighbor-joining
method: a new method for reconstructing phylogenetic trees. Mol
Biol Evol. 4:406–425. 1987.PubMed/NCBI
|
|
36
|
Thompson EA: The method of minimum
evolution. Ann Hum Genet. 36:333–340. 1973. View Article : Google Scholar : PubMed/NCBI
|
|
37
|
Goodman M, Moore GW, Barnabas J and
Matsuda G: The phylogeny of human globin genes investigated by the
maximum parsimony method. J Mol Evol. 3:1–48. 1974. View Article : Google Scholar : PubMed/NCBI
|
|
38
|
Xin H, Chen ZY, Lv XB, Liu S, Lian ZX and
Cai SL: Serum secretory phospholipase A2-IIa (sPLA2-IIA) levels in
patients surviving acute myocardial infarction. Eur Rev Med
Pharmacol Sci. 17:999–1004. 2013.PubMed/NCBI
|
|
39
|
Sullivan AH: A measurement of the local
energy deposition by antiprotons coming to rest in tissue-like
material. Phys Med Biol. 30:1297–1303. 1985. View Article : Google Scholar : PubMed/NCBI
|
|
40
|
Duivenvoorden R, Mani V, Woodward M, et
al: Relationship of serum inflammatory biomarkers with plaque
inflammation assessed by FDG PET/CT: the dal-PLAQUE study. JACC
Cardiovasc Imaging. 6:1087–1094. 2013. View Article : Google Scholar : PubMed/NCBI
|
|
41
|
Mangili A, Ahmad R, Wolfert RL, et al:
Lipoprotein-associated phospholipase A2, a novel cardiovascular
inflammatory marker, in HIV-infected patients. Clin Infect Dis.
58:893–900. 2014. View Article : Google Scholar
|
|
42
|
Hariprasad G, Srinivasan A and Singh R:
Structural and phylogenetic basis for the classification of group
III phospholipase A2. J Mol Model. 19:3779–3791. 2013. View Article : Google Scholar : PubMed/NCBI
|
|
43
|
Magrioti V and Kokotos G: Phospholipase A2
inhibitors as potential therapeutic agents for the treatment of
inflammatory diseases. Expert Opin Ther Pat. 20:1–18. 2010.
View Article : Google Scholar
|
|
44
|
Gibbs HL and Rossiter W: Rapid evolution
by positive selection and gene gain and loss: PLA2 venom
genes in closely related Sistrurus rattlesnakes with divergent
diets. J Mol Evol. 66:151–166. 2008. View Article : Google Scholar : PubMed/NCBI
|
|
45
|
Woodgett JR, Gould KL and Hunter T:
Substrate specificity of protein kinase C. Use of synthetic
peptides corresponding to physiological sites as probes for
substrate recognition requirements. Eur J Biochem. 161:177–184.
1986. View Article : Google Scholar : PubMed/NCBI
|
|
46
|
Pinna LA: Casein kinase 2: an ‘eminence
grise’ in cellular regulation? Biochim Biophys Acta. 1054:267–284.
1990. View Article : Google Scholar : PubMed/NCBI
|
|
47
|
Chapus C, Rovery M, Sarda L and Verger R:
Minireview on pancreatic lipase and colipase. Biochimie.
70:1223–1234. 1988. View Article : Google Scholar : PubMed/NCBI
|
|
48
|
Caslake MJ and Packard CJ:
Lipoprotein-associated phospholipase A2 (platelet-activating factor
acetylhydrolase) and cardiovascular disease. Curr Opin Lipidol.
14:347–352. 2003. View Article : Google Scholar : PubMed/NCBI
|
|
49
|
Feng LM, Feng GF and Chen Y: Evaluation of
lipoprotein-associated phospholipase A2 in healthy Chinese Han
adult serum. Lipids Health Dis. 13(6): 2014
|
|
50
|
Harvey EJ, Li N and Ramji DP: Critical
role for casein kinase 2 and phosphoinositide-3-kinase in the
interferon-gamma-induced expression of monocyte chemoattractant
protein-1 and other key genes implicated in atherosclerosis.
Arterioscler Thromb Vasc Biol. 27:806–812. 2007. View Article : Google Scholar : PubMed/NCBI
|
|
51
|
Tai W, Garcia M, Mlynash M, Kemp S, Albers
GW and Olivot JM: Lipoprotein phospholipase A2 mass and activity
are not associated with the diagnosis of acute brain ischemia.
Cerebrovasc Dis. 38:324–327. 2014. View Article : Google Scholar : PubMed/NCBI
|
|
52
|
Nozadze DN, Sergienko IV, Balakhonova TV,
Semenova AE, Vlasik TN and Kukharchuk VV: Lipoprotein-associated
phospholipase A2 serum levels in patients from different categories
of cardiovascular risk. Kardiologiia. 54:57–63. 2014.(In
Russian).
|