Introduction
The occurrence of cancer generally results from the
accumulation of inherited and somatic mutations in oncogenes and
tumor suppressor genes. Breast cancer is characterized by a
distinct metastatic pattern involving regional lymph nodes, the
bone marrow, lungs and liver (1).
It is thought that the incidence of breast cancer is the result of
the abnormal expression of many genes (2), including cancer markers, identified
after scoring the expression pattern of each gene. Although there
has been extensive research on the gene markers of breast cancer,
the results have not been uniform and share only a small number of
genes in common (3,4). Some genes associated with breast
cancer mutations are also typically not detected through the
analysis of differential expression, even though they are essential
in the network by interconnecting many differentially expressed
genes. The importance of these genes will thus not be disclosed in
the detection of individual marker genes.
Based on the shortcoming, a more effective means has
adopted by combining gene expression measurements over groups of
genes that fall within common pathways. This involves the
identification of cancer markers by scoring known pathways and
evaluating the coherency of changes in gene expression (5). However, the problem that remains is
that a large number of human genes have not yet been assigned to a
definitive pathway based on pathway analysis. Network-based
approaches offer an effective means to at least partially solve
this issue by providing potential cancer diagnostic molecular
markers and connecting them.
With the development of bioinformatics analysis,
network-based approaches have become more powerful and informative
for the study of disease mechanisms (6). A number of researchers have
suggested the detection of disease-related networks, for instance,
the co-expression network (7),
protein-protein interaction (PPI) network (8), protein phosphorylation networks
(9) and the DNA methylation
network (10). The study of these
networks, particularly the study of the PPI network provides
valuable information on biological systems. PPI networks are
prevalent in cancer research and nonetheless studies have revealed
interesting topological properties of PPI networks (11) with respect to gene essentiality.
Studies (12,13) have identified subnetworks of
higher accuracy as cancer markers based on the coherent expression
patterns of the genes associated with a PPI network. Functional
pathways or clusters may be viewed with the required subnetworks
which integrate the most highly connected proteins/genes through
their interactions.
In this study, we constructed a PPI network by
linking causal breast cancer genes with the selected gene
signatures using the genome-wide global significance (GWGS) method.
Pathways and clusters were selected with enriched gene signatures
using Kyoto Encyclopedia of Genes and Genomes (KEGG) pathway
enrichment analysis and the molecular complex detection (MCODE)
clustering algorithm, respectively. Four types of centralities of
gene signatures, pathways and clusters were analyzed to obtain the
hub nodes and three significant subnetworks. The hub subnetwork was
formed by connecting the common hub genes with the intersection of
the above three significant subnetworks. Thus, taking into
consideration the genes that participated in a subnetwork whose
overall activity was discriminative, this would implicate genes
with a low discriminative potential (i.e., those that were not
significantly differentially expressed) to increase the accuracy of
identifying genetic alterations and predicting the likelihood of
cancer functions with a network-based method.
Materials and methods
Subject samples
Microarray expression profile breast cancer
biological data (E-GEOD-29431), (E-GEOD-3744) (4), (E-GEOD-42568) (14), (E-GEOD-50567) (3) and (E-GEOD-7904) were downloaded from
different experimental origins using the Gene Expression Omnibus
(GEO) database. A total of 281 breast cancer samples and 69 normal
samples were included. Following the analysis of these data by RAM,
quantiles, median polish summarization methods and unqualified
chips were eliminated leaving only qualified data into the next
step through quality control. The gene expression values of all
data were transformed to a comparable level, a digital expression
profile for further analysis.
Detection of gene signatures
The gene signatures were screened using a novel
model: genome-wide relative significance (GWRS) and GWGS with some
modifications (15). The value of
GWGS was applied to integrate and analyze the independent
microarray studies. A gene with a large GWGS value was considered
to be globally significant across multiple independent studies.
GWGS was used to identify the gene signatures in breast cancer with
some modifications. Briefly, gene signatures were identified by two
steps: first, the GWRS of i-th gene in the j-th
dataset was measured using the following formula:
The number of datasets was denoted by n, the
number of unique genes across n datasets was denoted by
m; rij (i = 1-m, j =
1-n) was the rank number of the i-th gene in the
j-th study. When a gene was mapped to multiple probe-sets,
the maximum value was given to indicate the expression of the
probe-set. Genefilter package (Bioconductor) was used to select
genes before GWRS. The gene was removed if it was absent in one
dataset. The degree of the differential expression of genes was
measured by fold change. We assigned a rank number for each gene
according to their differential expression.
Second, the GWGS value of the genes were measured
using the following formula:
where ωj represented the relative weight of the
j-th dataset. The value of weight can be assigned based on
the data quality of the j-th datasets, the value of
ωj can also be used to reflect the differential
importance of biopsy versus cell line samples that biological
scientists may wish to take into account. We assigned equal weight
to each data. The P-values for all genes were recorded after being
analyzed using the Linear Models for Microarray Data (Limma) 3.20.8
package, as previously described (). The highest P-value was obtained by
the maximum P-value (maxP) model which took the maximum P-value as
the test statistic () with the
intersection of the microarray datasets. The genes with
|log2FC| >2 and P<0.01 were selected for further
research.
Construction and analysis of PPI
network
The protein interaction data were selected from the
Search Tool for the Retrieval of Interacting Genes/Proteins
(STRING) 9.1 database and a network was constructed by linking
causal disease genes with the selected gene signatures using
Cytoscape 3.1.0, a free software package for visualizing, modeling
and analyzing the integration of biomolecular interaction networks
with high-throughput expression data and other molecular states
(18).
Subsequently, we investigated the substructure of
the biggest protein interaction network extracted from the above
constructed network and focused on highly connected nodes known as
clusters using the MCODE (19)
clustering algorithm, including vertex weighting, complex
prediction and optional post-processing. The core-clustering
coefficient was proposed as a metric to sort the vertices in a
graph with respect to their local neighborhood density.
k-core was defined as a graph G of minimal degree k,
where for all v in G, deg(v)>= k. At
the stage of vertex weighting, all vertices based on their local
network density were weighted using the highest k-core of
the immediate neighborhood. At the stage of complex prediction, the
vertex weighted graph was first taken as input and a complex with
the highest weighted vertex was seeded, then recursively moved
outward from the seed vertex. This included vertices in the complex
whose weight is above a given threshold. The threshold is a given
percentage away from the weight of the seed vertex. As a
post-processing step, clusters are enhanced with additional
neighborhood vertices that are members of other clusters, resulting
in overlapping clusters. The software of the MCODE algorithm was
obtained from http://baderlab.org/Software/MCODE. The highly
interacting nodes in the clusters were identified by parameters
keeping K-core = 4, node score cut-off = 0.3 and max depth up to
100.
Centralities based analysis of complex
networks
Studies have demonstrated the presence of strong
correlations between the PPI network structure and the functional
role of its protein/gene constituents (20,21). In order to understand the
functionality of complex systems of gene signatures, we constructed
the protein-protein network for gene signatures and characterized
the biological importance of genes over indices of topological
centrality using Cytoscape 3.1.0. We analyzed centralities related
to the local (degree) scale and the global (stress centrality,
betweenness centrality and closeness centrality) scale which were
used to describe the importance of nodes.
Degree quantifies the local topology of each gene,
by summing up the number of its adjacent genes (22). It gives a simple count of the
number of interactions of a given node.
Stress centrality is considered the number of nodes
in the shortest path between two other nodes; the stress is a node
centrality index. Stress is calculated by measuring the number of
shortest paths passing through a node. The ‘stress’ [Cstr
(v)] of a node v is calculated as follows:
To calculate the Cstr (v) of a node
v, all shortest paths in a graph G are calculated and then
the number of shortest paths passing through v is counted. A
‘stressed’ node is a node traversed by a high number of shortest
paths.
Betweenness centrality (23) is another topological metric in
graphs for determining how the neighbors of a node are
interconnected. It is considered the ratio of the node in the
shortest path between two other nodes. The betweenness centrality
of a node v is given by the expression:
Betweenness centrality of a node scales with the
number of pairs of nodes as implied by the summation
indices. Therefore, the calculation may be rescaled by
dividing the number of pairs of nodes not including v, so
that CB(v) ∈ [0,1]. σst
is the total number of shortest paths from node s to node
t and σst (v) is the number of
those paths that pass through v in formula 1 and 2.
Closeness centrality is a measure of the average
length of the shortest paths to access all other proteins in the
network (22). The larger the
value, the more central is the protein. The closeness centrality,
Cc(v) was calculated for each functional
category, taking into consideration all the shortest paths for each
node. Cc(v) of node n is defined as the
reciprocal of the average shortest path length and is computed as
follows:
where dG (s, t) represents the length of
the shortest path between two nodes s and t in graph
G, which is the sum of the weights of all edges on this shortest
path. dG (s, s) = 0, dG
(s, t) = dG (t, s) in the
undirected graph.
KEGG pathway enrichment analysis
To further investigate the signaling pathway of the
selected gene signatures, we performed a pathway analysis to assess
the functional relevance of selected gene signatures based on the
KEGG database, a knowledge base for the systematic analysis of gene
functions, linking genomic information with higher order functional
information (24). It is a widely
used comprehensive inference for pathway mapping of genes. The
analysis of gene signatures was performed using the online tool,
DAVID Bioinformatics Resources 6.7 (25). The EASE score was used to evaluate
the significant categories. KEGG pathways with P-values <0.05
and 0.01 were considered to indicate statistical significance in a
category.
Statistical analysis
To compare the degree, stress centrality,
betweenness centrality and closeness centrality among each cluster
and each significant pathway, one-way analysis of variance (ANOVA)
was employed for multiple pair-wise comparisons. A P-value was
estimated for each compared pair (P<0.05, P<0.01,
P<0.0001) and a P-value <0.05 was considered to indicate a
statistically significant difference. Statistical analysis was
performed using SPSS 17.0 software (SPSS Inc., Chicago, IL,
USA).
Results
Screening of gene signatures
Five microarray datasets from different origins were
integrated in the analysis to identify robust gene biomarker
signatures for breast cancer using the GWGS model. A rank number
for each gene according to their degree of differential expression
(fold change) was obtained. A total of 20,109 genes (i.e., across
all five microarray dataset intersections) were identified and the
GWGS values of these genes were measured using GWGS
(Srj) as defined above. A gene with a
large Srj value is considered to be
significant across multiple independent studies (i.e., globally
significant). The log2FC average of common genes and
highest P-values with maxP model were obtained from five datasets.
The 487 genes were selected with |log2FC| >2 and
P<0.01 as the starting point for our new proposed gene
signatures, including 364 upregulated genes and 123 downregulated
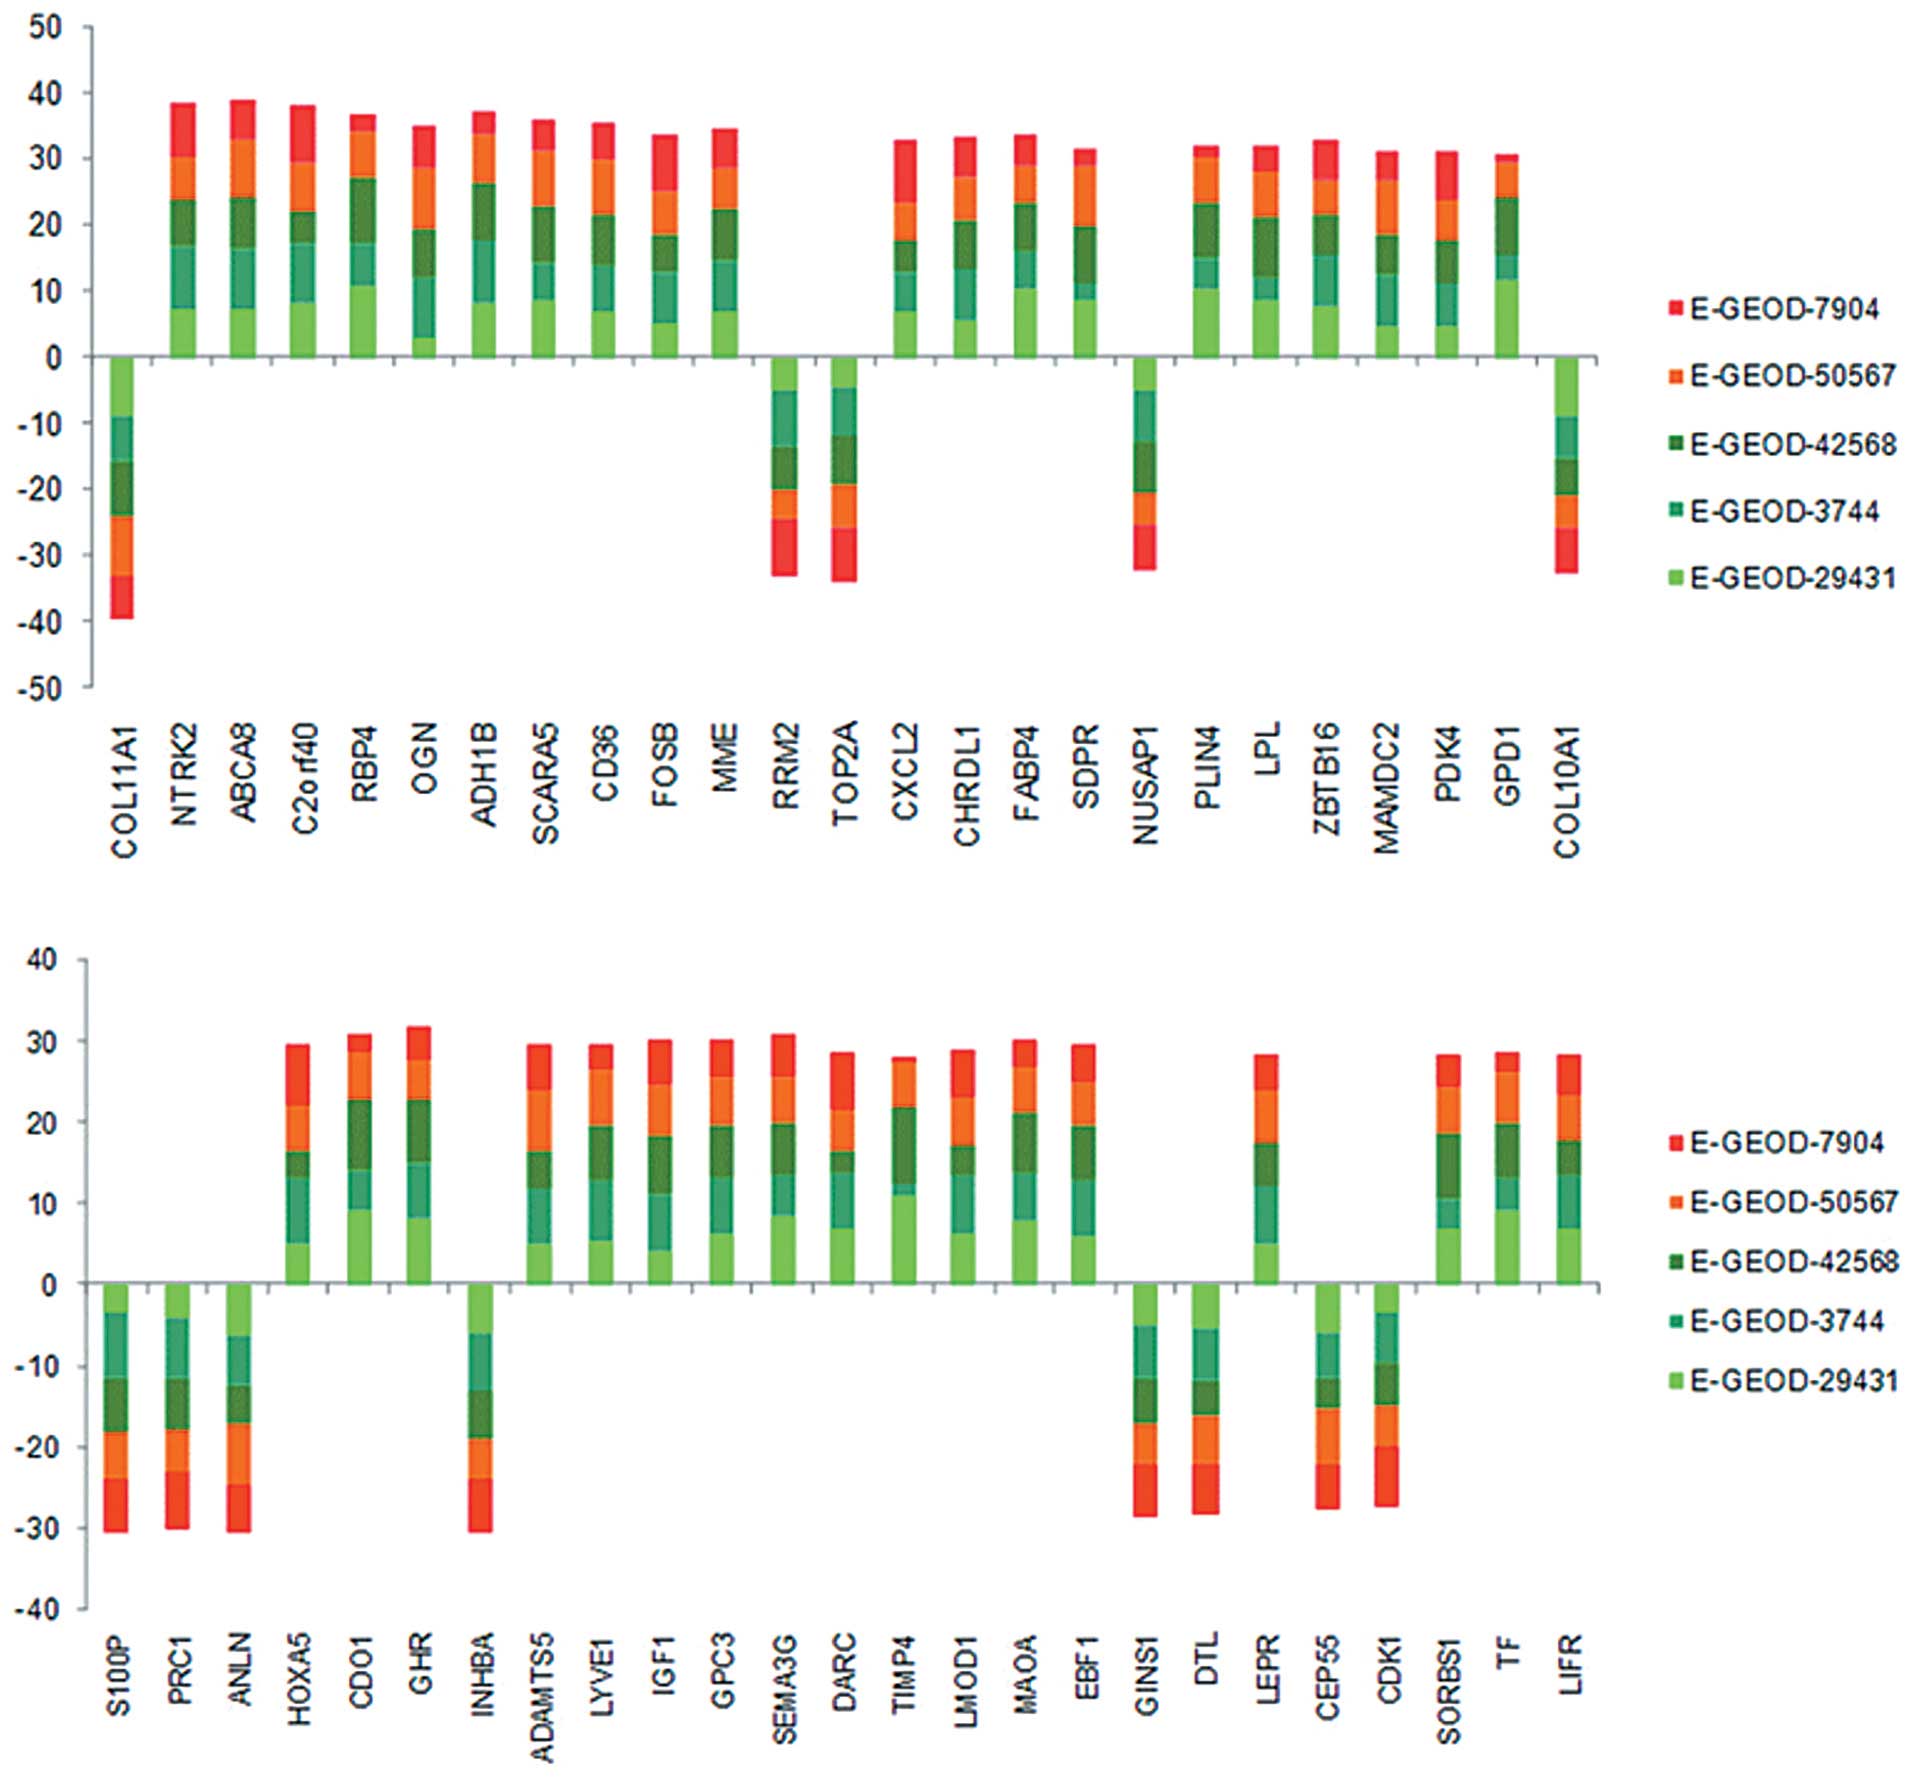
genes. The top 50 ranked gene signatures are listed in Table I and their degrees of differential
expression are presented in Fig.
1, which were uniform for each gene among the five data sets
using the GWGS method. The gene signatures corresponding to the top
five GWGS value were as follows: collagen, type XI, alpha 1
(COL11A1; S=14.06), neurotrophic tyrosine kinase, receptor,
type 2 (NTRK2; S=13.98), ATP-binding cassette, sub-family A
(ABC1), member 8 (ABCA8; S=13.65), chromosome 2 open reading
frame 40 (C2orf40; S=13.58), retinol binding protein 4
(RBP4; S=13.42). The 487 genes were selected for further
research.
 | Table IThe 487 gene signatures identified
using the genome-wide global significance (GWRS) method and the
values of the top 50 genes. |
Table I
The 487 gene signatures identified
using the genome-wide global significance (GWRS) method and the
values of the top 50 genes.
| Gene | GWGS | Gene | GWGS | Gene | GWGS | Gene | GWGS |
|---|
| COL11A1 | 14.06 | CXCL2 | 11.71 | PRC1 | 10.74 | TIMP4 | 10.14 |
| NTRK2 | 13.99 | CHRDL1 | 11.55 | ANLN | 10.73 | LMOD1 | 10.14 |
| ABCA8 | 13.65 | FABP4 | 11.45 | HOXA5 | 10.64 | MAOA | 10.10 |
| C2orf40 | 13.58 | SDPR | 11.37 | CDO1 | 10.60 | EBF1 | 10.08 |
| RBP4 | 13.42 | NUSAP1 | 11.32 | GHR | 10.56 | GINS1 | 9.96 |
| OGN | 13.13 | PLIN4 | 11.22 | INHBA | 10.52 | DTL | 9.91 |
| ADH1B | 13.11 | LPL | 11.22 | ADAMTS5 | 10.50 | LEPR | 9.90 |
| SCARA5 | 12.45 | ZBTB16 | 11.13 | LYVE1 | 10.46 | CEP55 | 9.85 |
| CD36 | 12.19 | MAMDC2 | 11.03 | IGF1 | 10.43 | CDK1 | 9.74 |
| FOSB | 11.99 | PDK4 | 10.97 | GPC3 | 10.33 | SORBS1 | 9.74 |
| MME | 11.91 | GPD1 | 10.93 | SEMA3G | 10.33 | TF | 9.70 |
| RRM2 | 11.87 | COL10A1 | 10.93 | DARC | 10.17 | LIFR | 9.69 |
| TOP2A | 11.79 | S100P | 10.80 | | | | |
PPI network construction and subnet
analysis
According to the PPI dataset downloaded from STRING,
the resulting breast cancer-related PPI network was composed of 442
gene signatures and 2,853 interactions. The network was binary and
all interactions were unweighted and undirected. The giant
component which included the majority of the entire network genes
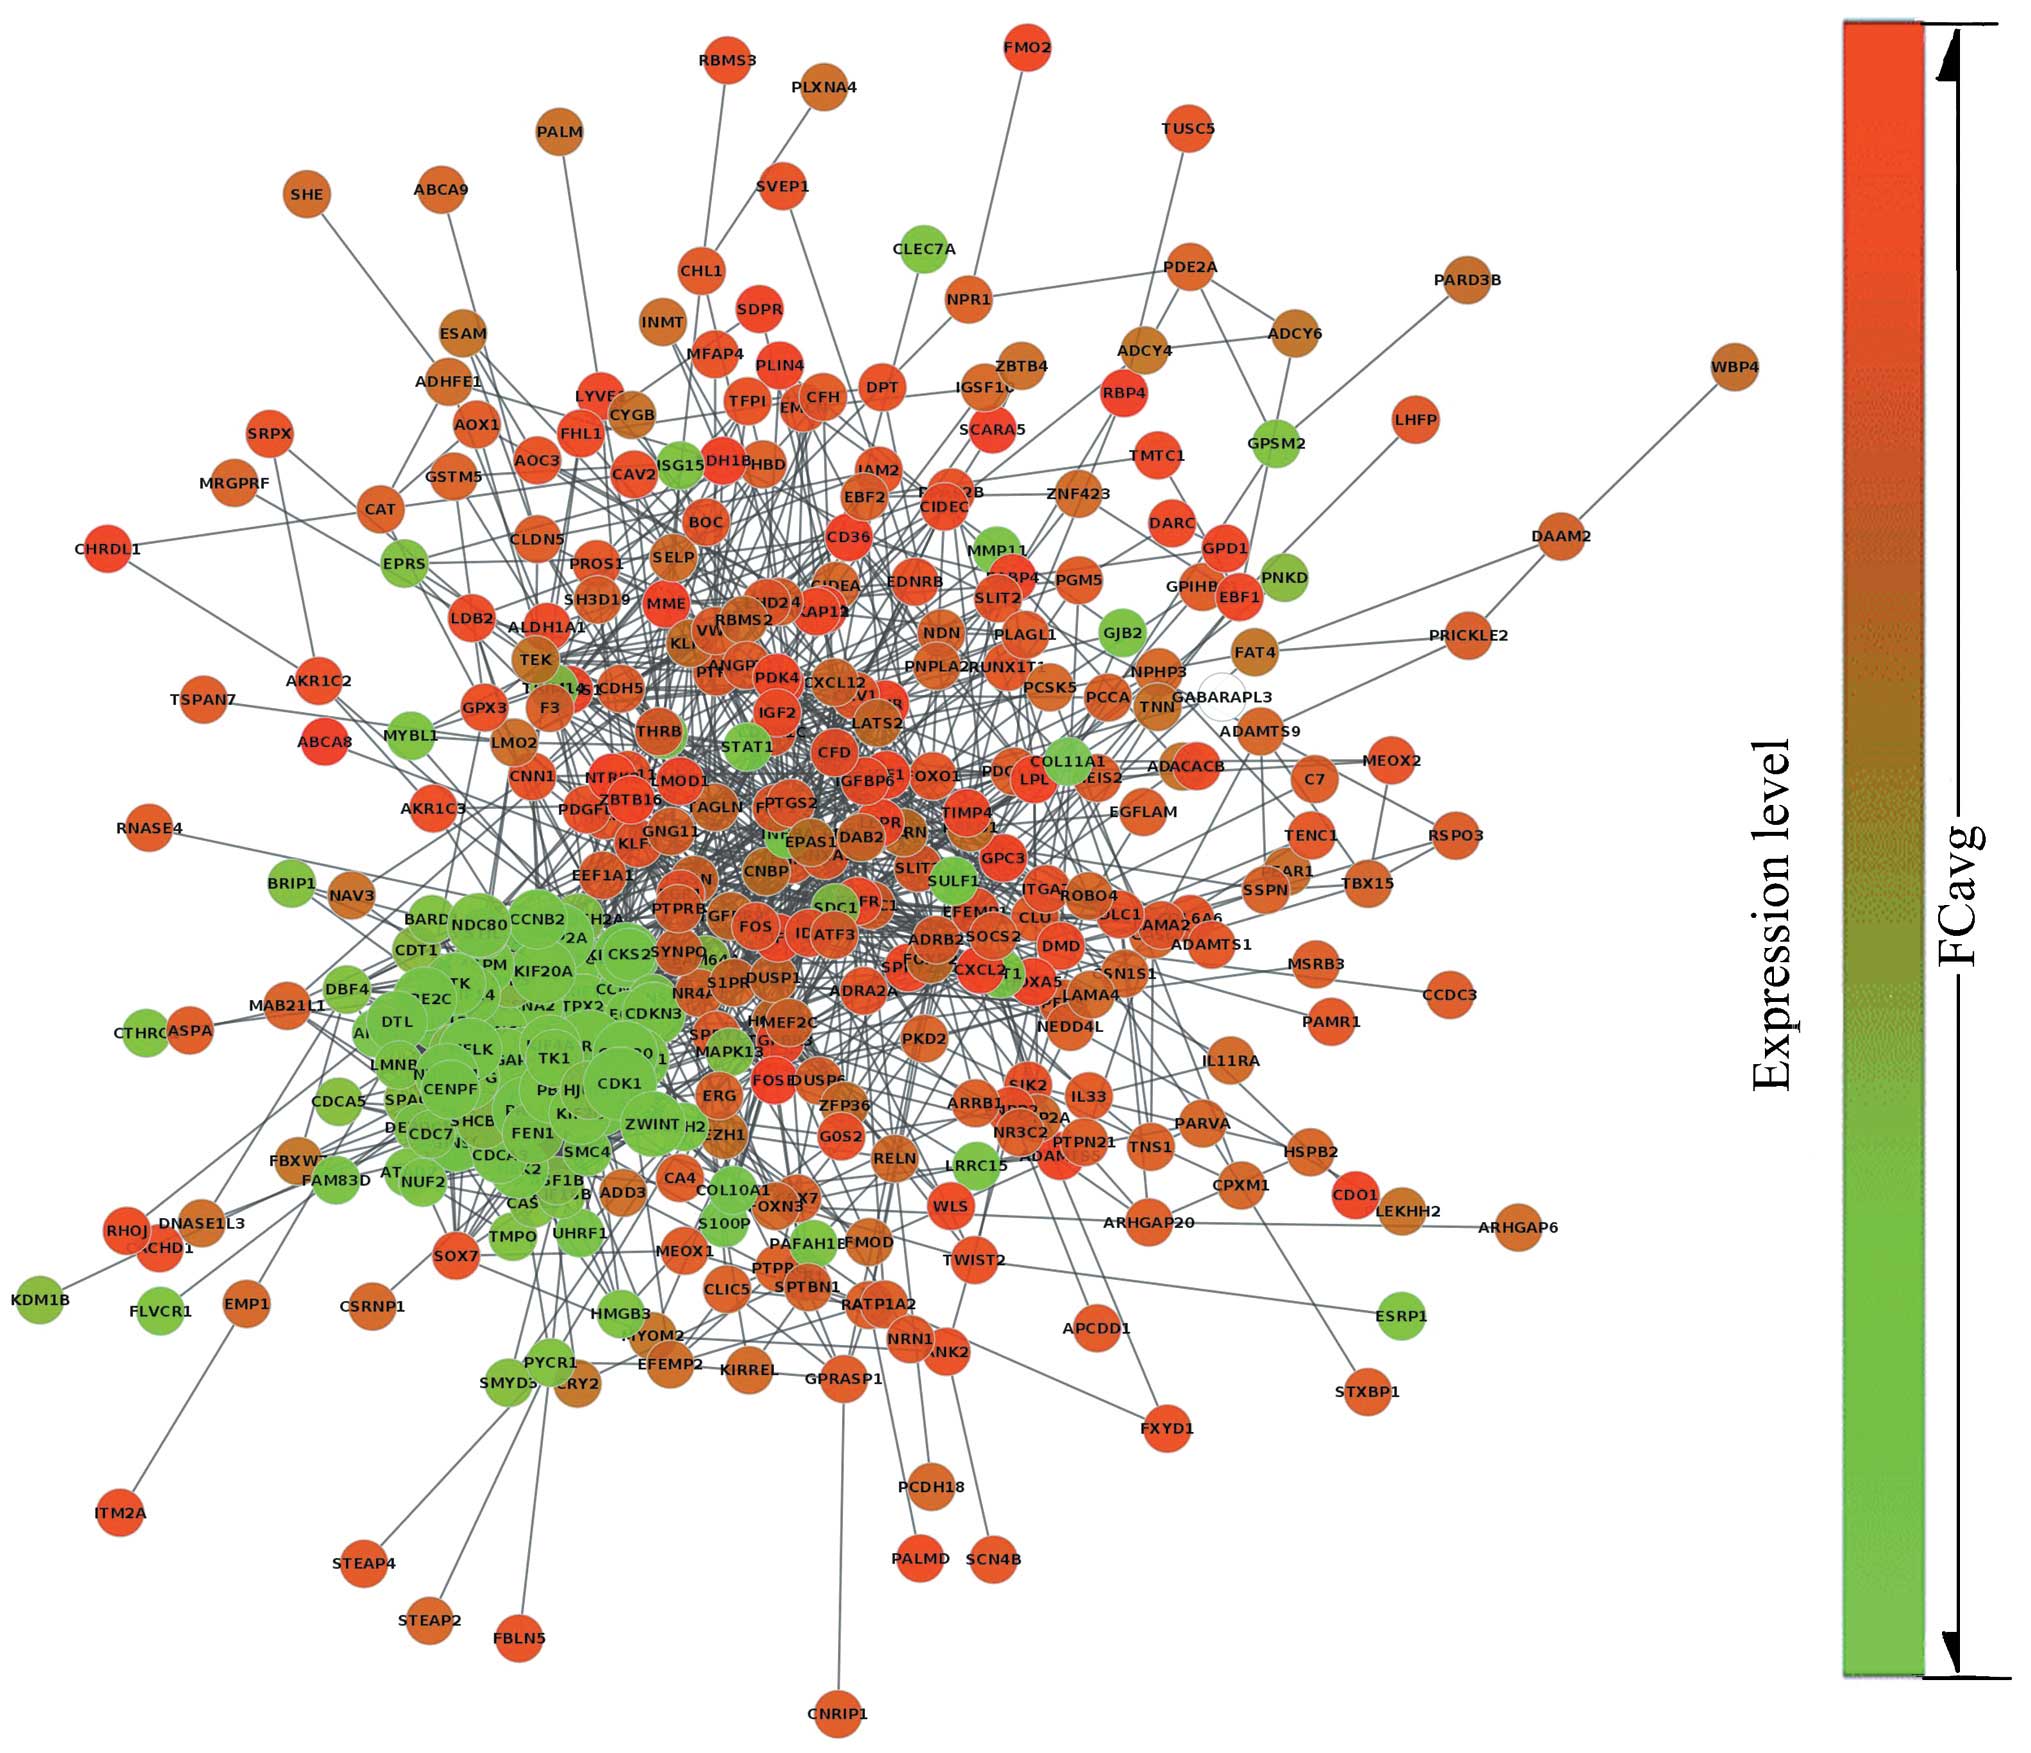
containing 366 nodes and 2,760 edges was constructed (Fig. 2) based on our analysis. The size
of each node represented the degree index. The degree of its nodes
indicated the number of interactions to a single node with all the
other nodes. The MCODE clustering algorithm was used to identify
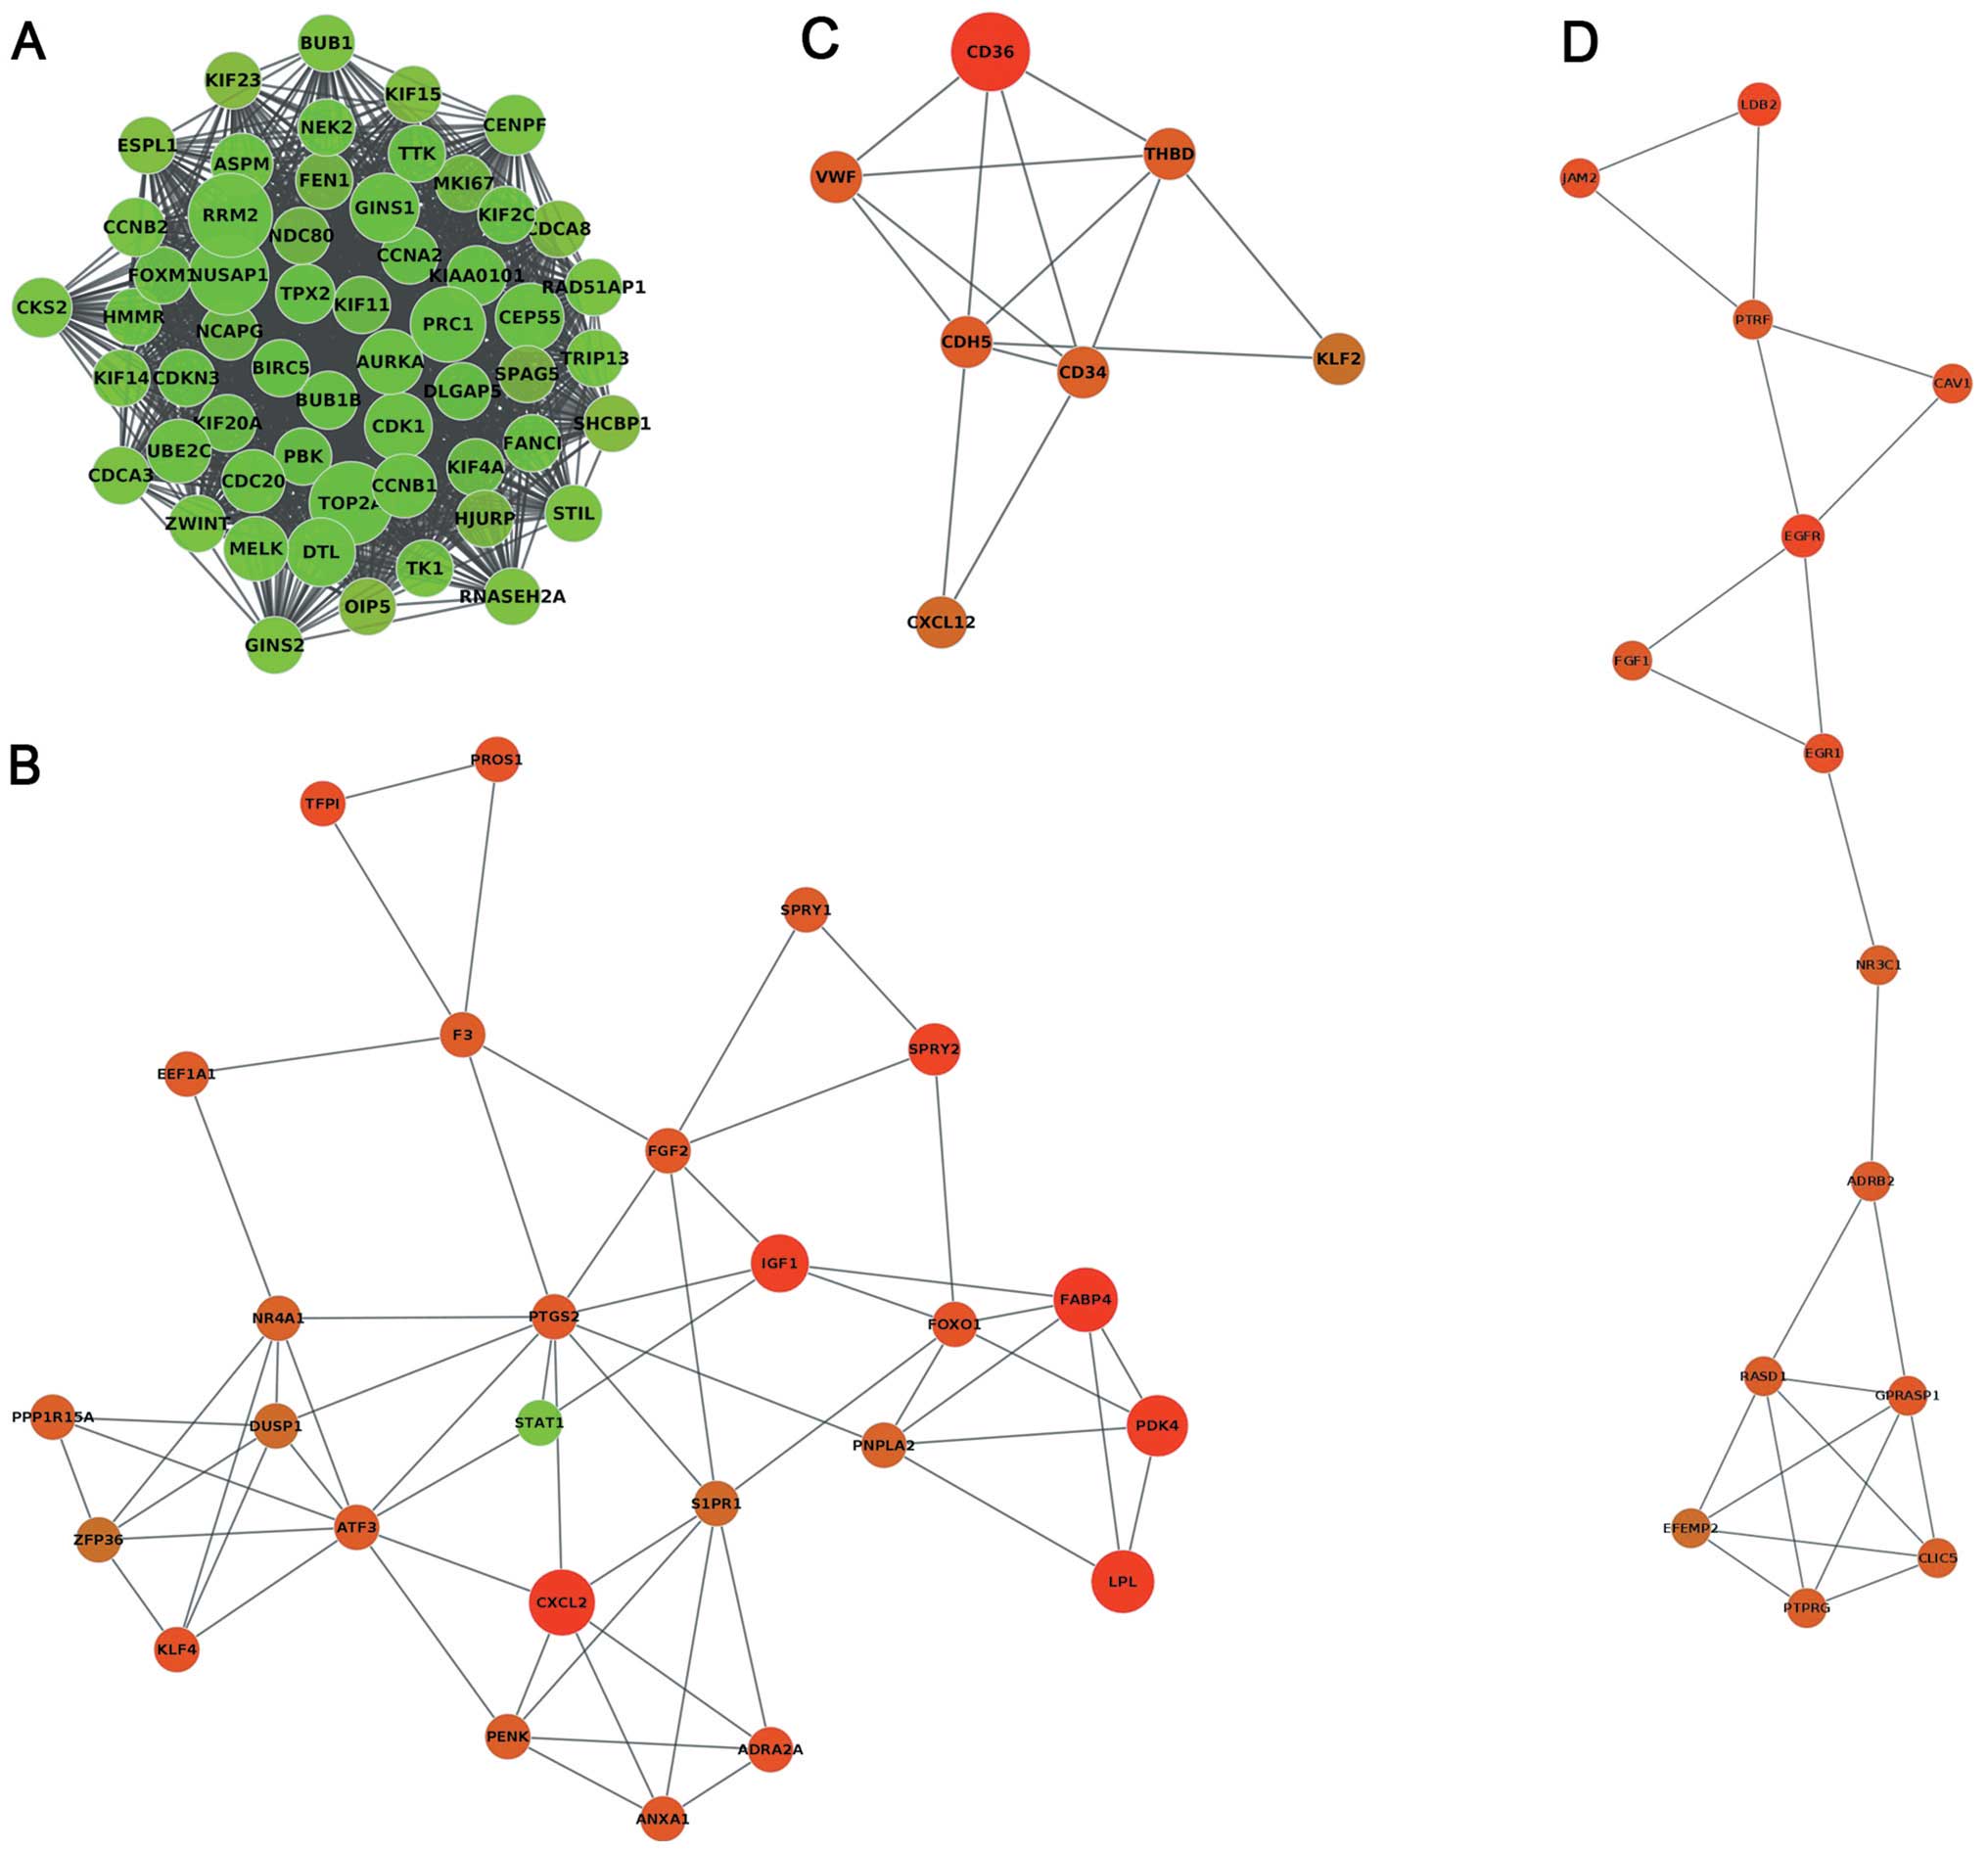
the clusters in the PPI network. Using the MCODE plugin, the
results revealed that four clusters (highly interconnected regions)
(Fig. 3) in the networks were
obtained with parameters set as follows: degree cut-off = 0.3,
K-core = 4, max depth = 100. A cluster is a complete n-node
sub-graph, which means that within a sub-graph, each pair of nodes
is connected by an edge. The nodes of cluster1, cluster2, cluster3
and cluster4 were 1,437, 61, 14 and 23, respectively (Table II).
| Table IIThe clusters generated by the
molecular complex detection (MCODE) clustering algorithm at K-core
= 4, node score cutoff = 0.3 and max depth up to 100 along with
interacting gene partners. |
Table II
The clusters generated by the
molecular complex detection (MCODE) clustering algorithm at K-core
= 4, node score cutoff = 0.3 and max depth up to 100 along with
interacting gene partners.
| Cluster name | Score | Nodes | Edges |
|---|
| 1 | 52.255 | 56 | 1,437 |
| 2 | 4.88 | 26 | 61 |
| 3 | 4.667 | 7 | 14 |
| 4 | 3.538 | 14 | 23 |
Centralities of the networks
This was used to indicate the relevance of a gene as
functionally capable to hold together the communicating nodes in a
biological network. The higher the value, the higher the relevance
of the gene in connecting regulatory molecules. We computed four
centralities for each gene in the PPI network. By assessing
centrality at the local and global level of degree, stress
centrality, betweenness centrality and closeness centrality, a
total of 366 genes centralities were obtained and the information
corresponding to the centralities of the top five ranked genes was
represented, as listed in Table
III. The results revealed that cyclin-dependent kinase 1 (CDK1)
was the top one ranked gene; however, the results of various
centralities based analyses of the same gene were not consistent.
However, centralities based analysis of baculoviral inhibitor of
apoptosis repeat-containing 5 (BIRC5) and epidermal growth factor
receptor (EGFR) focused on ranking the top two and three. The
results also revealed that the top genes as hub nodes were mostly
distributed in cluster1, for instance CDK1, BIRC5, protein
regulator of cytokinesis 1 (PRC1), topoisomerase II alpha (TOP2A),
cyclin B1 (CCNB1), cyclin-dependent kinases regulatory subunit 2
(CKS2) and cyclin A2 (CCNA2), while EGFR was in cluster4. The
overall centralities of the four subnetwork clusters were analyzed.
As regards node degree distribution, cluster1 had the highest
degree with 61.68 and it had significant differences with cluster2
(P<0.0001), cluster3 (P<0.05) and cluster4 (P<0.0001), as
shown by one-way ANOVA. There were no significant differences
between groups apart from the complement and coagulation cascades
pathway in the other three global centralities based analyses
(Fig. 4).
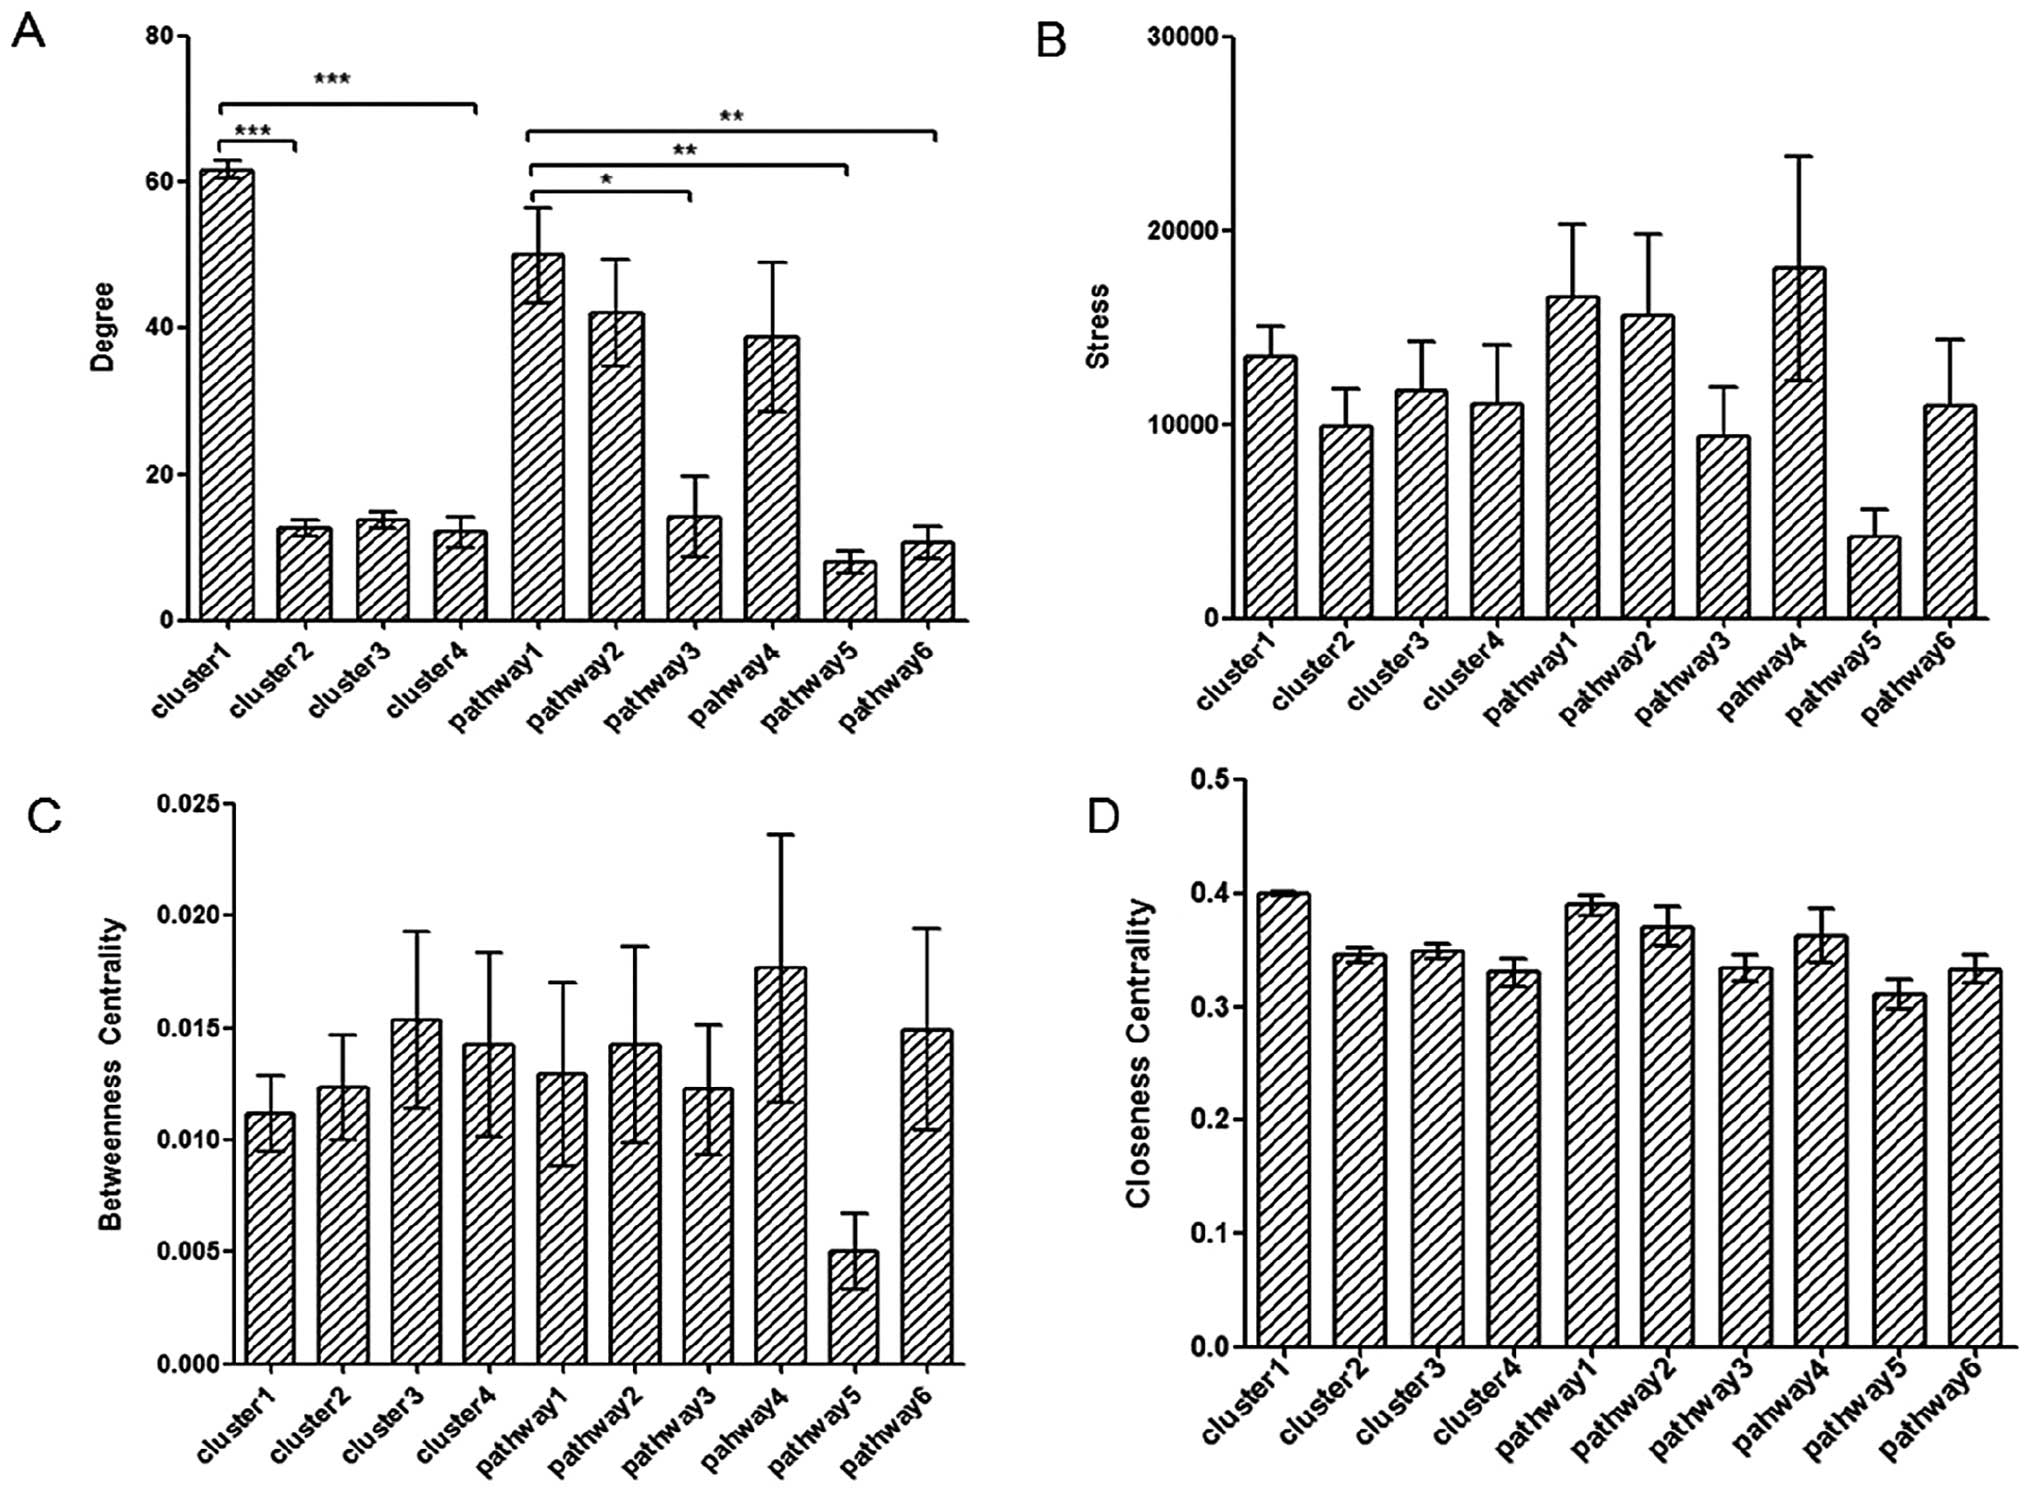 | Figure 4Integrated centralities based
analysis of clusters and pathways. (A–D) Comparisons of degree,
stress centrality, betweenness centrality and closeness centrality
among the four clusters and six significant pathways, respectively.
Pathway1 to pathway6: cell cycle, oocyte meiosis, ECM-receptor
interaction, progesterone-mediated oocyte maturation, complement
and coagulation cascades and focal adhesion, respectively. There
were significant differences between cluster1 and cluster2,
cluster3 of degree analysis (P<0.0001). Degree of cell cycle was
significant with ECM-receptor interaction (P<0.05), complement
and coagulation cascades (P<0.01), and focal adhesion
(P<0.01). All four values of complement and coagulation cascades
pathway were the lowest. There were no significant differences
among the other groups apart from pathway5. The significant level
was analyzed by one-way ANOVA. *P<0.05,
**P<0.01 and ***P<0.0001. |
| Table IIICentralities based analysis and the
values of the top five ranked genes. |
Table III
Centralities based analysis and the
values of the top five ranked genes.
| No. | Terms | Value | Terms | Value | Terms | Value | Terms | Value |
|---|
| Degree
| Stress
| Betweennes
centrality
| Closeness
centrality
|
| 1 | CDK1 | 81 | CDK1 | 55156 | CDK1 | 0.0559 | CDK1 | 0.4416 |
| 2 | BIRC5 | 80 | BIRC5 | 42696 | EGFR | 0.0529 | BIRC5 | 0.4333 |
| 3 | CCNA2 | 79 | EGFR | 41584 | BIRC5 | 0.0440 | CCNA2 | 0.4248 |
| 4 | TOP2A | 74 | FOS | 40114 | FOXO1 | 0.0424 | CCNB1 | 0.4218 |
| 5 | PRC1 | 73 | CKS2 | 38250 | FOS | 0.0406 | KIAA0101 | 0.4218 |
KEGG pathway enrichment analysis
We conducted the enrichment analysis for the 487
genes in which 25 genes were not mapped in the KEGG database. A
total of 118 pathways were selected after being analyzed using the
EASE method. The results revealed that 462 genes were significantly
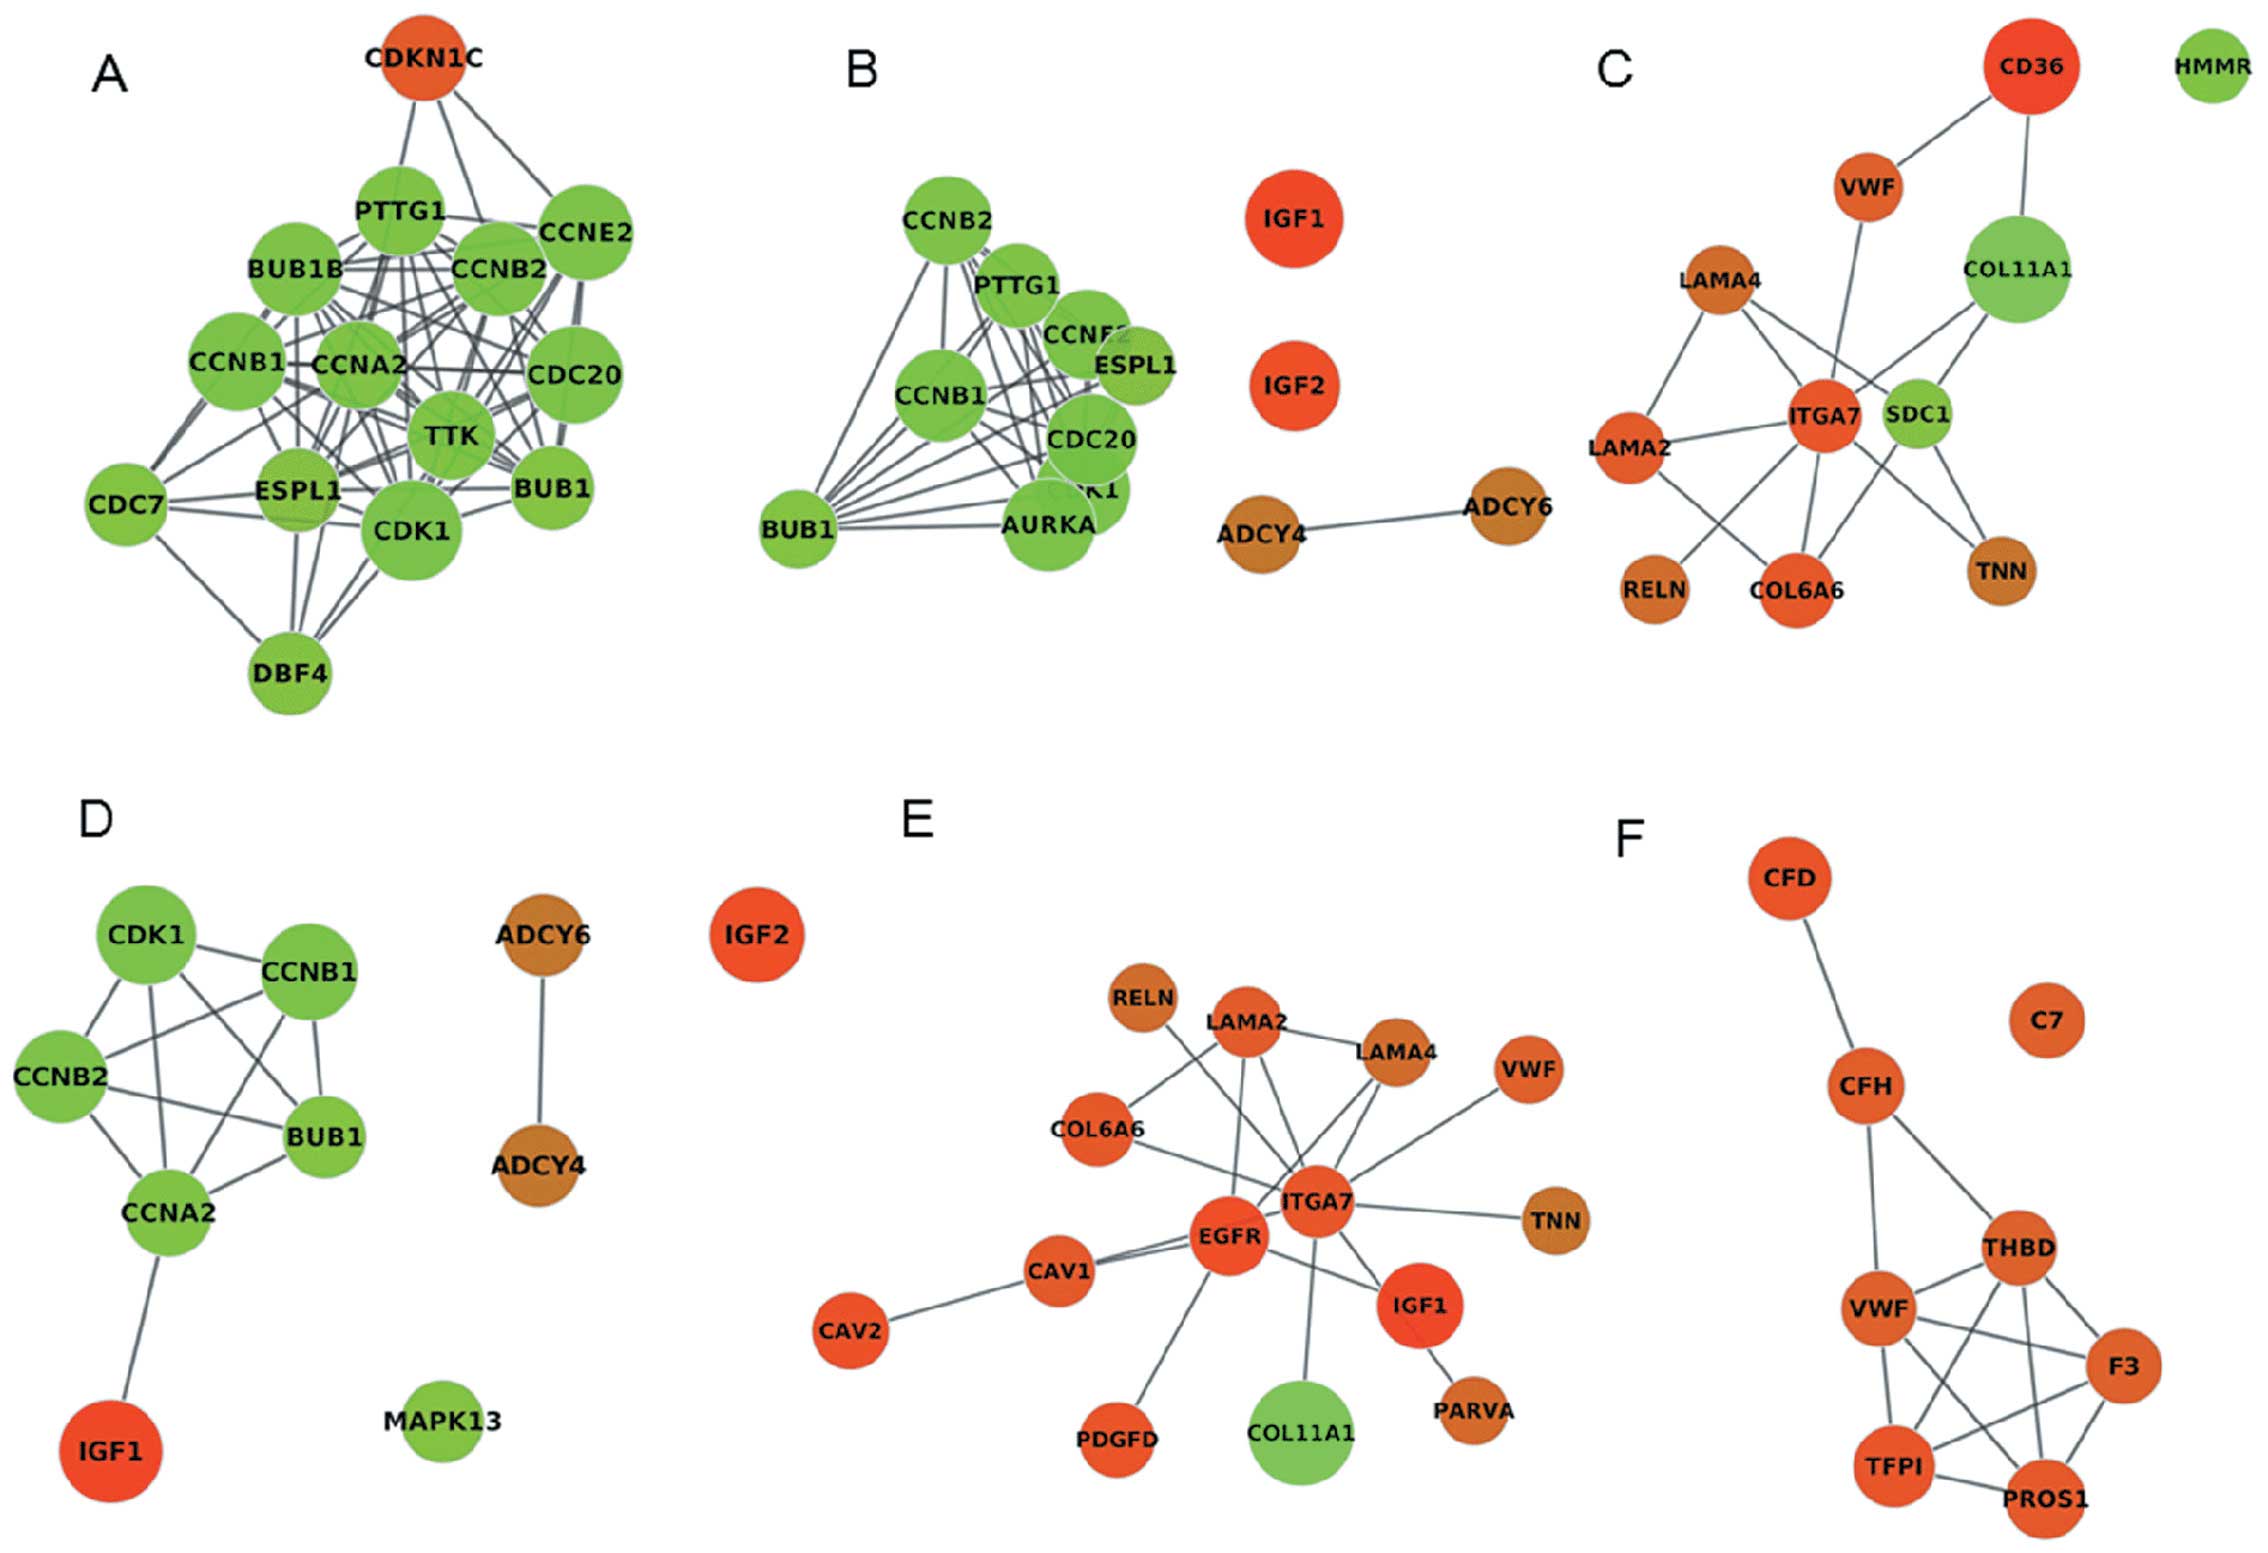
(P<0.05) enriched in 11 pathways (Table IV). The two most significant
terms were cell cycle (P=1.88×10⁻⁵) and the oocyte
meiosis (P=2.12×10⁻⁵) pathway which were related to cell
growth and death, which included 15 and 14 genes, respectively. In
addition, six pathways with a significance level of P<0.01 were
established as subnetworks, which were the cell cycle, oocyte
meiosis, ECM-receptor interaction, progesterone-mediated oocyte
maturation, complement and coagulation cascades and focal adhesion
(Fig. 5). The centralities of
these pathways were analyzed (Fig.
4) by aggregating the centralities of all genes enriched in one
pathway (or a functional subnetwork); the degree of cell cycle
containing 14 genes was found to be significant with ECM-receptor
interaction (P<0.05), complement and coagulation cascades
(P<0.01) and focal adhesion (P<0.01). Although there was no
significance in the comparison between stress centrality,
betweenness centrality and closeness centrality of these six
pathways, it was easy to observe that the values of these
centralities of the cell cycle were higher, which may be viewed as
a putative marker for participating in breast cancer with
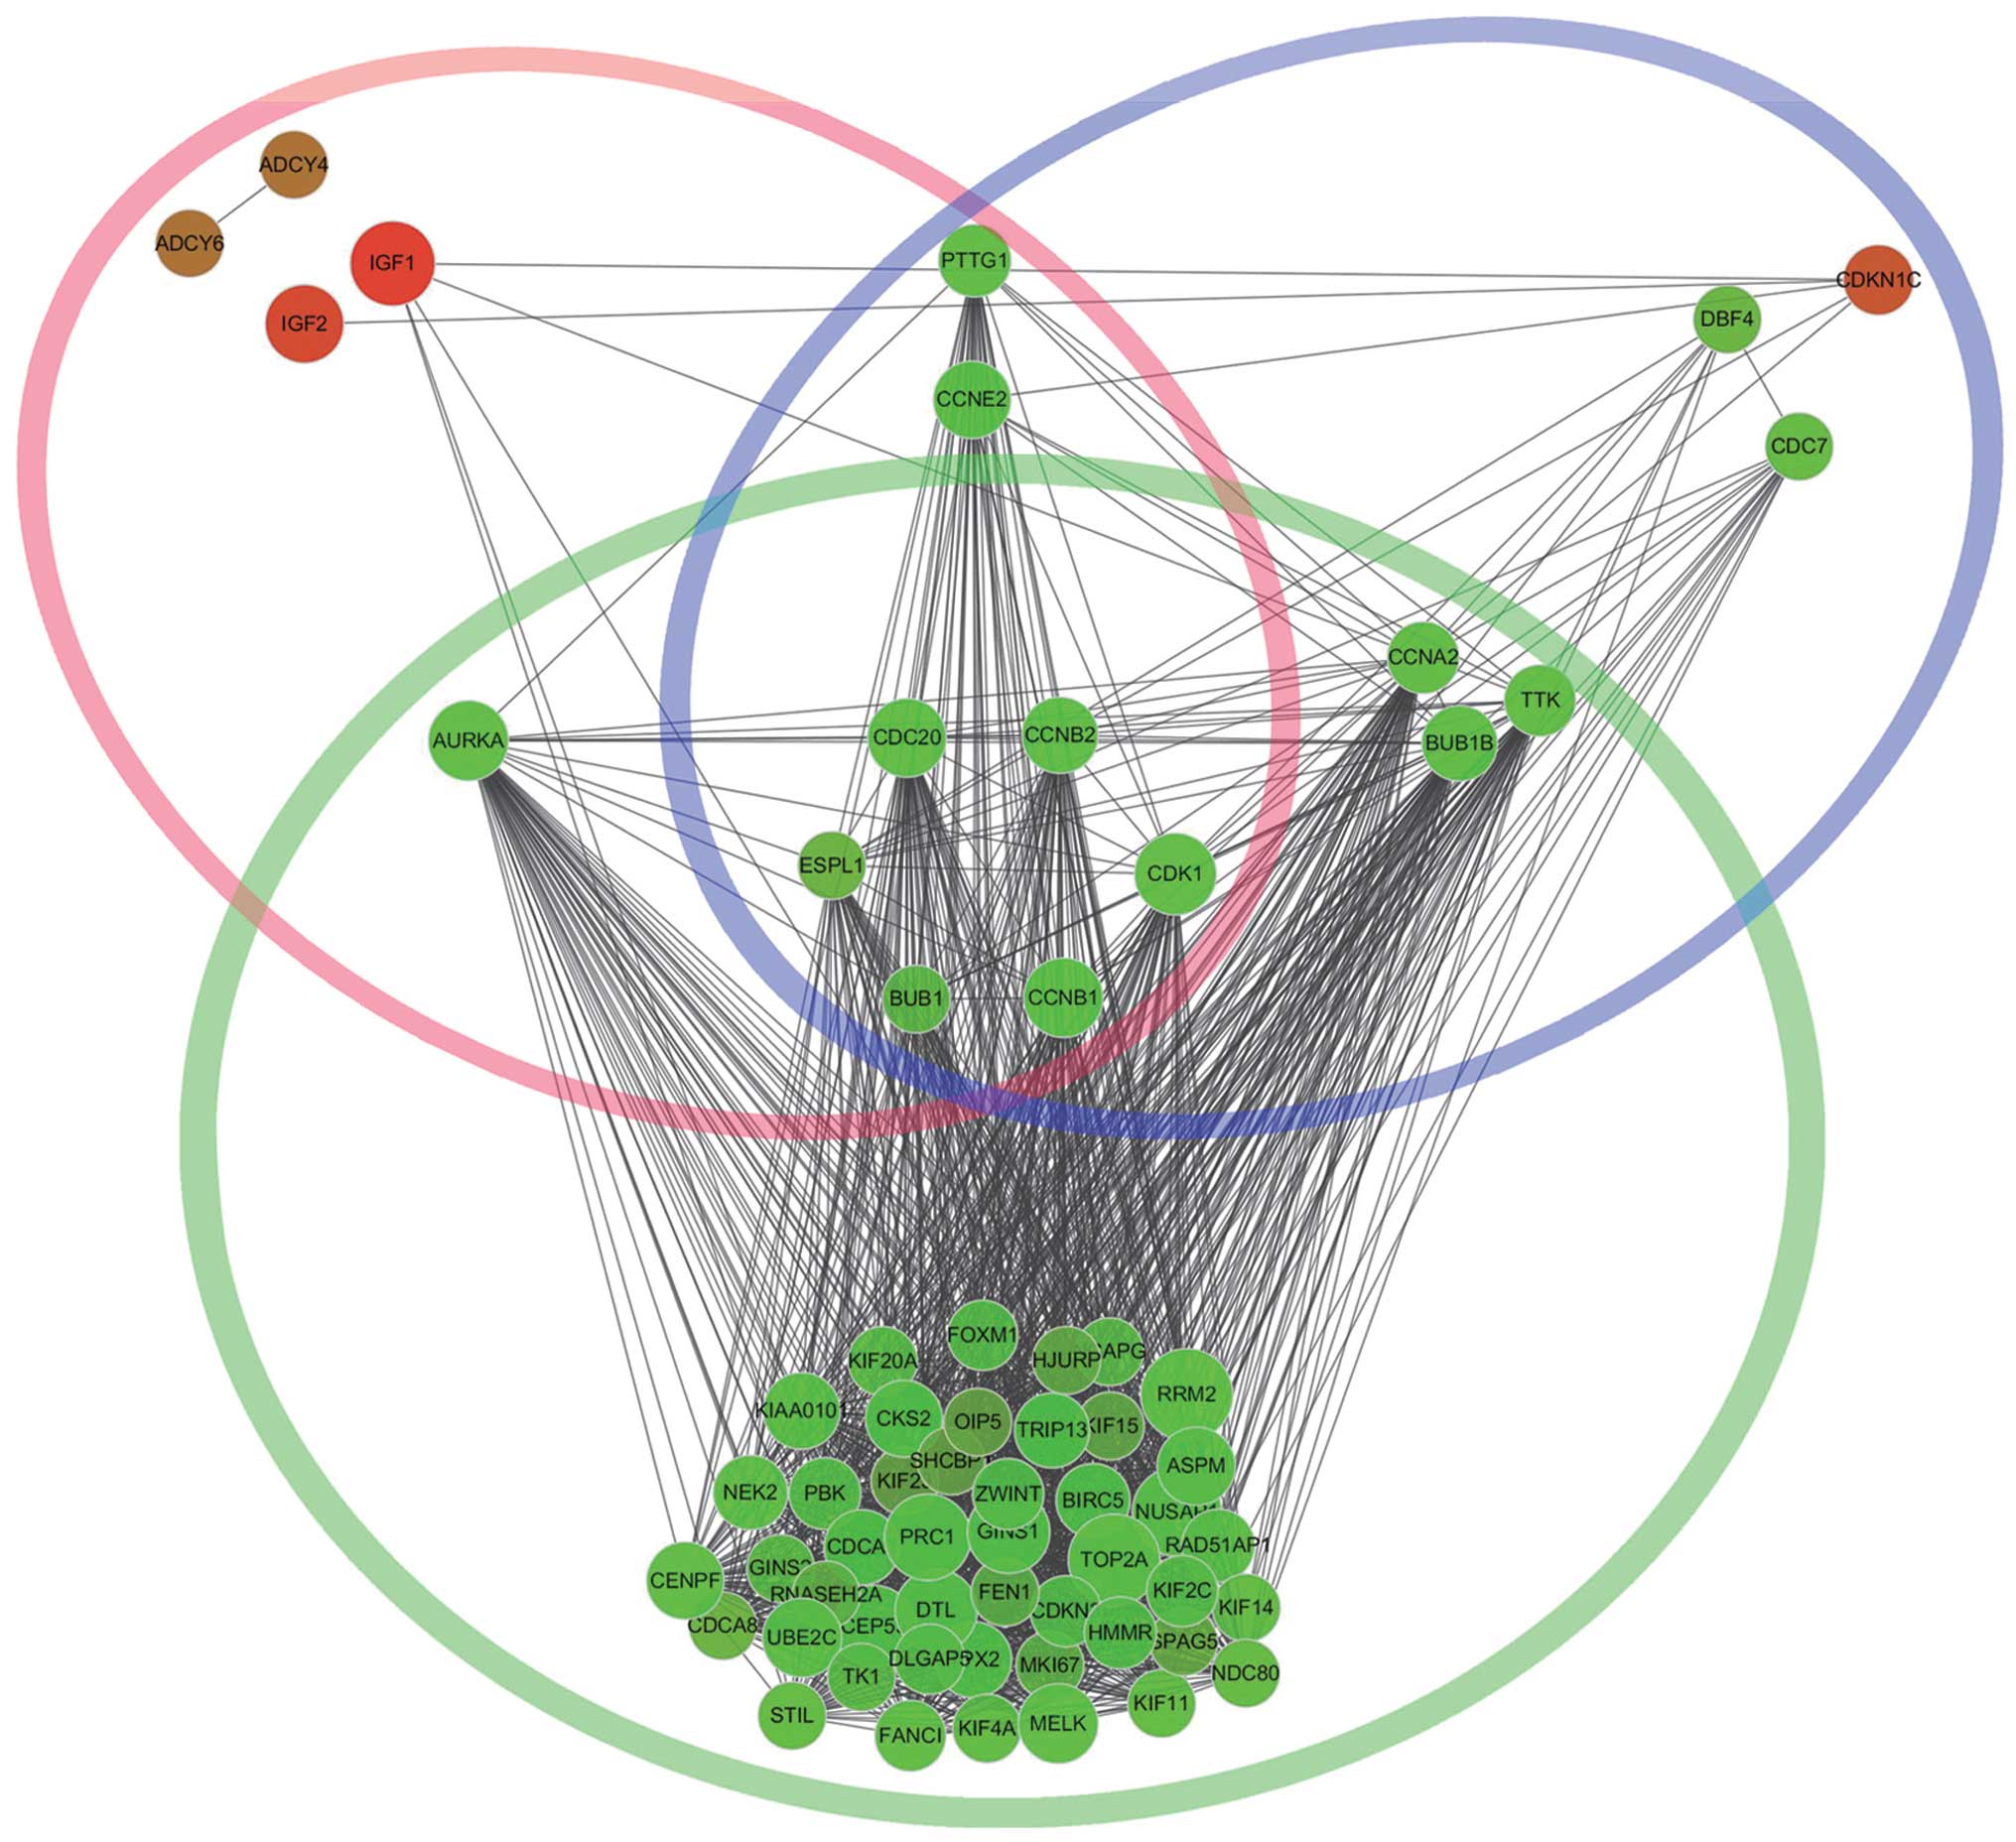
functional insight. Besides, we found that CDK1, CCNB1, extra
spindle pole bodies homolog 1 (S. cerevisiae) (ESPL1),
CCNB2, CDC20 and BUB1 were commom genes in significant cluster1,
cell cycle and oocyte meiosis (Fig.
6). The cell cycle and oocyte meiosis pathway, with common
function, were contacted effectively by cluster1 using the PPI
network and were presented visually in the form of a diagram.
| Table IVEleven significant (P<0.05) KEGG
pathways. |
Table IV
Eleven significant (P<0.05) KEGG
pathways.
| Term | Count | P-value | Genes |
|---|
| Cell cycle | 15 | 1.88E-05 | CDC7, CDK1, DBF4,
TTK, CDC20, ESPL1, PTTG1, CCNB1, CDKN1C, CCNE2, CCNB2, MAD2L1,
BUB1, BUB1B, CCNA2 |
| Oocyte meiosis | 14 | 2.12E-05 | ADCY4, CDK1, ADCY6,
IGF1, AURKA, CDC20, ESPL1, IGF2, PTTG1, CCNB1, CCNE2, CCNB2,
MAD2L1, BUB1 |
| ECM-receptor
interaction | 11 | 1.85E-04 | LAMA2, VWF, LAMA4,
SDC1, CD36, COL6A6, ITGA7, TNN, RELN, COL11A1, HMMR |
|
Progesterone-mediated oocyte
maturation | 11 | 2.25E-04 | CCNB1, CDK1, ADCY4,
MAD2L1, CCNB2, MAPK13, ADCY6, BUB1, IGF1, IGF2, CCNA2 |
| Complement and
coagulation cascades | 8 | 0.004395 | VWF, C7, THBD, F3,
CFH, TFPI, CFD, PROS1 |
| Focal adhesion | 14 | 0.007100 | EGFR, CAV2, CAV1,
IGF1, LAMA2, VWF, LAMA4, COL6A6, ITGA7, RELN, TNN, PDGFD, COL11A1,
PARVA |
|
Aldosterone-regulated sodium
reabsorption | 5 | 0.033673 | NR3C2, IGF1, IGF2,
NEDD4L, ATP1A2 |
| Pathways in
cancer | 17 | 0.036557 | EGFR, PTGS2, EPAS1,
TGFBR2, RUNX1T1, FOXO1, IGF1, BIRC5, ZBTB16, MECOM, STAT1, CCNE2,
LAMA2, FOS, LAMA4, FGF1, FGF2 |
| Prostate
cancer | 7 | 0.050592 | EGFR, CCNE2, IGF1,
FOXO1, CREB5, IGF2, PDGFD |
| p53 signaling
pathway | 6 | 0.052858 | CCNE2, CCNB1, CDK1,
CCNB2, RRM2, IGF1 |
| Ether lipid
metabolism | 4 | 0.086840 | ENPP2, PAFAH1B3,
PPAP2A, PPAP2B |
Discussion
In this study, we aimed to identify a hub subnetwork
with functional insight associated with cell growth and death using
a protein-network-based approach. A total of 487 gene signatures
were selected using the GWGS method from five sets of breast cancer
data and the changes in gene expression were measured clearly both
with fold change criterion and GWGS values. With 422 gene
signatures mapped from the STRING database, a giant component PPI
network was constructed with 366 nodes. After applying the MCODE
clustering algorithm and KEGG pathway enrichment analysis, four
clusters with highly connected nodes and six significant
(P<0.01) pathways were obtained, respectively. The degrees and
three types of centralities related to the global scale were
analyzed for all the detected genes and the significant complex
(i.e., four clusters and six pathways). The top five ranked genes
as hub nodes and one cluster (cluster1), two pathways (cell cycle
and oocyte meiosis) as significant groups with high degrees and
centralities were identified. We found that almost all hub nodes
existed in significant cluster1 which connected the cell cycle and
oocyte meiosis pathways effectively. It was found that CDK1, CCNB1,
ESPL1, CCNB2, CDC20 and BUB1, some of the top ranked genes,
composed a small sized hub subnetwork attributing to the biological
processes of cell growth and death.
The capabilities of bioinformatics tools for the
detection of differential gene expression, network analysis, gene
ontology and gene-disease relationships (26,27) together with all available data on
protein/gene expression during breast cancer provide an interesting
and valuable opportunity for the study of diseases. At present,
many gene signatures have been identified based on fold change
criterion to assess differential expression (28). In our study, the degree of change
in gene expression was also clearly shown using the GWGS method.
However, although there have been numerous studies on gene
signatures of breast cancer, the results have not been uniform
(3,4). For example, Berlingieri et al
(29) found that UbcH10 was
overexpressed in a variety of tumor tissues in breast cancer, lung
cancer and colon cancer, and that its high expression was closely
related to tumor occurrence, development metastasis and the degree
of malignancy. Rutnam et al (30) demonstrated that FN1 or cell
adhesion changes was a key step in malignant transformation, and
that it may prevent malignant or confine cancerous lesions to the
epithelium by regulating FN1. Thus, it is still prudent further
detect essential genes after identifying gene signatures. Besides,
it may not work effectively in different datasets even though the
gene signatures were the same in some studies (31). However, the results of fold change
were uniform (i.e., either all were upregulated, or downregulated)
from the five breast cancer data of the identified gene signatures
by combining the GWGS and maxP methods in our research.
Networks as a powerful tool have attracted a great
deal of attention in the analysis of many biological and
communication systems. Protein interaction network analysis
provides an effective method for estimating and understanding the
likelihood of the existing yet unknown connections between
proteins/genes (32). It can
provide significant instructions for mining unknown connections in
incomplete networks. However, in PPI networks, although the data of
large-scale protein interaction are accumulated with the
development of high throughput testing technology, a certain number
of interactions are not tested, which may be very important. This
issue has been resolved to some extent using clustering methods
which have previously been shown to be useful in identifying
protein/gene interactions that take place within the same cellular
process (33). In this study, we
applied the MCODE clustering algorithm to explore gene-gene
connectivity in a more informative manner and obtained four
clusters with highly connected nodes.
In many PPI networks, essentiality is correlated
with the topological placement of the proteins/genes in the
network, and while connectivity provides an indication of the
importance of a gene, it is possible to further classify the
topological role of highly connected genes based on their locality.
That is, hubs that are highly connected in a PPI network tend to
correspond to essential genes (34). In this study, topological analysis
of all detected genes and the significant clusters and pathways was
carried out through stress centrality, closeness centrality,
betweenness centrality and node degree distribution. The top five
ranked genes were identified. Moreover, we identified the
topologically related pathways and processes. These pathways were
unlikely to be compared using traditional term-based analysis. In
our results, cluster1, the cell cycle and oocyte meiosis pathways
with high centralities were considered significant compared with
the other groups. The hub subnetwork composed of these three
significant groups and intersecting genes was presented visually
and was shown to participate in cell growth and death processes.
Our data provide functional insight into the identification of hub
subnetworks which may play a vital role in the progression of
breast cancer.
Acknowledgments
This study received no specific grants from any
funding agency in public, commercial, or not-for-profit
sectors.
References
|
1
|
Müller A, Homey B, Soto H, et al:
Involvement of chemokine receptors in breast cancer metastasis.
Nature. 410:50–56. 2001. View
Article : Google Scholar : PubMed/NCBI
|
|
2
|
Chia S, Norris B, Speer C, et al: Human
epidermal growth factor receptor 2 overexpression as a prognostic
factor in a large tissue microarray series of node-negative breast
cancers. J Clin Oncol. 26:5697–5704. 2008. View Article : Google Scholar : PubMed/NCBI
|
|
3
|
Lisowska KM, Dudaladava V, Jarzab M, et
al: BRCA1-related gene signature in breast cancer: the role of ER
status and molecular type. Front Biosci (Elite Ed). 3:125–136.
2011. View Article : Google Scholar
|
|
4
|
Richardson AL, Wang ZC, De Nicolo A, et
al: X chromosomal abnormalities in basal-like human breast cancer.
Cancer Cell. 9:121–132. 2006. View Article : Google Scholar : PubMed/NCBI
|
|
5
|
Subramanian A, Tamayo P, Mootha VK, et al:
Gene set enrichment analysis: a knowledge-based approach for
interpreting genome-wide expression profiles. Proc Natl Acad Sci
USA. 102:15545–15550. 2005. View Article : Google Scholar : PubMed/NCBI
|
|
6
|
Bradley EW, Ruan MM, Vrable A and Oursle
MJ: Pathway crosstalk between Ras/Raf and PI3K in promotion of
M-CSF-induced MEK/ERK-mediated osteoclast survival. J Cell Biochem.
104:1439–1451. 2008. View Article : Google Scholar : PubMed/NCBI
|
|
7
|
Gerits N, Kostenko S, Shiryaev A,
Johannessen M and Moens U: Relations between the mitogen-activated
protein kinase and the cAMP-dependent protein kinase pathways:
comradeship and hostility. Cell Signal. 20:1592–1607. 2008.
View Article : Google Scholar : PubMed/NCBI
|
|
8
|
Pham H, Chong B, Vincenti R and Slice LW:
Ang II and EGF synergistically induce COX-2 expression via CREB in
intestinal epithelial cells. J Cell Physiol. 214:96–109. 2008.
View Article : Google Scholar
|
|
9
|
Wang D, Xia D and Dubois RN: The crosstalk
of PTGS2 and EGF signaling pathways in colorectal cancer. Cancers
(Basel). 3:3894–3908. 2011. View Article : Google Scholar
|
|
10
|
Krysan K, Reckamp KL, Dalwadi H, Sharma S,
Rozengurt E, Dohadwala M and Dubinett SM: Prostaglandin E2
activates mitogen-activated protein kinase/Erk pathway signaling
and cell proliferation in non-small cell lung cancer cells in an
epidermal growth factor receptor-independent manner. Cancer Res.
65:6275–6281. 2005. View Article : Google Scholar : PubMed/NCBI
|
|
11
|
Han JD, Bertin N, Hao T, et al: Evidence
for dynamically organized modularity in the yeast protein-protein
interaction network. Nature. 430:88–93. 2004. View Article : Google Scholar : PubMed/NCBI
|
|
12
|
Ideker T, Ozier O, Schwikowski B and
Siegel AF: Discovering regulatory and signalling circuits in
molecular interaction networks. Bioinformatics. 18(Suppl 1):
S233–S240. 2002. View Article : Google Scholar : PubMed/NCBI
|
|
13
|
Chen J and Yuan B: Detecting functional
modules in the yeast protein-protein interaction network.
Bioinformatics. 22:2283–2290. 2006. View Article : Google Scholar : PubMed/NCBI
|
|
14
|
Clarke C, Madden SF, Doolan P, et al:
Correlating transcriptional networks to breast cancer survival: a
large-scale coexpression analysis. Carcinogenesis. 34:2300–2308.
2013. View Article : Google Scholar : PubMed/NCBI
|
|
15
|
Liu W, Peng Y and Tobin DJ: A new 12-gene
diagnostic biomarker signature of melanoma revealed by integrated
microarray analysis. Peer J. 1:e492013. View Article : Google Scholar : PubMed/NCBI
|
|
16
|
Diboun I, Wernisch L, Orengo CA and
Koltzenburg M: Microarray analysis after RNA amplification can
detect pronounced differences in gene expression using limma. BMC
Genomics. 7(252): 2006
|
|
17
|
Wilkinson B: A statistical consideration
in psychological research. Psychol Bull. 48:156–158. 1951.
View Article : Google Scholar : PubMed/NCBI
|
|
18
|
Shannon P, Markiel A, Ozier O, et al:
Cytoscape: a software environment for integrated models of
biomolecular interaction networks. Genome Res. 13:2498–2504. 2003.
View Article : Google Scholar : PubMed/NCBI
|
|
19
|
Bader GD and Hogue CW: An automated method
for finding molecular complexes in large protein interaction
networks. BMC Bioinformatics. 4(2): 2003
|
|
20
|
Lin WH, Liu WC and Hwang MJ: Topological
and organizational properties of the products of house-keeping and
tissue-specific genes in protein-protein interaction networks. BMC
Syst Biol. 3(32): 2009
|
|
21
|
Yook SH, Oltvai ZN and Barabási AL:
Functional and topological characterization of protein interaction
networks. Proteomics. 4:928–942. 2004. View Article : Google Scholar : PubMed/NCBI
|
|
22
|
Wasserman S and Faust K: Social Network
Analysis. Cambridge University Press; Cambridge: 1994, View Article : Google Scholar
|
|
23
|
Freeman LC: Centered graphs and the
construction of ego networks. Math Social Sci. 3:291–304. 1982.
View Article : Google Scholar
|
|
24
|
Kanehisa M and Goto S: KEGG: Kyoto
encyclopedia of genes and genomes. Nucleic Acids Res. 28:27–30.
2000. View Article : Google Scholar
|
|
25
|
Huang DW, Sherman BT and Lempicki RA:
Systematic and integrative analysis of large gene lists using DAVID
bioinformatics resources. Nat Protoc. 4:44–57. 2008. View Article : Google Scholar
|
|
26
|
Tranchevent LC, Capdevila FB, Nitsch D,
Moor BD, Causmaecker PD and Moreau Y: A guide to web tools to
prioritize candidate genes. Brief Bioinform. 12:22–32. 2011.
View Article : Google Scholar : PubMed/NCBI
|
|
27
|
Ozgür A, Vu T, Erkan G and Radev DR:
Identifying gene-disease associations using centrality on a
literature mined gene-interaction network. Bioinformatics.
24:i277–i285. 2008. View Article : Google Scholar : PubMed/NCBI
|
|
28
|
Shi L, Jones WD, Jensen RV, et al: The
balance of reproducibility, sensitivity, and specificity of lists
of differentially expressed genes in microarray studies. BMC
Bioinformatics. 9(Suppl 9): S102008. View Article : Google Scholar : PubMed/NCBI
|
|
29
|
Berlingieri MT, Pallante P, Sboner A, et
al: UbcH10 is overexpressed in malignant breast carcinomas. Eur J
Cancer. 43:2729–2735. 2007. View Article : Google Scholar : PubMed/NCBI
|
|
30
|
Rutnam ZJ and Yang BB: The non-coding 3′
UTR of CD44 induces metastasis by regulating extracellular matrix
functions. J Cell Sci. 125:2075–2085. 2012. View Article : Google Scholar : PubMed/NCBI
|
|
31
|
Braga-Neto UM and Dougherty ER: Is
cross-validation valid for small-sample microarray classification?
Bioinformatics. 20:374–380. 2004. View Article : Google Scholar : PubMed/NCBI
|
|
32
|
Nibbe RK, Chowdhury SA, Koyutürk M, Ewing
R and Chance MR: Protein-protein interaction networks and
subnetworks in the biology of disease. Wiley Interdiscip Rev Syst
Biol Med. 3:357–367. 2011. View Article : Google Scholar
|
|
33
|
Palla G, Derényi I, Farkas I and Vicsek T:
Uncovering the overlapping community structure of complex networks
in nature and society. Nature. 435:814–818. 2005. View Article : Google Scholar : PubMed/NCBI
|
|
34
|
Estrada E: Virtual identification of
essential proteins within the protein interaction network of yeast.
Proteomics. 6:35–40. 2006. View Article : Google Scholar
|