Introduction
Studies on the correlation between alcohol and type
2 diabetes mellitus (T2DM) have indicated that ethanolism is one of
the predisposing factors for T2DM (1–3).
As demonstrated by previous studies (1–4),
there is a U- or J-shaped correlation between alcohol consumption
and diabetes, namely the risk of diabetes is lowest for subjects
with appropriate alcohol intake, while for patients with excessive
ethanol consumption, the risk is relatively high. However, the
relevant etiology of T2DM induced by excessive alcohol consumption
has not yet been elucidated.
Insulin resistance is the pathological basis for
T2DM, and is associated with an insulin-mediated decrease in the
glucose uptake capability of the liver, skeletal muscle and
adipocytes, as well as a reduction in glycogen synthesis in
hepatocytes (5,6). Since the liver is the main organ
responsible for glucose and lipid metabolism, it is able to
regulate blood glucose through hepatocellular glycogen synthesis
and gluconeogenesis (7). The
dysfunction of the insulin signaling pathway has been reported to
be one of the important factors for the development of insulin
resistance. Normally, the insulin and insulin receptor (IR) complex
are activated by phosphorylation, and in turn stimulate the
downstream insulin receptor substrate (IRS), phosphatidylinositol
3-kinase (PI3K) and protein kinase B (PKB, also known as Akt),
resulting in the transduction of insulin-mediated signaling and the
regulation of hepatocellular glycogen synthesis and gluconeogenesis
(8). It has been demonstrated
that alcohol consumption induces an increase in intracellular
calcium ([Ca2+]i) levels and hepatocellular
damage. Hepatocellular calcium overload significantly contributes
to ethanol-induced hepatic injury (9). In addition to causing direct damage
to hepatocytes, ethanol intake may induce insulin resistance by
interfering with glycogen synthesis, gluconeogenesis and relevant
signal transduction. In the present study, human hepatocytes were
treated with various concentrations of ethanol. Changes in the
[Ca2+]i levels and in the expression of key
signaling molecules of the insulin signaling pathway, as well as
changes in relevant phosphorylation profiles were determined. The
effects of [Ca2+]i on insulin signaling were
examined by Ca2+ channel blockage assay in order to
elucidate the mechanisms responsible for the ethanol-induced
increase in hepatocellular calcium ions and its effects on the
insulin signaling pathway.
Materials and methods
Cell source and culture
Human hepatocytes (L-02), supplied by the Cell Bank
of Shanghai Institutes for Biological Sciences, Chinese Academy of
Sciences (Shanghai, China), were incubated in RPMI-1640 medium
(Gibco, Carlsbad, CA, USA) containing 10% fetal calf serum (FCS) at
37°C and 5% CO2.
Ethanol treatment of hepatocytes
The L-02 cells were inoculated into 6-well plates
(1×10⁵ cells/well) and cultured overnight at 37°C in 5%
CO2 to form a cellular monolayer. The medium was then
replaced with serum-free RPMI-1640 medium containing ethanol at
various concentrations (0, 0.5, 1, 2 or 4%, v/v), based on the
reaction time and concentrations specified in the literature
(9–11). After being sealed with parafilm,
the culture was incubated at 37°C in 5% CO2 for 0, 2, 6,
12 or 24 h. Due to the concentration reduction caused by ethanol
volatilization, the culture medium was replaced with fresh medium
containing ethanol (concentration unchanged) every 6 h.
Examination of biochemical
parameters
Following incubation, the supernatants were
collected and the concentration of alanine aminotransferase (ALT)
and aspartate aminotransferase (AST) was determined for each
culture using an Aeroset automatic biochemical analyzer (Abbott
Laboratories, Abbott Park, IL, USA). The extent of ethanol-induced
hepatocellular damage at different concentrations was analyzed
according to the ALT and AST leakage.
Cell viability assays
The L-02 cells were inoculated into 96-well plates
(1×10⁴ cells/well) and cultured overnight at 37°C in 5%
CO2 to form a cellular monolayer. The cultures were
treated with various concentrations of ethanol for 24 h, followed
by the addition of 20 µl of CCK-8 solution (Beyotime
Institute of Technology, Haimen, China). The mixture was incubated
for a further 2 h. The absorbance was then measured at 450 nm using
an iMark Microplate Absorbance Reader (Bio-Rad, Hercules, CA,
USA).
[Ca2+]i assays
The cell cultures were treated with various
concentrations of ethanol for various periods of time prior to
trypsinization with 0.25% trypsin. The cell suspensions were
collected by centrifugation at 500 × g for 5 min. After washing
with D-Hank's solution and centrifugation, the cell pellets were
resuspended in 500 µl of RPMI-1640 medium containing 5
µM Fluo-4 AM (Ca2+ fluorescence indicator;
Molecular Probes, Eugene, OR, USA), 0.1% Pluronic F-127
(Sigma-Aldrich, St. Louis, MO, USA) and 0.2% BSA (Amresco LLC,
Solon, OH, USA). After staining for 30 min at 37°C, the cells were
centrifuged and washed twice with D-Hank's solution to remove the
staining reagent, followed by a 30-min incubation with serum-free
RPMI-1640 medium for AM de-esterification to release the indicator.
The fluorescence intensity of intracellular Ca2+ was
then determined by flow cytometry using a BD FACSCanto™ II flow
cytometer (BD Diagnostic Systems, Sparks, MD, USA), and the mean
fluorescence intensity of a total of 10,000 cells was evaluated
using BD FACSDiva software version 8.0 (BD Diagnostic Systems).
Furthermore, 5×10⁴ cells were seeded in 12-well culture
plates (Corning Inc., Union City, CA, USA) containing 20-mm
diameter coverslips and incubated overnight at 37°C to form a cell
monolayer. Following treatment with 2 or 4% ethanol for 24 h, the
cells were washed thoroughly with D-Hank's solution and stained
with Fluo-4 AM as described above. After staining, the coverslips
were removed and the cells were fixed with ice-cold methanol, and
then mounted on a glass slide for the determination of the
[Ca2+]i fluorescence intensity under a laser
confocal scanning microscope (LSM510; Zeiss, Jena, Germany) with an
excitation wavelength of 494 nm and emission wavelength of 516
nm.
Reverse transcription-quantitative
polymerase chain reaction (RT-qPCR)
The PCR primer sequences for human insulin receptor
substrate 1 (IRS1), IRS2, PI3K and
β-actin (as the internal control) for RT-qPCR were obtained
from the RTPrimerDB database (the real-time PCR primer and probe
database). The primer sequences for human glucose transporter 2
(GLUT2) were as previously described (12). The above-mentioned primers were
synthesized by Invitrogen Co., (Shanghai, China) (Table I). The cell cultures were treated
with various concentrations of ethanol for 24 h and the cells were
harvested using a scraper. Total RNA was extracted using TRIzol
reagent (Invitrogen Life Technologies, Carlsbad, CA, USA). The
content and purity of the RNA were determined by spectrophotometry.
Using a PrimeScript® RT reagent kit (Takara Bio, Inc.,
Shiga, Japan), cDNA was prepared by the reverse transcription of
equal amounts of total RNA from each cell culture, according to the
manufacturer's instructions. Each sample was subjected to PCR
amplification using a SYBR® Premix Ex Taq™ II kit
(Takara Bio, Inc.) on an ABI 7500 Real-Time PCR System (Applied
Biosystems, Foster City, CA, USA). The reaction volume was 20
µl, containing 0.2 µM primers and 2 µl cDNA
template. The PCR program used was: 95°C for 30 sec, followed by 40
cycles of 95°C for 5 sec and 60°C for 20 sec. The RT-qPCR results
were quantitatively analyzed using REST 2005 software and the ΔΔCT
relative quantification method, as previoulsy described (13).
 | Table IPrimers for RT-qPCR. |
Table I
Primers for RT-qPCR.
| Gene | Forward primer
(5′→3′) | Reverse primer
(5′→3′) | Size (bp) |
|---|
| IRS1 |
CAGCTCACCTTCTGTCAGG |
AGGTCCATCTTCATGTACTCC | 90 |
| IRS2 |
ATTGACTTCTTGTCCCACCA |
TCCAAAAGAAAACTGCAAGC | 157 |
| PI3K
(p85α) |
GATTCTCAGCAGCCAGCTCTGAT |
GCAGGCTGTCGTTCATTCCAT | 91 |
| GLUT2 |
TGGGCTGAGGAAGAGACTGT |
CATAGGAACCAGGCCTGAAA | 282 |
| β-actin |
CTGGAACGGTGAAGGTGACA |
AAGGGACTTCCTGTAACAATGCA | 140 |
Western blot analysis
The cell cultures were treated with various
concentrations of ethanol for 24 h, and then harvested using a
scraper followed by centrifugation at 500 × g for 5 min. The cell
pellets were lysed with 200 µl lysis buffer (Beyotime
Institute of Technology) and the lysates were centrifuged at 17,200
× g for 5 min to collect the supernatant specimens for western blot
analysis. Following protein quantification, 50 µg of protein
were resolved by SDS-PAGE and electrically transferred onto PVDF
membranes. Using rabbit-IgG against human PI3K (Cat. no.
93-3959-100) or Akt/PKB (Cat. no. 93-3247-100; dilution 1:500; both
from BioVision, Inc., Milpitas, CA, USA) as the primary antibody,
and HRP-conjugated goat anti-rabbit-IgG (Cat. no. LK-ab5178-100;
1:3,000; LiankeBio, Hangzhou, China) as the secondary antibody,
western blot analyses were performed to determine the effects of
various concentrations of ethanol on the expression of PI3K and
PKB, with β-actin as the internal reference. To examine the effects
of ethanol on the phosphorylation profiles of critical signaling
molecules in the insulin signaling pathway, the medium was changed
to ethanol- and serum-free RPMI-1640 medium following the 24-h
ethanol treatments. Insulin (100 nM) was then added to each well
and the culture was incubated for a further 30 min. The cells were
harvested as described above and were used for protein extraction.
Western blot analyses for detecting the phosphorylation profiles of
PI3K and PKB were performed as described above, with rabbit-IgG
against human phospho-Tyr508-PI3K (p85α; Cat. no. sc-12929-R) and
phospho-Thr308-Akt/PKB (Cat. no. sc-16646-R) or
phospho-Ser473-Akt/PKB (Cat. no. sc-7985-R; all from Santa Cruz
Biotechnology, Inc., Santa Cruz, CA, USA) as the primary
antibodies.
Ca2+ channel blockage
assays
The L-02 cells were inoculated into 6-well plates
(1×10⁵ cells/well) and cultured overnight at 37°C in 5%
CO2 to form a cell monolayer. The culture medium was
replaced, followed by the addition of 100 µl of a
Ca2+ channel blocker and/or a chelating agent with the
following final concentrations: 1 mM EGTA (extracellular
Ca2+ chelator), 50 µM 2-APB (IP3 receptor
antagonist), or 1 mM EGTA + 50 µM 2-APB. The cells were
pre-treated for 30 min at 37°C prior to treatment with 2% ethanol
for 24 h. The medium was replaced with ethanol- and serum-free
RPMI-1640 containing 100 nM insulin and incubated for a further 30
min. The fluorescence intensity of [Ca2+]i
was assayed by flow cytometry. Simultaneously, cells were harvested
for protein extraction. The effects of ethanol on the
phosphorylation profiles of PI3K and PKB following Ca2+
blockage were examined by western blot analysis as described
above.
Statistical analysis
The results are presented as the means ± SD. SPSS
16.0 software was used to perform the Student's t-test for
comparisons between groups. A P-value <0.05 was considered to
indicate a statistically significant difference.
Results
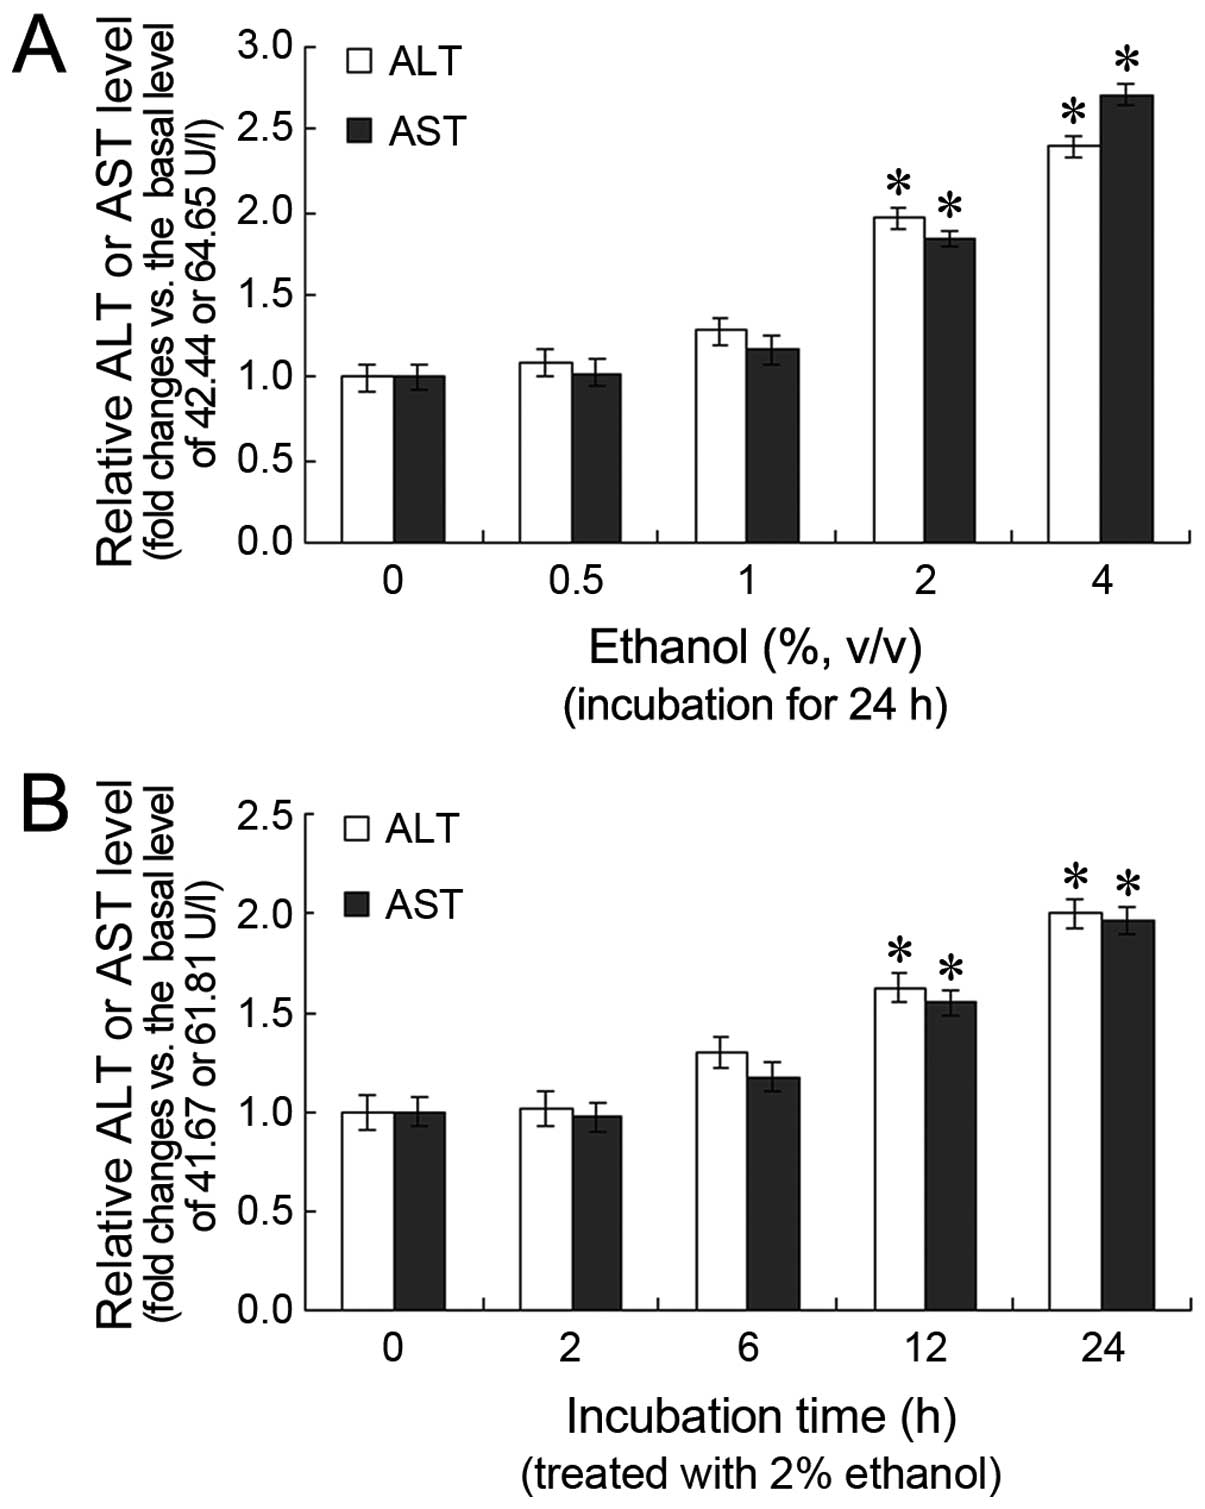
Effects of ethanol on ALT and AST levels
in L-02 cells
Following treatment with various concentrations of
ethanol for 24 h, the ALT and AST levels in the cell cultures
increased in a dose-dependent manner, with a statistically
significant difference observed between the 2 and 4%
ethanol-treated groups (P<0.05) and the untreated group
(Fig. 1A). Furthermore, the ALT
and AST levels increased in a time-dependent manner. The ALT and
AST levels were significantly higher after 12 and 24 h of
treatment, compared with the 0 h time point (P<0.05; Fig. 1B).
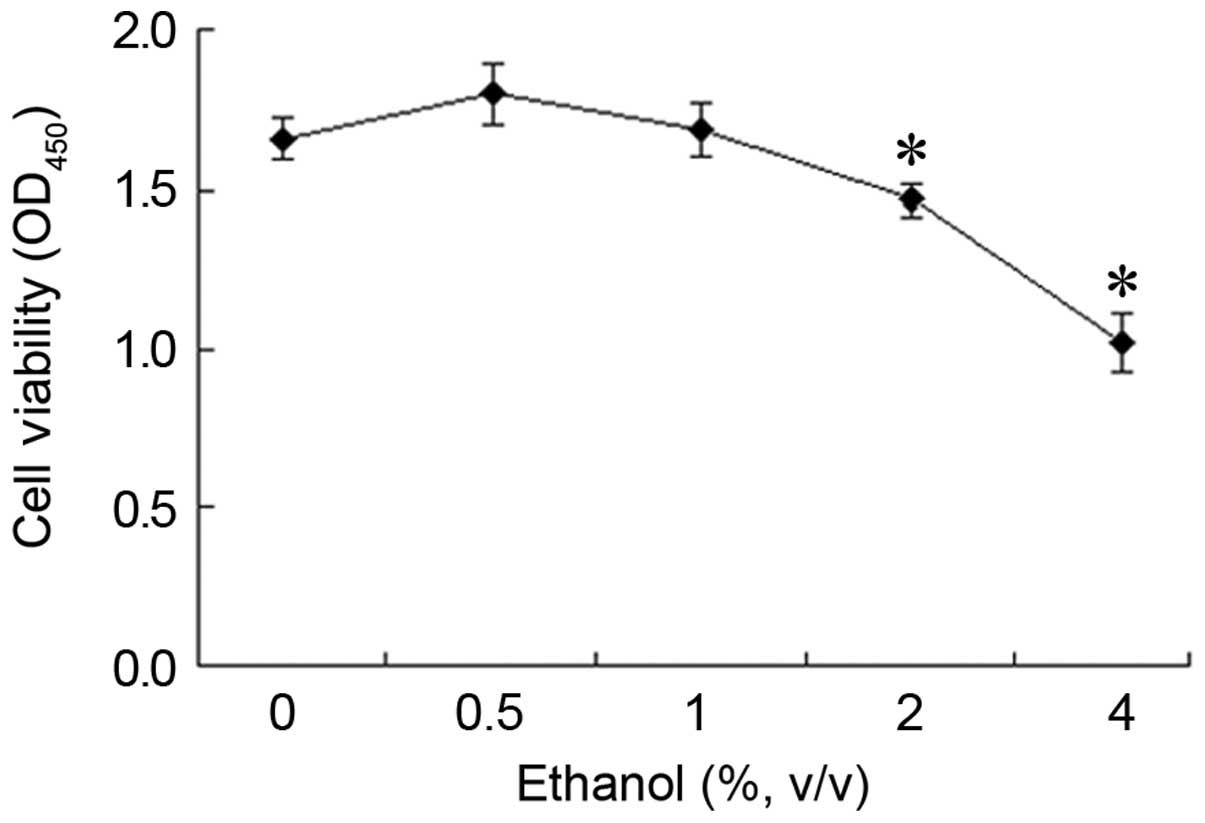
Effect of ethanol on L-02 cell
viability
Following treatment with 0.5% ethanol for 24 h, an
increase in cell viability was observed. However, this increase was
not statistically significant compared with the control group
(Fig. 2). By contrast, when the
cells were treated with higher concentrations of ethanol, cell
viability decreased in a concentration-dependent manner. The
OD450 value which reflects the cell viability decreased
from 1.66 to 1.46 or 1.02 following treatment with 2% or 4% ethanol
for 24 h, representing a cell viability of 88.32% (1.46/1.66) and
61.41% (1.02/1.66) of the control group, respectively.
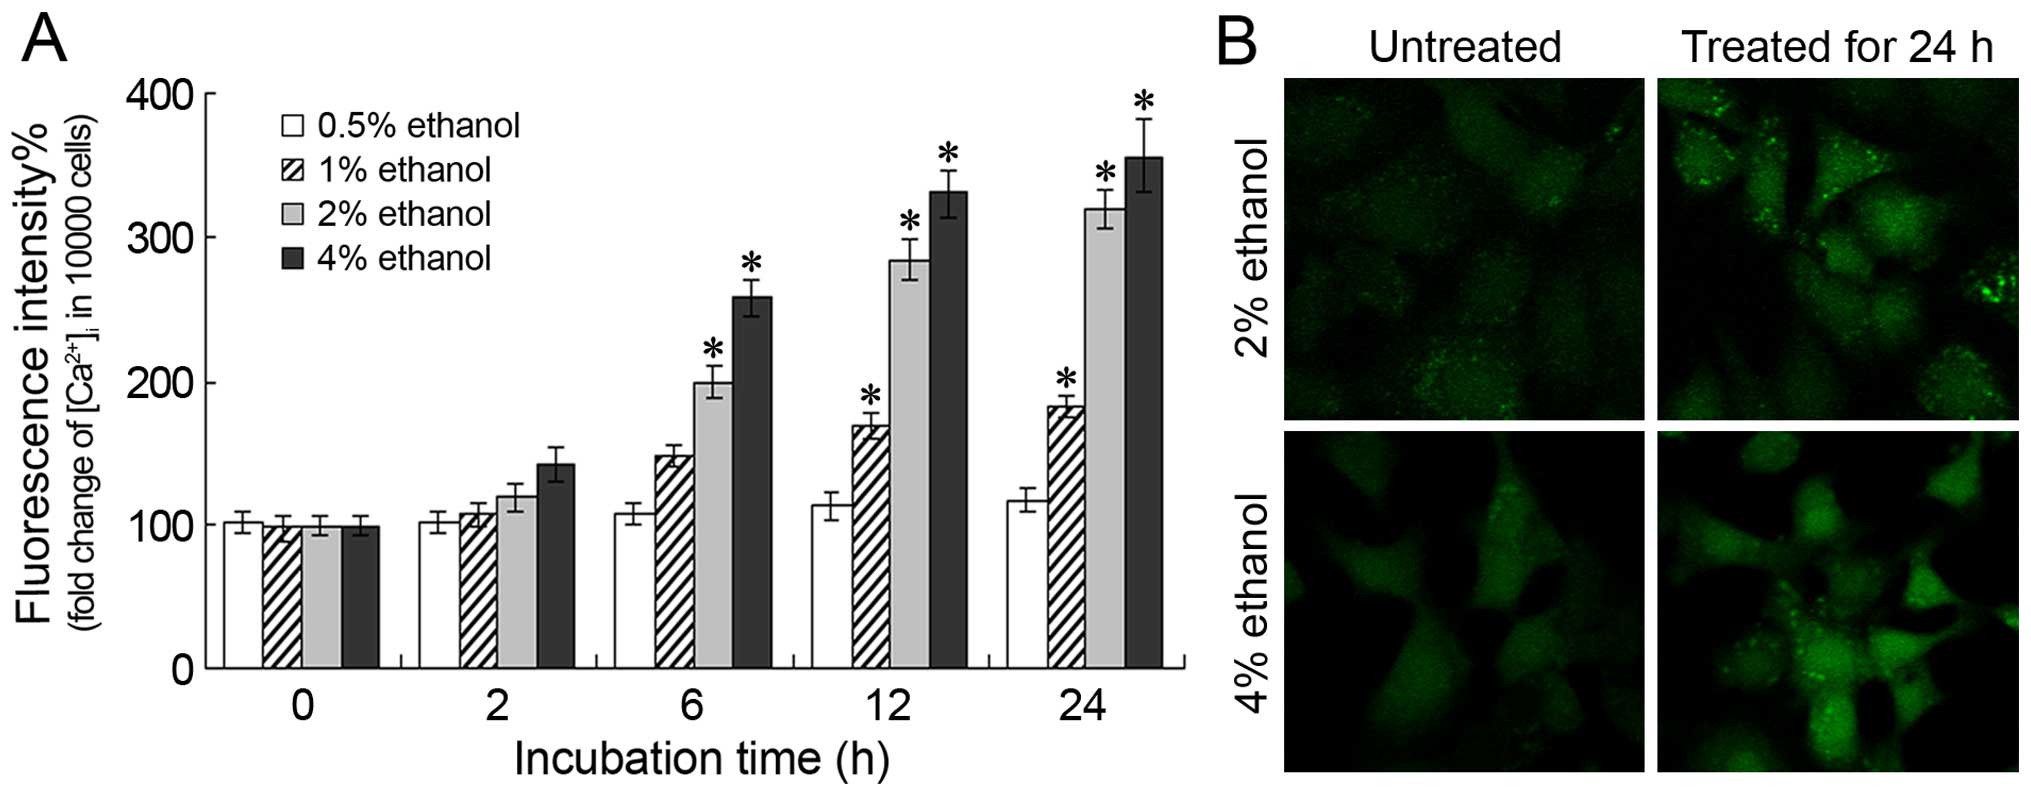
Changes in [Ca2+]i
levels
Following treatment with various concentrations of
ethanol for different periods of time, the increase in the
fluorescence intensity of [Ca2+]i correlated
with the increase in the ethanol concentration and the treatment
duration, indicating that ethanol administration induces an
increase in the [Ca2+]i levels (Fig. 3A). A significant increase in the
[Ca2+]i levels was observed following
treatment with 2 or 4% ethanol for 6 h (P<0.05). Moreover,
following treatment with 2 or 4% ethanol for 24 h, the
[Ca2+]i levels were 319.19±13.50% and
356.65±25.75% of those of the control level, respectively. These
results were further confirmed by confocal microscopy; a
significant increase in the Ca2+ fluorescence intensity
was observed following treatment with 2 or 4% ethanol for 24 h
(Fig. 3B).
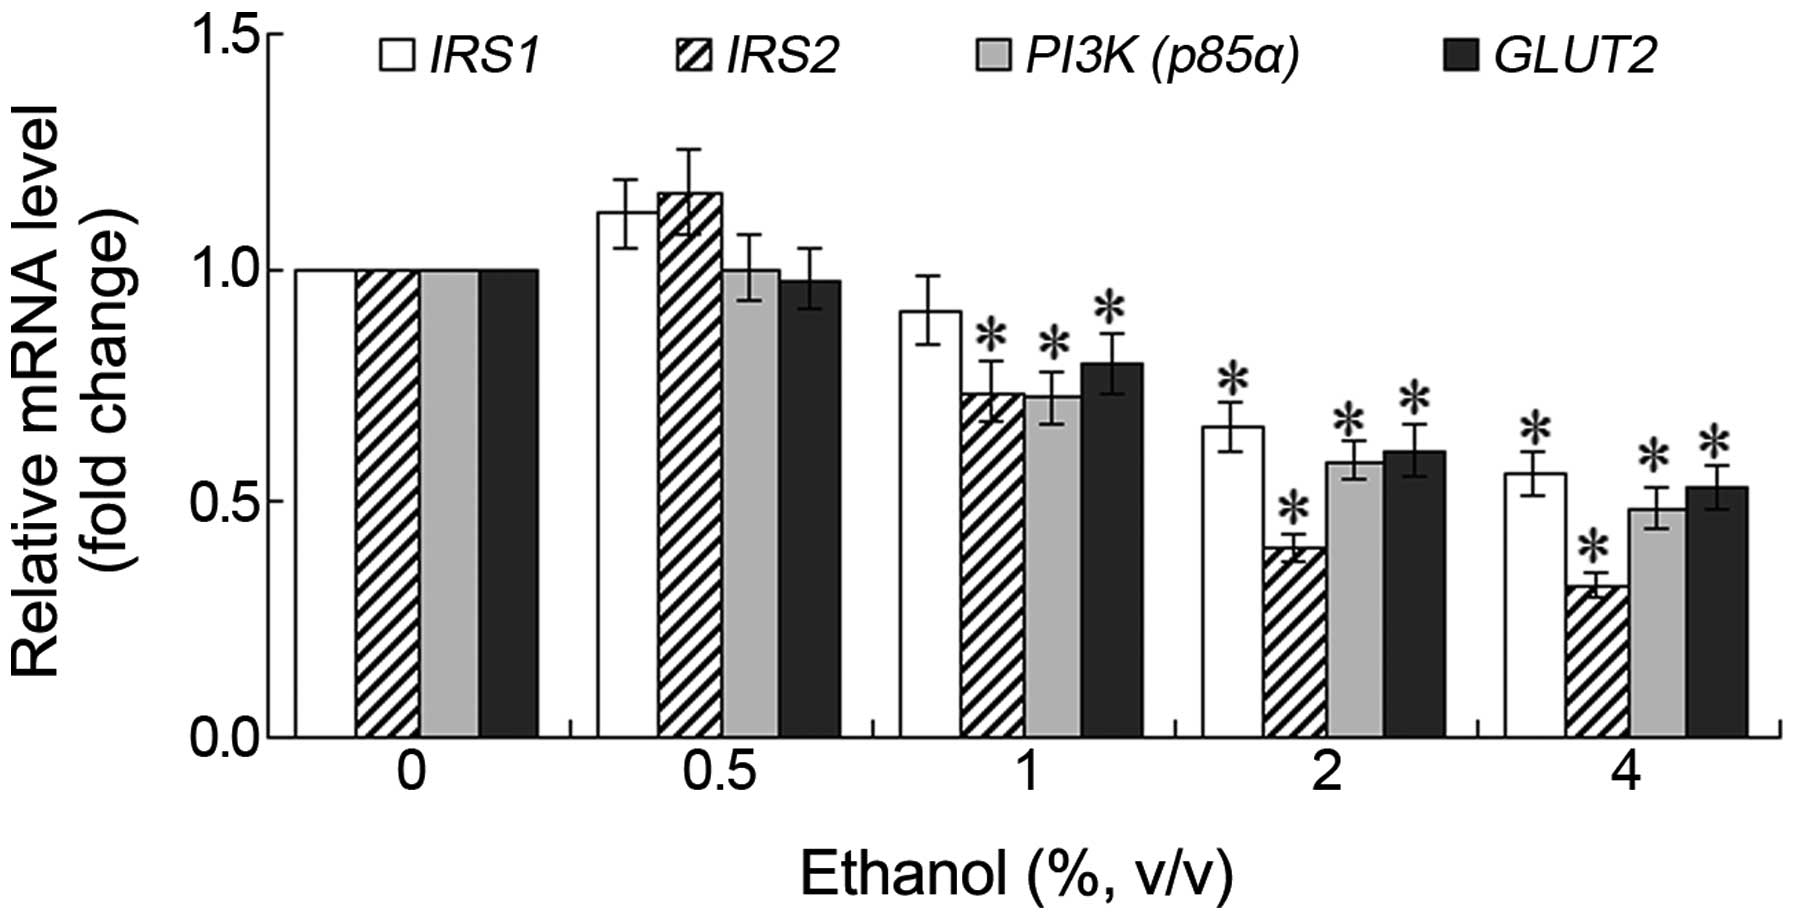
Changes in the mRNA expression of IRS1,
IRS2, PI3K and GLUT2
Following treatment of the L-02 cells with various
concentrations of ethanol for 24 h, the mRNA expression levels of
PI3K (p85α) and GLUT2 decreased, although a
slight increase in the mRNA expression levels of IRS1 and
IRS2 was observed following treatment with 0.5% ethanol.
However, these differences were not statistically significant. As
the ethanol concentration increased, the mRNA expression levels of
these genes decreased in a dose-dependent manner. The most
significant decrease observed was in the mRNA expression of
IRS2 (Fig. 4). Following
treatment with 1% ethanol for 24 h, a significant decrease was
observed in the mRNA expression levels of IRS2, PI3K
(p85α) and GLUT2 (P<0.05). Following treatment
with 2 or 4% ethanol for 24 h, the mRNA expression level of
IRS2 in the L-02 cells decreased to 0.41 and 0.34 fold of
the control, respectively (Fig.
4).
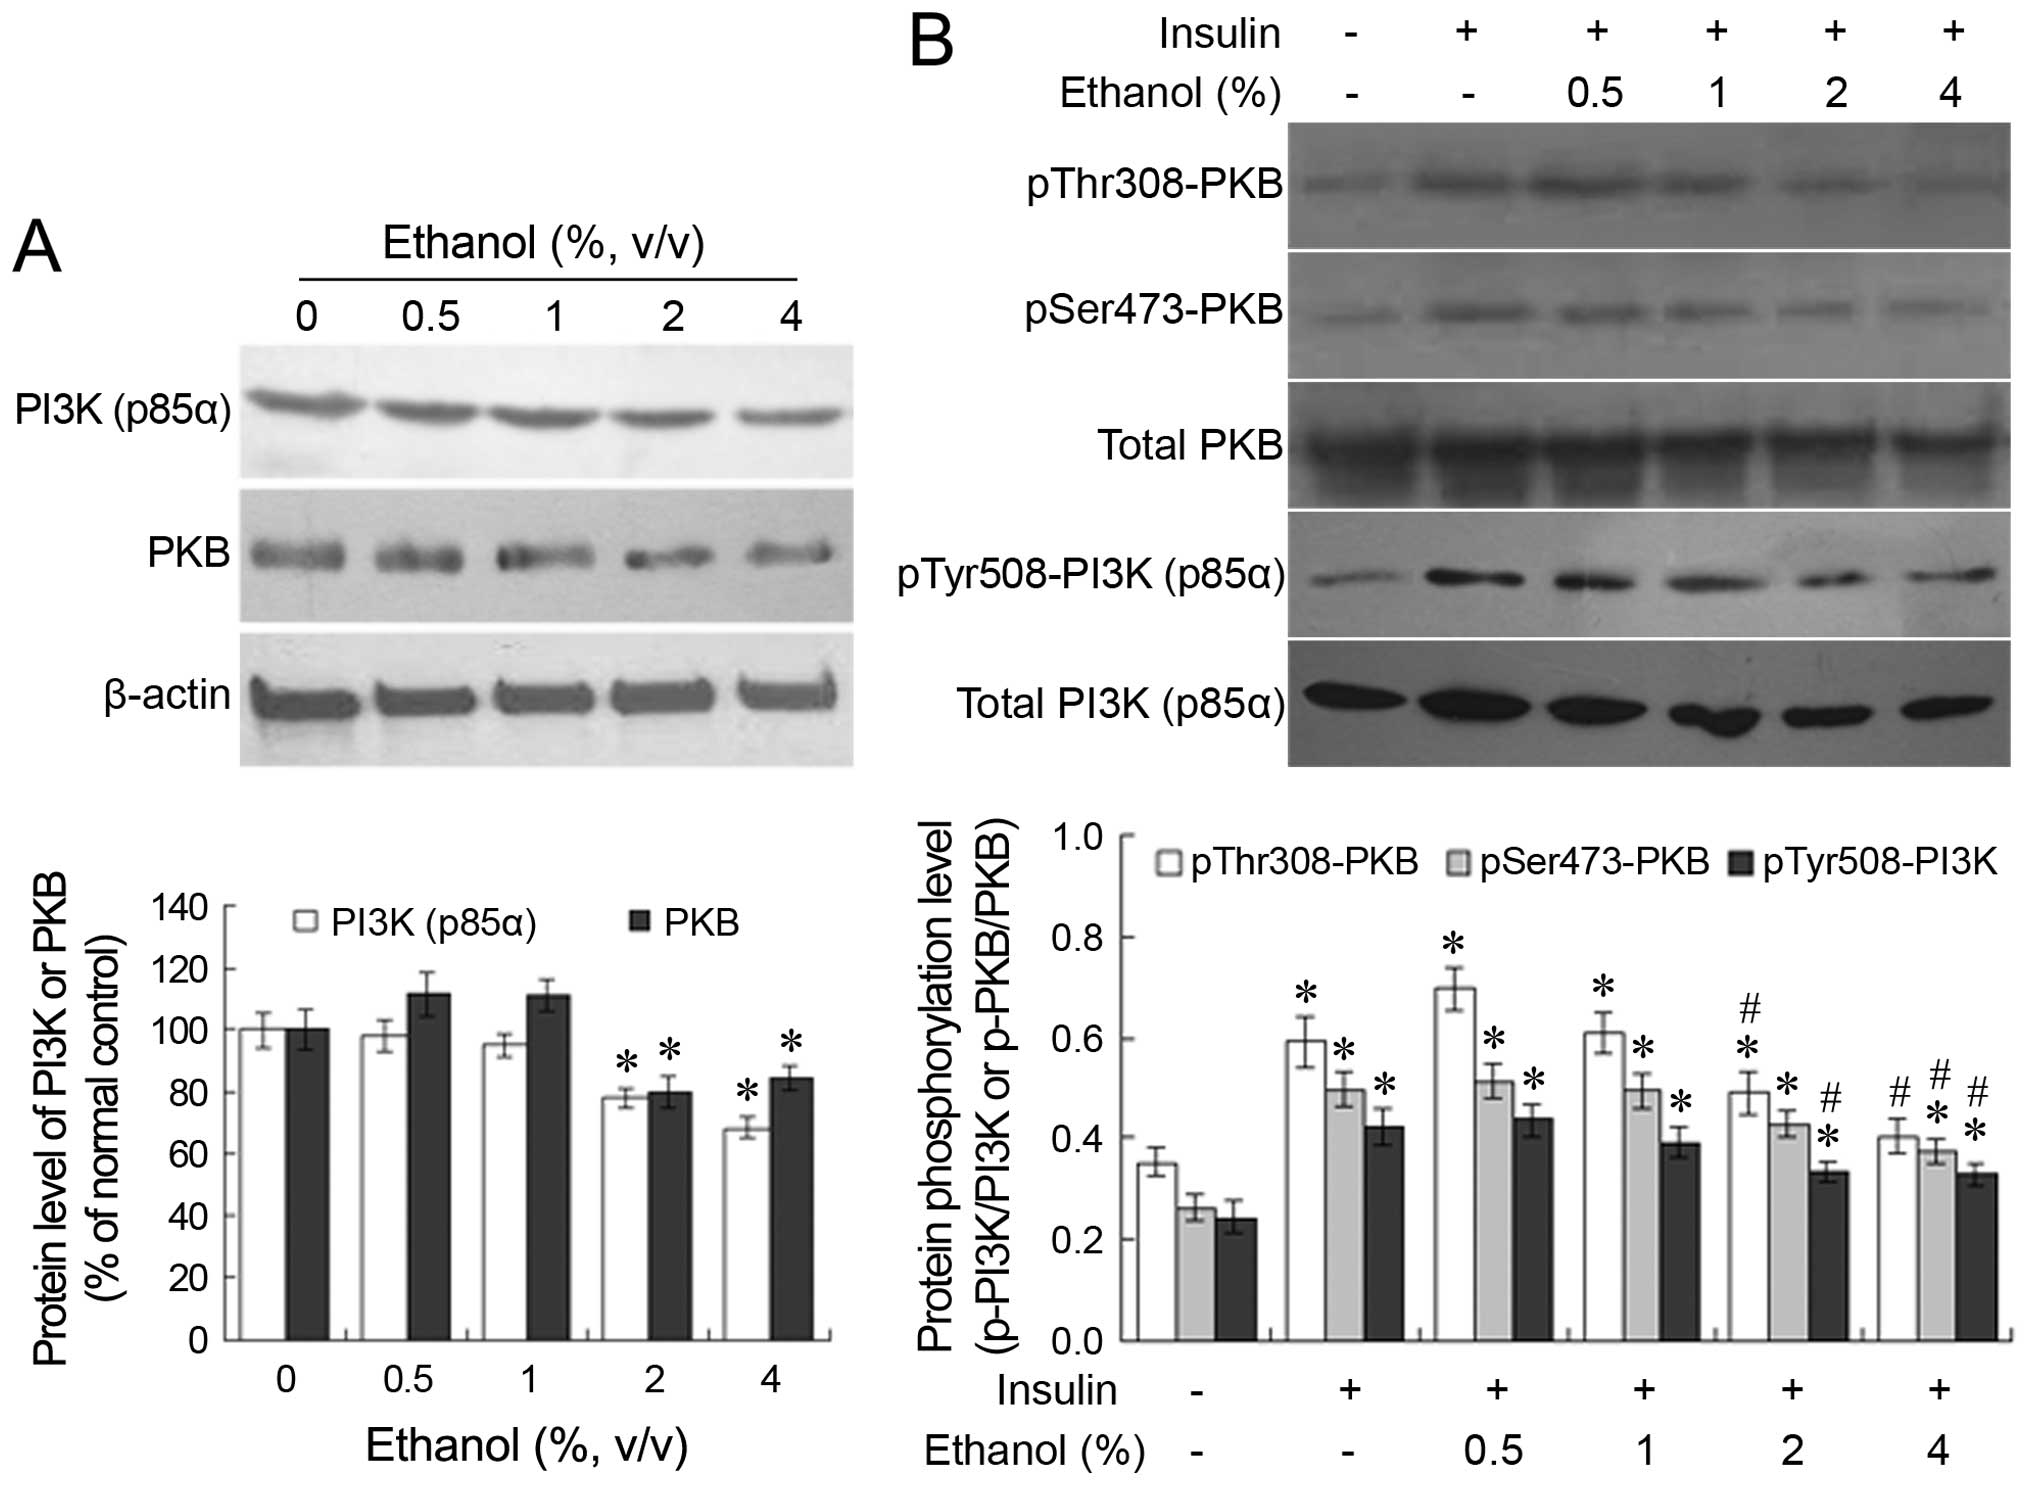
Changes in the protein expression and the
phosphorylation profiles of PI3K (p85α) and PKB
Following treatment with 0.5 or 1% ethanol for 24 h,
no significant changes were observed in the protein expression of
PI3K (p85α) and PKB in the L-02 cells. However, following treatment
with 2 or 4% ethanol for 24 h, a significant decrease was observed
in the protein expression of PI3K (p85α) and PKB compared with the
untreated group (P<0.05; Fig.
5A). When the ethanol-treated cells were further stimulated
with insulin, the insulin-induced phosphorylation of PKB and PI3K
(p85α) decreased in an ethanol dose-dependent manner (Fig. 5B). The administration of 2 or 4%
ethanol significantly suppressed the insulin-induced
phosphorylation of PKB and PI3K (p85α) compared with the group not
treated with ethanol.
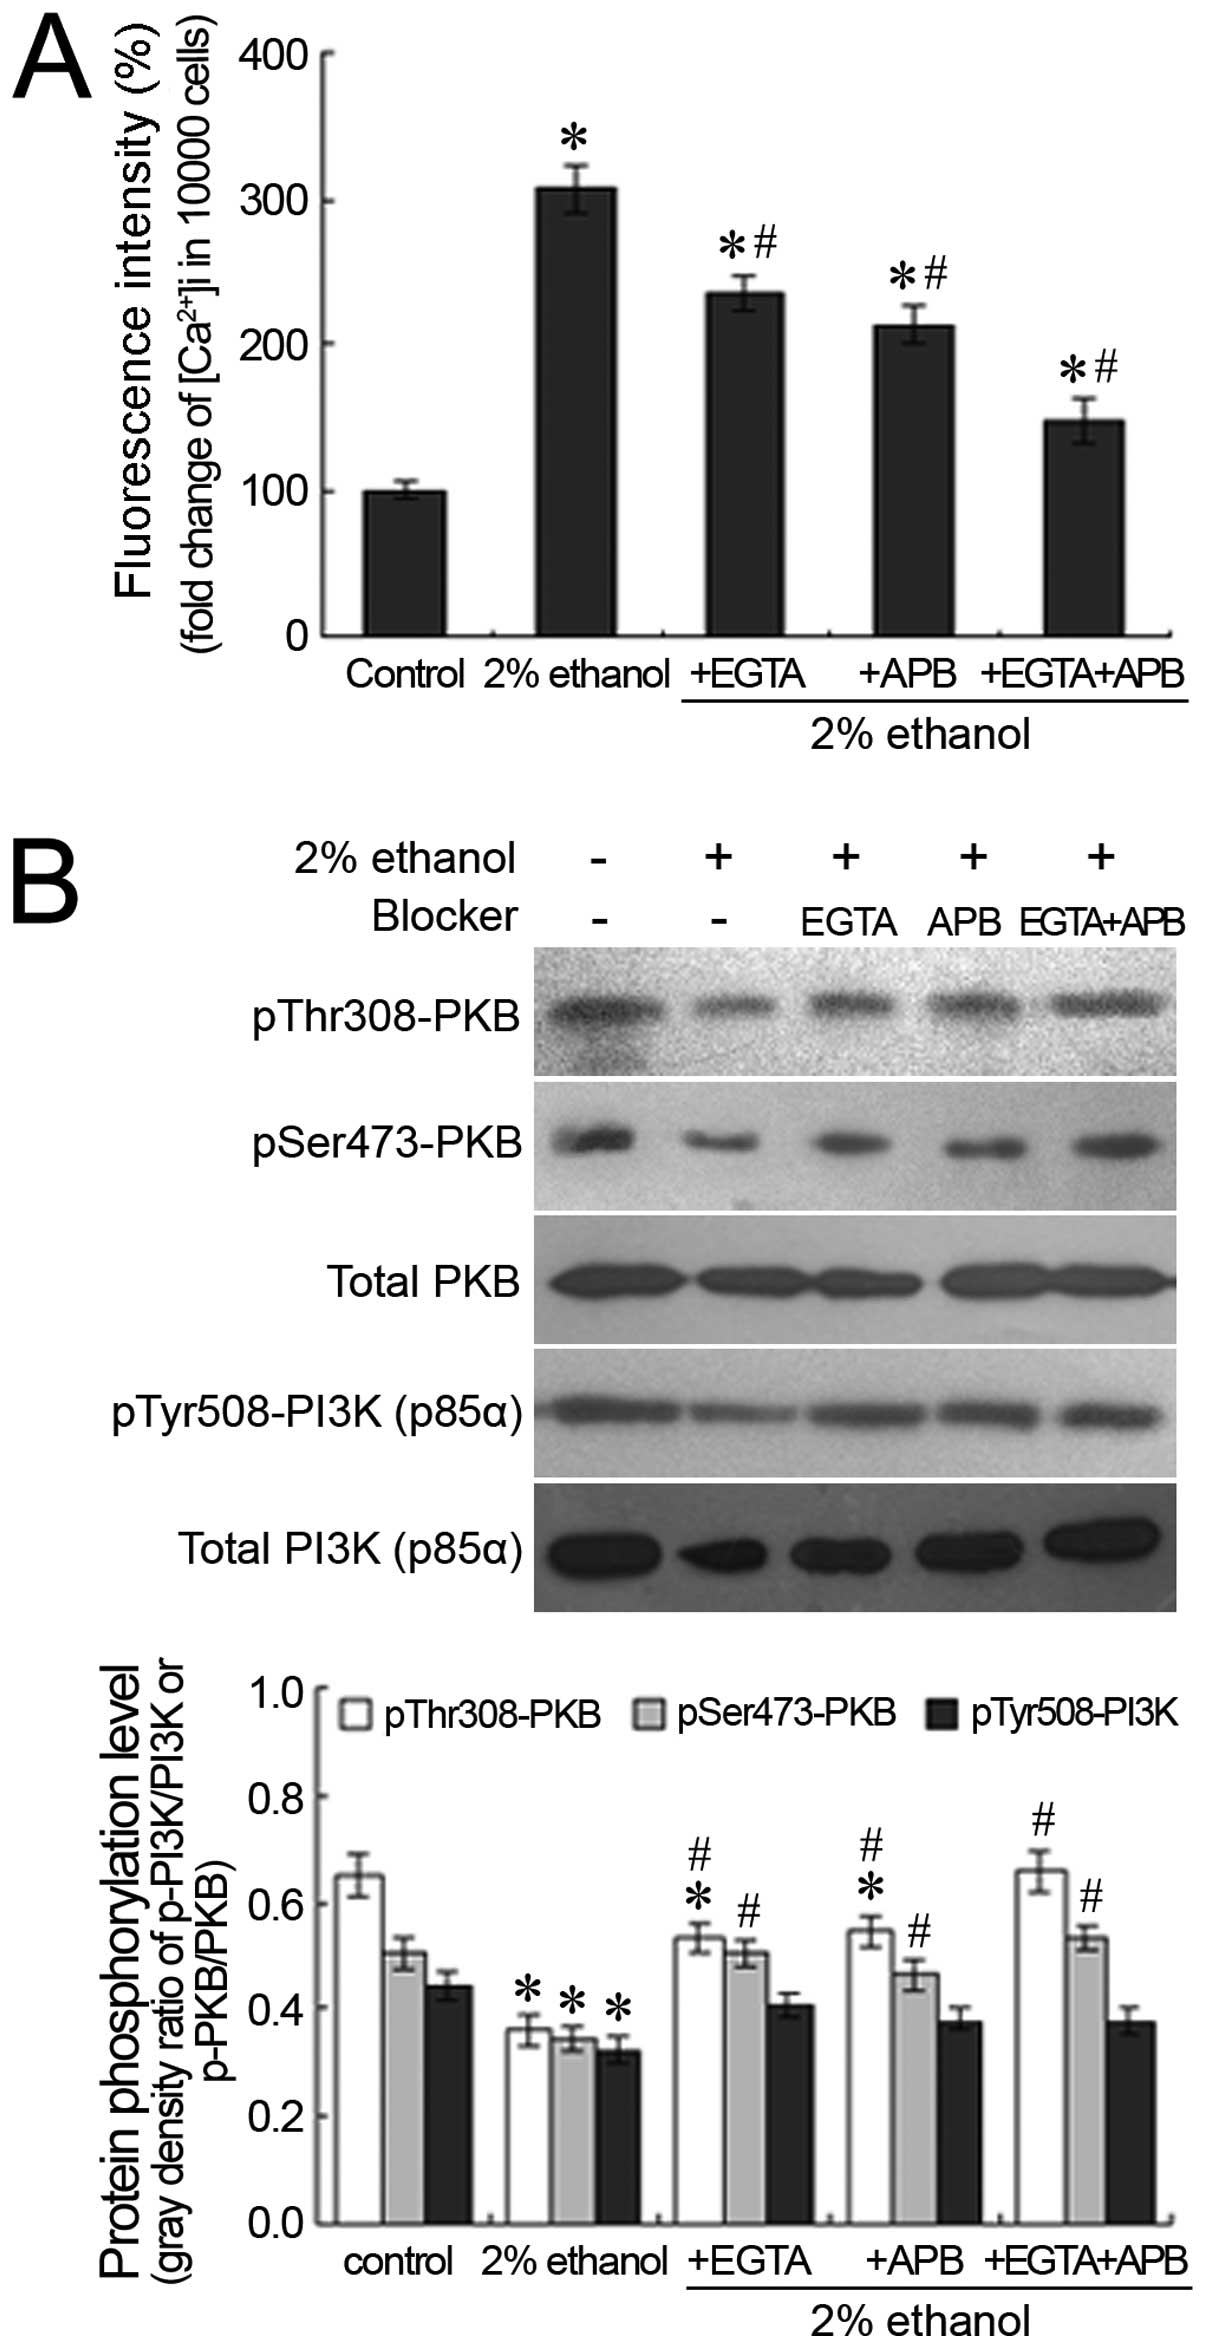
Effects of ethanol on
[Ca2+]i levels and the phosphorylation
profiles of PI3K (p85α) and PKB following Ca2+
blockage
The extracellular Ca2+ chelator, EGTA,
and the IP3 receptor antagonist, 2-APB, were employed to chelate
the influx of extracellular calcium and to block the release of the
intracellular calcium pool, respectively. Following treatment with
EGTA or 2-APB, the ethanol-induced elevation in the hepatocellular
Ca2+ concentration was significantly suppressed
(P<0.05). This was particularly evident when intracellular and
extracellular Ca2+ were blocked by the administration of
both agents and the ethanol-induced [Ca2+]i
decreased to 147.13% of the control (Fig. 6A). With the suppression of the
increase in the [Ca2+]i levels, the
ethanol-induced decrease in the phosphorylation of PI3K (p85α) and
PKB was partially reversed. Following the concomitant
administration of EGTA and 2-APB, the inhibitory effects of ethanol
on the phosphorylation of PI3K (p85α) and PKB were attenuated; the
phosphorylation levels of PI3K (p85α) and PKB following treatment
with both EGTA and 2-APB were similar to those of the control
(Fig. 6B).
Discussion
It has been established that long-term excessive
alcohol intake is associated with an increased risk of heart and
hepatic diseases, hyperglycemia, diabetes and other related
diseases (14). With the
development of the Chinese economy, the proportion of the
population with alcoholism has increased; alcohol abuse is a
serious risk factor which is harmful to health in the long-term in
China (15). Several
epidemiological studies have demonstrated that excessive alcohol
intake is associated with an increased risk of developing T2DM and
other metabolic disorders (3,16,17); however, the molecular mechanisms
responsible for alcohol-induced insulin resistance have not yet
been elucidated.
Insulin resistance is the key pathological feature
of T2DM, with the decreased sensitivity of peripheral tissues to
insulin as the major presentation. The main manifestations include
the decreased insulin-mediated glucose uptake capacity of the
liver, skeletal muscle and adipocytes, and the dysfunction of
hepatocellular glycogen synthesis (5,6).
It has been demonstrated that excessive alcohol intake is
associated with insulin resistance (18,19); however, the mechanisms involved
remain unknown. As the main organ responsible for glucose and lipid
metabolism, the liver regulates blood glucose through
hepatocellular glycogen synthesis and gluconeogenesis. Xu et
al observed that, in rats, alcohol administration correlated
with a decrease in glucose synthesis in the liver, the activity of
glycogen synthase and glucose uptake by skeletal muscle, as well as
in glycogen synthesis (20). One
of the main physiological functions of insulin is to regulate
glucose metabolism and to maintain blood glucose levels. The normal
function of insulin depends on the effective transduction of the
insulin signal, and its dysfunction is considered to be one of the
important contributors to the development of insulin resistance.
Thus, the present study, we aimed to elucidate the effects of
ethanol on the insulin signaling pathway and the related
mechanisms. We examined the expression levels of critical signaling
molecules in the insulin signaling pathway and the changes in the
phosphorylation profiles in L-02 human hepatic cells, which were
selected as target cells and were treated with various
concentrations of ethanol for various periods of time.
Our results demonstrated that low concentrations
(0.5 or 1%) of ethanol had no suppressive effect on cell viability.
However, with an increase in the ethanol concentration, cell
viability decreased. Following treatment with 2 or 4% ethanol for
24 h, cell viability decreased to 88.32 and 61.41% of the control,
respectively. Furthermore, ALT/AST leakage from of the cells
increased in a time- and dose-dependent manner, suggesting that
ethanol administration in vitro is associated with the
exacerbation of cell damage.
It is well known that, during the insulin signaling
process, the combination of insulin and its receptors results in
receptor dimerization and autophosphorylation. IR tyrosine kinase
activation subsequently recruits and phosphorylates several
substrates, including IRS1-4, thereby providing specific docking
sites for the recruitment of other downstream signaling proteins,
leading to the activation of the PI3K→PKB signaling cascades
(21,22). In the present study, following
treatment with various concentrations of ethanol for 24 h, a slight
increase in the mRNA expression levels of IRS1 and
IRS2 in the L-02 cells was observed with a low ethanol
concentration (0.5%); however, these expression levels decreased
with higher ethanol concentrations in a dose-dependent manner,
particularly those of IRS2. It has been shown that IRS1 or
IRS2 deletion may induce glucose metabolism abnormalities and
insulin resistance (23,24), although these effects are
tissue-specific (25,26). IRS1 mainly affects skeletal
muscle, while IRS2 has extensive effects on the liver, skeletal
muscle and adipose tissues. IRS2 dominates the promotion of liver
glycogen synthesis and the suppression of hepatic glucose output
(25). Our results demonstrated
that high concentrations of ethanol significantly decreased the
mRNA expression levels of IRS1 and IRS2, particularly
those of IRS2, which suggests that both IRS1 and IRS2 are
involved in the development of ethanol-mediated hepatic insulin
resistance, with IRS2 being more dominant. The PI3K pathway is an
important pathway for insulin signaling. PI3K is composed of a
catalytic subunit of 110 kDa and a regulatory subunit (p85α) of 85
kDa. Changes in PI3K expression and activity have been demonstrated
to closely correlate with insulin resistance (27). Glucose transport is based on the
glucose transporter in the cell membrane. Although GLUT4 is of
particular interest in the context of diabetes and insulin
resistance, the liver is generally considered to lack significant
expression of GLUT4 (28). In
hepatocytes, GLUT2 is the main glucose transporter (29). In the present study, 24-h
treatment with 2 or 4% ethanol significantly decreased the mRNA
expression levels of PI3K (p85α) and GLUT2 in
the L-02 cells (P<0.05), indicating that ethanol administration
suppressed the expression of these genes in a dose-dependent
manner. In summary, the administration of low concentrations of
ethanol did not have a significant effect on the insulin signaling
pathway in hepatocytes (L-02). Moderate and high concentrations of
ethanol did have suppressive effects, of varying degrees, on the
expression of key molecules in this pathway, which results in the
interference with glycogen synthesis and gluconeogenesis, and
relevant signal transduction, which in turn triggers insulin
resistance in hepatocytes.
In addition to the relevance to the expression
profiles of key signaling molecules, insulin signal transduction
closely correlates with the phosphorylation of signaling molecules.
The activation of PI3K generates phosphatidylinositol (3,4,5)-trisphosphate (PIP3), a second
messenger activating 3-phosphoinositide-dependent protein kinase-1
and -2 (PDK1 and PDK2), which mediate the effects of insulin on
metabolism and pro-survival. PDK1 and PDK2 in turn activate the
PKB, by inducing phosphorylation at T308 and
S473, respectively (21). In the present study, the
ethanol-induced changes in the protein expression and
phosphorylation levels of PI3K (p85α) and PKB were examined by
western blot analysis. The results suggested that the
administration of 0.5 or 1% ethanol had no significant suppressive
effect on the expression and insulin-induced phosphorylation levels
of PI3K (p85α) and PKB. By contrast, treatment with 2 or 4% ethanol
significantly suppressed the expression and phosphorylation levels
of these proteins (Fig. 5).
Following treatment with 2 or 4% ethanol for 24 h, the expression
of PI3K (p85α) and PKB significantly decreased to below the basal
state in the absence of insulin stimulation. After the removal of
ethanol and the addition of insulin, there was a significant
increase in the phosphorylation levels of PI3K (p85α) and PKB
compared with the cells not treated with ethanol, and the absolute
content of the phosphorylated protein and its ratio relative to the
total protein increased to varying extents. However, the
phosphorylation levels in the 2 or 4% ethanol-treated groups were
significantly lower than those of the group treated with insulin
but not ethanol. One explanation is that the decrease in the
insulin-induced phosphorylation levels of PI3K (p85α) and PKB was
associated with the ethanol-induced decrease in the expression of
these proteins. Conversely, the decrease in the phosphorylated
protein ratio relative to the total protein suggests that ethanol
administration suppressed the process of protein phosphorylation in
addition to the inhibition of protein expression. These results
demonstrate that ethanol interferes with insulin signal
transduction by influencing both the protein expression and the
phosphorylation levels of key molecules in the PI3K signaling
pathway.
Calcium is an essential second messenger in
hepatocytes, and homeostatic imbalance has been reported to be
involved in the process of ethanol-induced hepatocyte damage
(30,31). In the present study, changes in
the [Ca2+]i levels induced by ethanol
treatment were examined by flow cytometry and confocal microscopy,
and the results revealed that the increase in the
[Ca2+]i levels occurred in a concentration-
and time-dependent manner. To confirm the roles of
[Ca2+]i in ethanol-induced hepatocyte damage
and the suppression of the insulin signaling pathway, 2% was
selected to be the ethanol concentration for the Ca2+
blockage assays in this study, as only a slight inhibition of cell
viability was observed at this concentration, which is consistent
with the results of other studies (9–11).
Our results demonstrated that the ethanol-induced increase in
[Ca2+]i levels was partially suppressed by
the administration of the extracellular Ca2+ chelator,
EGTA, and/or the IP3 receptor antagonist, 2-APB, although no
complete blockage was observed (Fig.
6A). This suggests that other calcium cha nnels may contribute
to the increase in [Ca2+]i levels induced by
ethanol ad ministration in addition to the extracellular
Ca2+ influx and the IP3 receptor-mediated
Ca2+ release from the calcium pool in the endoplasmic
reticulum. An increased hepatocyte survival rate was observed as a
result of the EGTA or 2-APB suppression of the ethanol-induced
increase in [Ca2+]i levels (data not shown),
which suggests that the ethanol-induced increase in
[Ca2+]i levels is involved in the process of
hepatocyte damage. Furthermore, the suppressive effects of EGTA or
2-APB on the ethanol-induced increase in the
[Ca2+]i levels correlated with the
restoration of the phosphorylation levels of PI3K (p85α) and PKB in
the presence of insulin stimulation (Fig. 6B), indicating that the inhibitory
effects of ethanol on the key molecules of the insulin signaling
pathway was [Ca2+]i-dependent.
In conclusion, the findings of our study
demonstrated that ethanol treatment inhibited insulin signal
transduction in a dose-, time- and Ca2+-dependent
manner. The inhibition of IRS1/2, PI3K (p85α),
PKB and GLUT2 expression and of PI3K (p85α) and PKB
phosphorylation by high concentrations of ethanol may be the core
molecular mechanism of ethanol-induced insulin resistance.
Furthermore, although not statistically significant, treatment with
0.5% ethanol slightly increased the protein expression and
phosphorylation levels of key components of the insulin signaling
pathway. It is unknown whether ethanol at low concentrations indeed
promotes the process of insulin signal transduction, and whether it
correlates with the [Ca2+]i levels. To
clarify this issue, further investigation is required.
References
|
1
|
Wannamethee SG, Shaper AG, Perry IJ and
Alberti KG: Alcohol consumption and the incidence of type II
diabetes. J Epidemiol Community Health. 56:542–548. 2002.
View Article : Google Scholar : PubMed/NCBI
|
|
2
|
Pietraszek A, Gregersen S and Hermansen K:
Alcohol and type 2 diabetes. A review. Nutr Metab Cardiovasc Dis.
20:366–375. 2010. View Article : Google Scholar : PubMed/NCBI
|
|
3
|
Cullmann M, Hilding A and Östenson CG:
Alcohol consumption and risk of pre-diabetes and type 2 diabetes
development in a Swedish population. Diabet Med. 29:441–452. 2012.
View Article : Google Scholar
|
|
4
|
Fan AZ, Russell M, Naimi T, Li Y, Liao Y,
Jiles R and Mokdad AH: Patterns of alcohol consumption and the
metabolic syndrome. J Clin Endocrinol Metab. 93:3833–3838. 2008.
View Article : Google Scholar : PubMed/NCBI
|
|
5
|
Petersen KF and Shulman GI: Etiology of
insulin resistance. Am J Med. 119(Suppl 1): S10–S16. 2006.
View Article : Google Scholar : PubMed/NCBI
|
|
6
|
Ismail-Beigi F: Pathogenesis and glycemic
management of type 2 diabetes mellitus: a physiological approach.
Arch Iran Med. 15:239–246. 2012.PubMed/NCBI
|
|
7
|
Bechmann LP, Hannivoort RA, Gerken G,
Hotamisligil GS, Trauner M and Canbay A: The interaction of hepatic
lipid and glucose metabolism in liver diseases. J Hepatol.
56:952–964. 2012. View Article : Google Scholar
|
|
8
|
Saltiel AR and Kahn CR: Insulin signalling
and the regulation of glucose and lipid metabolism. Nature.
414:799–806. 2001. View
Article : Google Scholar : PubMed/NCBI
|
|
9
|
Liu H, Jia X, Luo Z, Guan H, Jiang H, Li X
and Yan M: Inhibition of store-operated Ca2+ channels
prevent ethanol-induced intracellular Ca2+ increase and
cell injury in a human hepatoma cell line. Toxicol Lett.
208:254–261. 2012. View Article : Google Scholar
|
|
10
|
Vagts AJ, He DY, Yaka R and Ron D:
Cellular adaptation to chronic ethanol results in altered
compartmentalization and function of the scaffolding protein RACK1.
Alcohol Clin Exp Res. 27:1599–1605. 2003. View Article : Google Scholar : PubMed/NCBI
|
|
11
|
Shih CL, Chi SI, Chiu TH, Sun GY and Lin
TN: Ethanol effects on nitric oxide production in cerebral pial
cultures. Alcohol Clin Exp Res. 25:612–618. 2001. View Article : Google Scholar : PubMed/NCBI
|
|
12
|
Kim E, Seok HH, Lee SY, Lee DR, Moon J,
Yoon TK, Lee WS and Lee KA: Correlation between expression of
glucose transporters in granulosa cells and oocyte quality in women
with polycystic ovary syndrome. Endocrinol Metab (Seoul). 29:40–47.
2014. View Article : Google Scholar
|
|
13
|
Livak KJ and Schmittgen TD: Analysis of
relative gene expression data using real-time quantitative PCR and
the 2(−Delta Delta C(T)) method. Methods. 25:402–408. 2001.
View Article : Google Scholar
|
|
14
|
Thiele TE: Insulin resistance from binge
drinking: It's all in your head. Sci Transl Med. 5:170fs32013.
View Article : Google Scholar : PubMed/NCBI
|
|
15
|
Tang YL, Xiang XJ, Wang XY, Cubells JF,
Babor TF and Hao W: Alcohol and alcohol-related harm in China:
policy changes needed. Bull World Health Organ. 91:270–276. 2013.
View Article : Google Scholar : PubMed/NCBI
|
|
16
|
Carlsson S, Hammar N, Grill V and Kaprio
J: Alcohol consumption and the incidence of type 2 diabetes: a
20-year follow-up of the Finnish twin cohort study. Diabetes Care.
26:2785–2790. 2003. View Article : Google Scholar : PubMed/NCBI
|
|
17
|
Lee K: Gender-specific relationships
between alcohol drinking patterns and metabolic syndrome: the Korea
National Health and Nutrition Examination Survey 2008. Public
Health Nutr. 15:1917–1924. 2012. View Article : Google Scholar : PubMed/NCBI
|
|
18
|
Onishi Y, Honda M, Ogihara T, Sakoda H,
Anai M, Fujishiro M, Ono H, Shojima N, Fukushima Y, Inukai K, et
al: Ethanol feeding induces insulin resistance with enhanced PI
3-kinase activation. Biochem Biophys Res Commun. 303:788–794. 2003.
View Article : Google Scholar : PubMed/NCBI
|
|
19
|
Wilkes JJ, DeForrest LL and Nagy LE:
Chronic ethanol feeding in a high-fat diet decreases
insulin-stimulated glucose transport in rat adipocytes. Am J
Physiol. 271:E477–E484. 1996.PubMed/NCBI
|
|
20
|
Xu D, Dhillon AS, Davey CG, Fournier PA
and Palmer TN: Alcohol and glucose metabolism in skeletal muscles
in the rat. Addict Biol. 1:71–83. 1996. View Article : Google Scholar : PubMed/NCBI
|
|
21
|
Guo S: Insulin signaling, resistance, and
the metabolic syndrome: insights from mouse models into disease
mechanisms. J Endocrinol. 220:T1–T23. 2014. View Article : Google Scholar
|
|
22
|
White MF: Insulin signaling in health and
disease. Science. 302:1710–1711. 2003. View Article : Google Scholar : PubMed/NCBI
|
|
23
|
Kadowaki T: Insights into insulin
resistance and type 2 diabetes from knockout mouse models. J Clin
Invest. 106:459–465. 2000. View Article : Google Scholar : PubMed/NCBI
|
|
24
|
Withers DJ, Gutierrez JS, Towery H, Burks
DJ, Ren JM, Previs S, Zhang Y, Bernal D, Pons S, Shulman GI, et al:
Disruption of IRS-2 causes type 2 diabetes in mice. Nature.
391:900–904. 1998. View
Article : Google Scholar : PubMed/NCBI
|
|
25
|
Kido Y, Burks DJ, Withers D, Bruning JC,
Kahn CR, White MF and Accili D: Tissue-specific insulin resistance
in mice with mutations in the insulin receptor, IRS-1, and IRS-2. J
Clin Invest. 105:199–205. 2000. View Article : Google Scholar : PubMed/NCBI
|
|
26
|
Benito M: Tissue specificity on insulin
action and resistance: past to recent mechanisms. Acta Physiol
(Oxf). 201:297–312. 2011. View Article : Google Scholar
|
|
27
|
Pagliassotti MJ, Kang J, Thresher JS, Sung
CK and Bizeau ME: Elevated basal PI 3-kinase activity and reduced
insulin signaling in sucrose-induced hepatic insulin resistance. Am
J Physiol Endocrinol Metab. 282:E170–E176. 2002.
|
|
28
|
Nevado C, Valverde AM and Benito M: Role
of insulin receptor in the regulation of glucose uptake in neonatal
hepatocytes. Endocrinology. 147:3709–3718. 2006. View Article : Google Scholar : PubMed/NCBI
|
|
29
|
Karim S, Adams DH and Lalor PF: Hepatic
expression and cellular distribution of the glucose transporter
family. World J Gastroenterol. 18:6771–6781. 2012. View Article : Google Scholar : PubMed/NCBI
|
|
30
|
Cui RB, Kan BT, Sun XM, Luo Z, Guo R, Guo
XL and Yan M: Role of store-operated Ca2+ channels in
primary hepatocytes under conditions of calcium overload and
ethanol-induced injury. Zhonghua Gan Zang Bing Za Zhi. 21:860–864.
2013.In Chinese. PubMed/NCBI
|
|
31
|
Caro AA and Cederbaum AI: Role of calcium
and calcium-activated proteases in CYP2E1-dependent toxicity in
HEPG2 cells. J Biol Chem. 277:104–113. 2002. View Article : Google Scholar
|