Introduction
Renal cell carcinoma (RCC) is the most common type
of kidney cancer in adults and accounts for 80–95% of kidney cancer
cases (1). RCC is asymptomatic
during the early stages of the disease; thus, it is only diagnosed
at a late stage and a high proportion of patients with RCC present
with distant metastases at diagnosis (2). The treatment options for metastatic
RCC are extremely limited due to the inherent resistance of these
types of tumors to chemotherapy, radiotherapy and other systemic
therapies (3). Immunotherapeutic
agents, such as interleukin (IL)-2 and interferon-α (IFN-α) have
gained considerable attention in recent years in an aim to control
tumor growth and metastatic progression in RCC (4). However, only a very limited subset
of patients with RCC benefit from cytokine therapy, with modest
objective response rates (5).
Therefore, innovative and effective therapies for metastatic RCC
are urgently required and new treatment strategies for RCC are
being explored. RCC progression is intimately associated with tumor
angiogenesis and the upregulation of vascular endothelial growth
factor (VEGF) expression (6). The
human VEGF gene localizes to chromosome 6p12 and consists of
8 exons (7). In RCC, the
increased transcription of the VEGF gene and the increased
levels of secreted VEGF correspond to the increased tumor size and
changes in tumor behavior are observed (8).
VEGF is one of the most important endothelial
cell-specific angiogenic factors. It plays crucial roles in tumor
angiogenesis through its specific effects on vascular endothelial
cells, including the promotion of cell mitogenesis, cell migration
and lumen formation, leading to a powerful angiogenic response
(9). The specificity of the
effects of VEGF is achieved by the preferential expression of its
two receptors, namely VEGF-R1 (FLT-1) and VEGF-R2 (KDR), on VEGF
target cells and the expression of these receptors is observed in
tumor-associated endothelial cells (10). Therefore, VEGF is a promising and
a high-value target for the inhibition of tumor angiogenesis in
growing tumors. In this study, in order to explore novel
therapeutic strategies for the treatment of RCC, we used a mouse
xenograft model, a favorable animal model for evaluating new
therapeutic approaches (11). In
a mouse xenograft model, subcutaneous injections of human tumor
cells, in this case RCC cells, result in the establishment of
primary tumors at the sites of injection, and the development of
subsequent metastases as the tumor progresses, and these events
mimic the behavior of human tumors in vivo (12). We developed RNA interference
(RNAi) tools to silence VEGF expression in human RCC cells in
vitro, as well as in an in vivo xenograft model. RNAi,
is a sequence-specific post-transcriptional gene silencing
technique mediated by small interfering RNAs (siRNAs) homologous to
the silenced gene (13) or by
short hairpin RNA (shRNA) expression vectors (14). In the present study, we used the
lentivirus-based RNAi strategy as a tool against RCC, in order to
assess the effects of the knockdown of VEGF by RNAi on
vascularization and tumor growth in RCC.
Materials and methods
Ethics statement
Animal experiments were conducted in strict
accordance with the approved animal protocols and guidelines
established by the Medicine Ethics Review Committee for animal
experiments of the First Affiliated Hospital of China Medical
University. All efforts were made to minimize the suffering of the
animals.
Construction and identification of
vectors
Based on the human VEGF mRNA sequence (NCBI
GenBank, gene number: AF022375) (15), the following oligonucleotides were
designed with BLOCK-iT™ RNAi Designer (Invitrogen Life
Technologies, Carlsbad, CA, USA): interference sequence, 200-F,
TGCTGTGAAGATGTACTCGATCTCATGTTTT GGCCACTGACTGACATGAGATCGTACATCTTCA
and 200-R, TGCTGTGAAGATGTACTCGATCTCATGTTTT GGCCACTGACATGAGAT
CGTACATCTTCA; and negative control, Negative-F,
TGCTGAAATGTACTGCGCGTGGA GACGTTTTGGCCACTGACTGACGTCTCCACGCAGTA CATTT
and Negative-R, CCTGAAATGTACTGCGTGGAG
ACGTCAGTCAGTGGCCAAAACGTCTCCACGCGCAGTA CATTTC. Negative-F and
Negative-R, as well as 200-F and 200-R were mixed in equal amounts
(500 pmol each), heated for 10 min at 89°C, gradually cooled to
65°C in annealing buffer (Tris-HCl 50 mM, MgCl2 10 mM,
DTT 10 mM, ATP 1 mM, BSA 25 µg/ml, DMSO 10%) to generate
double-stranded DNA. The double-stranded DNA was cloned into the
plasmid vector, plenti6.3-miR (Novobio, Shanghai, China). Positive
clones were sequence-verified.
Construction of VEGF-shRNA expression
vector
To effectively inhibit VEGF expression, it was
necessary to design a shRNA expresssion vector that was capable of
downregulating VEGF isoforms. Therefore, we conducted a
bioinformatics analysis and selected a sequence that was conserved
in all VEGF isoforms as the target for RNAi.
Lentiviral packaging
The 239T cells (Novo Biochemical Industries, Inc.) a
the logarithmic growth phase were trypsinized and counted. The
cells were seeded in 10-cm petri dishes at a density of
6×10⁶ cells/dish. The cell culture medium was replaced
with Opti-MEM medium prior to transfection. Packaging mix (9
µg) and lentiviral plasmid (3 µg) were added into 1.5
ml Opti-MEM (prewarmed to 37°C) and gently mixed. Lipofectamine
2000 (36 µl) was added to another 1.5 ml Opti-MEM and gently
mixed. The plasmid solution and Lipofectamine 2000 diluent were
combined to form complexes. Subsequently, 3 ml of the
plasmid/liposome complex (3 ml) were added to the petri dishes,
evenly mixed, and incubated in a 5% CO2 incubator at
37°C for 6 h. The culture medium was replaced with complete medium
(DMEM + 10% (FBS; Biowest Co., Nuaillé, France). After 48 h, the
cell culture supernatant was collected, centrifuged at 3,000 rpm
for 10 min, and filtered through 0.45-µm filters. The virals
particles were purified by ultracentrifugation (50,000 × g for 2
h), resuspended in 200 µl DMEM (HyClone Co., Logan, UT,
USA), and stored at −80°C until further use.
Titer determination
Viral titers were determined by infecting 293T
cells. The cells were seeded in 96-well plates at a density of
8×10³ cells (100 µl)/well each day prior to
infection. Vector stocks were gradient diluted in the presence of 8
µg/ml of Polybrene (Sigma-Aldrich, St. Louis, MO, USA) at
1×10⁻³ to 1×10⁻⁸ ml per 50 ml. After the
original medium was removed, the 50 µl/well of the diluted
medium containing lentiviral vector particles were added and mixed,
and another 50 µl diluted lentiviral medium was added to
each well, with 3 replicates at each dilution. After a 48-h
incubation in a CO2 incubator, 100 µl fresh
medium were added to each well. After 5–6 days, the number of green
fluorescent protein (GFP)-positive cells was scored by fluorescence
microscopy and/or fluorescence-activated cell sorting analysis to
quantify the titer. The number of fluorescent cells decreased with
dilution. The number of fluorescent cells in the well with the
largest dilution multiple was counted. Viral titer (TU/ml) = (the
number of fluorescent cells × the number of transfected cells/100 ×
the volume of added diluted lentiviral medium of each well) ×
1/dilute strength (concentration of diluent).
Cell culture and lentiviral
infection
The human RCC cell line, 786-O, was purchased from
the Cell Bank of Shanghai Institute of Cell Biology, Chinese
Academy of Sciences (Shanghai, China). The cells were maintained in
RPMI-1640 medium supplemented with FBS (Gibco Ltd., Grand Island,
NY, USA), and incubated in 5% CO2 at 37°C. The transient
viral transfection of human RCC 786-O cells was conducted using 1
µl Polybrene and lentivirus at a multiplicity of infection
(MOI) of 100. The cells were divided into 3 groups: the blank
control group (no viral transfection); the negative control group
(cells transfected with LV-NC-shRNA); and the VEGF-shRNA group
(cells transfected with LV-VEGF-shRNA).
Reverse transcription quantitative
fluorescence polymerase chain reaction (RT-qPCR) of VEGF mRNA
expression
To quantify VEGF mRNA expression in the
786-O-transfected cells, RNA was extracted using TRIzol®
reagent (Invitrogen Life Technologies), and reverse transcription
was conducted using the Reverse Transcription kit (Bio-Rad
Laboratories, Hercules, CA, USA) following the manufacturer's
instructions at 48 h after transfection. The primers used for PCR
were as follows: VEGF upstream, 5′-ACTGCCATCCAATCGAGACCC-3′ and
downstream, 5′-TGAGGTTTGATCCGCAT AATC-3′; and the internal
reference, β-actin upstream, 5′-ACTCTTCCAGCCTTCCTTCC-3′ and
downstream, 5′-GTACTTGCGCTCAGGAGGAG-3′. The reaction system was
prepared with a Fluorescence Real-time PCR kit (Bio-Rad
Laboratories) following the manufacturer's instructions. The
reaction was carried out under following conditions: 40 cycles of
predenaturation at 95°C for 120 sec, denaturation at 95°C for 10
sec, annealing at 60°C for 30 sec, and extension at 70°C for 45
sec, followed by the real-time detection of fluorescent signals.
The data analysis for qPCR was relatively calculated using the
2−ΔΔCT method [cycle threshold (CT)]. Interference
efficiency = (1–2−ΔΔCT) ×100.
Chick chorioallantoic membrane (CAM)
assay
Cell culture supernatants obtained from the 786-O
cells cultured for 72 h were lyophilized and dissolved in a total
volume of RPMI-1640 (100 µl). The corresponding cell count
after 72 h of culture was 5×10⁷. Similarly, culture
supernatants from 786-O cells transfected with the shRNAs were also
collected and processed. The concentration of VEGF in the cell
culture supernatants was estimated using an enzyme-linked
immunosorbent assay (ELISA) kit (Jingmei Biotech Co. Ltd.,
Shenzhen, China). These supernatants were also used for CAM assays
as described below. White fertilized eggs (Zhejiang Tianyuan
Bio-Pharmaceutical Co., Ltd., Hangzhou, China), incubated for 9
days, were selected. The air chamber of the eggs was opened to
expose the chorioallantoic membrane. On the 10th day of incubation,
the eggs were randomly divided into 4 groups of 10 eggs/group as
follows: a volume of 100 µl RPMI-1640 medium was added
between the omphalomesenteric veins and the chick embryo
chorioallantoic membrane using a micropipette as a blank control.
The other 3 groups were: culture supernatant of uninfected 786-O
cells (positive control group); culture supernatant of 786-O cells
infected with lentivirus LV-VEGF-shRNA (VEGF-shRNA group); and the
culture supernatant of 786-O cells infected with lenti-virus
LV-NC-shRNA (negative control group). All the eggs were then
incubated at 37°C for 48 h. Fixation was carried out in
formaldehyde and acetone (1:1)on the 12th day. The chick embryo
chorioallantoic membrane was cut off, dried and photographed under
an optical microscope (DSX510; Olympus, Tokyo, Japan; ×10
magnification),GIF-2T240; Olympus, Japan), selecting 6 random
fields. Using an image-processing system (Gene Co. Ltd, USA), the
vascular branches of the first and second level in the
chorioallantoic membrane within the field were traced, the vascular
branch points were counted manually, and the relative total vessel
length was measured. The mean value of the 6 fields was calculated.
The number of vascular branches and total vessel length (vascular
density index) of all the groups were compared.
Establishment of RCC xenograft model in
nude mice
Four-week-old female BALB-C nude mice (n=36;
weighing approximately 20 g) were purchased from Shanghai Silaike
Experimental Animal Co., Ltd., Chinese Academy of Medical Sciences
(Shanghai, China). All BALB-C nude mice were kept under specific
pathogen-free (SPF) conditions in the Experimental Animal Center of
the Chinese Academy of Medical Sciences. A total of 18 nude mice
were randomly selected and divided into 3 groups (blank control,
negative control and VEGF-shRNA group) of 6 mice/group. The cells
in the logarithmic growth phase were collected from the blank
control group, negative control group and VEGF-shRNA group. To
establish a RCC xenograft model, the nude mice in the 3 groups were
injected subcutaneously into the lower back with 5×10⁶
cells suspended in 0.2 ml of phosphate-buffered saline (PBS). Tumor
occurrence and growth in each group was observed and recorded.
Tumor volume was determined by external measurements using a
caliper and calculated as V = LW2/2, where L and W
represented the larger and the smaller tumor diameter,
respectively. The observation period ended at 30 days from the day
of injection. At this time point, the nude mice were sacrificed by
cervical dislocation and the tumors were removed, weighed using an
electronic balance (JA-5003 Electronic Precision Balance, Shanghai,
China), formalin-fixed, paraffin-embedded and sliced using a
paraffin slicing machine (Leica RM2135 microtome, Lecia, Germany).
Immunohistochemical (IHC) staining for VEGF expression was then
performed as described below.
Immunohistochemistry
The formalin-fixed paraffin-embedded slices were
subjected to immunohistochemical staining for VEGF expression. The
tumor slices were deparaffinized, rehydrated in 3%
H2O2 for 10 min and endogenous peroxidase was
quenched. The slides were then were washed with clear water twice,
followed by the addition of citric buffer, and heating in a
microwave at middle power for 3 min. After being cooled to the room
temperature, the slices were washed with clear water twice; the
glass slides were then soaked in PBS for 5 min, washed twice, and
serum was added at a 1:10 dilution (900 µl PBS:100 µl
serum blocking solution), followed by incubation at 37°C for 30
min. Subsequently, a rabbit anti-human primary antibody specific
for VEGF (Sigma-Aldrich) was added followed by overnight incubation
at 4°C in a refrigerator. The same rabbit anti-human without
specificity IgG was used as the primary antibody in the negative
control group. All slides were subsequently washed with PBS 3 times
for 5 min each time, and incubated with rabbit anti-goat secondary
antibody (Sigma-Aldrich) for 30 min at 37°C. The slices were then
washed with PBS 3 times for 5 min each time, and incubated with a
1:100 dilution of streptavidin-biotin complex (SABC; 10 µl
SABC:990 µl PBS) for 30 min at 37°C. The slices were stained
with DAB, counterstained with hematoxylin after being washed, and
then mounted with neutral gum. Observation was performed under a
high power microscope (×400 magnification), and the VEGF-positive
cells were those with a distribution of brown granules in the
cytoplasm and/or nucleus. Immunoreactive slices were quantitatively
analyzed with 5 intratumoral fields (approximately 100 cells)
selected from each slice. The positive VEGF rate (from automatic
computer analysis) = the area of positive cells/the total area of
negative cells, the mean value was obtained as the positive VEGF
rate (%). The results were determined using the double blind method
(the pathologists and specimen collectors were unaware of any
information regarding the specimens).
Treatment of tumor-bearing nude mice
A total of 18 nude mice were used for the xenograft
experiments and each mouse was injected subcutaneously with a cell
suspension (20 µl). The size of each subcutaneous mouse
tumor was measured daily using a Vernier caliper. A diameter ≥5 mm
was considered as positive for a tumor. The mice were randomly
divided into 3 groups with 6 mice/group as follows: mice
intratumorally injected with 0.1 ml LV-VEGF-shRNA/mouse/time
(treatment group); mice intratumorally injected with 0.1 ml
LV-NC-shRNA/mouse/time (negative control group); and mice
intratumorally injected with 0.1 ml PBS/mouse/time (blank control
group). Treatment was carried out using an intratumoral multi-point
injection every 4 days for a total of 5 times. After 20 days and
following observation, the nude mice were sacrificed by cervical
dislocation and the tumors were weighed, formalin-fixed,
paraffin-embedded, and sliced for apoptosis detection (apoptosis
assay). The tumor growth curve was drawn and the the tumor
inhibition rate was calculated. Tumor inhibition rate = (tumor
volume in control group - tumor volume in experimental group)/tumor
volume in control group ×100.
TUNEL assay
The apoptosis was measured by TUNEL assay using an
In Situ Cell Death Detection kit, (Roche Applied Sicence,
Pleasanton, CA, USA) following the manufacturer's instructions.
Positive cells are regarded as those with a tawny nucleus, nuclear
chromatin condensation and an irregular cell shape. Negative cells
are regarded as those without any changes in cell shape or
coloration, or with only a slight coloration. Under a microscope,
quantitative analysis was performed by counting the number of
positive cells per high power microscopic field; for each sample, 5
high power microscopic fields (200 cells) were counted. The number
of positive cells was presented as a percentage, and regarded as
the apoptotic index (AI).
Statistical analysis
All statistical analyses were performed using SPSS
17.0 software (SPSS Inc., Chicago, IL, USA), and the data are
presented as the means ± standard deviation (SD). Statistical
comparisons between 2 groups were conducted using the t-test or
analysis of variance (ANOVA). P-values for all tests were
two-tailed, and a P<0.05 was considered to indicate a
statistically significant difference.
Results
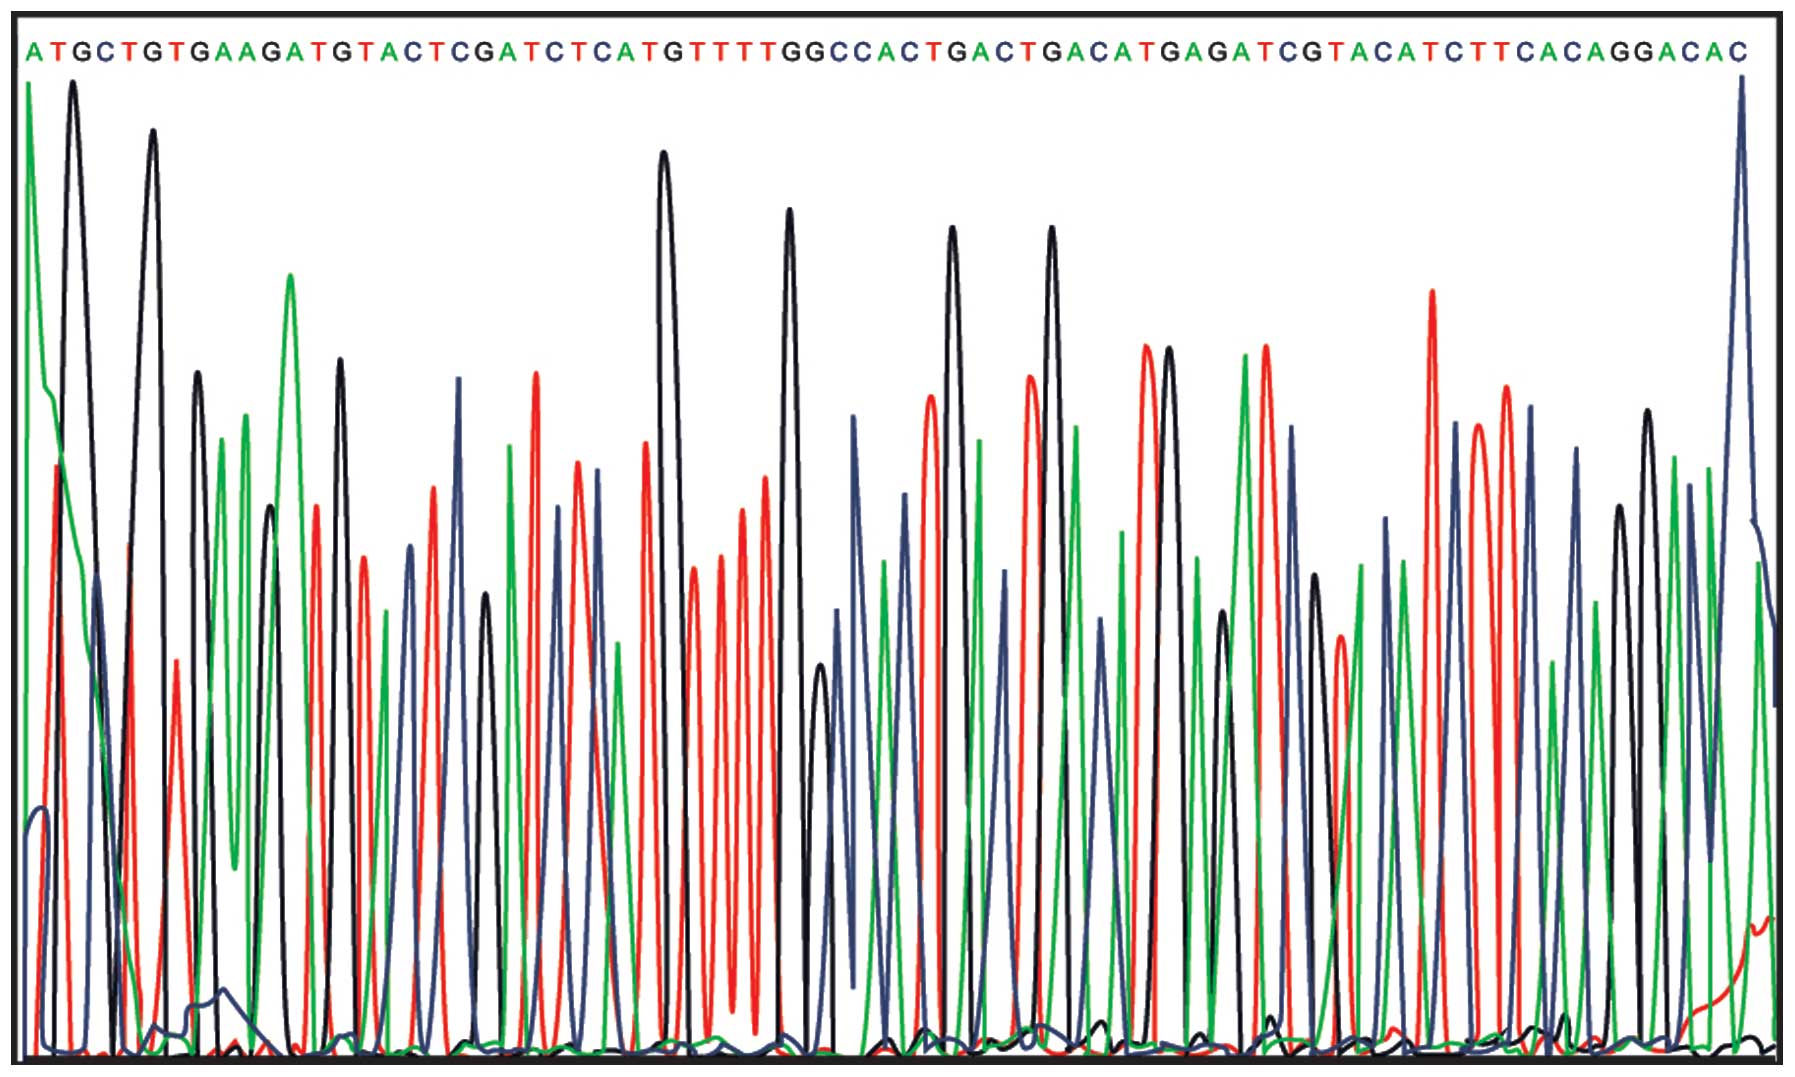
Results of sequencing analysis
The results from DNA sequencing analysis confirmed
the successful cloning of the VEGF-shRNA into plenti6.3-miR
(Fig. 1).
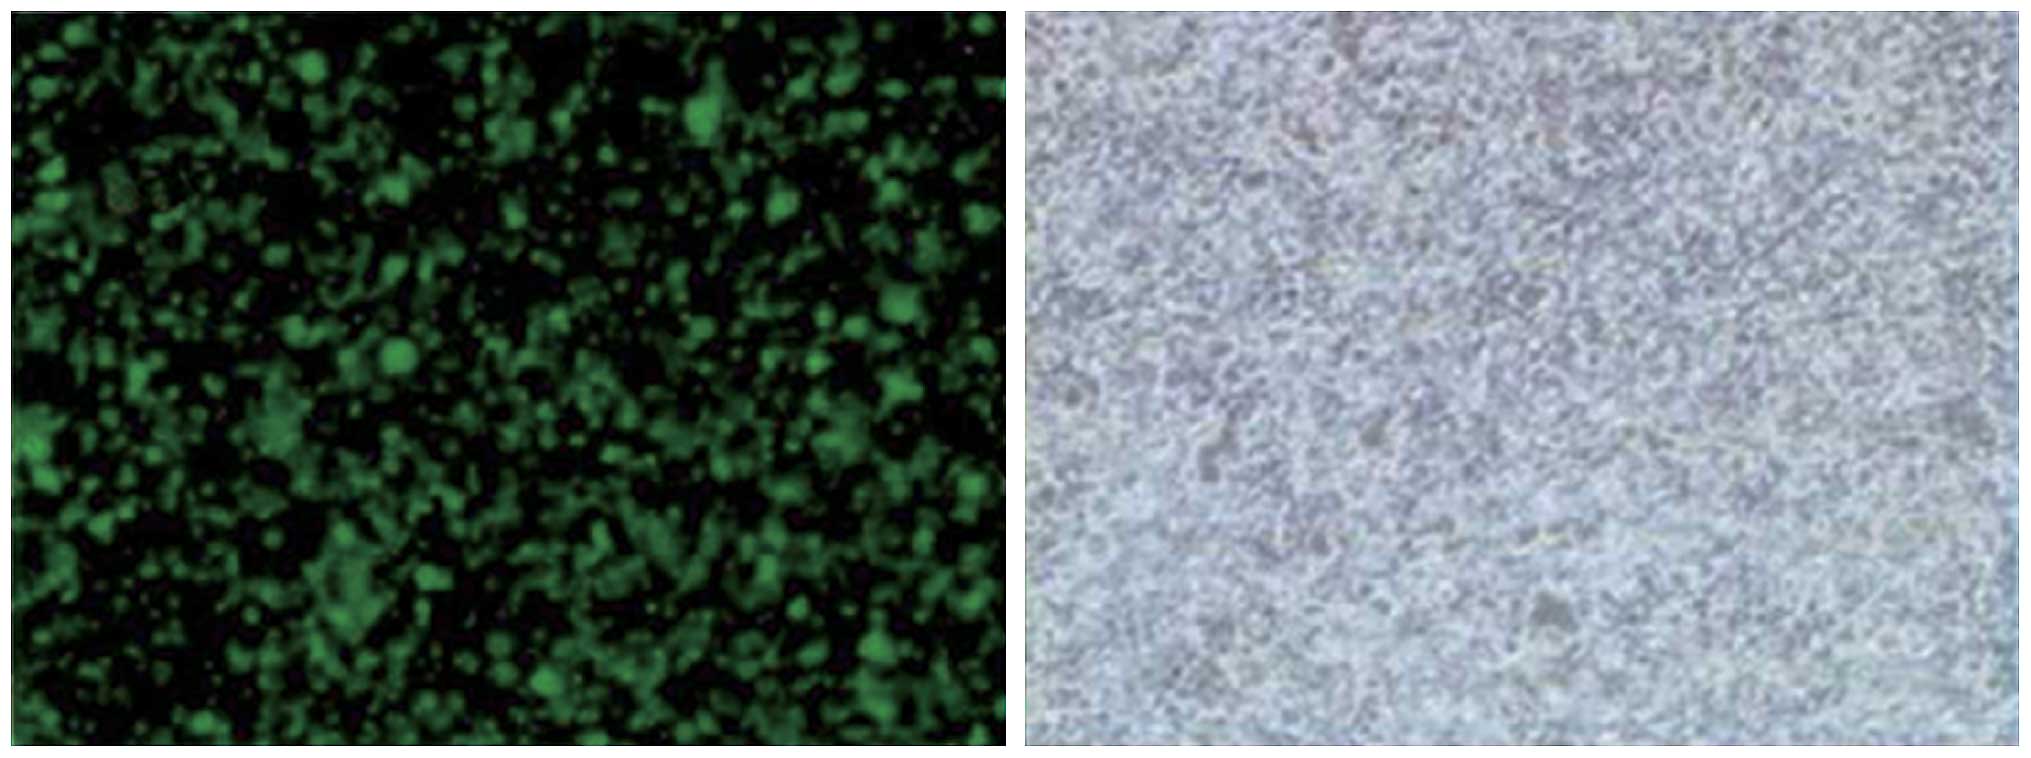
Viral titer and transfection
efficiency
Twenty-four hours after transfection of the
plenti6.3-miR-200 into 293T cells for packaging the lentiviral
particles, geen fluorescence was detected in the majority of 293T
cells. The fluorescence microscopy image (×100 magnification) and
the image of the same field of cells in visible light are shown in
Fig. 2. Lentiviral
plenti6.3-miR-200 transfected into the 293T cells was observed by
fluorescence microscopy and ordinary light microscopy (×100
magnification), and it was detected that the number of
GFP-expressing cells in the wells containing viral stock was 37, 25
and 35, respectively. Therefore, the viral titer was calculated to
be 3.23×10⁹ TU/ml. These results suggested the
successful transfection of 293T cells.
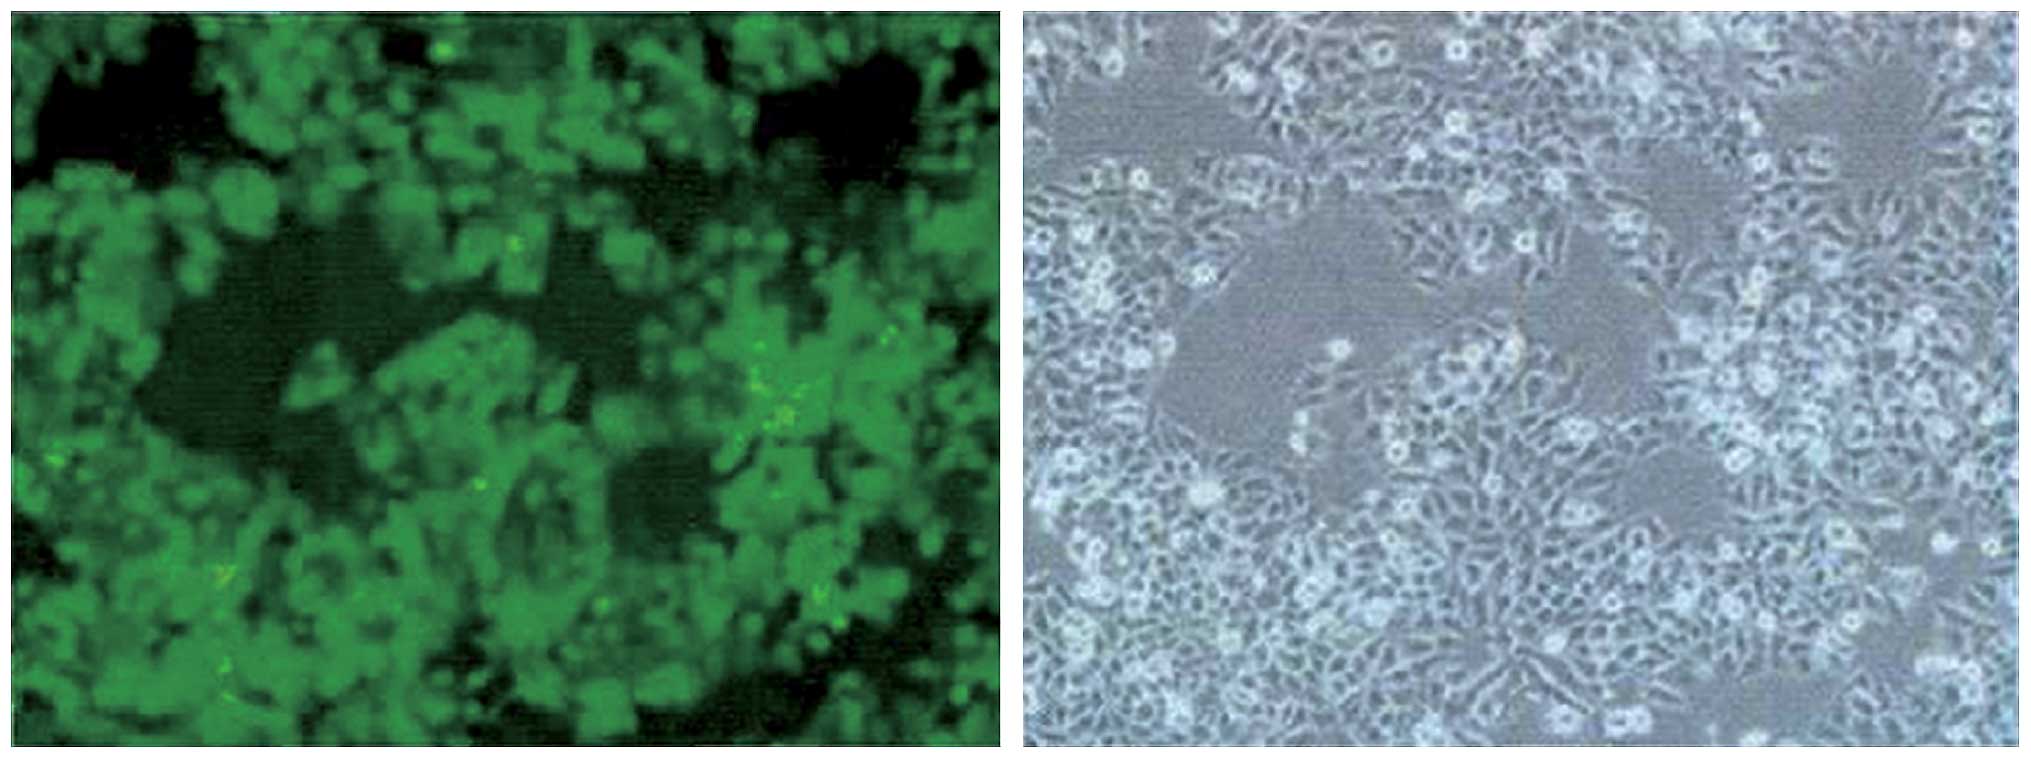
Transfection of 786-O cells with
plenti6.3-miR-200 inhibits VEGF expression
The results of 48-h transfection with lenti-virus
plenti6.3-miR-200 in 786-O cells were observed under a fluorescence
microscope (Fig. 3). The
infection rate of the RNAi lentivirus plenti6.3-miR-200 in the
786-O cells was calculated (infection rate = the number of
fluorescent cells/cell total number ×100), and the result reached
90%. VEGF expression was detected by RT-qPCR, as shown in Table I. The results of RT-qPCR revealed
that the interference rate of RNAi lentivirus plenti6.3-miR-200 in
the VEGF-shRNA group was 72.2%.
 | Table IInterference efficiency of RNAi
lentiviral plenti6.3-miR-200 targeting vascular endothelial growth
factor (VEGF) detected by RT-qPCR (%). |
Table I
Interference efficiency of RNAi
lentiviral plenti6.3-miR-200 targeting vascular endothelial growth
factor (VEGF) detected by RT-qPCR (%).
| Group | ΔCT | ΔΔCT |
2−ΔΔCT | Interference
rate |
|---|
| VEGF-shRNA group | 10.652100 | 1.847 | 0.27797 | 72.2 |
| Negative control
group | 8.412102 | −0.393 | 1.31312 | 31.3 |
| Blank control
group | 8.805073 | 0 | 1 | 0 |
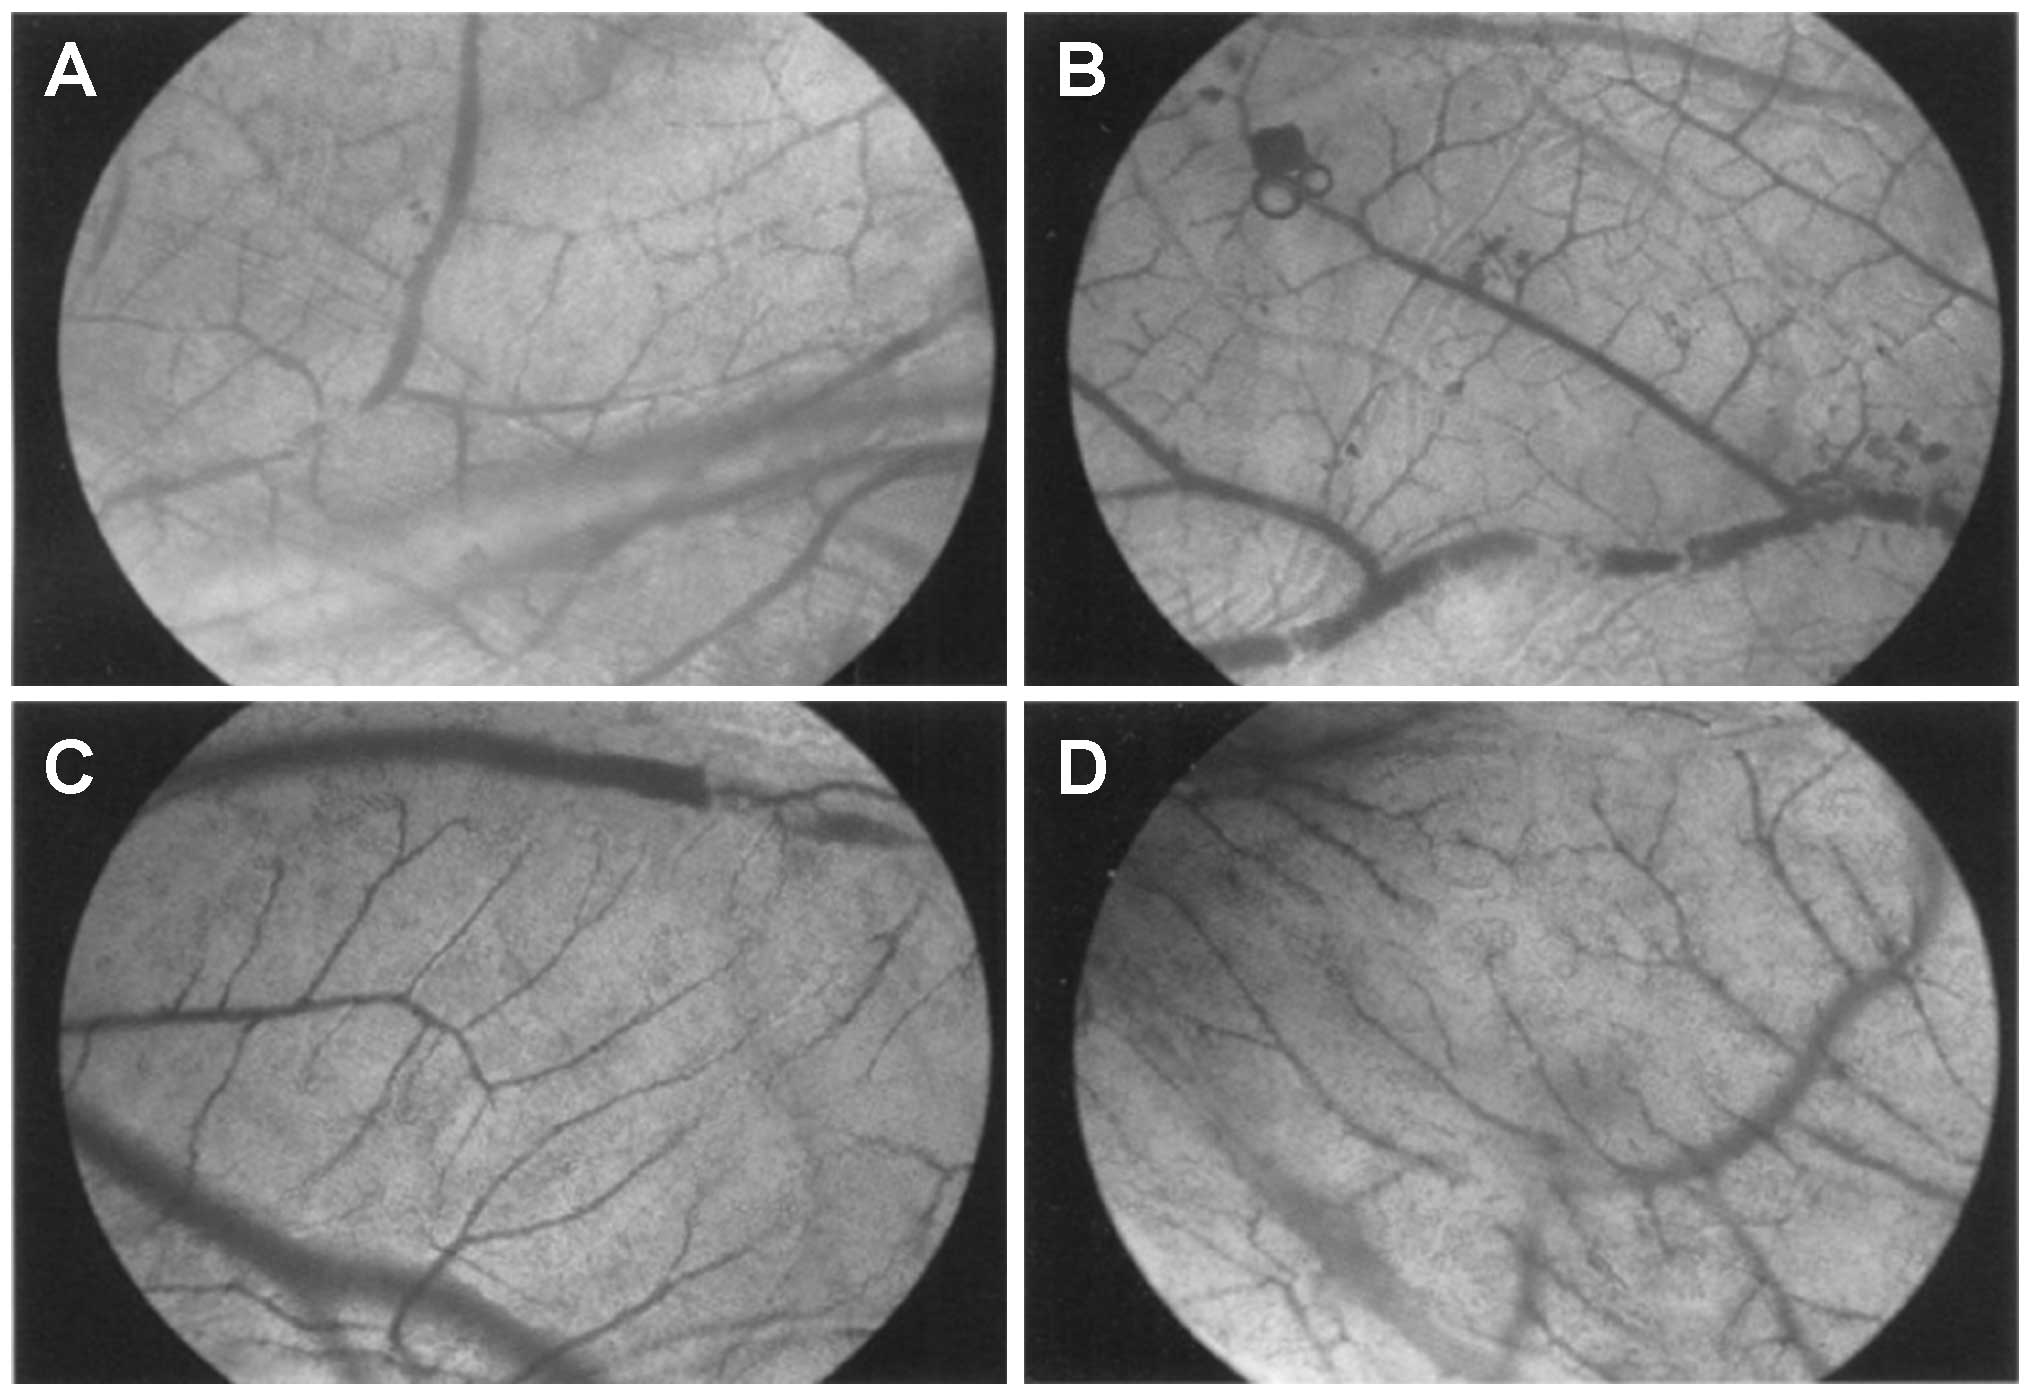
Effect of VEGF-shRNA on vascularization
in the chorioallantoic membrane
The comparison of VEGF levels in the cell culture
supernatants and the extent of vascularization in the blank
control, positive control, VEGF-shRNA and negative control groups
are shown in Table II. The VEGF
level in the culture medium without FBS (blank control group) was
0. The VEGF expression level in the cell culture supernatant of the
VEGF-shRNA group was markedly lower than that of the negative
control and positive control groups (196.63±56.28 vs.
1231.10±121.86 µg/ml vs. 1241.08±126.64 µg/ml,
P<0.05). The vascular branch points in the VEGF-shRNA, negative
control and positive control groups were significantly greater than
those of the blank control group (72.01±9.56 vs. 74.21±8.91 vs.
76.89±9.08 vs. 49.65±6.72, all P<0.05). The relative total
vessel length in the VEGF-shRNA, negative control and positive
control groups was significantly longer than that of the blank
control group (all P<0.05). Additionally, the relative total
vessel length in the VEGF-shRNA group was significantly shorter
than that of the negative control and positive control
groups(66.34±10.31 vs. 86.08±15.53 vs. 86.63±14.62, all P<0.05).
The vascular network structure in the chorioallantoic membrane is
presented in Fig. 4. Compared
with the blank control group, the vascular branches in the
chorioallantoic membrane of the VEGF-shRNA group increased
slightly, and in the chorioallantoic membrane of the negative
control and positive control groups, this increase was more visible
with abnormal capillary network structures present.
| Table IIComparison of the density of
vascularization in chick embryo chorioallantoic membrane and
vascular endothelial growth factor (VEGF) levels in the cell
culture supernatant. |
Table II
Comparison of the density of
vascularization in chick embryo chorioallantoic membrane and
vascular endothelial growth factor (VEGF) levels in the cell
culture supernatant.
| Group | Vascular branch
point | Relative total
vessel length | VEGF level
(µg/ml) |
|---|
| Blank control
group | 49.65±6.72 | 43.55±7.45 | 0 |
| VEGF-shRNA
group | 72.01±9.56a | 66.34±10.31a–c |
196.63±56.28a–c |
| Negative control
group | 74.21±8.91a | 86.08±15.53a |
1231.10±121.86a |
| Positive control
group | 76.89±9.08a | 86.63±14.62a |
1241.08±126.64a |
| F-value | 21.01 | 26.95 | 514.4 |
| P-value | <0.001 | <0.001 | <0.001 |
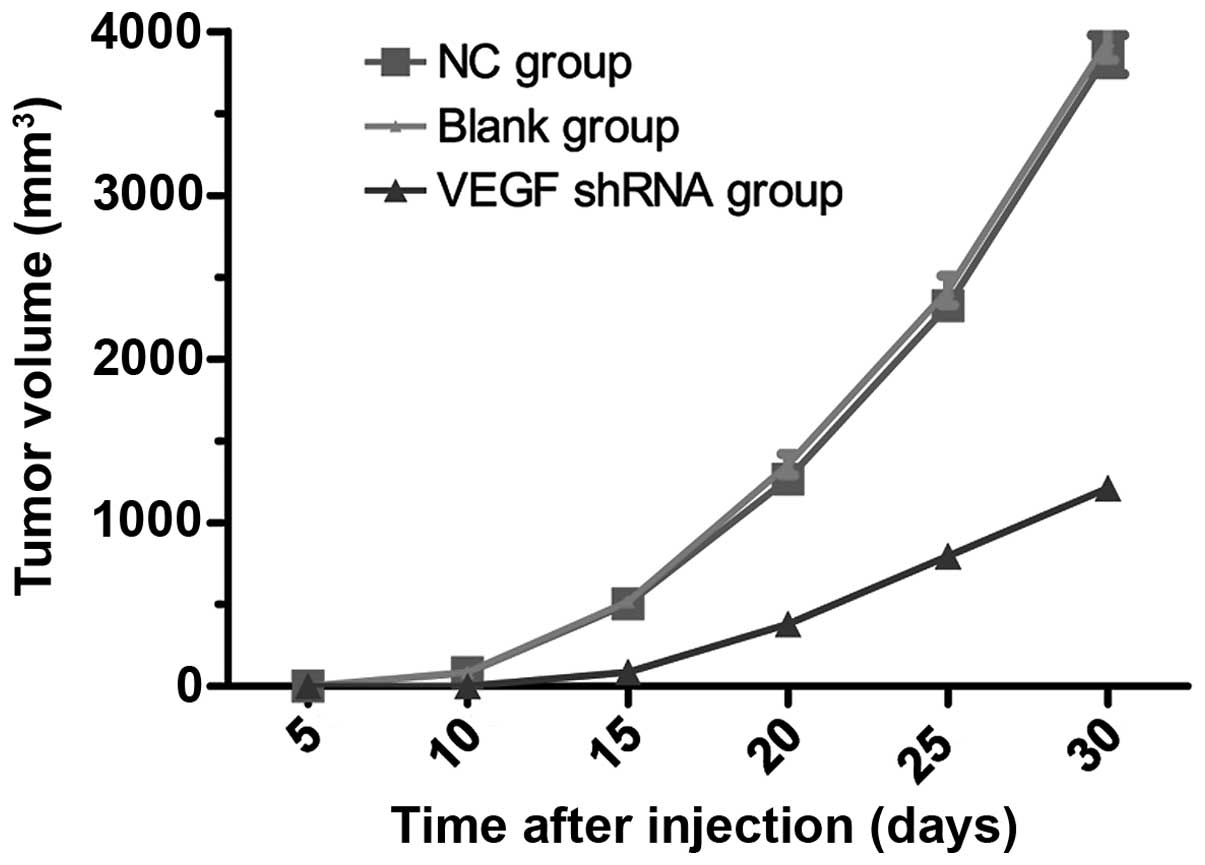
Tumor growth rates in nude mouse RCC
xenograft model
An RCC xenograft model using nude mice was
successfully established with a tumor formation rate of 100%. Ten
days following the inoculation of the nude mice with 786-O cells,
subcutaneous nodules (approximately 4 mm) were observed in the nude
mice in the blank control and negative control groups, and the
subcutaneous nodules continued to grow over time. Twelve days
following subcutaneous injection, subcutaneous nodules gradually
appeared in the VEGF-shRNA group. The growth of subcutaneous
nodules in the VEGF-shRNA group was slower than that in the blank
control and negative control groups, as shown in Table III. The tumor volume in the
VEGF-shRNA group was significantly smaller than taht the blank
control and negative control groups at 10, 15, 25 and 30 days after
subcutaneous injection (all P<0.05). No detectable significant
differences in tumor volume between the blank control and the
negative control groups were observed at 10, 15, 25 and 30 days
after subcutaneous injection (all P>0.05). Tumor growth curves
in the blank control, negative control, and VEGF-shRNA groups are
presented in Fig. 5. Compared
with the blank control and negative control groups, tumor growth in
the VEGF-shRNA group was inhibited. Thirty days after subcutaneous
injection, all the nude mice were sacrificed, and the RCC xenograft
tumors were removed and weighed (Table IV). The weights of the RCC
xenograft tumors in the negative control, blank control and
VEGF-shRNA groups were 2.204±0.207, 2.239±0.337 and 0.663±0.086 g,
respectively. The tumor weight in the VEGF-shRNA group was
significantly lower than that the negative control and blank
control groups (both P<0.05). There was no observable
significant difference in tumor weight between the negative control
and blank control groups (P>0.05).
| Table IIIVolume of renal cell carcinoma (RCC)
xenograft tumors in nude mice in different treatment groups at
different time points. |
Table III
Volume of renal cell carcinoma (RCC)
xenograft tumors in nude mice in different treatment groups at
different time points.
| Time point | Negative control
group | Blank control
group | VEGF-shRNA
group |
|---|
| 5 days | 0 | 0 | 0 |
| 10 days | 83.15±8.63a | 85.14±8.72a | 0 |
| 15 days |
503.42±17.58a |
519.18±17.97a | 87.35±8.52 |
| 20 days |
1267.49±60.59a |
1303.47±65.26a | 381.58±16.18 |
| 25 days |
2324.59±89.53a |
2409.19±90.16a | 794.90±21.59 |
| 30 days |
3880.12±118.63a |
3944.65±120.41a | 1211.50±59.64 |
| Table IVWeight of renal cell carcinoma (RCC)
xenograft tumors in nude mice in the different treatment groups 30
days after subcutaneous injection. |
Table IV
Weight of renal cell carcinoma (RCC)
xenograft tumors in nude mice in the different treatment groups 30
days after subcutaneous injection.
| Group | Tumor weight
(g) |
|---|
| Negative control
group | 2.204±0.207a |
| Blank control
group | 2.239±0.337a |
| VEGF shRNA
group | 0.663±0.086 |
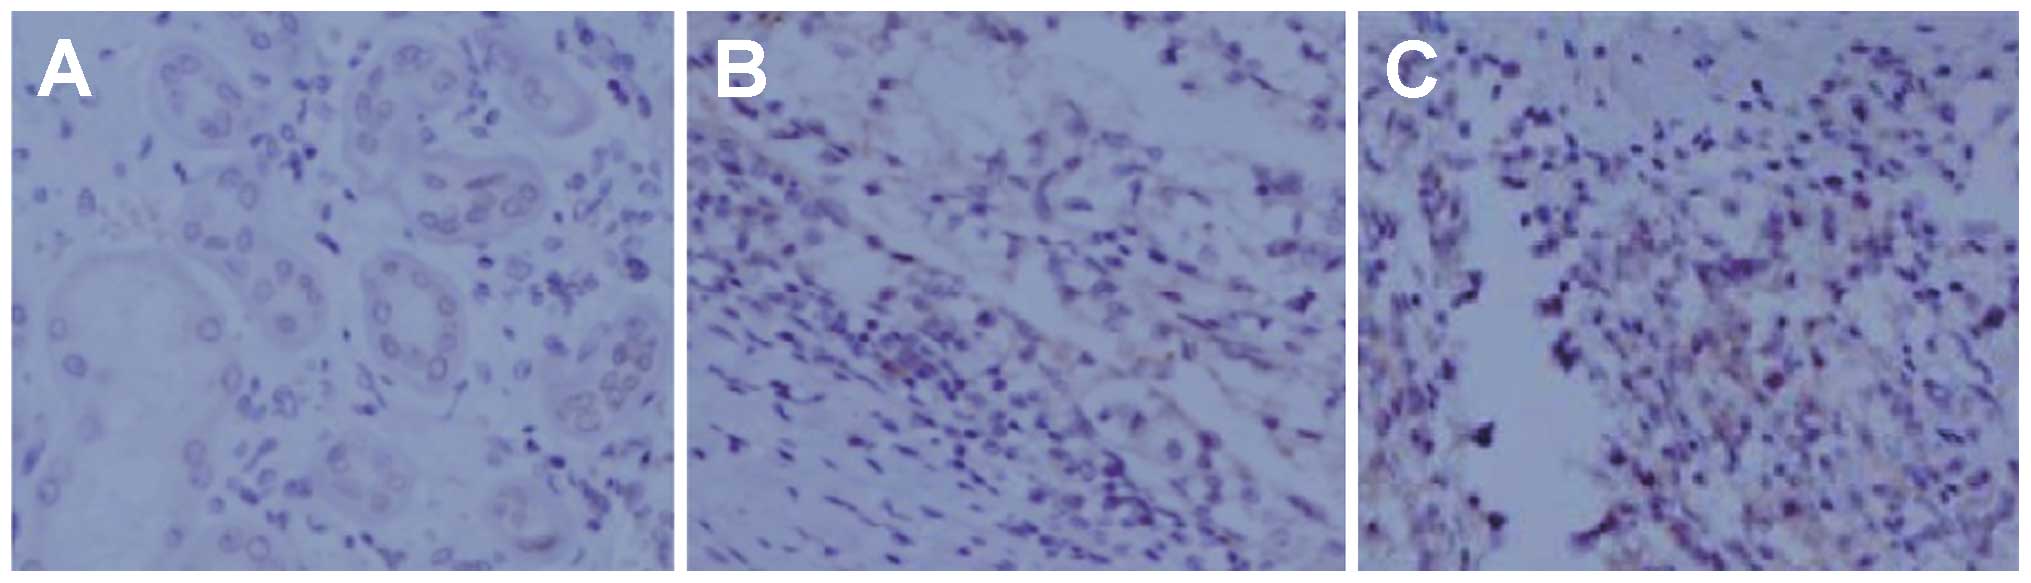
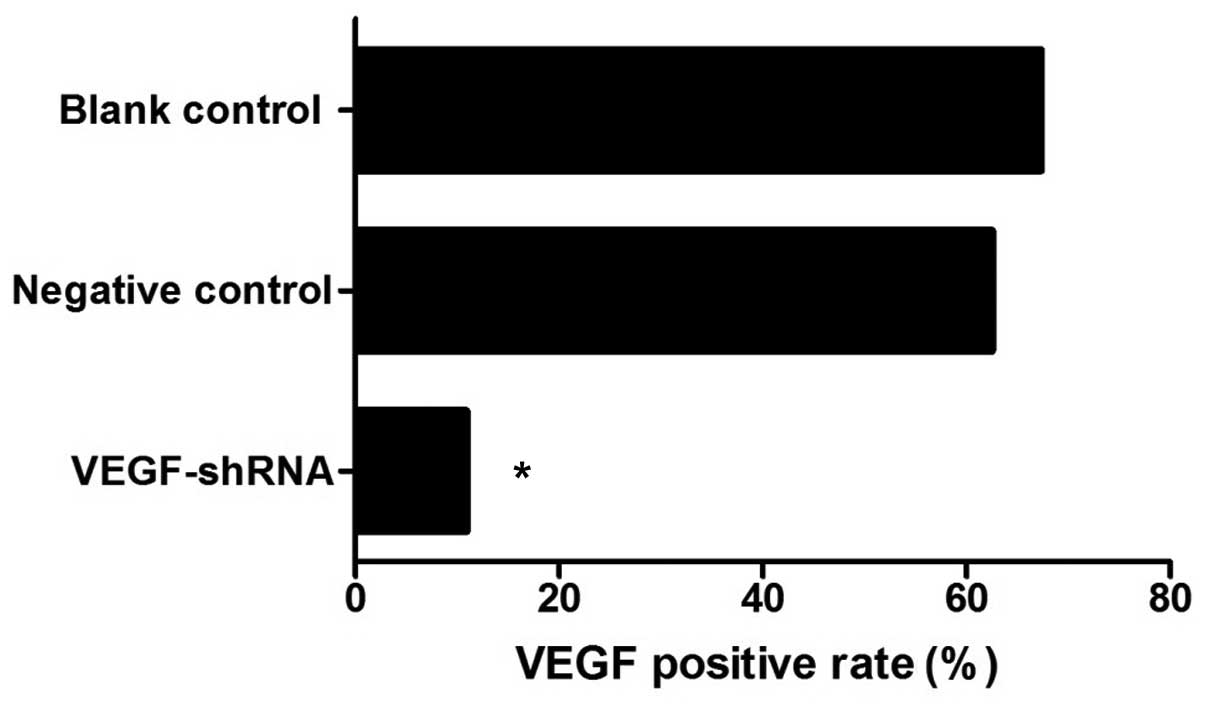
VEGF expression in nude mouse RCC
xenograft model
IHC staining detected VEGF expression (brownish
yellow) in the xenograft tumors, mainly in the cytoplasm and/or
membranes. Slices of IHC-stained RCC xenograft tumors from the
VEGF-shRNA, negative control and blank control groups were observed
by a double-blind method (Fig.
6). The tumor slices from the VEGF-shRNA group displayed a
decreased VEGF expression, specifically in the cytoplasm and
membrane. As shown in Fig. 7,
VEGF expression in the VEGF-shRNA group was lower than that in the
negative control and blank control groups (10.9 vs. 62.5 vs. 67.3%,
all P<0.05). No obvious differences in VEGF expression were
detected between the negative control and the blank control groups
(P>0.05, Fig. 7). The results
of IHC staining suggested that transfection with VEGF-shRNA
markedly inhibited the protein expression of VEGF in nude mice.
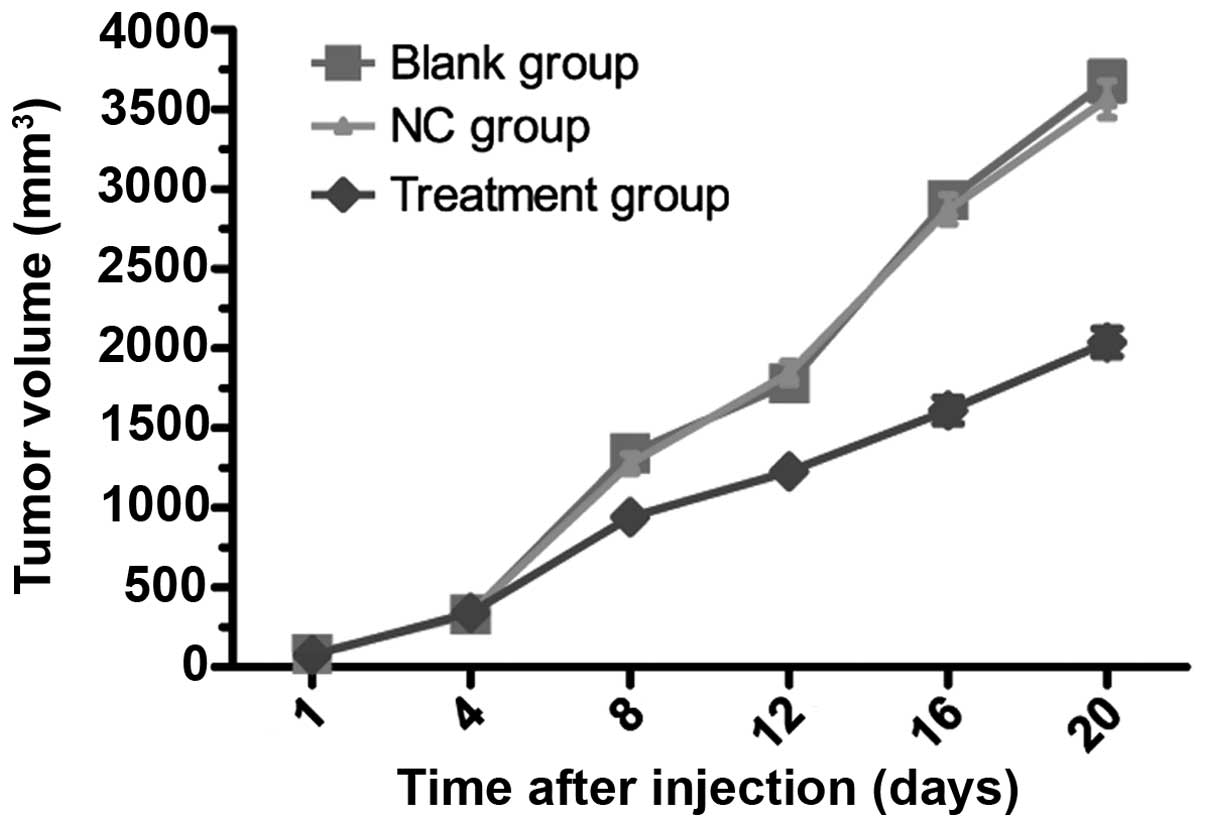
Tumor growth rates in tumor-bearing nude
mice
On day 7 after subcutaneous injection, the tumor
diameter on average was found to be ≥5 mm in all mice. The nude
mice were intratumorally injected with various treatments
[LV-VEGF-shRNA (treatment group), LV-NC-shRNA (negative control
group) and mice intratumorally injected with PBS (blank control
group)]. Compared with the negative control and blank control
groups, there were no significant differences in tumor volume in
the VEGF-shRNA treatment group during the first 4 days after
treatment (both P>0.05; Fig. 8
and Table V). The treatment group
showed a significantly reduced tumor growth on the 8th day after
treatment (Fig. 8 and Table V). At 8 days after treatment, the
tumor volume in the treatment group was significantly smaller than
that the negative control and blank control groups (both
P<0.05). No obvious significant differences in tumor volume were
observed between the negative control and blank control groups 8
days after treatment (P>0.05).
| Table VComparison of subcutaneous tumor
volume in tumor-bearing nude mice in the different treatment groups
at different time points. |
Table V
Comparison of subcutaneous tumor
volume in tumor-bearing nude mice in the different treatment groups
at different time points.
| Time point | Blank control
group | Negative control
group | Treatment
group | F-value | P-value |
|---|
| 1 day | 80.15±7.96 | 77.85±7.13 | 75.64±7.09 | 0.557 | 0.585 |
| 4 days | 330.56±18.23 | 339.78±18.94 | 342.89 ±18.52 | 0.716 | 0.505 |
| 8 days |
1341.12±61.78a |
1278.03±60.90a | 940.45±21.58 | 104.5 | <0.001 |
| 12 days |
1782.42±71.51a |
1846.63±71.71a | 1228.02±60.15 | 150.1 | <0.001 |
| 16 days |
2931.20±91.04a |
2872.57±92.55a | 1610.21±82.10 | 424.9 | <0.001 |
| 20 days |
3678.78±117.14a |
3564.63±115.16a | 2038.23±86.58 | 438.0 | <0.001 |
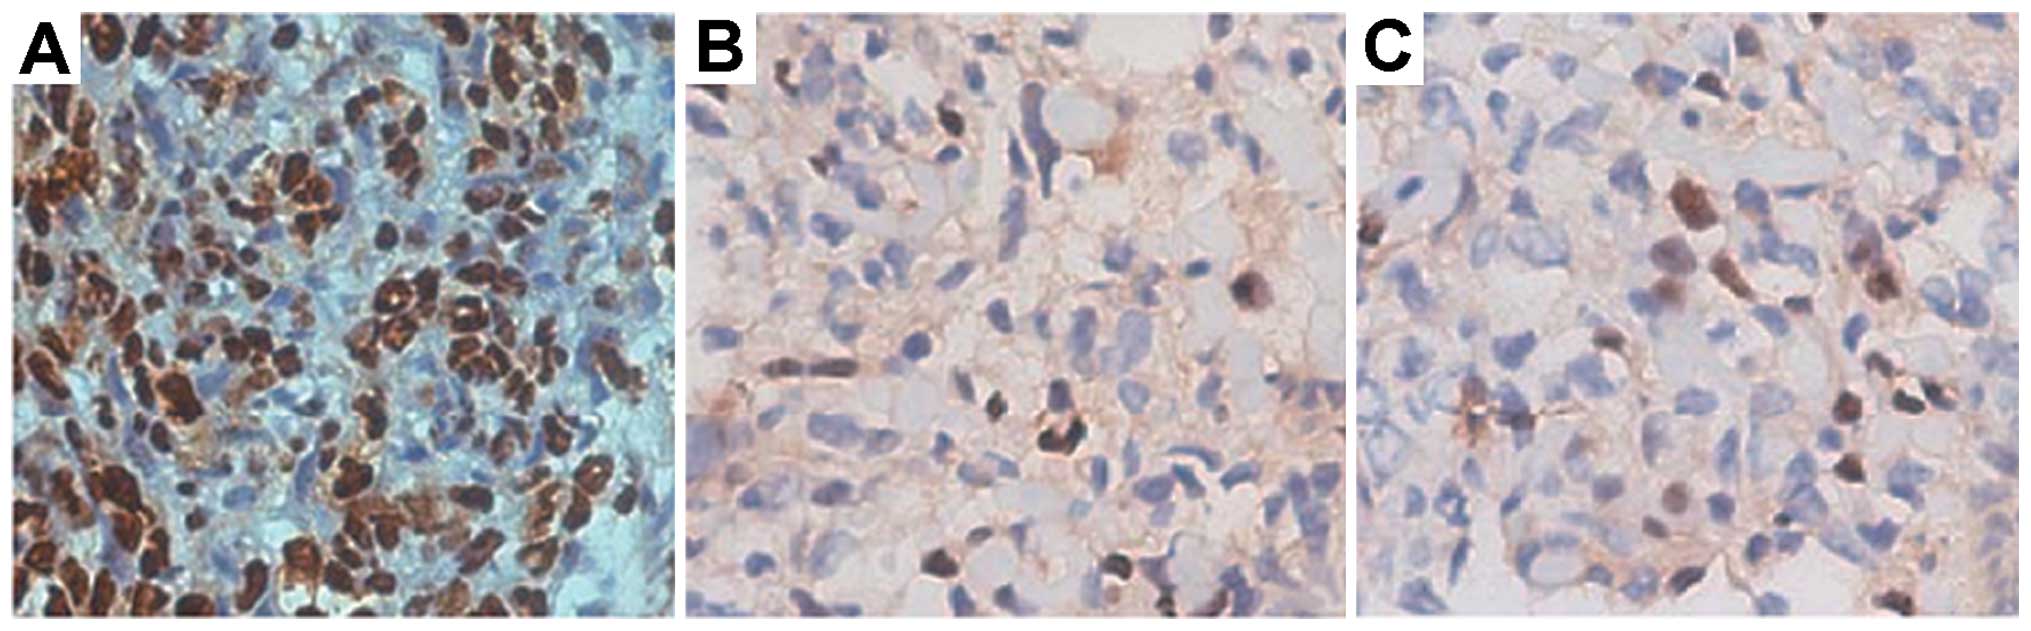
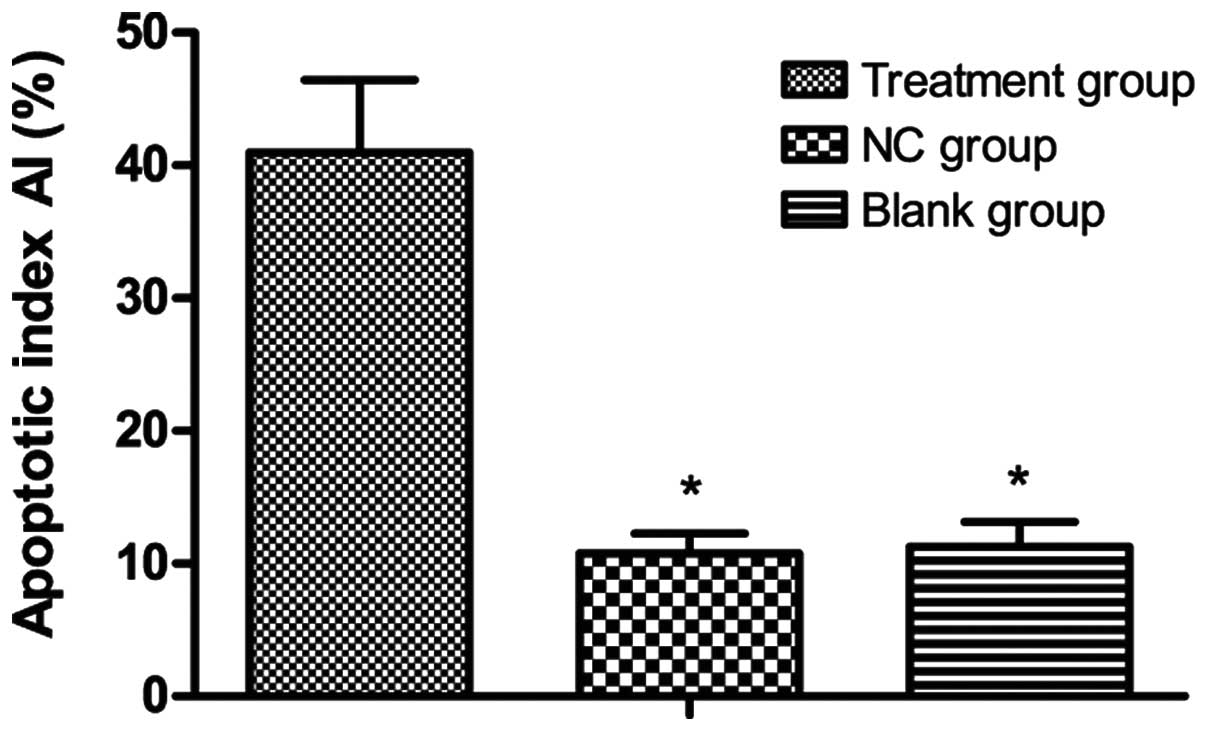
Apoptosis in tumor-bearing nude mice
Brownish yellow nuclei, chromatin condensation,
irregular cell morphology, and light-colored cells were observed in
the treatment group (Fig. 9). The
blank control and negative control groups showed a regular cell
morphology and few light-colored cells. As shown in Fig. 10, the apoptotic index in the
treatment group was significantly higher than that in the blank
control and negative control groups (40.97±5.47 vs. 11.06±1.87 and
10.76±1.50%, respectively, all P<0.05). There were no obvious
differences in the apoptotic index between the blank control and
the negative control groups (P>0.05).
Discussion
At diagnosis, 30–40% of patients with RCC already
suffer from metastatic disease, and radiotherapy or chemotherapy is
ineffective in the majority of cases (16). The most significant promoter of
tumor angiogenesis is VEGF (17).
The production of high levels of VEGF by solid tumors is a sign of
poor prognosis, indicative of rapid disease progression and poor
survival (18). This is true for
RCC where VEGF is a prominent player in tumor vascularization
(19). Therefore, tumor therapy
targeting VEGF is likely to be anti-angiogenic and efficacious in
RCC (20). Anti-angiogenic drug
therapy is a novel concept in the treatment of cancer where tumor
vasculature is disrupted by the inhibition of molecules/pathways
involved in angiogenesis. This causes the tumors to starve due to a
lack of blood supply and nourishment, resulting in tumor
destruction. This approach has been tested in animal models and
appears to have fewer side-effects and lacks drug resistance. Welti
et al reported that the vessel sprouting (angiogenesis)
model has been studied in the mouse retina, where vascularization
occurs post-natally, thus representing a physiological
sangiogenesis model (21). In the
study by Conley et al, the authors established a
tumor-bearing mouse model to determine whether anti-angiogenic
agents stimulate an increase in breast cancer stem cells in
vivo (22).
In the present study, we developed a recombinant
lentiviral LV-VEGF-shRNA tool to silence the expression of VEGF in
an RCC cell line. The capability of RNAi to suppress target genes
is a promising therapeutic tool against cancer (23). Indeed, transfection of a human RCC
cell line with recombinant lentiviral LV-VEGF-shRNA resulted in
decreased VEGF expression. The aim of the present study was to
evaluate lentiviral-based RNAi against VEGF as a selective
inhibitor of VEGF for the treatment of RCC. Accordingly, we
investigated its antitumor and anti-angiogenic functions in a chick
embryo chorioallantoic membrane model, a RCC xenograft nude mouse
model, and a tumor-bearing nude mouse model, to identify the role
of VEGF in vascularization and tumor growth in RCC.
The results obtained from the CAM assay revealed
that the relative total vessel length in the chorioallantoic
membrane injected with VEGF-shRNA was significantly shorter than
that of the controls. This implied that the anti-angiogenic effect
of the plenti6.3-miR-200 plasmid was caused by the knockdown of
VEGF expression. These findings support the hypothesis that the
proliferation of cancer cells is inhibited by the knockdown of
VEGF, leading to reduced vessel density in rapid-growing tumors,
such as RCC (9).
Equally important results in this study are those
achieved by the in vivo subcutaneous injection of a RCC
xenograft nude mouse model with 786-O cells transfected with
LV-VEGF-shRNA. We found that the growth of subcutaneous nodules in
the VEGF-shRNA group was slower than that in the blank control and
negative control groups. In addition, tumor volume and tumor weight
in the VEGF-shRNA group were significantly lower than those in the
controls after subcutaneous injection. These results suggested that
tumor growth was obviously inhibited by the knockdown of VEGF and
supplied evidence in support of the anti-angiogenic activity of
VEGF-shRNA. Antitumor efficacy may be the resulted of the
inhibition of tumor angiogenesis as demonstrated by decreased
intratumoral microvessel density. In line with our findings, a
previous study detected that the transfection of tumor cells with
siRNA-VEGF inhibited tumor growth and vessel density in prostate
cancer (24).
Considering future therapeutic applications to
advanced RCC, athe systemic administration of therapeutic
molecules/agents is of utmost interest as RCC progresses rapidly
and its metastatic spread is extensive. In this study, we
successfully validated the antitumor efficacy of the in vivo
delivery of a lent-virus expressing VEGF-shRNA by intratumoral
injection in tumor-bearing nude mice. Nude mice receiving
VEGF-shRNA showed considerably reduced tumor growth compared to the
controls, which further confirmed the antitumor effects of
VEGF-shRNA in RCC. The antitumor effect of an intratumoral
injection with VEGF-shRNA, as described in this study, is
consistent with the results of a previously published study which
showed that the transfer of siRNA-VEGF led to a 67% decrease in
tumor growth in a fibrosarcoma model (25). Further studies are required to
design better systemic delivery methods of lentivirus-based
therapeutic agents to allow a more effective antitumor
response.
In conclusion, in this study, we demonstrated that
treatment with VEGF-shRNA reduced VEGF protein levels in
vitro and in vivo, and inhibited vessel formation and
tumor growth in RCC. Therefore, treatment with a shRNA expression
vector targeted against VEGF may be a powerful tool for the future
treatment of RCC.
Acknowledgments
This study was funded by grants from the National
Natural Science Foundation (nos. 81172450, 81202008 and 81402089),
the Pudong Health Bureau of Shanghai (no. PW2013D-3) and the Key
Disciplines Group Construction Project of the Pudong Health Bureau
of Shanghai (PWZxq2014-11). We would like to acknowledge the
reviewers for their helpful comments on this study.
References
|
1
|
Sato Y, Yoshizato T, Shiraishi Y, Maekawa
S, Okuno Y, Kamura T, Shimamura T, Sato-Otsubo A, Nagae G, Suzuki
H, et al: Integrated molecular analysis of clear-cell renal cell
carcinoma. Nat Genet. 45:860–867. 2013. View Article : Google Scholar : PubMed/NCBI
|
|
2
|
Koul H, Huh JS, Rove KO, Crompton L, Koul
S, Meacham RB and Kim FJ: Molecular aspects of renal cell
carcinoma: a review. Am J Cancer Res. 1:240–254. 2011.PubMed/NCBI
|
|
3
|
Lin JA, Fang SU, Su CL, Hsiao CJ, Chang
CC, Lin YF and Cheng CW: Silencing glucose-regulated protein 78
induced renal cell carcinoma cell line G1 cell-cycle arrest and
resistance to conventional chemotherapy. Urol Oncol. 32:29.e1–11.
2014. View Article : Google Scholar
|
|
4
|
Molina AM, Tickoo SK, Ishill N, Trinos MJ,
Schwartz LH, Patil S, Feldman DR, Reuter VE, Russo P and Motzer RJ:
Sarcomatoid-variant renal cell carcinoma: treatment outcome and
survival in advanced disease. Am J Clin Oncol. 34:454–459. 2011.
View Article : Google Scholar
|
|
5
|
Cho IC and Chung J: Current status of
targeted therapy for advanced renal cell carcinoma. Korean J Urol.
53:217–228. 2012. View Article : Google Scholar : PubMed/NCBI
|
|
6
|
Zhang X, Wang W, Mize GJ, Takayama TK,
True LD and Vessella RL: Protease-activated receptor 2 signaling
upregulates angiogenic growth factors in renal cell carcinoma. Exp
Mol Pathol. 94:91–97. 2013. View Article : Google Scholar
|
|
7
|
Chen Y, Dawes PT and Mattey DL:
Polymorphism in the vascular endothelial growth factor A (VEGFA)
gene is associated with serum VEGF-A level and disease activity in
rheumatoid arthritis: differential effect of cigarette smoking.
Cytokine. 58:390–397. 2012. View Article : Google Scholar : PubMed/NCBI
|
|
8
|
Larsen AK, Ouaret D, El Ouadrani K and
Petitprez A: Targeting EGFR and VEGF(R) pathway cross-talk in tumor
survival and angiogenesis. Pharmacol Ther. 131:80–90. 2011.
View Article : Google Scholar : PubMed/NCBI
|
|
9
|
Takahashi S: Vascular endothelial growth
factor (VEGF), VEGF receptors and their inhibitors for
antiangiogenic tumor therapy. Biol Pharm Bull. 34:1785–1788. 2011.
View Article : Google Scholar : PubMed/NCBI
|
|
10
|
Gray RT, O'Donnell ME, Maxwell P, McGuigan
JA and Spence GM: Long-term follow-up of immunocytochemical
analysis of vascular endothelial growth factor (VEGF), and its two
receptors, VEGF-R1 (Flt-1) and VEGF-R2 (Flk-1/KDR), in
oesophagogastric cancer. Int J Biol Markers. 28:63–70. 2013.
View Article : Google Scholar
|
|
11
|
Wang L, Rahman S, Lin CY, Valdivia J, Than
K, La Marca F and Park P: A novel murine model of human renal cell
carcinoma spinal metastasis. J Clin Neurosci. 19:881–883. 2012.
View Article : Google Scholar : PubMed/NCBI
|
|
12
|
Albiges L, Salem M, Rini B and Escudier B:
Vascular endothelial growth factor-targeted therapies in advanced
renal cell carcinoma. Hematol Oncol Clin North Am. 25:813–833.
2011. View Article : Google Scholar : PubMed/NCBI
|
|
13
|
Castel SE and Martienssen RA: RNA
interference in the nucleus: roles for small RNAs in transcription,
epigenetics and beyond. Nat Rev Genet. 14:100–112. 2013. View Article : Google Scholar : PubMed/NCBI
|
|
14
|
Sliva K and Schnierle BS: Selective gene
silencing by viral delivery of short hairpin RNA. Virol J 2010.
7:2482010.
|
|
15
|
Benson DA, Boguski M, Lipman DJ and Ostell
J: GenBank. Nucleic Acids Res. 22:3441–3444. 1994. View Article : Google Scholar : PubMed/NCBI
|
|
16
|
Siegel R, DeSantis C, Virgo K, Stein K,
Mariotto A, Smith T, Cooper D, Gansler T, Lerro C, Fedewa S, et al:
Cancer treatment and survivorship statistics, 2012. CA Cancer J
Clin. 62:220–241. 2012. View Article : Google Scholar : PubMed/NCBI
|
|
17
|
Gerber DE: Targeted therapies: a new
generation of cancer treatments. Am Fam Physician. 77:311–319.
2008.PubMed/NCBI
|
|
18
|
Eichelberg C, Junker K, Ljungberg B and
Moch H: Diagnostic and prognostic molecular markers for renal cell
carcinoma: a critical appraisal of the current state of research
and clinical applicability. Eur Urol. 55:851–863. 2009. View Article : Google Scholar : PubMed/NCBI
|
|
19
|
Ellis LM and Hicklin DJ: VEGF-targeted
therapy: mechanisms of anti-tumour activity. Nat Rev Cancer.
8:579–591. 2008. View
Article : Google Scholar : PubMed/NCBI
|
|
20
|
Lane HA, Wood JM, McSheehy PM, Allegrini
PR, Boulay A, Brueggen J, Littlewood-Evans A, Maira SM,
Martiny-Baron G, Schnell CR, et al: mTOR inhibitor RAD001
(everolimus) has antiangiogenic/vascular properties distinct from a
VEGFR tyrosine kinase inhibitor. Clin Cancer Res. 15:1612–1622.
2009. View Article : Google Scholar : PubMed/NCBI
|
|
21
|
Welti J, Loges S, Dimmeler S and Carmeliet
P: Recent molecular discoveries in angiogenesis and antiangiogenic
therapies in cancer. J Clin Invest. 123:3190–3200. 2013. View Article : Google Scholar : PubMed/NCBI
|
|
22
|
Conley SJ, Gheordunescu E, Kakarala P,
Newman B, Korkaya H, Heath AN, Clouthier SG and Wicha MS:
Antiangiogenic agents increase breast cancer stem cells via the
generation of tumor hypoxia. Proc Natl Acad Sci USA. 109:2784–2789.
2012. View Article : Google Scholar : PubMed/NCBI
|
|
23
|
Gandellini P, Profumo V, Folini M and
Zaffaroni N: MicroRNAs as new therapeutic targets and tools in
cancer. Expert Opin Ther Targets. 15:265–279. 2011. View Article : Google Scholar : PubMed/NCBI
|
|
24
|
Wannenes F, Ciafré SA, Niola F, Frajese G
and Farace MG: Vector-based RNA interference against vascular
endothelial growth factor-A significantly limits vascularization
and growth of prostate cancer in vivo. Cancer Gene Ther.
12:926–934. 2005. View Article : Google Scholar : PubMed/NCBI
|
|
25
|
Filleur S, Courtin A, Ait-Si-Ali S,
Guglielmi J, Merle C, Harel-Bellan A, Clézardin P and Cabon F:
SiRNA-mediated inhibition of vascular endothelial growth factor
severely limits tumor resistance to antiangiogenic thrombospondin-1
and slows tumor vascularization and growth. Cancer Res.
63:3919–3922. 2003.PubMed/NCBI
|