Introduction
MicroRNAs (miRNAs) are 20–25 nucleotides in length,
and are non-coding RNAs that incompletely bind to the 3′
untranslated region (UTR) of multiple target mRNAs and thereby
enhance their degradation and inhibit their translation. Increasing
evidence indicates that miRNAs have critical roles in numerous
human biological and pathological processes such as growth,
apoptosis, development and tumorigenesis (1–5).
miRNAs can regulate the expression of a variety of target genes and
have been shown to function as tumor suppressors and oncogenes
(6–8). In addition to their potential as
novel molecules for cancer therapy (9), miRNAs also represent an emerging
class of diagnostic and prognostic markers (10,11). Therefore, an accurate
determination of miRNA expression levels is fundamental to the
elucidation of their biological function.
Adaptation of existing technologies for profiling of
miRNA expression includes reverse transcription-quantitative
polymerase chain reaction (RT-qPCR), chip-based microarrays and
next-generation sequencing. Among these technologies, RT-qPCR is
widely used to quantify miRNA expression due to its sensitivity,
specificity, speed, simplicity and the small quantities of
template-RNA required. To correct for systematic variables, such as
the quantity of starting template, RNA quality and enzymatic
efficiency, RT-qPCR data are normalized against certain internal
control genes that are ideally invariantly expressed across the
test-sample set. The selection of a suitable internal control gene
is an important first step in the accurate and reliable
determination of miRNA expression levels. Although a consensus has
not yet been reached on the optimal normalization strategy for
miRNA in RT-qPCR studies, numerous RNA species, including rRNA (18S
rRNA and 5S rRNA), snRNA (U6) and miRNAs (miR-191, miR-15a,
miR-18a, let-7f and miR-16), have previously been used as internal
control genes.
Numerous studies have proposed the use of U6 for
normalization of tissue miRNAs, as U6 was shown to be consistently
expressed in different tissues and cell types (12–15). However, it was recently suggested
that U6 is unsuitable for normalization of tissue miRNA as the
tissue levels of U6 exhibit high inter-individual variances and
demonstrate instability in human lung, breast-tumor, liver and
urothelial carcinoma, as well as in canine lymphoma (16–20). These published studies used
RT-qPCR to compare the cycle-threshold (Ct) and applied numerous
analytical tools, such as Normfinder, geNorm, ΔCt, stability index
and Bestkeeper (21–24), to analyze the instability of U6
and identify the best internal control gene. These studies revealed
the high variability of U6 expression. However, the reason for this
variability remains to be elucidated. U6 snRNA is unique among the
splicing snRNAs in that it is transcribed by RNA polymerase III
(RNAP-III), and transcription by RNAP-III is strongly regulated,
differing between diverse class III genes, among cell types. This
finding led us to question whether there are U6 expression
discrepancies in different cell types in human tissues and whether
there are cellular composition changes between diseased and
non-diseased tissues. In regards to these considerations, the
present study analyzed the expression and maldistribution of U6
using miRNA in situ hybridization in human carcinoma
tissues, and corresponding normal tissues, to explain the high
variability of U6 obtained by RT-qPCR.
Materials and methods
Patients and pathology
All patients with cancer underwent curative
resection of the primary tumor at the Second Affiliated Hospital of
Harbin Medical University (Harbin, China) between April 2010 and
2014. No patients received neoadjuvant chemotherapy or radiotherapy
prior to surgery. The following samples were included: 20 pairs of
breast carcinoma (Table I), 5 of
gastric carcinoma, 5 of colorectal carcinoma, 5 of esophageal
squamous cell carcinoma, 5 of lung squamous cell carcinoma, 5 of
hepatocellular carcinoma, 5 of intrahepatic cholangiocarcinoma and
5 of combined hepatocellular-cholangiocarcinoma (Table II). Resected carcinoma and
corresponding normal tissues (>2 cm from carcinoma tissue) were
immediately cut. Each tissue was divided into two sections. One
section was frozen in liquid nitrogen and kept at −80°C until RNA
extraction. The other was cut into 5-mm slices, fixed in buffered
4% formaldehyde and embedded in paraffin. In addition, 4-µm
histological sections were made and stained with hematoxylin and
eosin. Histological type and grade were assessed by two
pathologists (Yufei Jiao and Ge Lou) with considerable experience
in clinical pathology, according to the World Health Organization
criteria.
 | Table IAvailable clinical and pathological
data of the breast carcinoma samples. |
Table I
Available clinical and pathological
data of the breast carcinoma samples.
| No. of patient | Patient age,
years | Menopausal
status | Size, mm | T | N | M | Grade | ER | PR | HER2/neu | Subtype |
|---|
| 1 | 43 | Pre | 13 | 1 | 1 | 0 | 2 | P | P | N | Luminal A |
| 2 | 42 | Pre | 16 | 1 | 1 | 0 | 3 | N | N | N | Basal |
| 3 | 45 | Pre | 35 | 2 | 2 | 0 | 2 | P | P | N | Luminal A |
| 4 | 45 | Pre | 20 | 1 | 0 | 0 | 2 | P | P | N | Luminal A |
| 5 | 42 | Pre | 20 | 1 | 1 | 0 | 2 | P | P | N | Luminal A |
| 6 | 37 | Pre | 33 | 2 | 2 | 0 | 3 | N | N | N | Basal |
| 7 | 41 | Pre | 35 | 4 | 3 | 1 | 3 | N | P | P | Luminal B |
| 8 | 43 | Pre | 20 | 1 | 0 | 0 | 3 | N | N | N | Basal |
| 9 | 46 | Pre | 20 | 1 | 0 | 0 | 3 | P | P | N | Luminal A |
| 10 | 59 | Post | 20 | 1 | 0 | 0 | 3 | N | N | N | Basal |
| 11 | 49 | Pre | 30 | 2 | 1 | 0 | 2 | P | P | N | Luminal A |
| 12 | 35 | Pre | 20 | 1 | 1 | 0 | 1 | P | P | P | Luminal B |
| 13 | 50 | Post | 18 | 1 | 3 | 1 | 3 | P | P | P | Luminal B |
| 14 | 57 | Post | 16 | 1 | 1 | 0 | 3 | N | N | P | HER-2 |
| 15 | 42 | Pre | 55 | 3 | 3 | 1 | 3 | N | N | P | HER-2 |
| 16 | 40 | Pre | 20 | 1 | 1 | 0 | 2 | P | P | N | Luminal A |
| 17 | 61 | Post | 30 | 2 | 0 | 0 | 3 | P | P | N | Luminal A |
| 18 | 46 | Pre | 15 | 1 | 0 | 0 | 2 | N | N | P | HER-2 |
| 19 | 71 | Post | 18 | 1 | 1 | 0 | 2 | N | P | P | Luminal B |
| 20 | 37 | Pre | 35 | 2 | 0 | 0 | 3 | N | N | N | Basal |
| Table IIAvailabcle clinical and pathological
data of the carcinoma samples in the liver. |
Table II
Availabcle clinical and pathological
data of the carcinoma samples in the liver.
| No. of patient | Patient age,
years | Gender | Pathological
type | Size, cm |
Differentiation | Location | TNM stage | Viral
infection | Liver
cirrhosis |
|---|
| 1 | 53 | Female | Hepatocellular
carcinoma | 16 | Moderate | Left lobe | IIIa | HBV | Y |
| 2 | 44 | Male | Hepatocellular
carcinoma | 20 | Poor | Right lobe | IIIc | HBV+HCV | Y |
| 3 | 55 | Male | Hepatocellular
carcinoma | 4.8 | Well | Left lobe | II | N | N |
| 4 | 40 | Male | Hepatocellular
carcinoma | 11 | Well | Left lobe | IIIa | HBV | Y |
| 5 | 33 | Male | Hepatocellular
carcinoma | 10 | Poor | Right lobe | IIIb | N | N |
| 6 | 44 | Female |
Cholangiocarcinoma | 18 | Moderate-poor | Right lobe | IIIc | N | N |
| 7 | 51 | Female |
Cholangiocarcinoma | 8 | Moderate | Right lobe | IIIb | N | N |
| 8 | 44 | Male |
Cholangiocarcinoma | 12 | Moderate-poor | Right lobe | IIIb | HBV+HCV | Y |
| 9 | 38 | Male |
Cholangiocarcinoma | 9 | Poor | Left lobe | IIIc | N | N |
| 10 | 45 | Male |
Cholangiocarcinoma | 8 | Moderate | Left lobe | IIIa | HBV | Y |
| 11 | 40 | Male | Combined
hepatocellular-cholangiocarcinoma | 11 | Moderate-poor | Right lobe | IIIc | HBV | Y |
| 12 | 60 | Female | Combined
hepatocellular-cholangiocarcinoma | 9 | Moderate | Left lobe | IIIa | HBV | Y |
| 13 | 39 | Male | Combined
hepatocellular-cholangiocarcinoma | 18 | Poor | Right lobe | IV | HCV | Y |
| 14 | 35 | Male | Combined
hepatocellular-cholangiocarcinoma | 12 | Moderate-poor | Right lobe | IIIc | HBV+HCV | Y |
| 15 | 47 | Female | Combined
hepatocellular-cholangiocarcinoma | 10 | Moderate | Left lobe | IIIa | HBV | Y |
All the procedures were performed in accordance with
the university's ethical standards and hospital criteria. All the
participants provided informed consent.
miRNA isolation from tissue and
RT-qPCR
RNA was extracted from tissues with TRIzol reagents
(Invitrogen, Carlsbad, CA, USA) according to the manufacturer's
instructions. Total RNA was reverse-transcribed to cDNA using a
High-Capacity cDNA reverse transcription kit (Applied Biosystems,
Beijing, China). RT-qPCR for U6 was performed using cDNA generated
from 1 µg of total RNA using a SYBR-Green PCR Master mix
(Applied Biosystems) according to the manufacturer's instructions.
U6 amplification was performed using an RT-primer set: Forward,
5′-CGCTTC ACGAATTTGCGTGTCAT-3′; and a standard primer set: Forward,
5′-GCTTCGGCAGCACATATACTAAAAT-3′ and reverse,
5′-CGCTTCACGAATTTGCGTGTCAT-3′. miR-16 was amplified using an
RT-primer set: GTCGTATCCAGTGCA GGGTCCGAGGTATTCGCACTGGATACGACCGCCAA;
and a standard primer set: Forward, 5′-CGCGCTAGCAGCACG TAAAT-3′ and
reverse, 5′-GTGCAGGGTCCGAGGT-3′. The reverse transcription reaction
mixture (20 µl) was subjected to RT-qPCR analyses using a
7500 Real-Time PCR system (Applied Biosystems) according to the
manufacturer's instructions. All the samples were performed in
triplicate.
miRNA in situ hybridization (MISH)
Probe
Locked nucleic acid (LNA)-modified oligonucleotide
probes for human, mature U6 and the scrambled negative control
labeled with 5′ end digoxigenin (DIG) were obtained from Exiqon
(Vedbaek, Denmark). The sequences of the U6 probe and the scramble
control probe were 5′-CACGAATTTGCGTGTCATCCTT-3′ and 5′-GTGTAA
CACGTCTATACGCCCA-3′, respectively.
In situ hybridization
Sections (5-µm) from tissue blocks were
deparaffinized, dehydrated and subsequently fixed in 10%
neutral-buffered formalin for 10 min. Slides were subsequently
immersed in acetylation solution for 10 min and incubated in
proteinase K (20 µg/ml) for 5 min. After prehybridization at
room temperature followed by incubation at 37°C for 4–8 h,
hybridization was performed at 37°C overnight. On the following day
the slides were washed in 5X standard saline citrate for 30 min at
37°C, and subsequently, were washed twice for 30 min in 0.2X
standard saline citrate. Following blocking in fetal bovine serum
and hydrogen peroxide at room temperature for 2 h, the blocking
buffer was replaced with blocking buffer containing anti-DIG-POD,
Fab fragments from sheep (cat. no. 11 207 733 910; Roche
Diagnostics GmbH, Mannheim, Germany). The slides were subsequently
placed in a double-distilled H2O box and incubated at
4°C overnight.
Tyramide signal amplification (TSA)
detection
Following in situ hybridization, excess
antibody was removed in 0.1 M Tris-HCl (pH 7.5), 0.15 M NaCl and
0.05% Tween-20 (TNT) buffer three times for 15 min. The signal was
amplified and visualized by tyramide signal amplification using the
TSA-Plus Fluorescein System (Perkin Elmer, Waltham, MA, USA),
according to the manufacturer's instructions. Amplification was
performed in the dark for 7 min, with 100 µl/slide of TSA
reagent diluted 1:50 with TSA diluents. Slides were washed in TNT
buffer three times for 15 min. Slides were subsequently mounted in
ProLong Gold with 4′,6-diamidino-2-phenylindole and sealed with
nail varnish.
Quantification of the U6 MISH
signal
Images containing U6 fluorescence signals in the
tissues were captured by an Olympus Bio Imaging Navigator (FSX100;
Olympus, Tokyo, Japan). The MISH images were analyzed using ImageJ
software (http://imagej.nih.gov/ij/).
Immunohistochemical staining
(IHC)
Formalin-fixed, paraffin-embedded tissue blocks of
liver cancer were stained for hepatocyte and cytokeratin 19 (CK19)
expression. Tissue sections (3-µm) were deparaffinized and
hydrated following standard procedures. Following immersing in 3%
hydrogen peroxide for 10 min to eliminate endogenous peroxidase,
the sections were microwaved for antigen retrieval in 0.01 M sodium
citrate for 15 min, followed by incubation with primary antibodies
at 4°C overnight. The sources of primary antibodies used for IHC
were hepatocyte (MAB-0249) and CK19 (MAB-0056). The EliVision™
super detection kit (KIT-9921) (all from MaiXin-Bio, Fuzhou, China)
was used as a secondary antibody. 3′3-Diaminobenzidine
tetrahydrochloride was used as a chromogen. Hematoxylin was used to
counterstain the sections.
Statistical analysis
Raw Ct values of U6 and miR-16 were shown as the
difference to the median. To quantify the variability of U6 and
miR-16 levels, 'mean of D2-value' were used. Differences
in the mean of these received D2-values were analyzed
with a t-test. The U6 Ct value differences discrepancies between
two groups were compared using the Mann-Whitney U test. P<0.05
was considered to indicate a statistically significant
difference.
Results
U6 levels exhibit high variability in
human breast tissues
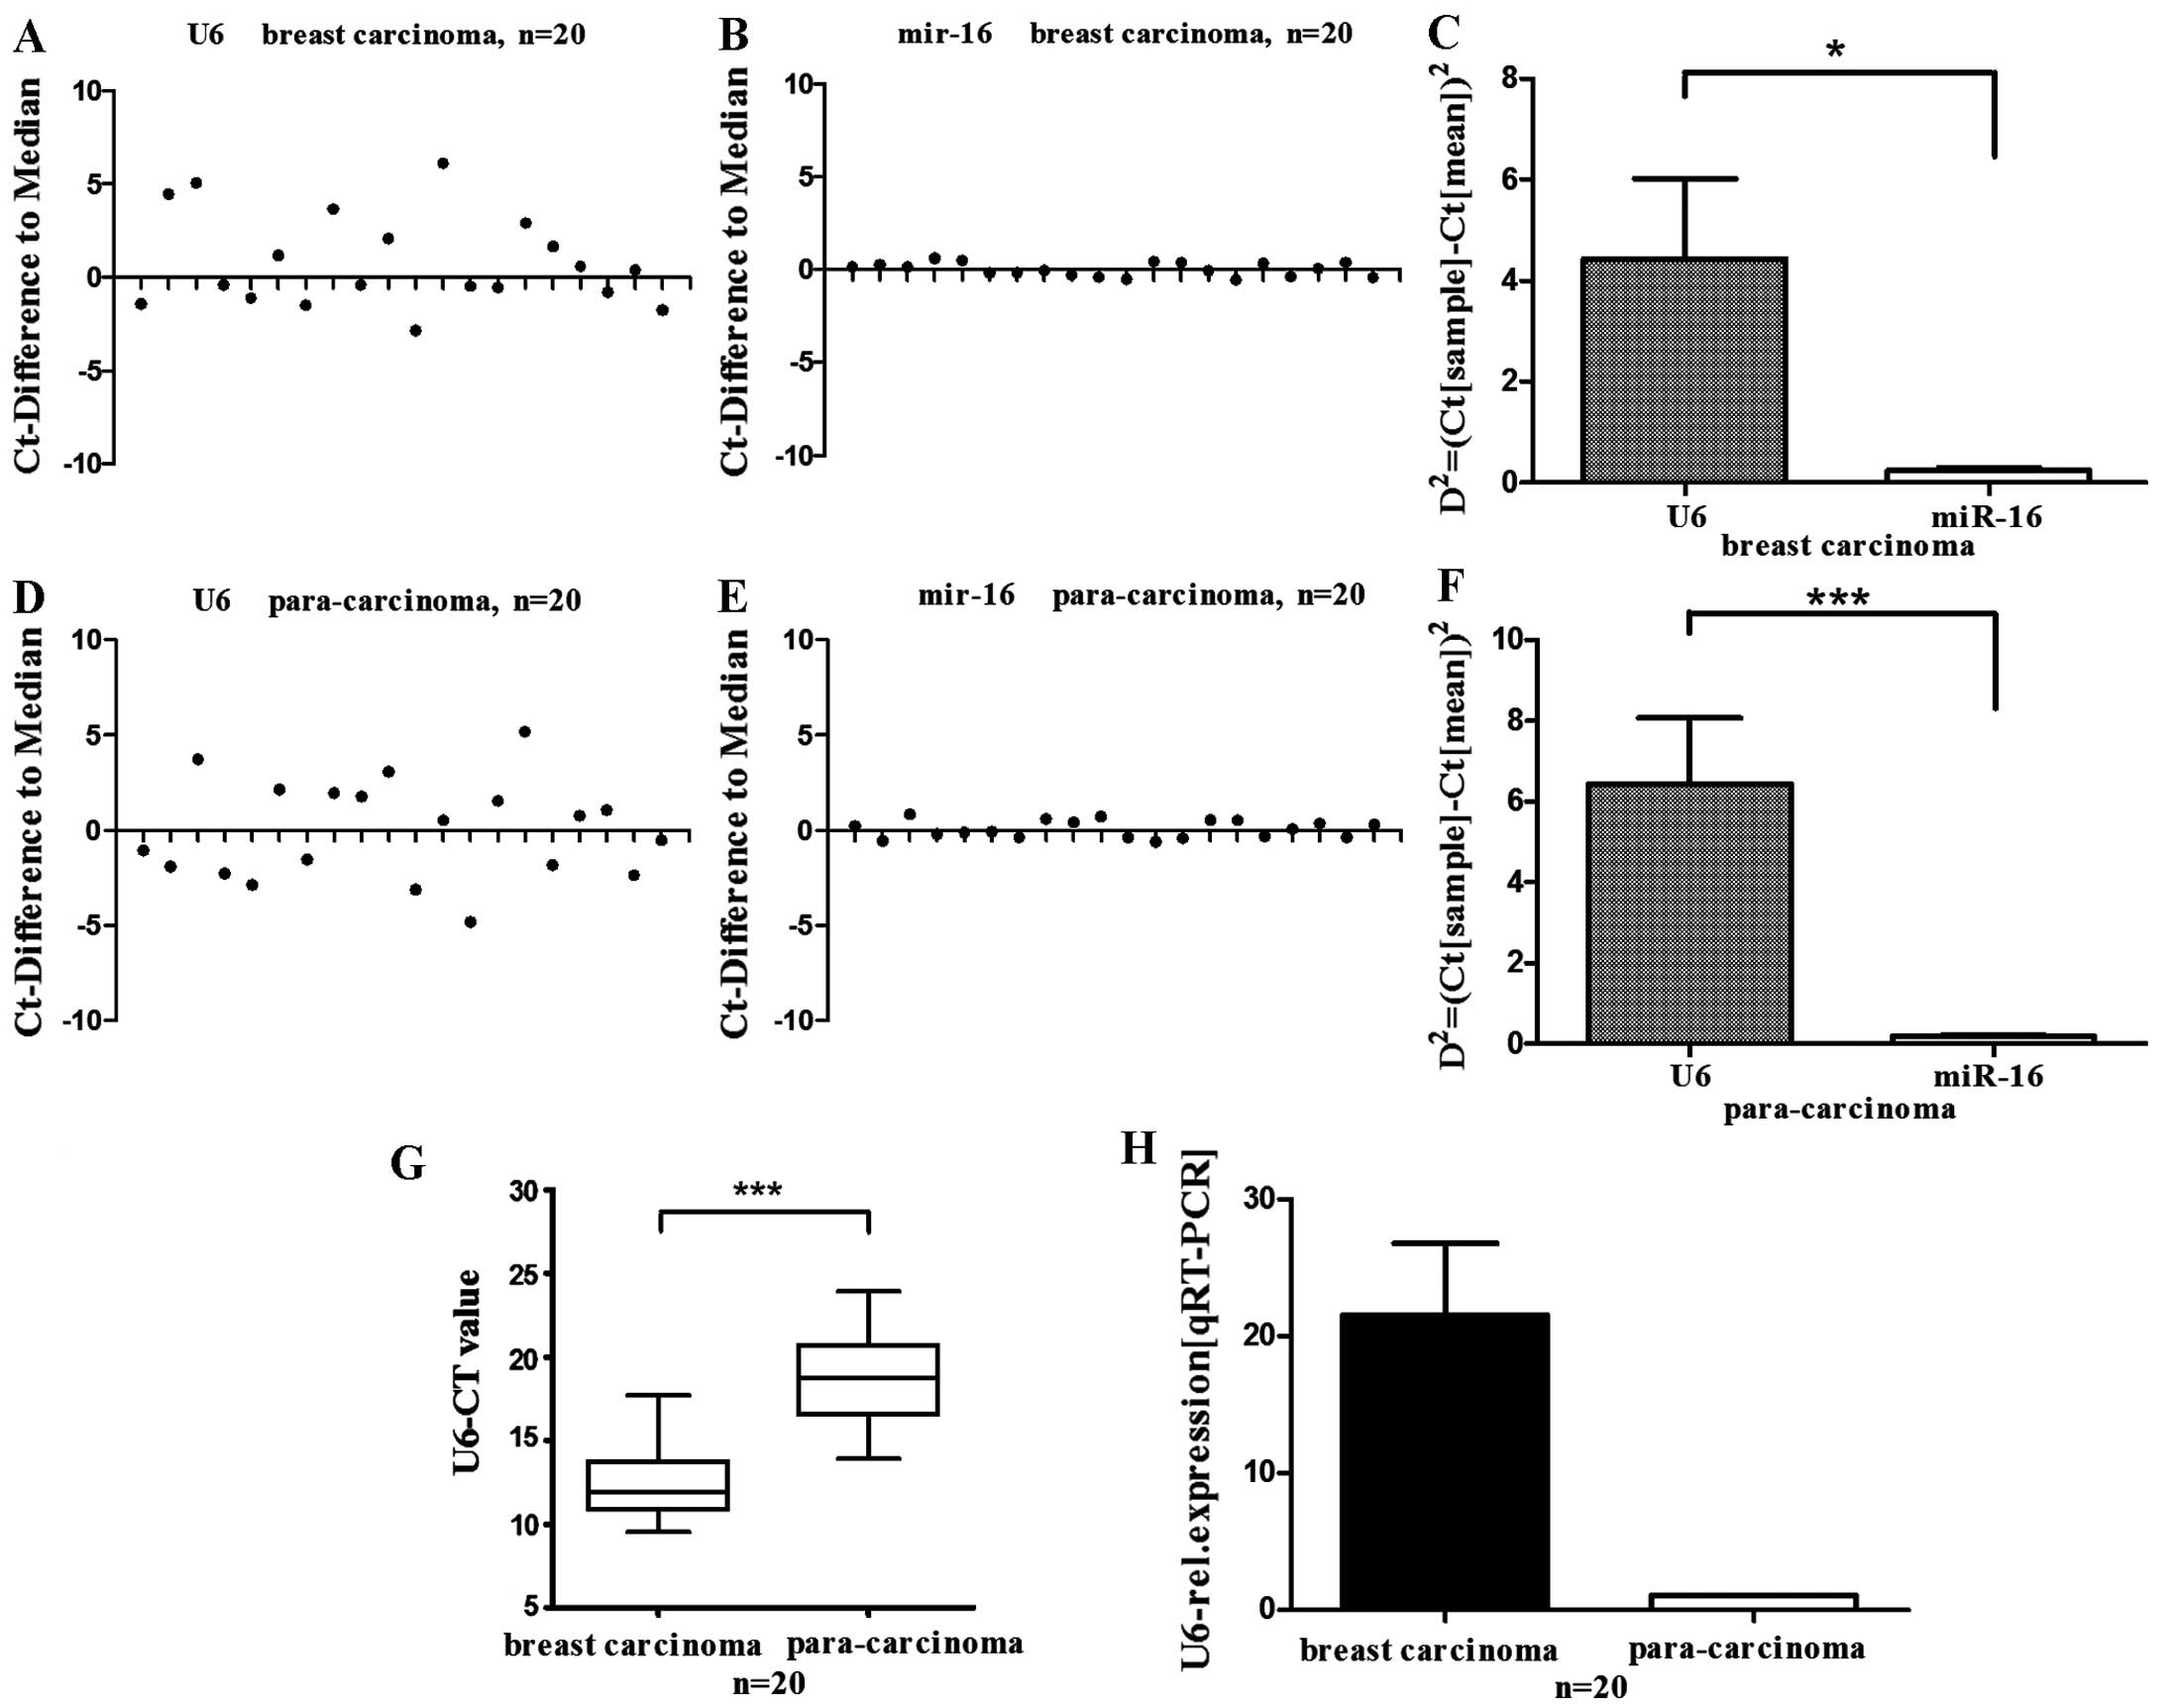
The variability of U6 levels in human breast tissues
were examined and RT-qPCR analysis was performed on RNA extracts
from tissue samples of breast carcinoma and corresponding normal
tissues. Initial miRNA studies on breast tissues by Mattie et
al (25) normalized miRNA
expression to miR-16 and let-7, which were later shown to be stably
expressed across malignant, benign and normal breast tissue by
Davoren et al (17).
Therefore, miR-16 was selected as a reference control gene. As
shown in Fig. 1, in breast
carcinoma tissues, U6 levels were significantly higher compared
with corresponding normal tissues (Fig. 1H). Tissue levels of U6 exhibited
high inter-individual variability in breast carcinoma tissues and
adjacent normal tissues, which was significantly higher compared
with miR-16 (Fig. 1A–G).
Consequently, if U6 is selected as an internal control gene for
quantitative analysis of miRNA by RT-qPCR, the high level of U6 in
human breast tissues may lead to a perceived variation of miRNA,
and this misrepresentation of miRNA expression may obfuscate the
understanding of miRNA function.
LNA-MISH provides specificity for the
detection of U6 levels in human breast carcinoma and corresponding
normal breast tissues
The RT-qPCR results were analyzed and interpreted by
miRNA in situ hybridization. U6 in situ expression
was detected in the aforementioned breast carcinoma tissues and
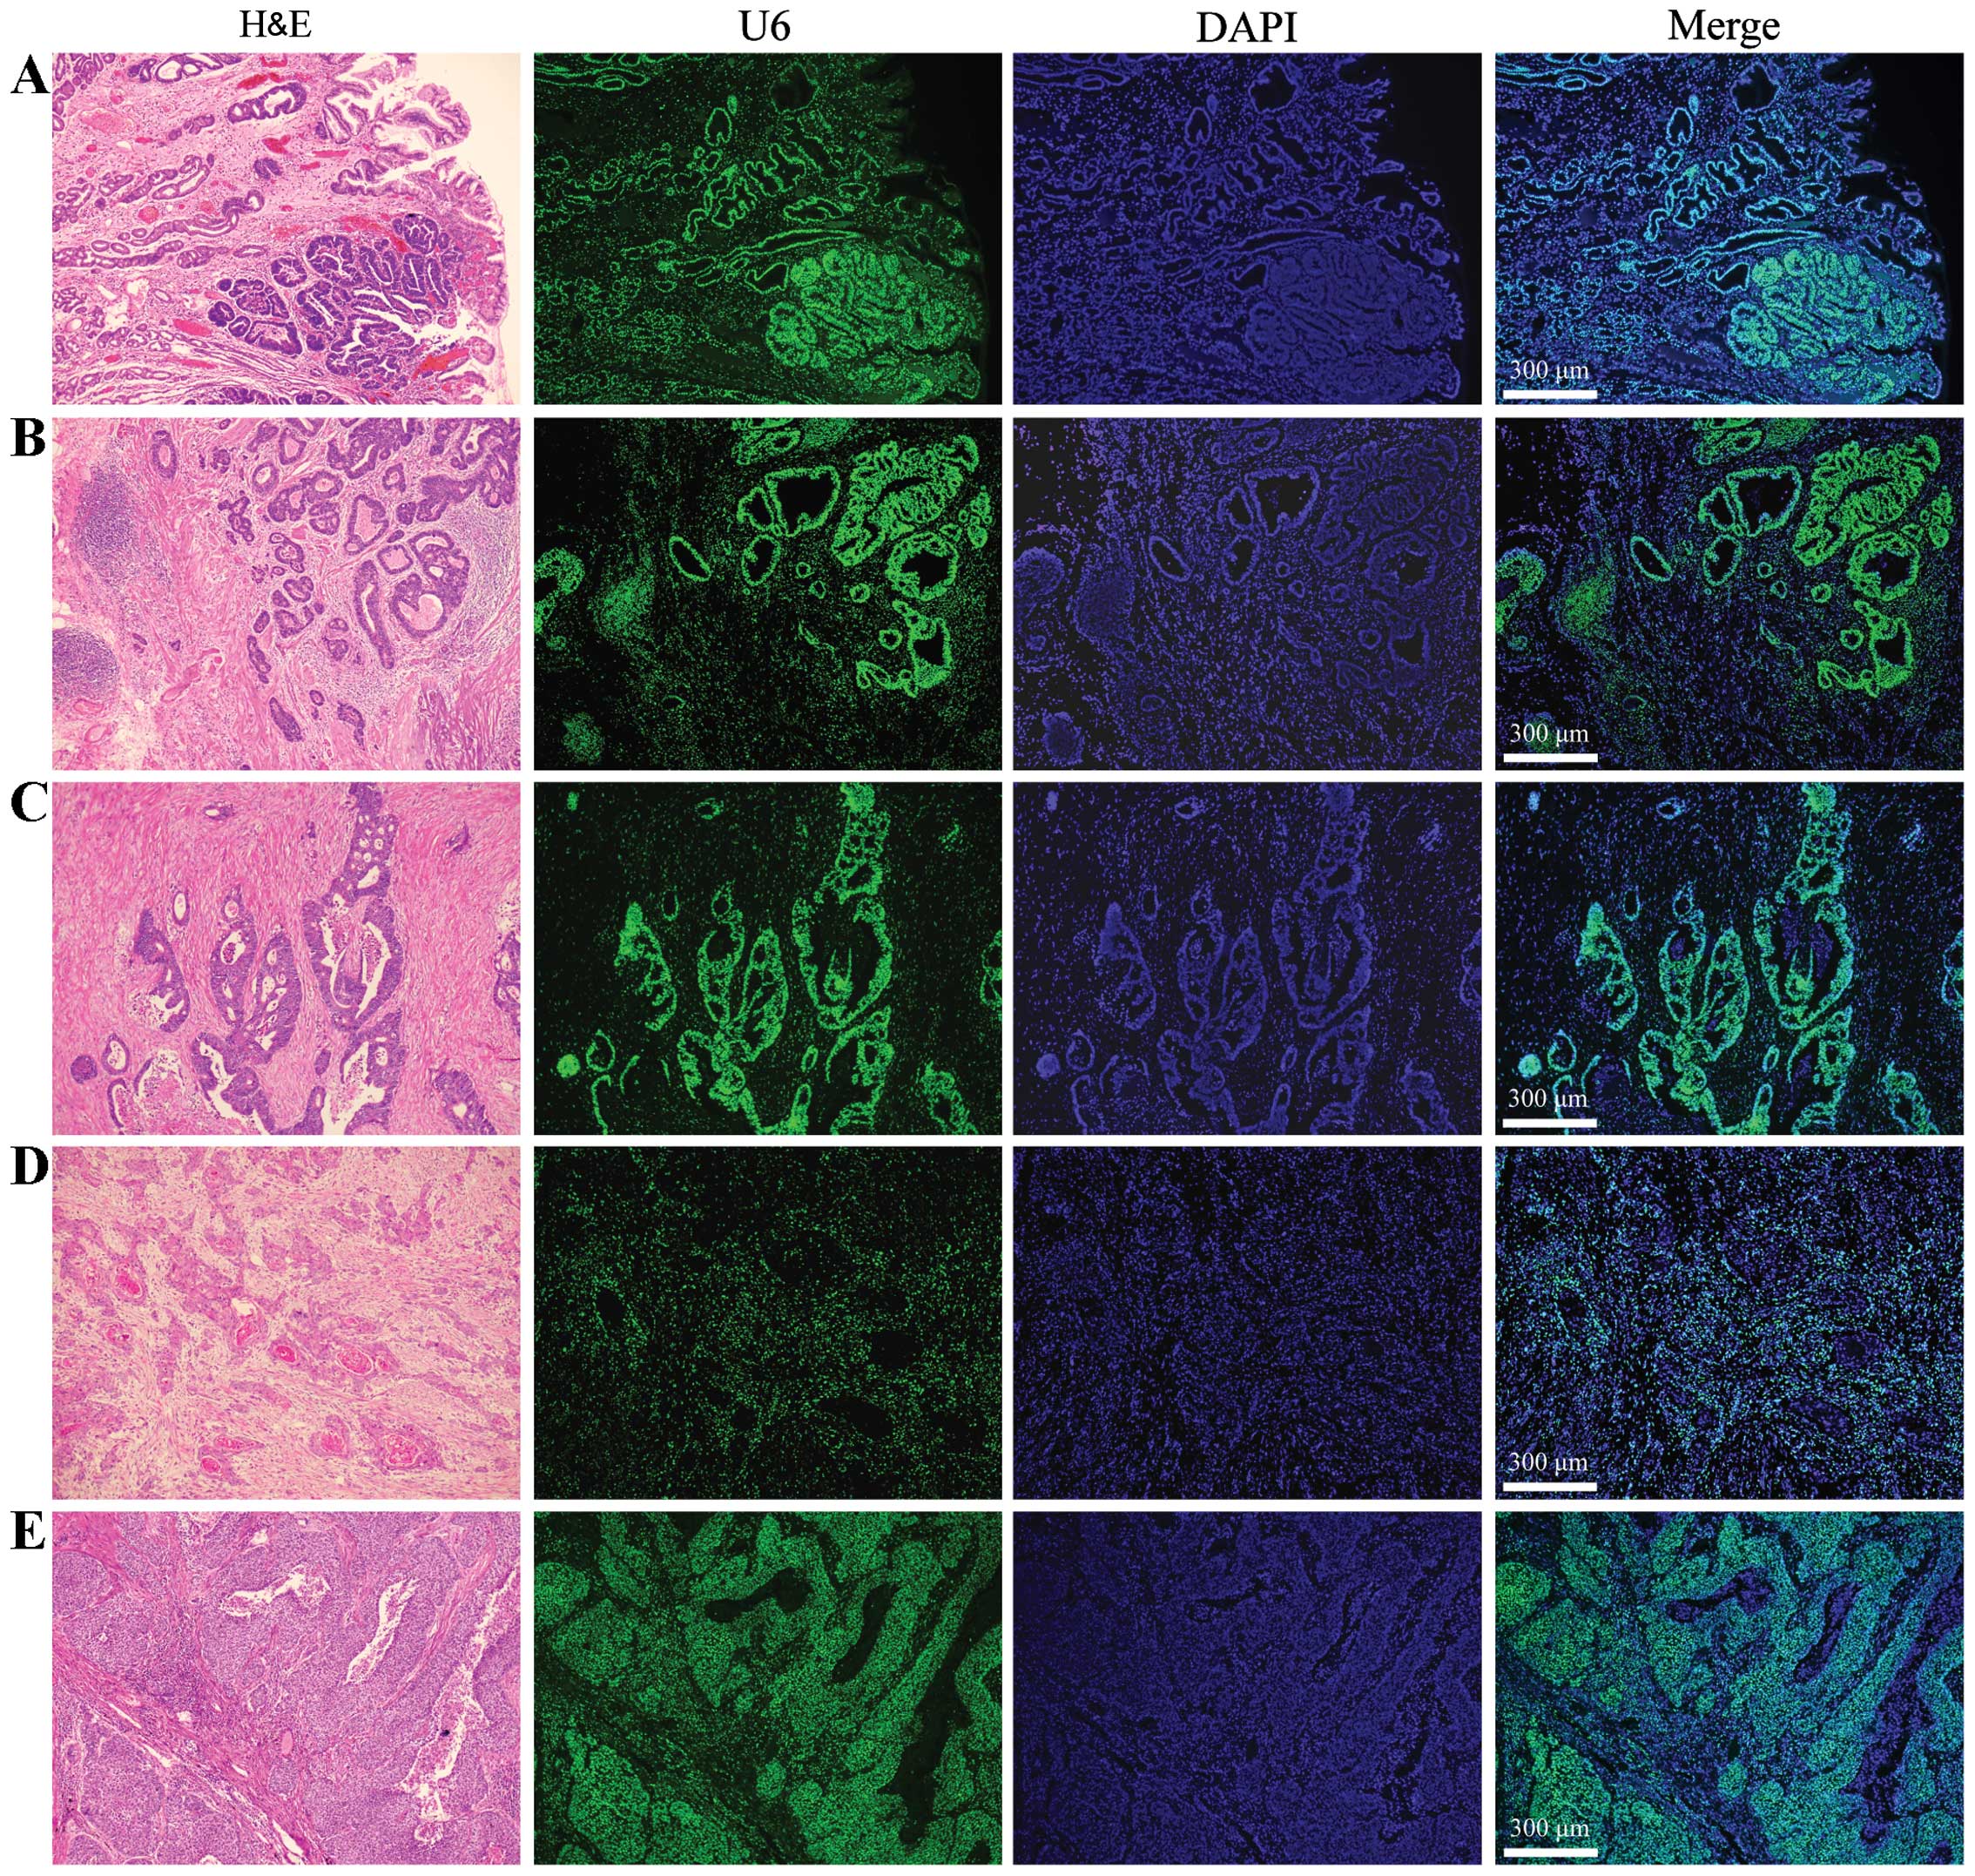
corresponding normal tissues. Observations from Fig. 2 are summarized as follows. First,
cancer is a type of malignant tumor characterized by the indefinite
proliferation of epithelial cells, the epithelial:mesenchymal cell
ratio in the cancerous tissues is much higher than that in the
corresponding normal tissues. Second, mature U6 is present
uniformly in the nucleus and in carcinoma tissues and corresponding
normal tissues. The fluorescence signals of the U6 probe (green) in
breast mesenchymal cells were distinctly less and weaker than in
those of the epithelial cells. Therefore, the expression level of
U6 in breast cancer epithelial cells was higher than that in the
mesenchymal cells. The MISH experiments further confirmed the
RT-qPCR results wherein U6 tissue levels in breast carcinoma were
significantly higher compared to in the corresponding normal
tissues.
 | Figure 2Detection of U6 expression in (B)
human breast cancer tissues and (A) corresponding normal breast
tissues by miRNA in situ hybridization. The breast tissue
consists of an epithelial parenchyma and mesenchymal elements,
which including varying quantities of fat, blood vessels,
lymphatics and nerves. The epithelial component consists of ducts
and acini, which together form the lobules that are the basic
structural units of the mammary gland. The number of lobules varies
in each female mammary gland. In the corresponding normal breast
tissues, the fluorescence signals of the U6 probe (green) in normal
mesenchymal cells were distinctly less and weaker than those
observed in the normal epithelial cells. Breast cancer arises in
the ductal and glandular structures of the breast. In human breast
cancer tissues, the fluorescence signals of the U6 probe (green) in
cancerous mesenchymal cells were clearly less and weaker than those
in the cancerous epithelial cells. Original magnification, ×42.
H&E, hematoxylin and eosin stain; DAPI,
4′,6-diamidino-2-phenylindole. |
Specificity of LNA-MISH for detecting U6
in other types of human cancer and corresponding normal
tissues
In breast carcinoma tissues and corresponding normal
tissues, the fluorescence signals of the U6 probe (green) in tumor
mesenchymal cells were distinctly less and weaker than those
observed in the epithelial cells. To confirm that the distribution
of U6 is universal in various tumors, its expression was
investigated in other types of carcinomas (gastric, colorectal,
esophageal squamous cell and lung squamous cell carcinoma) with
more or less of a mesenchymal element, and also revealed that the
expression levels of U6 in cancer epithelial cells were higher than
those in the mesenchymal cells (Fig.
3).
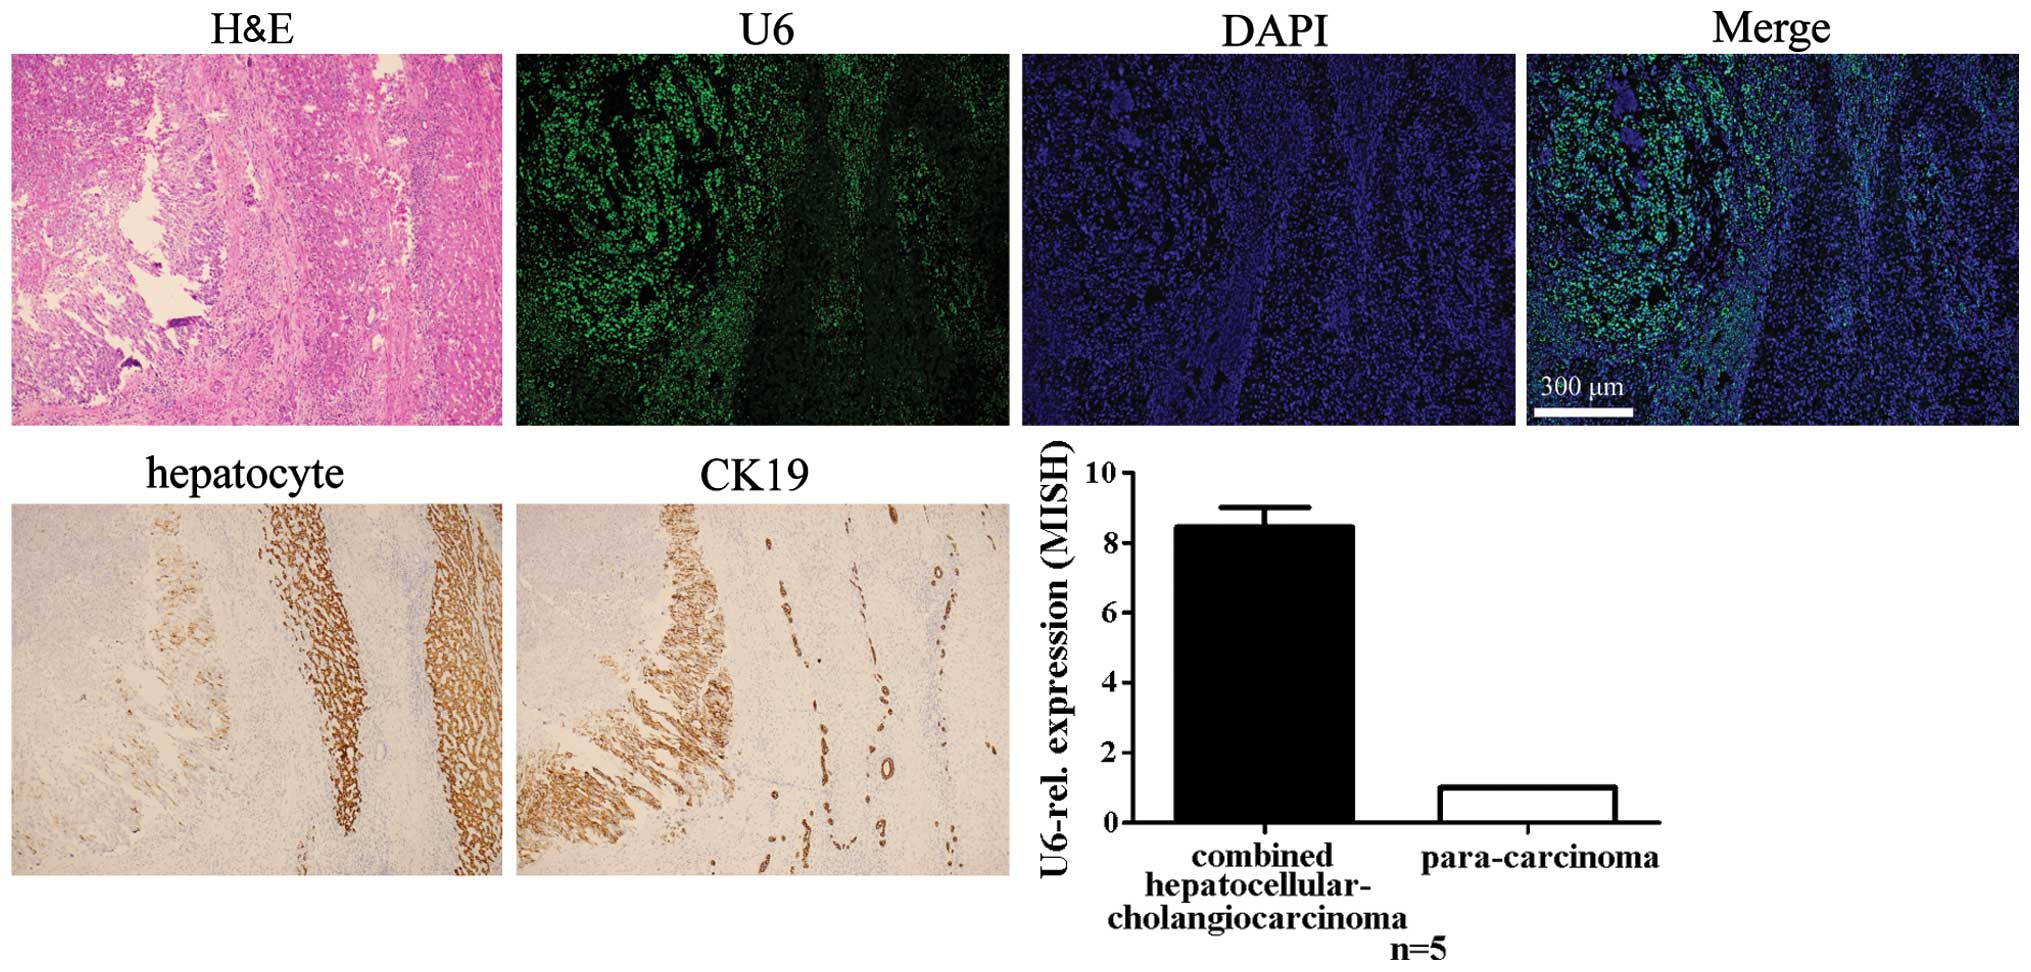
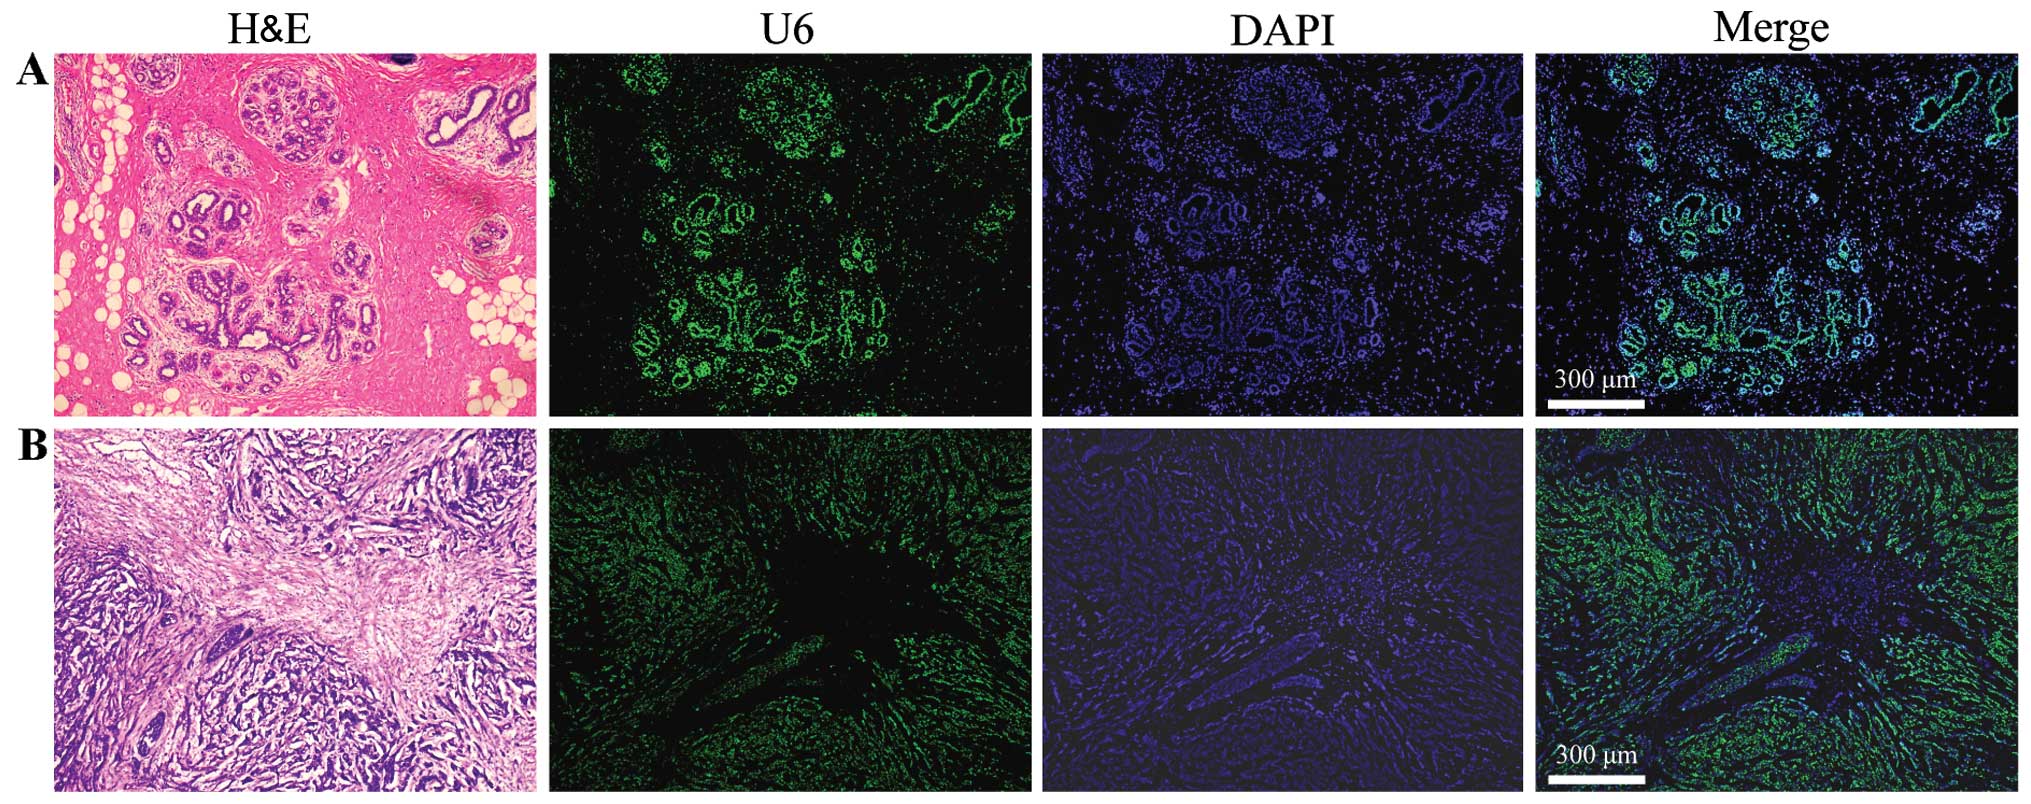
Specificity of LNA-MISH for detecting U6
in carcinoma tissues of the liver and intrahepatic bile ducts and
adjacent normal tissues
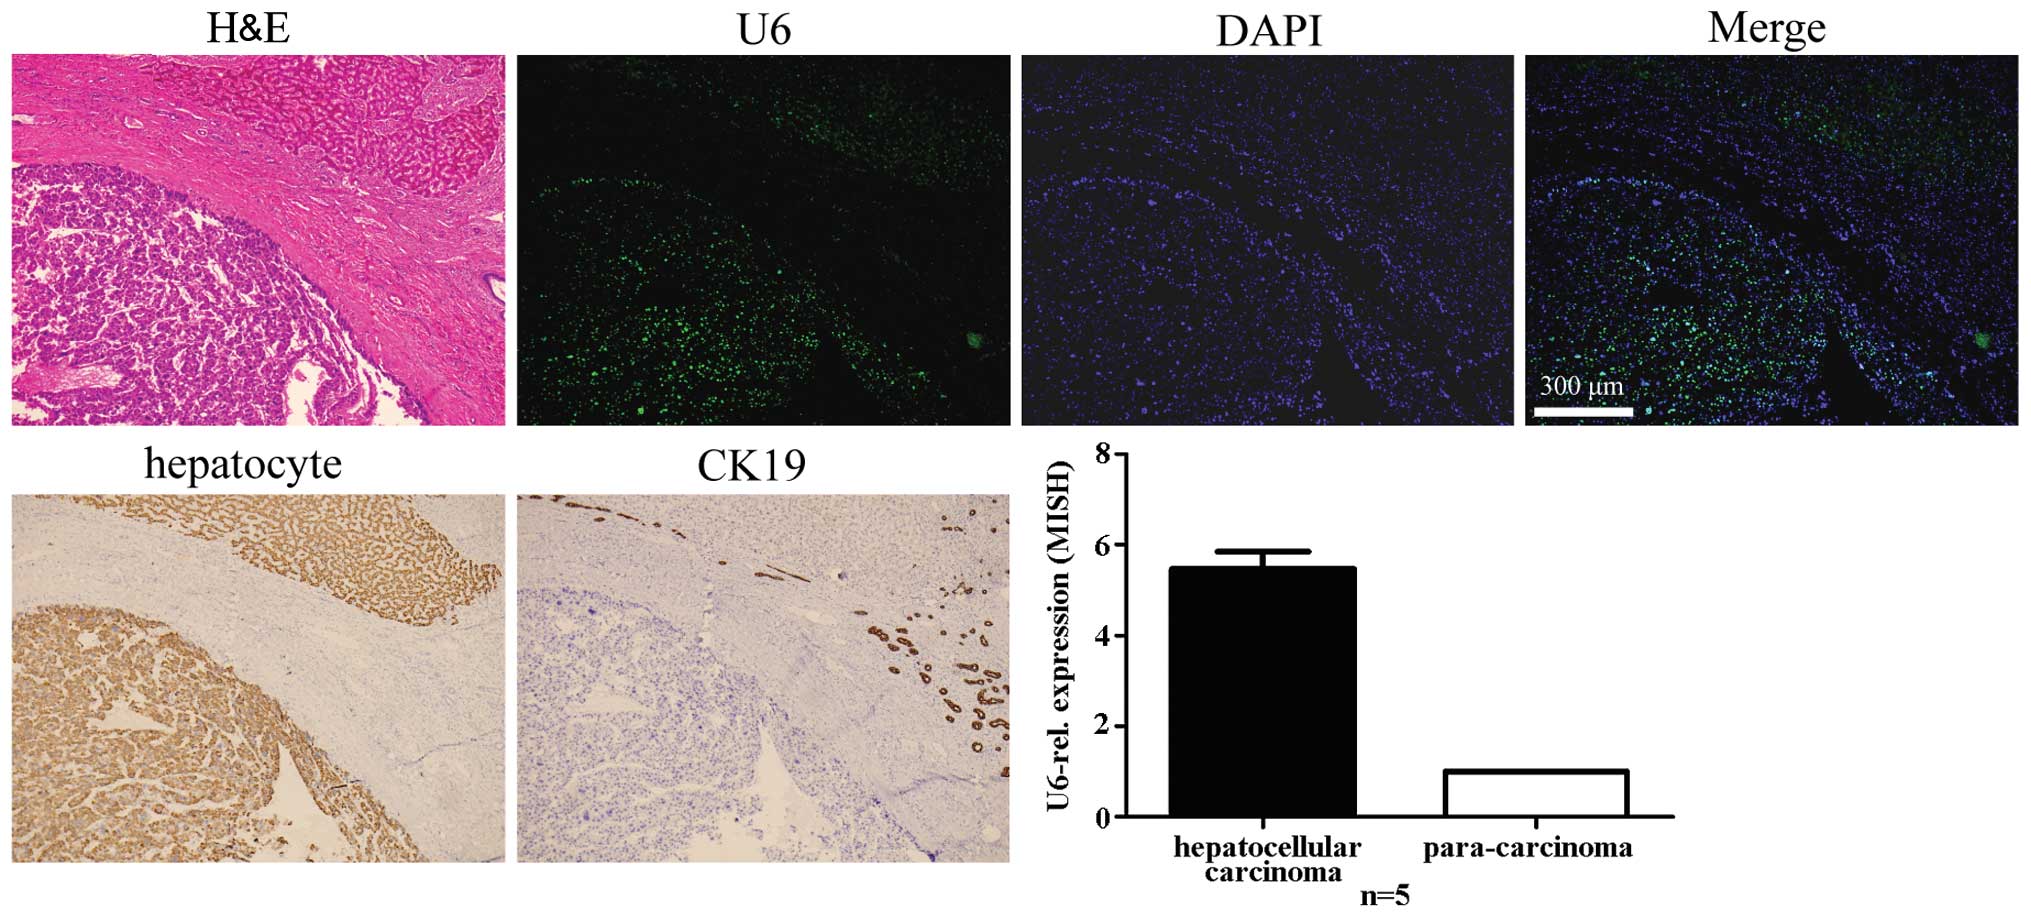
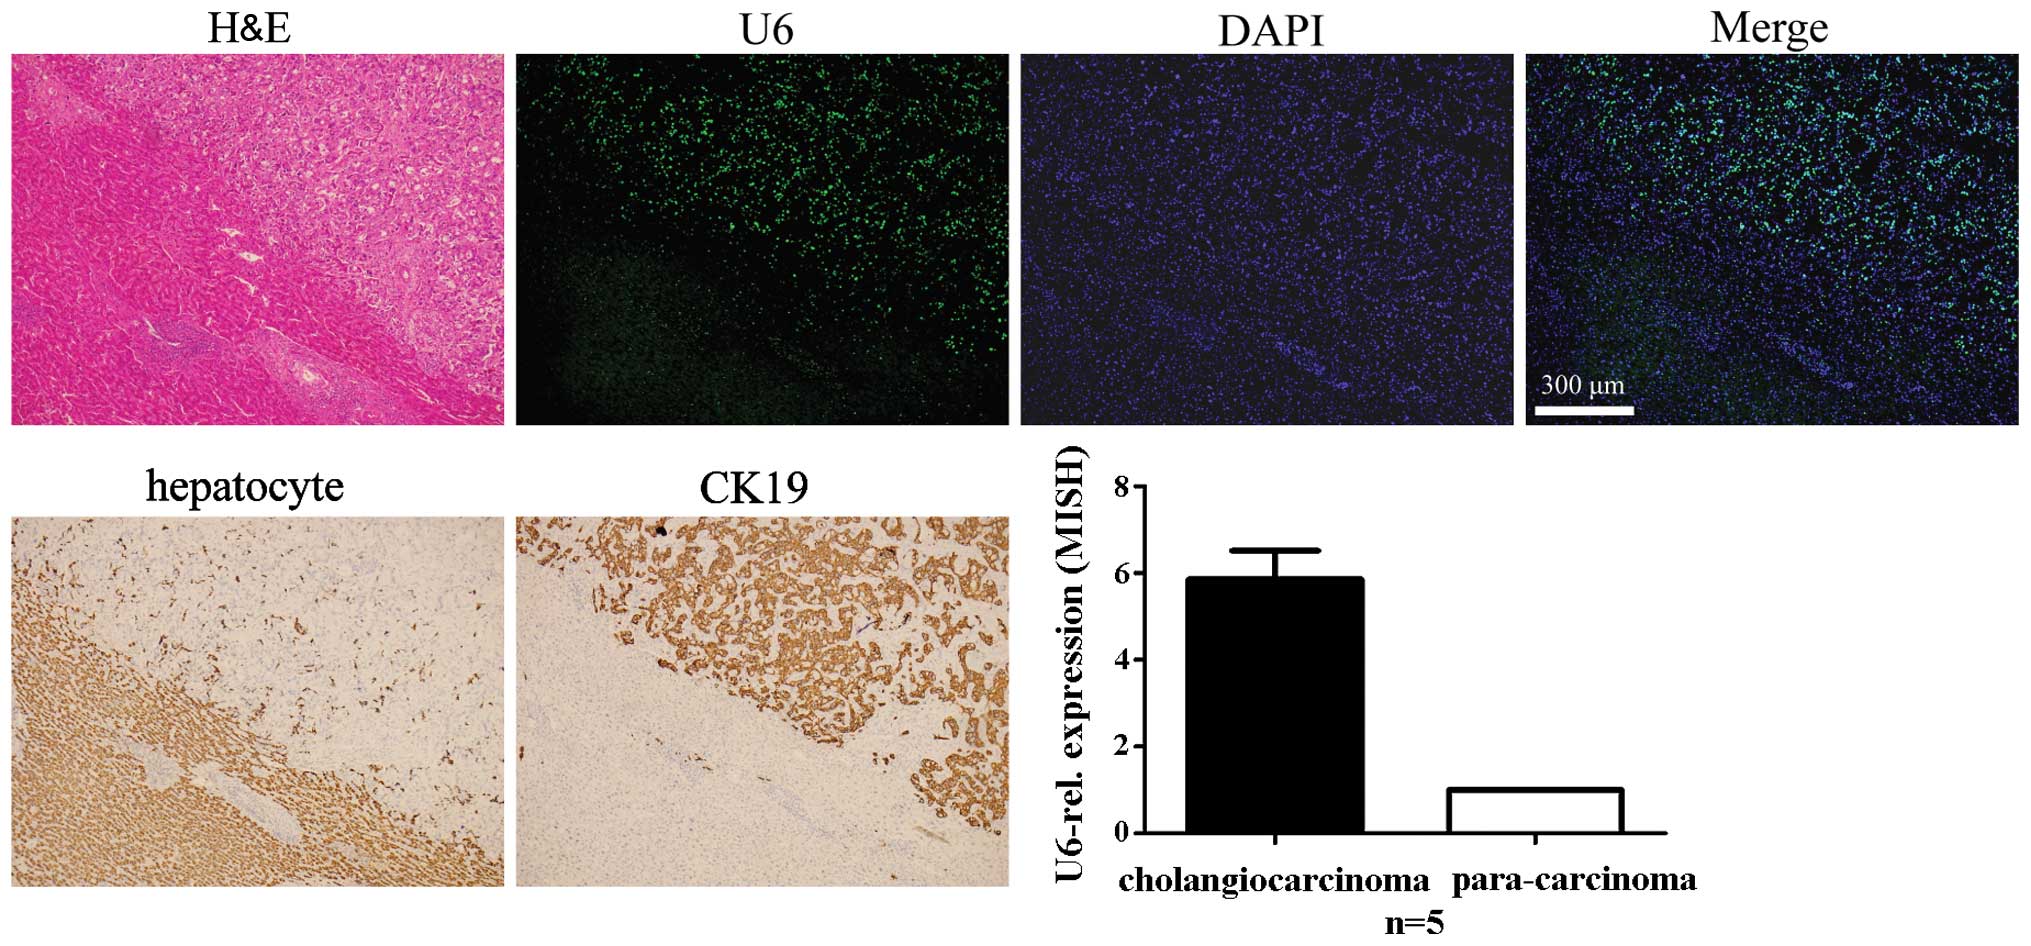
The presence of U6 in carcinoma tissues of the
liver, intrahepatic bile ducts and adjacent normal tissue is
noteworthy. Expression levels of U6 in hepatoma cells and
cholangiocarcinoma cells were higher compared to the adjacent
normal hepatocytes, no matter which type of cancer was selected
(Figs. 4Figure 5–6). To identify and demonstrate the
histological type of cancer, standard IHC was used to mark specific
cell types. Antibodies of hepatocyte and CK19 (a marker of
cholangiocytes) were used for the stain. The hepatocellular
carcinoma was negative for the CK19 antibody; however, it
demonstrated immunoreactivity to the hepatocyte antibody. The
intrahepatic cholangiocarcinoma was negative for the hepatocyte
antibody; however, it demonstrated immunoreactivity to the CK19
antibody. The combined hepatocellular-cholangiocarcinoma exhibited
immunoreactivity to the hepatocyte and CK19 antibodies.
Discussion
The present study was designed to elucidate the
critical issues associated with the use of U6 as an internal
control gene in tissue miRNA quantization. More specifically, the
study aimed to address why U6 is an unsuitable candidate for the
normalization of tissue miRNA levels in patients with carcinoma.
First, the expression levels of U6 were determined in human breast
carcinoma and corresponding normal tissues by RT-qPCR, and
identified that U6 levels in breast carcinoma were significantly
higher in comparison to those of corresponding normal tissues.
Secondly, the study aimed to clarify the RT-qPCR ambiguities using
miRNA in situ hybridization. All the neoplasms have a
parenchyma and a stroma. The parenchyma comprises a neoplastic
proliferation of cells. The stroma comprises the supporting
connective tissue and blood supply that allows the neoplasms to
grow. The stroma contains multiple cell types, including mixed
inflammatory cells, endothelial cells, fibroblasts, smooth muscle
cells and pericytes. The U6 in situ hybridization data shown
here demonstrate that the expression level of U6 in cancer
epithelial cells was higher than those in the mesenchymal cells in
breast carcinoma and in other types of human carcinomas. The
epithelial:mesenchymal cell ratio in the cancer tissues was much
higher than that in the corresponding normal tissues. Therefore, U6
levels in carcinoma were significantly higher than those in the
corresponding normal tissues.
In the aforementioned carcinoma tissues and adjacent
normal tissues, the expression levels of U6 in epithelial cells was
higher than those in the mesenchymal cells; however, there was no
significant difference in U6 fluorescence signals between normal
and cancerous epithelial cells. Notably, the expression pattern of
U6 in liver tissues is an exception. The expression level of U6 in
hepatoma and cholangiocarcinoma cells was higher than that in the
adjacent normal hepatocytes. Consequently, whether this abnormal
transcription of U6 is associated with mechanisms of
hepatocarcinogenesis and cholangiocarcinogenesis was
questioned.
Preferably, a reliable internal control gene should
exhibit invariant expression across all samples, regardless of
disease status or other clinical variables. However, expression of
U6 appears to vary for the following reasons: i) All tissues
contain multiple cell types, each with their own unique miRNA and
U6 expression patterns, and as noted in the study by Kent et
al (26), miRNAs are
expressed in cells and not expressed in tissues. Due to inherent
cellular heterogeneity, the expression of U6 exhibited significant
differences between epithelial cells and mesenchymal cells in human
tissues. ii) In the transformation process from a normal to a
carcinoma tissue, cellular composition (epithelial:mesenchymal cell
ratio) changes substantially. iii) For each type of carcinoma,
numerous subtypes are described, and the epithelial:mesenchymal
cell ratio can vary greatly within these.
Peltier and Latham (16) supported the assertion that U6 is
not suitable for use as an endogenous control for normalizing miRNA
relative quantitation data in human lung, breast tumor, liver,
urothelial carcinoma and canine lymphoma (17–20). Consequently, the use of U6 in this
capacity could potentially lead to data-misinterpretation and
erroneous conclusions. Therefore, we concluded that the root of the
problem is the maldistribution of U6 snRNA among tissues,
particularly the high expression observed in carcinoma tissues. The
high variance in expression of U6 is a factor to be considered for
quantification of miRNAs in all relevant studies.
U6 snRNA is one of 5 uridinerich non-coding RNAs
that forms the major spliceosome complex. As opposed to other
U-snRNAs, U6 snRNA is transcribed by RNAP-III, and its maturation
occurs exclusively in the nucleus. U6 snRNA has a central role in
splicing, and thus its transcription, maturation, snRNP formation
and recycling are essential for cellular homeostasis. The human U6
gene promoter and coding sequence contains a strong CpG island.
Conservation and transcriptional activities of this gene are
regulated by DNA methylation catalyzed by DNMT1 and DNMT3a
(27). The human U6 gene promoter
contains three regulatory elements: The distal enhancer-like
sequence element, the proximal sequence element and the TATA box.
Numerous proteins can bind to these regions to inhibit U6 gene
transcription, such as p38 (28),
BRCA1 (29), CK2 (30), RB (27) and Maf1 (31). Additionally, the majority of the
signaling pathways activated in cancer, including Ras, Raf, PI3K,
and AKT, enhance RNAP-III activity, while several tumor
suppressors, including retinoblastoma, PTEN, p53 and BRCA1,
decrease RNAP-III activity (32,33). The aforementioned factors may
correlate with the inconsistency of U6 expression between
epithelial and mesenchymal cells. Recent studies have identified a
new U6 snRNA biogenesis factor, Usb1. Usb1 is an evolutionarily
conserved exoribonuclease that is responsible for removing
3′-terminal uridines from U6 snRNA transcripts, which leads to the
formation of a 2′,3′-cyclic phosphate moiety. This maturation step
is fundamental for U6 snRNP assembly and recycling (34,35). Due to the high expression of U6 in
liver carcinomas, the association between Usb1 and liver carcinoma
requires further research, which may provide novel insights into
the processes of hepatocarcinogenesis and
cholangiocarcinogenesis.
Acknowledgments
The present study was supported by the National
Natural Science Foundation of China (grant no. 81270511); the
Heilongjiang Postdoctoral Foundation (grant no.
LBH-Z12172/LBH-TZ0415); the Research Fund for the Doctoral Program
of Higher Education (grant no. 20122307110002); Yu Weihan
Academician Fund for Distinguished Young Scholars of Harbin Medical
University (2014) and the Science and Technology Project of
Heilongjiang (grant no. 2013G1002). The authors would like to thank
Mr. Dayong Wang (Department of Biochemistry and Molecular Biology,
Harbin Medical University) and Mr. Kefei Wu (Department of
Pathology, The Second Hospital of Harbin Medical University) for
their excellent technical support and data analysis.
References
|
1
|
Jovanovic M and Hengartner MO: miRNAs and
apoptosis: RNAs to die for. Oncogene. 25:6176–6187. 2006.
View Article : Google Scholar : PubMed/NCBI
|
|
2
|
Listowski MA, Heger E, Bogusławska DM,
Machnicka B, Kuliczkowski K, Leluk J and Sikorski AF: microRNAs:
Fine tuning of erythropoiesis. Cell Mol Biol Lett. 18:34–46. 2013.
View Article : Google Scholar
|
|
3
|
Farazi TA, Hoell JI, Morozov P and Tuschl
T: MicroRNAs in human cancer. Adv Exp Med Biol. 774:1–20. 2013.
View Article : Google Scholar : PubMed/NCBI
|
|
4
|
Luzna P, Gregar J, Uberall I, Radova L,
Prochazka V and Ehrmann J Jr: Changes of microRNAs-192, 196a and
203 correlate with Barrett's esophagus diagnosis and its
progression compared to normal healthy individuals. Diagn Pathol.
6(114)2011. View Article : Google Scholar : PubMed/NCBI
|
|
5
|
Mao ZG, He DS, Zhou J, Yao B, Xiao WW,
Chen CH, Zhu YH and Wang HJ: Differential expression of microRNAs
in GH-secreting pituitary adenomas. Diagn Pathol. 5(79)2010.
View Article : Google Scholar : PubMed/NCBI
|
|
6
|
Nelson KM and Weiss GJ: MicroRNAs and
cancer: Past, present, and potential future. Mol Cancer Ther.
7:3655–3660. 2008. View Article : Google Scholar : PubMed/NCBI
|
|
7
|
Esquela-Kerscher A and Slack FJ: Oncomirs
- microRNAs with a role in cancer. Nat Rev Cancer. 6:259–269. 2006.
View Article : Google Scholar : PubMed/NCBI
|
|
8
|
Bartel DP and Chen CZ: Micromanagers of
gene expression: The potentially widespread influence of metazoan
microRNAs. Nat Rev Genet. 5:396–400. 2004. View Article : Google Scholar : PubMed/NCBI
|
|
9
|
Nana-Sinkam SP and Croce CM: MicroRNAs as
therapeutic targets in cancer. Transl Res. 157:216–225. 2011.
View Article : Google Scholar : PubMed/NCBI
|
|
10
|
Gattolliat CH, Thomas L, Ciafrè SA,
Meurice G, Le Teuff G, Job B, Richon C, Combaret V, Dessen P,
Valteau-Couanet D, et al: Expression of miR-487b and miR-410
encoded by 14q32.31 locus is a prognostic marker in neuroblastoma.
Br J Cancer. 105:1352–1361. 2011. View Article : Google Scholar : PubMed/NCBI
|
|
11
|
Yu G, Tang JQ, Tian ML, Li H, Wang X, Wu
T, Zhu J, Huang SJ and Wan YL: Prognostic values of the miR-17-92
cluster and its paralogs in colon cancer. J Surg Oncol.
106:232–237. 2012. View Article : Google Scholar
|
|
12
|
Yan LX, Huang XF, Shao Q, Huang MY, Deng
L, Wu QL, Zeng YX and Shao JY: MicroRNA miR-21 overexpression in
human breast cancer is associated with advanced clinical stage,
lymph node metastasis and patient poor prognosis. RNA.
14:2348–2360. 2008. View Article : Google Scholar : PubMed/NCBI
|
|
13
|
Wang Z, Liao H, Deng Z, Yang P, Du N,
Zhanng Y and Ren H: miRNA-205 affects infiltration and metastasis
of breast cancer. Biochem Biophys Res Commun. 441:139–143. 2013.
View Article : Google Scholar : PubMed/NCBI
|
|
14
|
Wang S, Li H, Wang J and Wang D:
Expression of microRNA-497 and its prognostic significance in human
breast cancer. Diagn Pathol. 8(172)2013. View Article : Google Scholar
|
|
15
|
Ouyang M, Li Y, Ye S, Ma J, Lu L, Lv W,
Chang G, Li X, Li Q, Wang S, et al: MicroRNA profiling implies new
markers of chemoresistance of triple-negative breast cancer. PLoS
One. 9:e962282014. View Article : Google Scholar : PubMed/NCBI
|
|
16
|
Peltier HJ and Latham GJ: Normalization of
microRNA expression levels in quantitative RT-PCR assays:
Identification of suitable reference RNA targets in normal and
cancerous human solid tissues. RNA. 14:844–852. 2008. View Article : Google Scholar : PubMed/NCBI
|
|
17
|
Davoren PA, McNeill RE, Lowery AJ, Kerin
MJ and Miller N: Identification of suitable endogenous control
genes for microRNA gene expression analysis in human breast cancer.
BMC Mol Biol. 9:76–87. 2008. View Article : Google Scholar : PubMed/NCBI
|
|
18
|
Lamba V, Ghodke-Puranik Y, Guan W and
Lamba JK: Identification of suitable reference genes for hepatic
microRNA quantitation. BMC Res Notes. 7:1292014. View Article : Google Scholar : PubMed/NCBI
|
|
19
|
Ratert N, Meyer HA, Jung M, Mollenkopf HJ,
Wagner I, Miller K, Kilic E, Erbersdobler A, Weikert S and Jung K:
Reference miRNAs for miRNAome analysis of urothelial carcinomas.
PLoS One. 7:e393092012. View Article : Google Scholar : PubMed/NCBI
|
|
20
|
Mortarino M, Gioia G, Gelain ME, Albonico
F, Roccabianca P, Ferri E and Comazzi S: Identification of suitable
endogenous controls and differentially expressed microRNAs in
canine fresh-frozen and FFPE lymphoma samples. Leuk Res.
34:1070–1077. 2010. View Article : Google Scholar
|
|
21
|
Li D, Liu H, Li Y, Yang M, Qu C, Zhang Y,
Liu Y and Zhang X: Identification of suitable endogenous control
genes for quantitative RT-PCR analysis of miRNA in bovine solid
tissues. Mol Biol Rep. 41:6475–6480. 2014. View Article : Google Scholar : PubMed/NCBI
|
|
22
|
Chang KH, Mestdagh P, Vandesompele J,
Kerin MJ and Miller N: MicroRNA expression profiling to identify
and validate reference genes for relative quantification in
colorectal cancer. BMC Cancer. 10(173)2010. View Article : Google Scholar
|
|
23
|
Genovesi LA, Anderson D, Carter KW, Giles
KM and Dallas PB: Identification of suitable endogenous control
genes for microRNA expression profiling of childhood
medulloblastoma and human neural stem cells. BMC Res Notes.
5(507)2012. View Article : Google Scholar : PubMed/NCBI
|
|
24
|
McDermott AM, Kerin MJ and Miller N:
Identification and validation of miRNAs as endogenous controls for
RQ-PCR in blood specimens for breast cancer studies. PLoS One.
8:e837182013. View Article : Google Scholar
|
|
25
|
Mattie MD, Benz CC, Bowers J, Sensinger K,
Wong L, Scott GK, Fedele V, Ginzinger D, Getts R and Haqq C:
Optimized high-throughput microRNA expression profiling provides
novel biomarker assessment of clinical prostate and breast cancer
biopsies. Mol Cancer. 5(24)2006. View Article : Google Scholar : PubMed/NCBI
|
|
26
|
Kent OA, McCall MN, Cornish TC and
Halushka MK: Lessons from miR-143/145: The importance of cell-type
localization of miRNAs. Nucleic Acids Res. 42:7528–7538. 2014.
View Article : Google Scholar : PubMed/NCBI
|
|
27
|
Selvakumar T, Gjidoda A, Hovde SL and
Henry RW: Regulation of human RNA polymerase III transcription by
DNMT1 and DNMT3a DNA methyltransferases. J Biol Chem.
287:7039–7050. 2012. View Article : Google Scholar : PubMed/NCBI
|
|
28
|
Lin BR and Natarajan V: Negative
regulation of human U6 snRNA promoter by p38 kinase through Oct-1.
Gene. 497:200–207. 2012. View Article : Google Scholar : PubMed/NCBI
|
|
29
|
Veras I, Rosen EM and Schramm L:
Inhibition of RNA polymerase III transcription by BRCA1. J Mol
Biol. 387:523–531. 2009. View Article : Google Scholar : PubMed/NCBI
|
|
30
|
Hu P, Samudre K, Wu S, Sun Y and Hernandez
N: CK2 phosphorylation of Bdp1 executes cell cycle-specific RNA
polymerase III transcription repression. Mol Cell. 16:81–92. 2004.
View Article : Google Scholar : PubMed/NCBI
|
|
31
|
Rollins J, Veras I, Cabarcas S, Willis I
and Schramm L: Human Maf1 negatively regulates RNA polymerase III
transcription via the TFIIB family members Brf1 and Brf2. Int J
Biol Sci. 3:292–302. 2007. View Article : Google Scholar : PubMed/NCBI
|
|
32
|
Marshall L and White RJ: Non-coding RNA
production by RNA polymerase III is implicated in cancer. Nat Rev
Cancer. 8:911–914. 2008. View
Article : Google Scholar : PubMed/NCBI
|
|
33
|
Cabarcas S, Watabe K and Schramm L:
Inhibition of U6 snRNA transcription by PTEN. Online J Biol Sci.
10:114–125. 2010. View Article : Google Scholar
|
|
34
|
Hilcenko C, Simpson PJ, Finch AJ, Bowler
FR, Churcher MJ, Jin L, Packman LC, Shlien A, Campbell P, Kirwan M,
et al: Aberrant 3′ oligoadenylation of spliceosomal U6 small
nuclear RNA in poikiloderma with neutropenia. Blood. 121:1028–1038.
2013. View Article : Google Scholar
|
|
35
|
Mroczek S and Dziembowski A: U6 RNA
biogenesis and disease association. Wiley Interdiscip Rev RNA.
4:581–592. 2013. View Article : Google Scholar : PubMed/NCBI
|