Introduction
Polycystic ovary syndrome (PCOS) is a complex
endocrine disorder caused by hormone imbalance and often presents
reproductive, metabolic and psychological syndromes (1). The reproductive syndromes mainly
include ovulatory dysfunction, hyperandrogenism and polycystic
ovaries, and the metabolic syndromes primarily include insulin
resistance, obesity and dyslipidemia (2,3).
The prevalence of PCOS is ~18% in women of productive age based on
Rotterdam diagnostic criteria (4). To date, there is no cure for PCOS,
and treatment and interventions tailored to clinical features are
recommended. The etiology of PCOS is complex and remains largely
unknown. Genetic and environmental factors are two primary
contributors to the disorder (5).
Exploration of the molecular mechanisms of PCOS will promote the
understanding of its pathogenesis and has important implications
for designing novel therapy.
Molecular mechanisms of PCOS have been increasingly
investigated. It was recently found that hypoxia-inducible factor
(HIF)-1α-mediated endothelin (ET)-2 signaling was suppressed in a
PCOS mouse model and closely associated with the development of
PCOS (6). Moreover, microarray
and bioinformatic analysis have been utilized to unravel the
molecular mechanisms of PCOS and yielded considerable results. For
example, dysregulated circulating miRNAs have been predicted to be
associated with several signaling pathways, such as immune,
angiogenesis and p53 signaling in PCOS (7). In addition, there is evidence that
Notch signaling and mitogen activated protein kinase (MAPK)
pathways may be involved in the progression of PCOS (8). Furthermore, it has been suggested
that the dysregulated genes between PCOS patients with and without
insulin resistance may play roles in PCOS-related metabolic
abnormalities and follicular growth arrest (9). Liu et al applied a
sub-pathway method to identify candidate agents for PCOS treatment
(10), and studied the
transcription factor-microRNA synergistic regulatory network in
PCOS (11) based on the
transcript profile GSE34526. Additionally, this dataset was used by
Bohler et al to collaborate the WikiPathways and Reactome as
a new analysis tool of different omics datasets (12). Despite of these achievements, the
molecular mechanisms of PCOS remain unclear.
It has been demonstrated that network-based data
could offer an integrated view of the genes or proteins in the
network and facilitate a better understanding of the molecular
mechanisms linked to phenotypes of interest (13). Thus, the present study not only
identified differentially expressed genes (DEGs), and DEG-related
pathways in PCOS, but also constructed a Reactome function
interaction (FI) network based on the interactions between DEGs.
Moreover, pathway enrichment analysis was performed for the network
modules extracted from the FI network. Furthermore, quantitative
RT-PCR was used to detect expression of DEGs which may be important
candidate genes in PCOS. The study may shed new light on the
molecular mechanisms of PCOS.
Materials and methods
Preprocessing of microarray data
It was a secondary study of the microarray dataset
GSE34526 (9) which was obtained
from the Gene Expression Omnibus (GEO) database (14) (http://www.ncbi.nlm.nih.gov/geo/), and based on the
Affymetrix Human Genome U133 Plus 2.0 Array platform (15). The microarray dataset consisted of
7 granulosa cell samples from 7 women with PCOS undergoing in
vitro fertilization and 3 control granulosa cell samples from 3
normal women undergoing in vitro fertilization. For data
preprocessing, the probe-level data in CEL files were converted
into expression measures by using the affy package in R language
(16), and then was subjected to
background correction and quartile data normalization by using
robust multiarray average (RMA) algorithm. Each probe was mapped to
its corresponding gene using Biconductor annotation function
(17) of R language. The probes
corresponding to no gene or more than one gene were deleted. When
there were several probes for one gene, the averaged expression
value of these probes was used as the expression value of the gene.
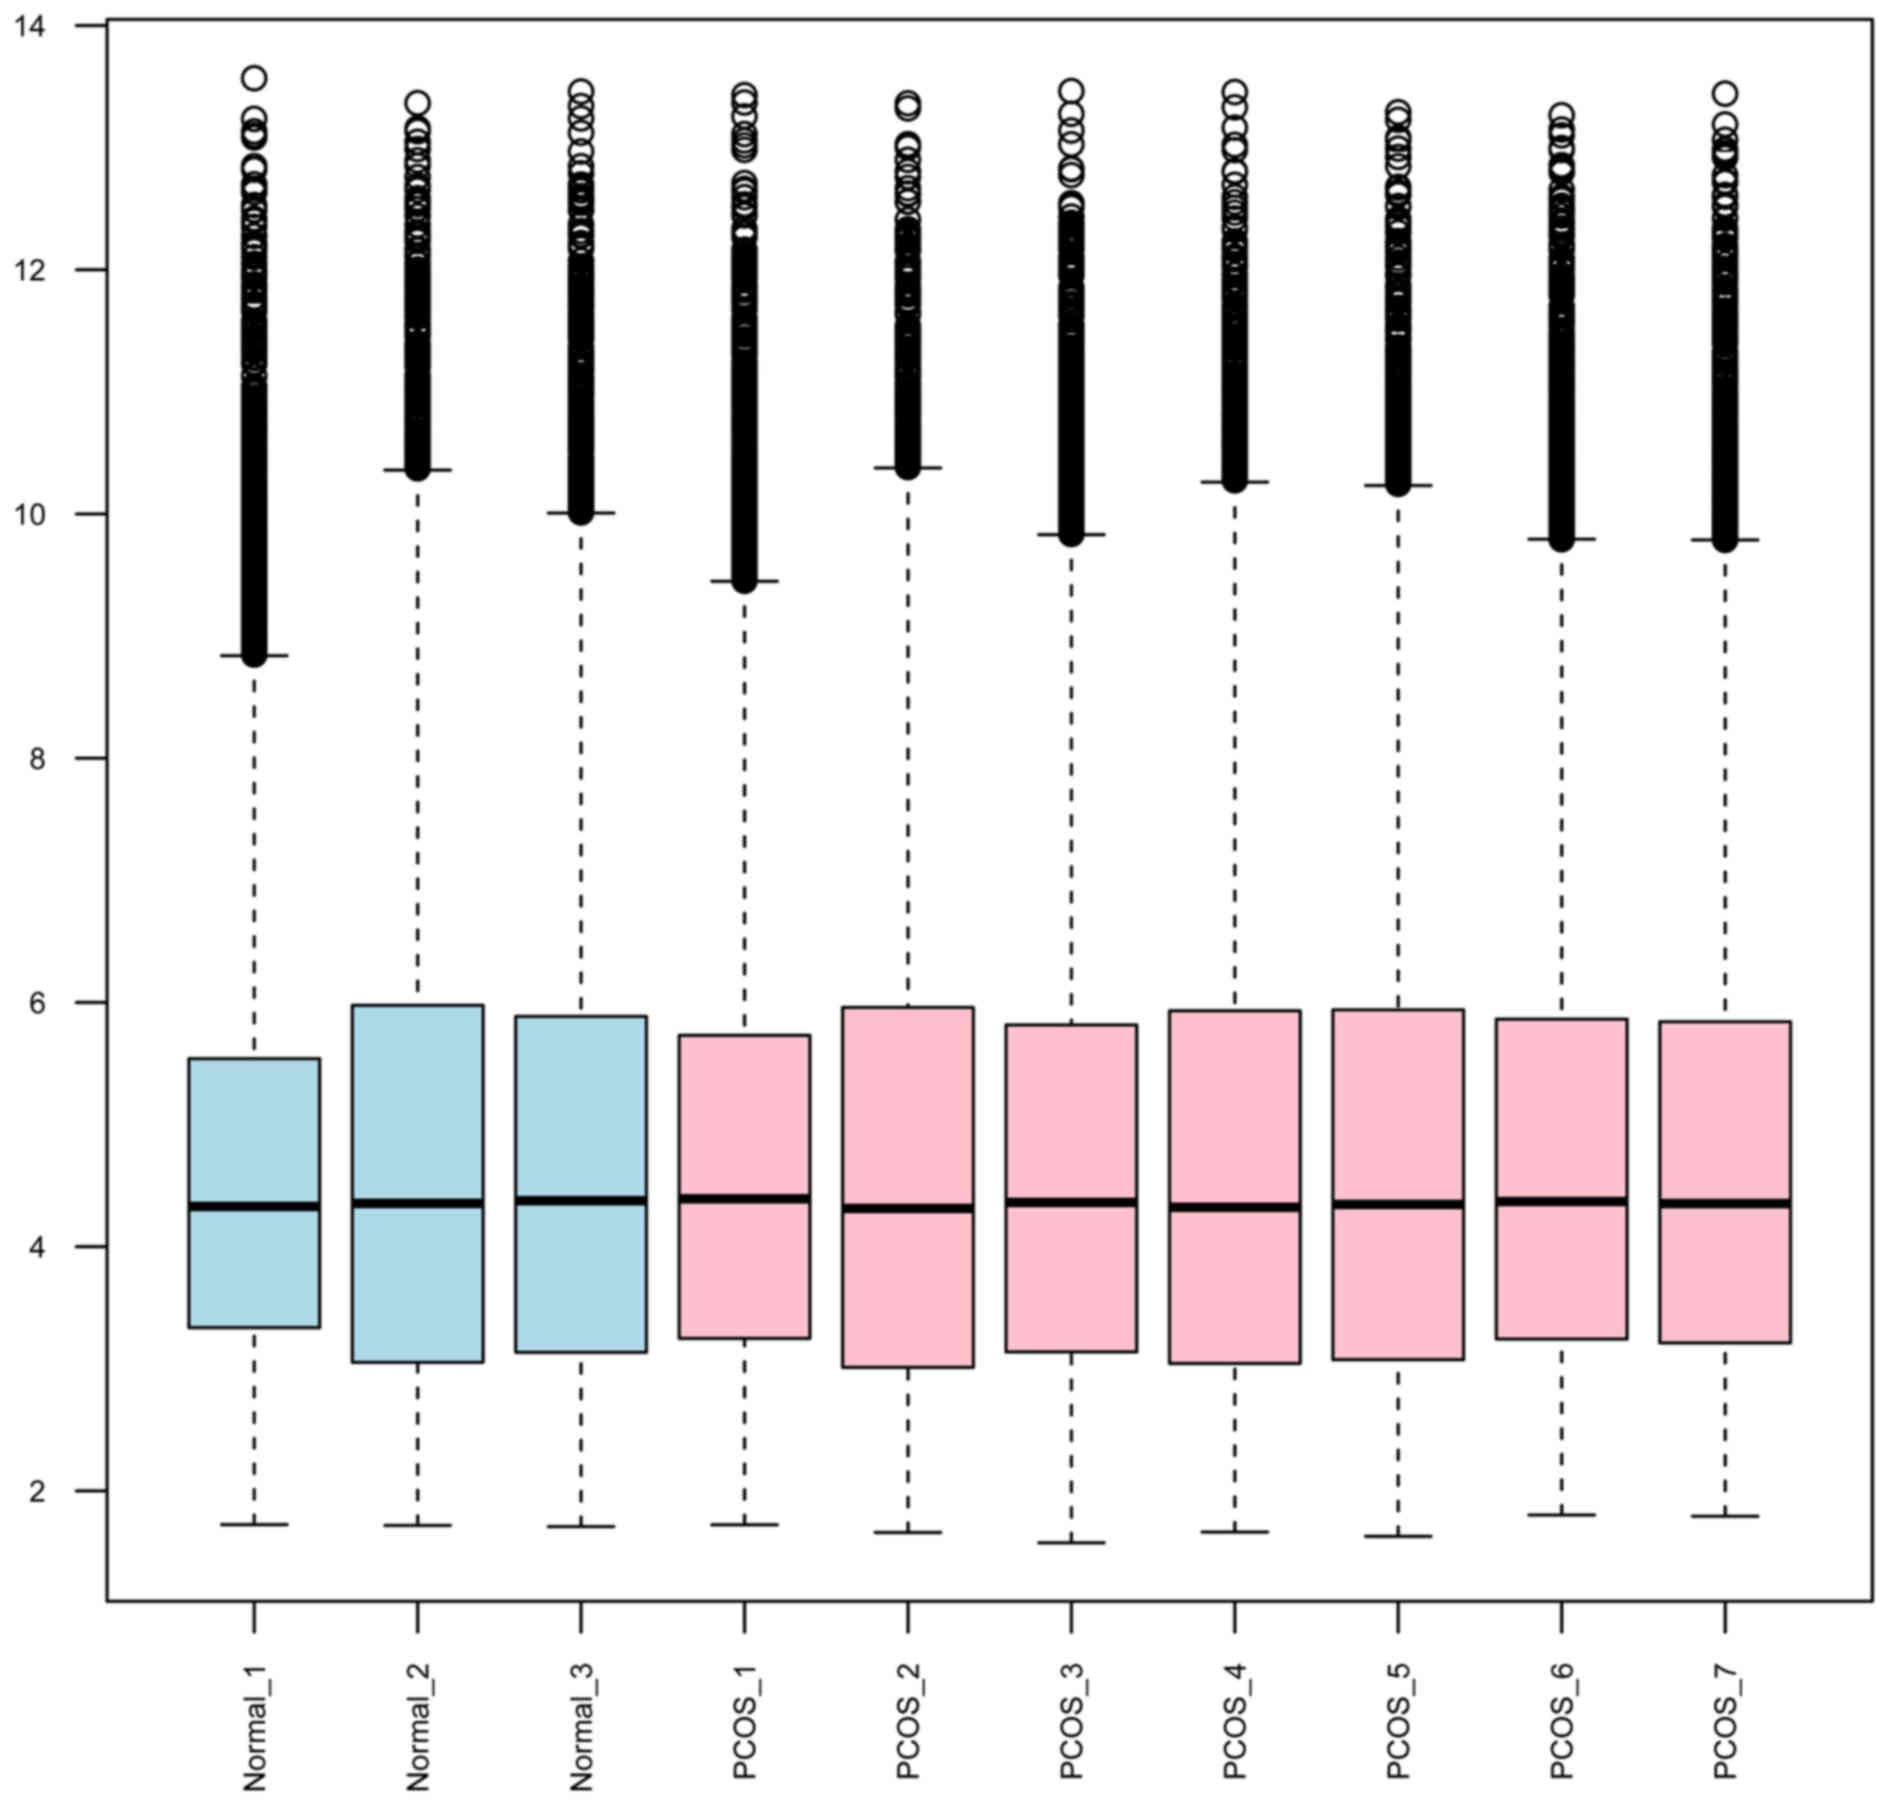
The standardized expression value is shown in a box figure
(Fig. 1). It was depicted that
the median gene expression value of normal samples is as high as
that of PCOS samples, suggesting a marked degree of standardization
of the data after preprocessing.
Determination and hierarchical clustering
analysis of DEGs
Linear Models for Microarray Analysis package in R
language (18) was employed to
screen DEGs between PCOS samples and control normal samples. The
strict thresholds were set at fold-change (|log2FC|) ≥1
and P-value <0.05. The screened DEGs underwent two-way
hierarchical clustering analysis by using the pheatmap package
(19) in R language (http://cran.fhcrc.org/web/packages/pheatmap/index.html).
Pathway enrichment analysis
In order to unveil the pathways that may be
associated with the identified DEGs, Kyoto Encyclopedia of Genes
and Genomes (KEGG) pathway enrichment analysis was performed using
ClueGO plug-in and CluePedia plugin of Cytoscape software. ClueGO
plug-in (http://www.ici.upmc.fr/cluego/cluegoDownload.shtml)
can extrapolate the biological function of large gene lists by
identifying significant gene ontology (GO) terms and KEGG pathways,
and functionally categorize the GO terms and KEGG pathways
(20). The CluePedia plugin
(http://www.ici.upmc.fr/cluepedia/) is
used to search for pathway-associated markers and can offer an
extensive view of a pathway by studying experimental information
and in silico data (21).
In this study, a right-side hypergeometric test was used for
calculation of the P-value, followed by the multiple test
correction [Benjamini-Hochberg adjustment (22)]. A pathway with adjusted P-value
<0.05 was considered significant.
Based on the Kappa score threshold (≥0.4), these
significant pathways were functionally divided into several groups
and exhibited in a network, in which a node represented a KEGG
pathway, and an edge between two nodes indicated that the two
pathways shared common genes. Significant KEGG pathways enriched
with the DEGs in the present study were visualized using
R/Bioconductor package path-view which is a useful tool to map user
data onto relevant pathways and offers graphs of the pathways
mapped by the user data (23).
Construction of a Reactome FI network and
analysis of the network modules
It has been shown that complicated disease
phenotypes are better related to changes in networks, instead of a
single gene or gene product (24). Therefore, a Reactome FI network
was constructed with the DEGs by using ReactomeFIViz. ReactomeFIViz
(http://wiki.reactome.org.sci-hub.org/index.php/Reactome_FI_Cytoscape_Plugin)
is a Cytoscape app which can construct a Reactome FI network for
pathway and network-based analysis of high throughout experimental
data, and extract pathway and network patterns associated with
diseases (13). In the network,
nodes represent genes. An edge between two nodes stands for the
interaction between two genes in the network. The edge weight
corresponds to the Pearson's correlation coefficient between the
two genes.
Network clustering analysis was then performed for
the Reactome FI network by using Markov clustering algorithm
(25), and highly connected
network modules (min module size ≥7; average correlation ≥0.25)
were extracted from the network. The hub gene in a module referred
to the gene that had the most interactions. In order to identify
association of the network modules with sample phenotype, the
Pearson' correlation coefficient of the genes in each module to the
sample phenotype (normal and PCOS samples) was calculated. The mean
Pearson's correlation coefficient of all genes included in each
module was regarded as the module significance. Moreover, pathway
enrichment analysis was also performed for genes in each module
using the reactomeFIVZ (P<0.05) based on the following publicly
available databases: Reactome (R) database (26), KEGG (K), National Cancer Institute
Pathway Interaction Database (NCI-PID) (N) (27), BioCarta in NCI-PID (B), and
PantherDB (P). (28)
Quantitative RT-PCR
Expression of identified DEGs in granulosa cell
samples was tested using quantitative RT-PCR. A total of 12
follicular fluid samples were collected for the experiment,
including 5 samples from 5 normal women and 7 samples from 7
patients with PCOS, who were undergoing in vitro
fertilization. Demographic and clinical characteristics of each
subject were collected from medical records, including age,
follicle-stimulating hormone (FSH), luteinizing hormone (LH),
prolactin (PRL), estradiol (E2), thyroid (T), fasting blood glucose
(FBG), fasting plasma insulin (FINS), homeostasis model assessment
of insulin resistance (HOMA-IR) levels, height, body weight, body
mass index (BMI), and number of antral follicles (left and
right).
The experiment was approved by the Ethics Committee
of Obstetrics and Gynecology Hospital of Fudan University and
informed consent was obtained before the use of the samples.
Granulosa cells were extracted from the follicular fluid using
TRIzol reagent (Invitrogen, Carlsbad, CA, USA). cDNA was
synthetized as recommended by the manufacturer using a reverse
transcription kit (Takara, Tokyo, Japan). Thermal cycle profiles
used in this study were: denaturing for 10 min at 95°C, annealing
for 15 sec at 95°C, and extension for 10 sec at 72°C. PCR was
carried out for 30 cycles. Glyceraldehyde-3-phosphate dehydrogenase
(GAPDH) was used as an internal reference. The set of primers used
in the study is shown in Table
I.
 | Table IPrimers used for the RT-PCR
experiment in the study. |
Table I
Primers used for the RT-PCR
experiment in the study.
| Gene | Primer
sequences |
|---|
| MYH9 | F:
GCCAAGACCGTGAAGAAT |
| R:
CCAGACAGGAGATAATAGAAGA |
| LYN | F:
TGAAGCCAGGAACTATGTC |
| R:
TGTACTCGGTGATGATGTAA |
| ARHGAP4 | F:
GGATGAGGTGGCTGAGAT |
| R:
GCTGGTCTGGAAGGAATC |
| ARHGAP9 | F:
GGACGCTGCTTCTACATAA |
| R:
GACATCATTGTTCCTCTTCAG |
| ACTB | F:
TCATGAAGTGTGACGTGGACATC |
| R:
CAGGAGGAGCAATGATCTTGATCT |
| RHOG | F:
CTGCTCATCTGCTACACAA |
| R:
CCACAGGTTCAGGTTCAC |
| GAPDH | F:
TGACAACTTTGGTATCGTGGAAGG |
| R:
AGGCAGGGATGATGTTCTGGAGAG |
Statistical analysis
SPSS version 19.0 (IBM Corp., Armonk, NY, USA) was
used for data analysis. Continuous variables between two groups
were compared using Student's t-test. ANOVA was used to analyze the
differences between 3 groups, followed by pairwise comparison using
least significant difference test. Differences with P-value
<0.05 were considered significant.
Results
Identification and hierarchical
clustering analysis of DEGs
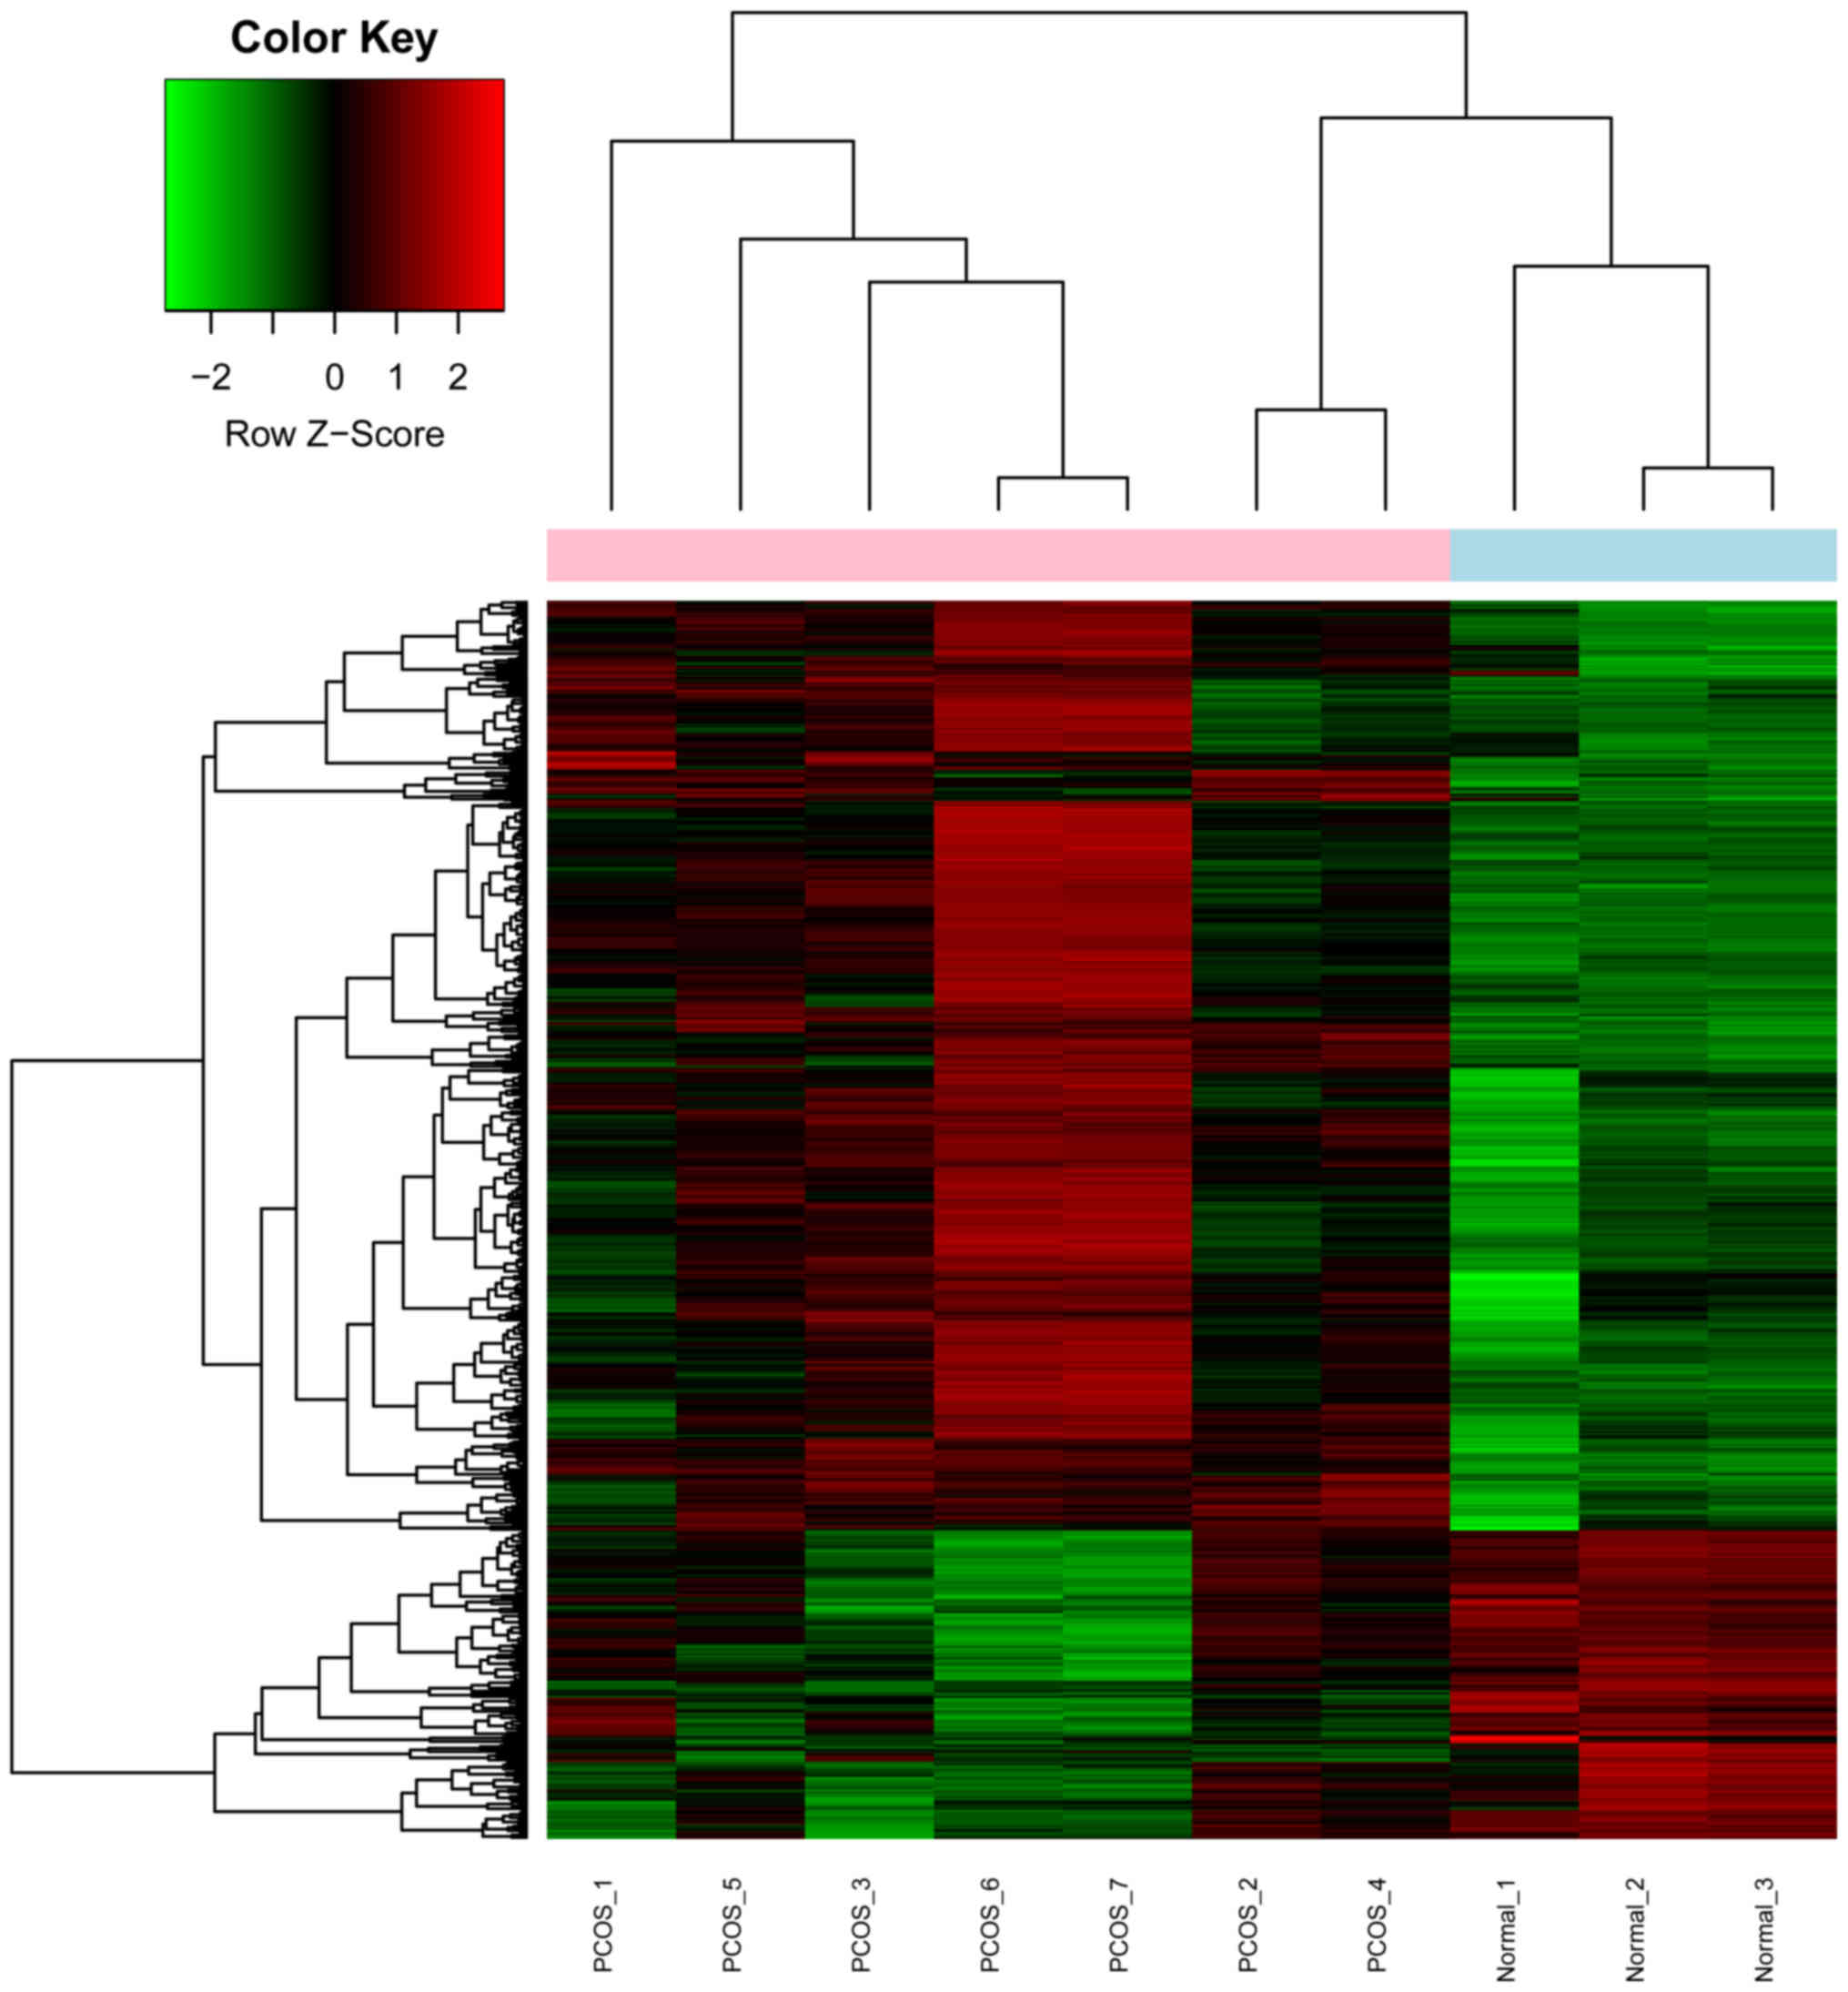
Between PCOS and control samples, 674 DEGs were
screened, including 506 upregulated genes and 168 downregulated
genes. The result of the hierarchical clustering analysis of the
DEGs is exhibited in a heatmap plot (Fig. 2). The majority of genes in the
PCOS samples was upregulated as compared to those in the control
samples.
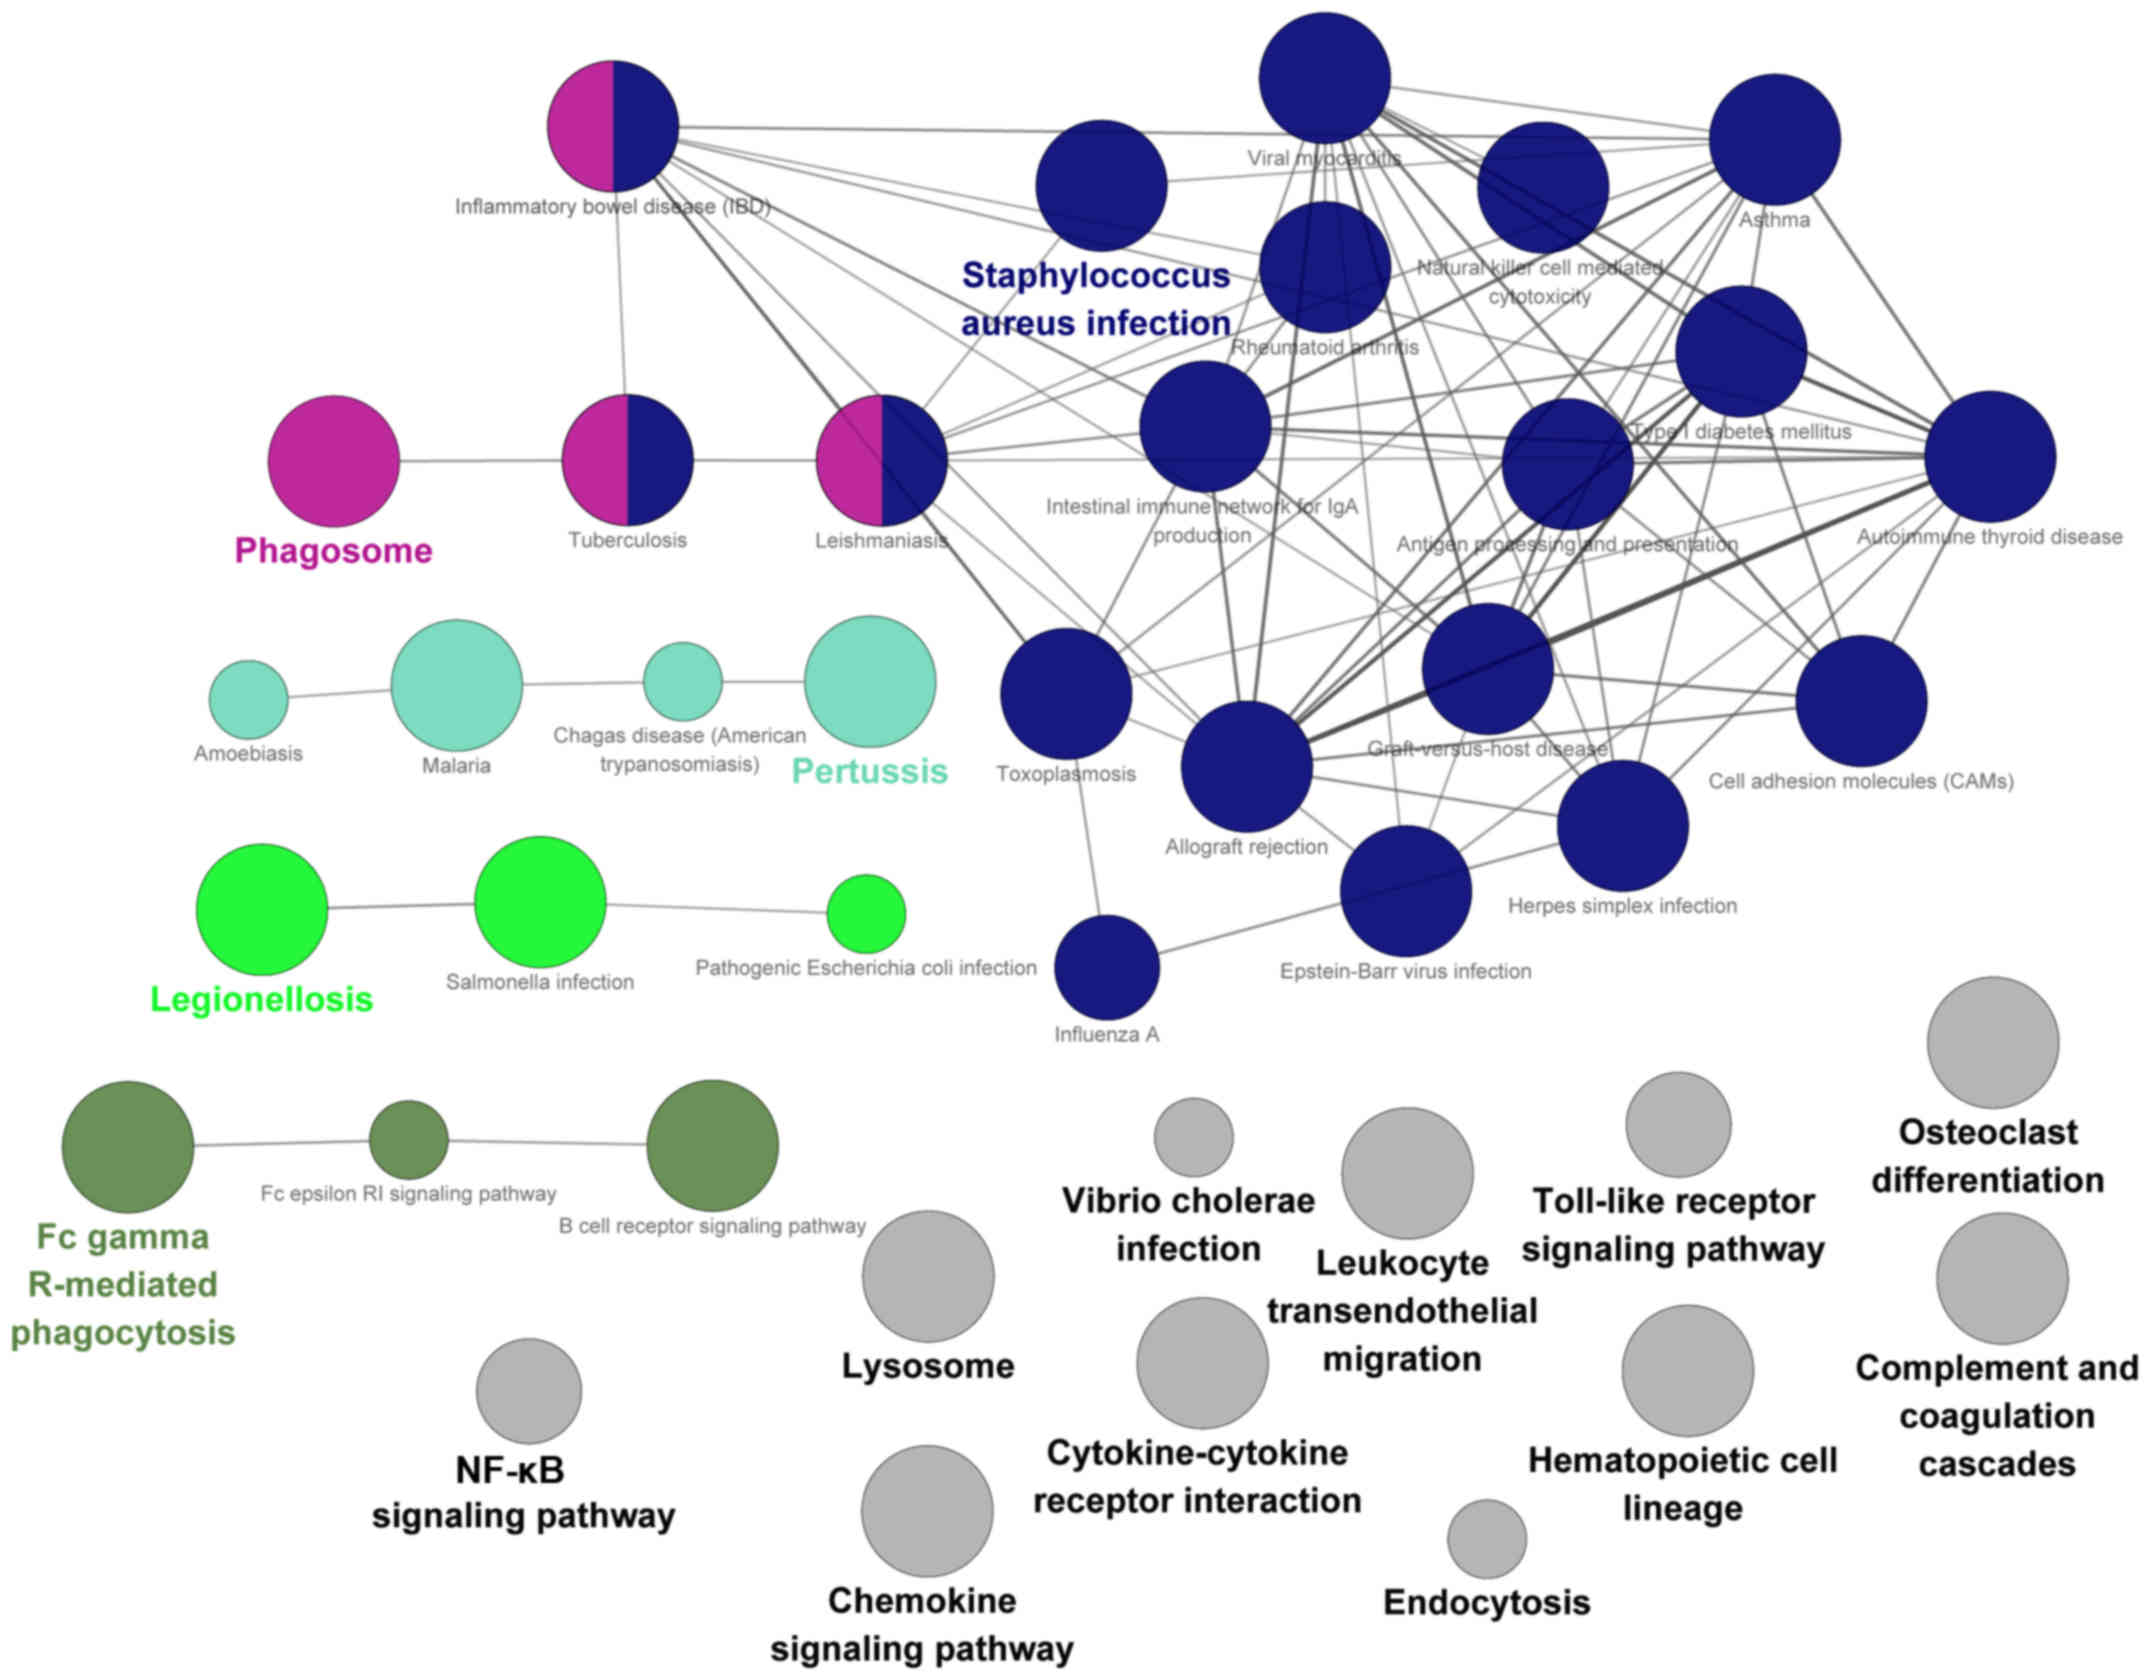
Pathway enrichment analysis
KEGG pathway enrichment analysis was performed for
the DEGs with a view to determining which pathways possibly
involved the obtained DEGs. Collectively, 41 pathways were
significantly enriched with the DEGs. As shown in Fig. 3, 30 pathways were functionally
categorized into 5 groups based on the Kappa score (≥0.4). The
other 11 pathways were not functionally related to other pathways.
These significant pathways were primarily associated with immune
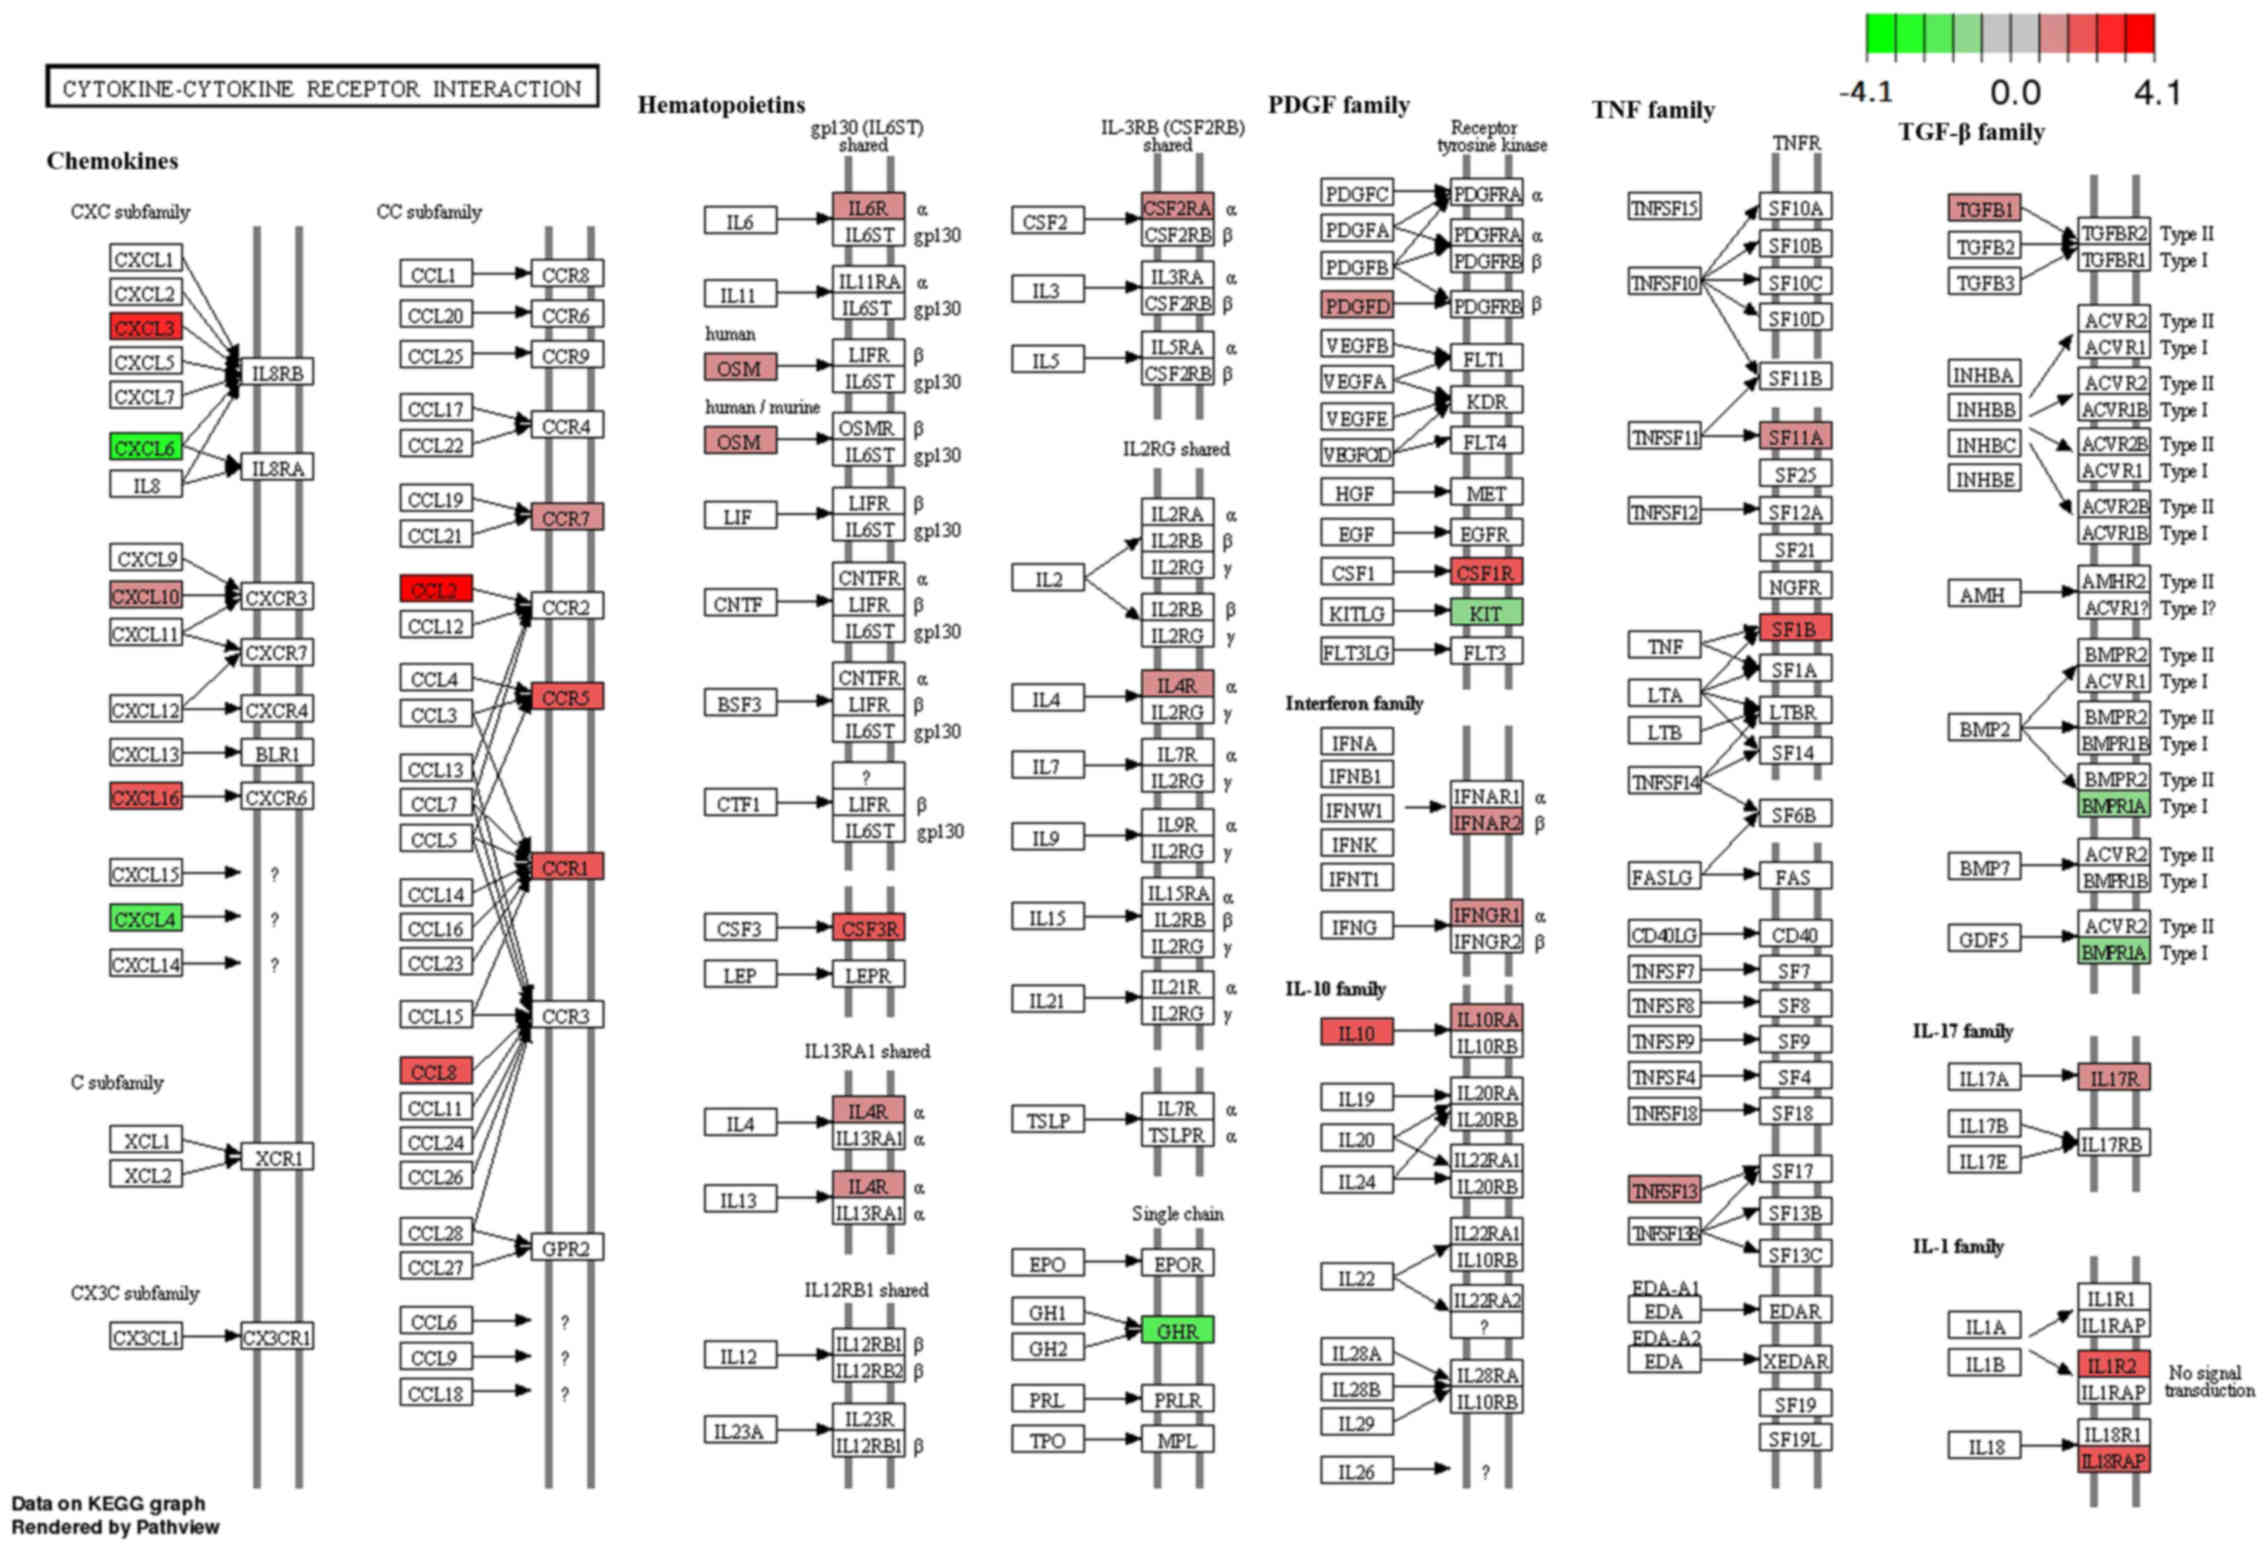
and inflammation. Each significant pathway was visualized by the
Pathview software. One example was the Cytokine-cytokine receptor
interaction pathway (adjusted P=1.67E−05) (Fig. 4) which was enriched with 31 genes,
such as chemokine (C-X-C motif) ligand (CXCL) subfamily members
(CXCL3, CXCL6, CXCL10, CXCL16 and CXCL4) and chemokine (C-C motif)
ligand (CCL) subfamily members (CCL2, CCL8, CCR5, CCR7 and
CCR1).
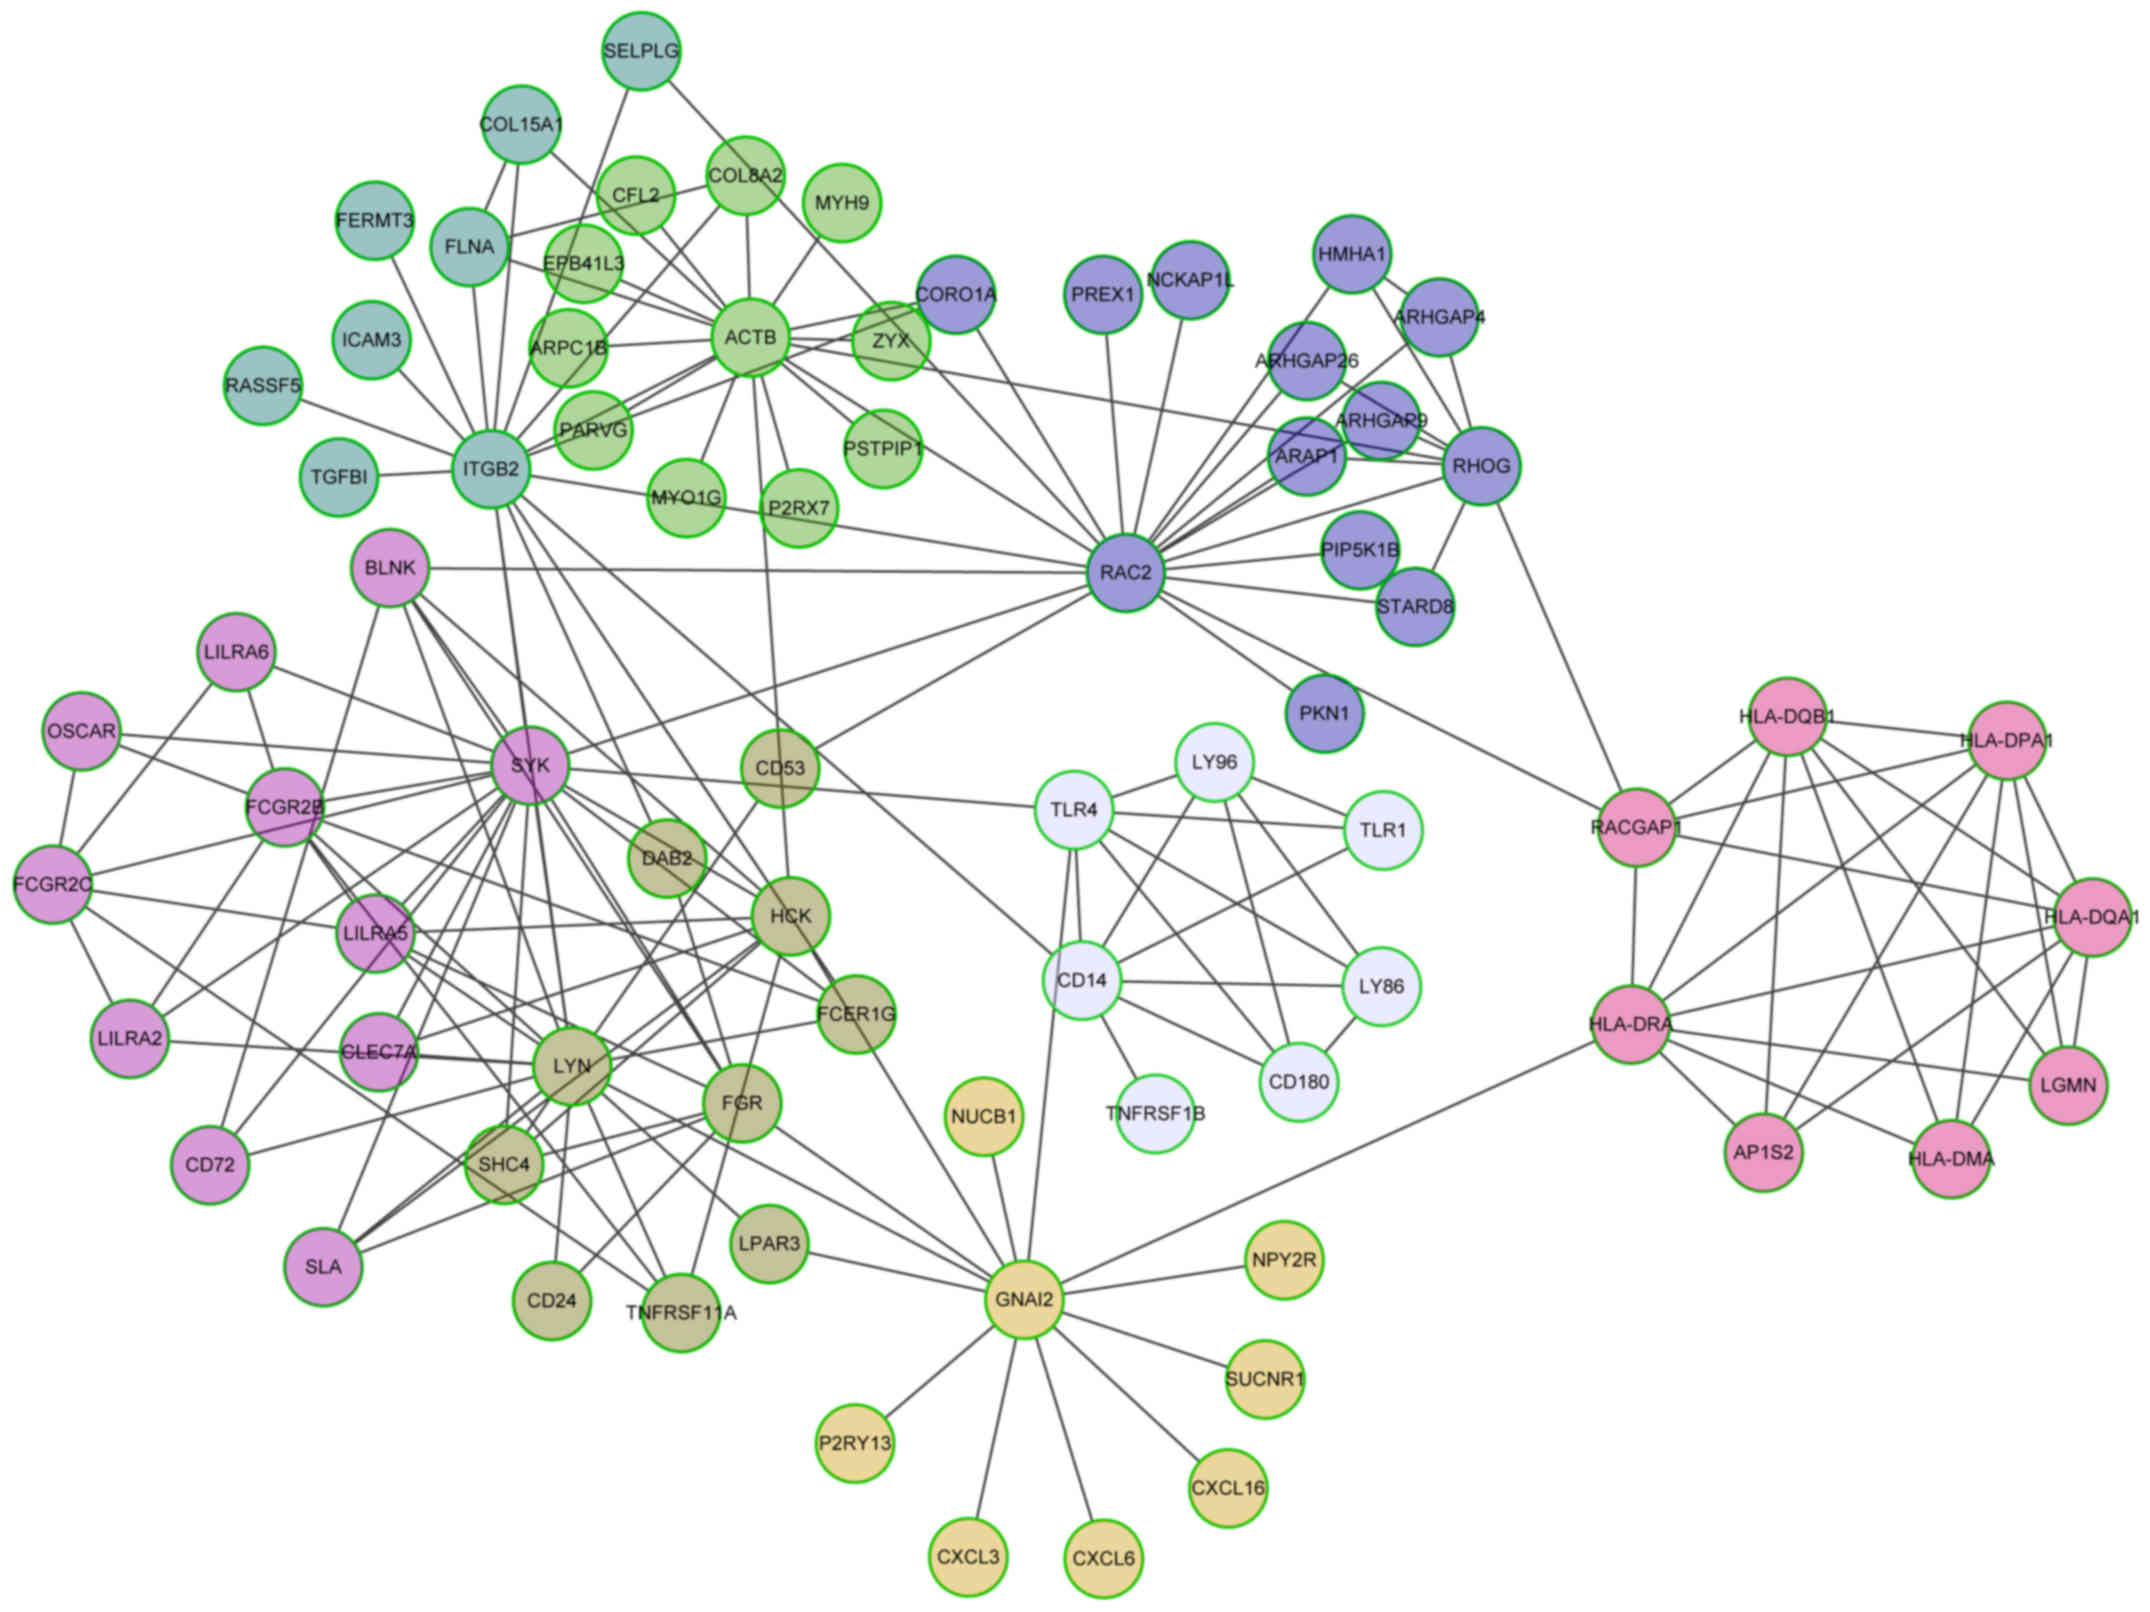
Analysis of the Reactome FI network and
the network modules
For the purpose of evaluating the associations
between the identified DEGs, a Reactome FI network was constructed
with the DEGs, and 8 highly connected network nodules were
extracted from the network (Table
II). Fig. 5 shows that among
the 8 modules, module 0 had the largest size, including 13 genes
with hub gene RAS-related C3 botulinum substrate 2 (RAC2). Both
module 1 and 2 had 11 genes. The hub genes were actin-β (ACTB) and
Fc fragment of IgG, low affinity IIc, receptor for (CD32) (FCGR2C),
respectively. Additionally, 10 genes were included in module 3 with
LYN proto-oncogene, Src family tyrosine kinase (LYN) as the hub
genes.
| Table IIComponents of 8 network modules. |
Table II
Components of 8 network modules.
| Module | No of genes | Average
correlation | Gene list |
|---|
| Module 0 | 13 | 0.8196 | ARAP1, ARHGAP26,
ARHGAP4, ARHGAP9, CORO1A, HMHA1, NCKAP1L, PIP5K1B, PKN1, PREX1,
RAC2, RHOG, STARD8 |
| Module 1 | 11 | 0.8695 | ACTB, ARPC1B, CFL2,
COL8A2, EPB41L3, MYH9, MYO1G, P2RX7, PARVG, PSTPIP1, ZYX |
| Module 2 | 11 | 0.8501 | BLNK, CD72, CLEC7A,
FCGR2B, FCGR2C, LILRA2, LILRA5, LILRA6, OSCAR, SLA, SYK |
| Module 3 | 10 | 0.8006 | CD24, CD53, DAB2,
FCER1G, FGR, HCK, LPAR3, LYN, SHC4, TNFRSF11A |
| Module 4 | 8 | 0.8748 | COL15A1, FERMT3,
FLNA, ICAM3, ITGB2, RASSF5, SELPLG, TGFBI |
| Module 5 | 8 | 0.7448 | CXCL16, CXCL3,
CXCL6, GNAI2, NPY2R, NUCB1, P2RY13, SUCNR1 |
| Module 6 | 8 | 0.6387 | AP1S2, HLA-DMA,
HLA-DPA1, HLA-DQA1, HLA-DQB1, HLA-DRA, LGMN, RACGAP1 |
| Module 7 | 7 | 0.6262 | CD14, CD180, LY86,
LY96, TLR1, TLR4, TNFRSF1B |
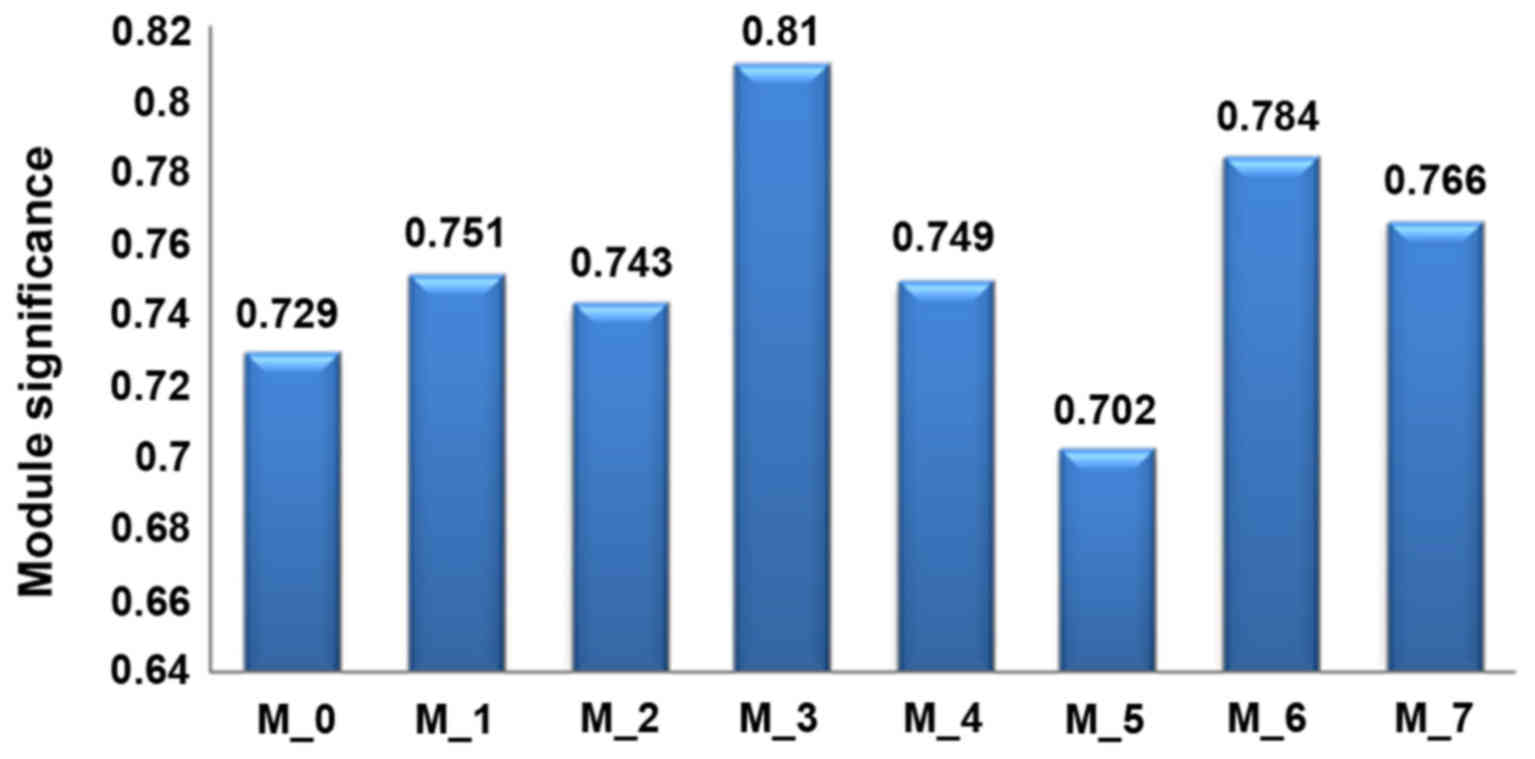
The module significance to sample phenotype (normal
and PCOS samples) was calculated to explore the degree of the
association of each module with sample phenotype. As shown in
Fig. 6, the module significance
ranged from 0.702 to 0.81. This suggested that these modules were
well associated with the sample phenotype. Module 3 had the highest
module significance (0.81).
Pathway enrichment analysis was also performed for
the genes in each module. Top 5 significant pathways for each
network module were identified based on the P-value (Table III). Module 0 was significantly
enriched with the Regulation of RhoA activity, Signaling by Rho
GTPases, Regulation of RAC1 activity, GPVI-mediated activation
cascade and RhoA signaling pathways. Rho GTPase activating protein
(ARHGAP)4 and ARHGAP9 are involved in the Regulation of RhoA
activity and Signaling by Rho GTPase pathways. In addition, Ras
homolog family member G (RHOG) was related to Signaling by Rho
GTPases and GlycoProtein (GP)VI-mediated activation cascade
pathways. Module 1 was associated with the Regulation of actin
cytoskeleton, Salmonella infection, Nicotinic acetyl-choline
receptor signaling, and Tight junction pathways. ACTB and myosin,
heavy chain 9, non-muscle (MYH9) were enriched in the 4 pathways.
Module 2 was related to the Tuberculosis, Osteoclast
differentiation, B cell receptor signaling, BCR signaling and
Phagosome signaling pathways. Module 3 was related to Thromboxane
A2 receptor signaling, Signaling events mediated by PTP1B,
Chemokine signaling, CXCR4-mediated signaling events and ephrin B
reverse signaling pathways. LYN, hub gene of module 3 was enriched
in each of these pathways. Notably, module 6 was related to MHC
class II antigen presentation pathway which was enriched with
several human leukocyte antigen (HLA) genes, such as HLA-DQB1,
HLA-DPA1, HLA-DMA, HLA-DQA1 and HLA-DRA. Module 7 was linked to
Toll-like receptor-related pathways.
| Table IIITop 5 significant KEGG pathways for
each network module. |
Table III
Top 5 significant KEGG pathways for
each network module.
| Module | Pathway | No. of genes. | P-value | Gene list |
|---|
| Module 0 | Regulation of RhoA
activity | 3 | 0 | ARHGAP4, ARAP1,
ARHGAP9 |
| Module 0 | Signaling by Rho
GTPases | 8 | 0 | ARHGAP26, ARHGAP4,
HMHA1, RAC2, STARD8, ARAP1, RHOG, ARHGAP9 |
| Module 0 | Regulation of RAC1
activity | 2 | 0.0012 | PREX1, ARHGAP9 |
| Module 0 | GPVI-mediated
activation cascade | 2 | 0.0015 | RAC2, RHOG |
| Module 0 | RhoA signaling
pathway | 2 | 0.0016 | PIP5K1B, PKN1 |
| Module 1 | Regulation of actin
cytoskeleton | 4 | 0 | ACTB, ARPC1B, CFL2,
MYH9 |
| Module 1 | Salmonella
infection | 3 | 0.0001 | ACTB, ARPC1B,
MYH9 |
| Module 1 | Nicotinic
acetylcholine receptor signaling pathway | 2 | 0.0002 | ACTB, MYH9 |
| Module 1 | Tight junction | 3 | 0.0003 | ACTB, EPB41L3,
MYH9 |
| Module 1 | Integrin signaling
pathway | 3 | 0.0005 | ACTB, ARPC1B,
COL8A2 |
| Module 2 | Tuberculosis | 4 | 0 | FCGR2B, FCGR2C,
CLEC7A, SYK |
| Module 2 | Osteoclast
differentiation | 8 | 0 | FCGR2B, LILRA2,
FCGR2C, OSCAR, LILRA5, LILRA6, BLNK, SYK |
| Module 2 | B cell receptor
signaling pathway | 4 | 0 | FCGR2B, CD72, BLNK,
SYK |
| Module 2 | BCR signaling
pathway | 4 | 0 | FCGR2B, CD72, BLNK,
SYK |
| Module 2 | Phagosome | 3 | 0.0006 | FCGR2B, FCGR2C,
CLEC7A |
| Module 3 | Thromboxane A2
receptor signaling | 3 | 0 | FGR, LYN, HCK |
| Module 3 | Signaling events
mediated by PTP1B | 3 | 0 | FGR, LYN, HCK |
| Module 3 | Chemokine signaling
pathway | 4 | 0 | FGR, LYN, HCK,
SHC4 |
| Module 3 | CXCR4-mediated
signaling events | 3 | 0 | FGR, LYN, HCK |
| Module 3 | Ephrin B reverse
signaling | 3 | 0 | FGR, LYN, HCK |
| Module 4 | β2 integrin cell
surface interactions | 3 | 0 | ICAM3, TGFBI,
ITGB2 |
| Module 4 | Cell adhesion
molecules (CAMs) | 3 | 0.0002 | ICAM3, ITGB2,
SELPLG |
| Module 4 | Integrin signaling
pathway | 3 | 0.0002 | COL15A1, ITGB2,
FLNA |
| Module 4 | amb2 integrin
signaling | 2 | 0.0003 | ITGB2, SELPLG |
| Module 4 | Extracellular
matrix organization | 3 | 0.0008 | ICAM3, COL15A1,
ITGB2 |
| Module 5 | GPCR ligand
binding | 6 | 0 | P2RY13, CXCL16,
CXCL3, NPY2R, SUCNR1, CXCL6 |
| Module 5 | Chemokine signaling
pathway | 4 | 0 | GNAI2, CXCL16,
CXCL3, CXCL6 |
| Module 5 | GPCR downstream
signaling | 7 | 0 | P2RY13, GNAI2,
CXCL16, CXCL3, NPY2R, SUCNR1, CXCL6 |
| Module 5 | Cytokine-cytokine
receptor interaction | 3 | 0.0006 | CXCL16, CXCL3,
CXCL6 |
| Module 5 | Pertussis | 2 | 0.0012 | GNAI2, CXCL6 |
| Module 6 | Epstein-Barr virus
infection | 4 | 0 | HLA-DQB1, HLA-DPA1,
HLA-DQA1, HLA-DRA |
| Module 6 | MHC class II
antigen presentation | 8 | 0 | HLA-DQB1, AP1S2,
LGMN, HLA-DPA1, RACGAP1, HLA-DMA, HLA-DQA1, HLA-DRA |
| Module 6 | Viral
myocarditis | 5 | 0 | HLA-DQB1, HLA-DPA1,
HLA-DMA, HLA-DQA1, HLA-DRA |
| Module 6 | Staphylococcus
aureus infection | 5 | 0 | HLA-DQB1, HLA-DPA1,
HLA-DMA, HLA-DQA1, HLA-DRA |
| Module 6 | Autoimmune thyroid
disease | 5 | 0 | HLA-DQB1, HLA-DPA1,
HLA-DMA, HLA-DQA1, HLA-DRA |
| Module 7 | Pertussis | 3 | 0 | LY96, TLR4,
CD14 |
| Module 7 | NF-κB signaling
pathway | 3 | 0 | LY96, TLR4,
CD14 |
| Module 7 | Toll-like receptors
cascades | 6 | 0 | LY96, LY86, TLR1,
TLR4, CD14, CD180 |
| Module 7 | Pathogenic
Escherichia coli infection | 3 | 0 | LY96, TLR4,
CD14 |
| Module 7 | Toll-like receptor
signaling pathway | 4 | 0 | LY96, TLR1, TLR4,
CD14 |
RT-PCR analysis
Bioinformatic analysis showed that ARHGAP4, ARHGAP9,
RHOG, ACTB, MYH9 and LYN were upregulated DEGs in PCOS samples
relative to normal samples. In order to verify these results,
quantitative RT-PCR was used to measure the mRNA expression of
these genes in granulosa cell samples of PCOS patients and normal
controls. With regard to demographic and clinical characteristics
(Table IV), PCOS patients and
normal controls were not significantly different in regards to age,
FSH, LH, PRL, E2, T and height. Yet, PCOS patients had markedly
increased FBG, FINS, HOMA-IR, body weight, BMI and number of antral
follicles. As shown in Fig. 7,
ARHGAP4, ARHGAP9, RHOG and LYN at the mRNA level were significantly
increased in PCOS compared to levels in the normal controls
(P<0.05). Although increased mRNA expression of ACTB and MYH9
was also observed in PCOS, the difference was not significant
(P>0.05).
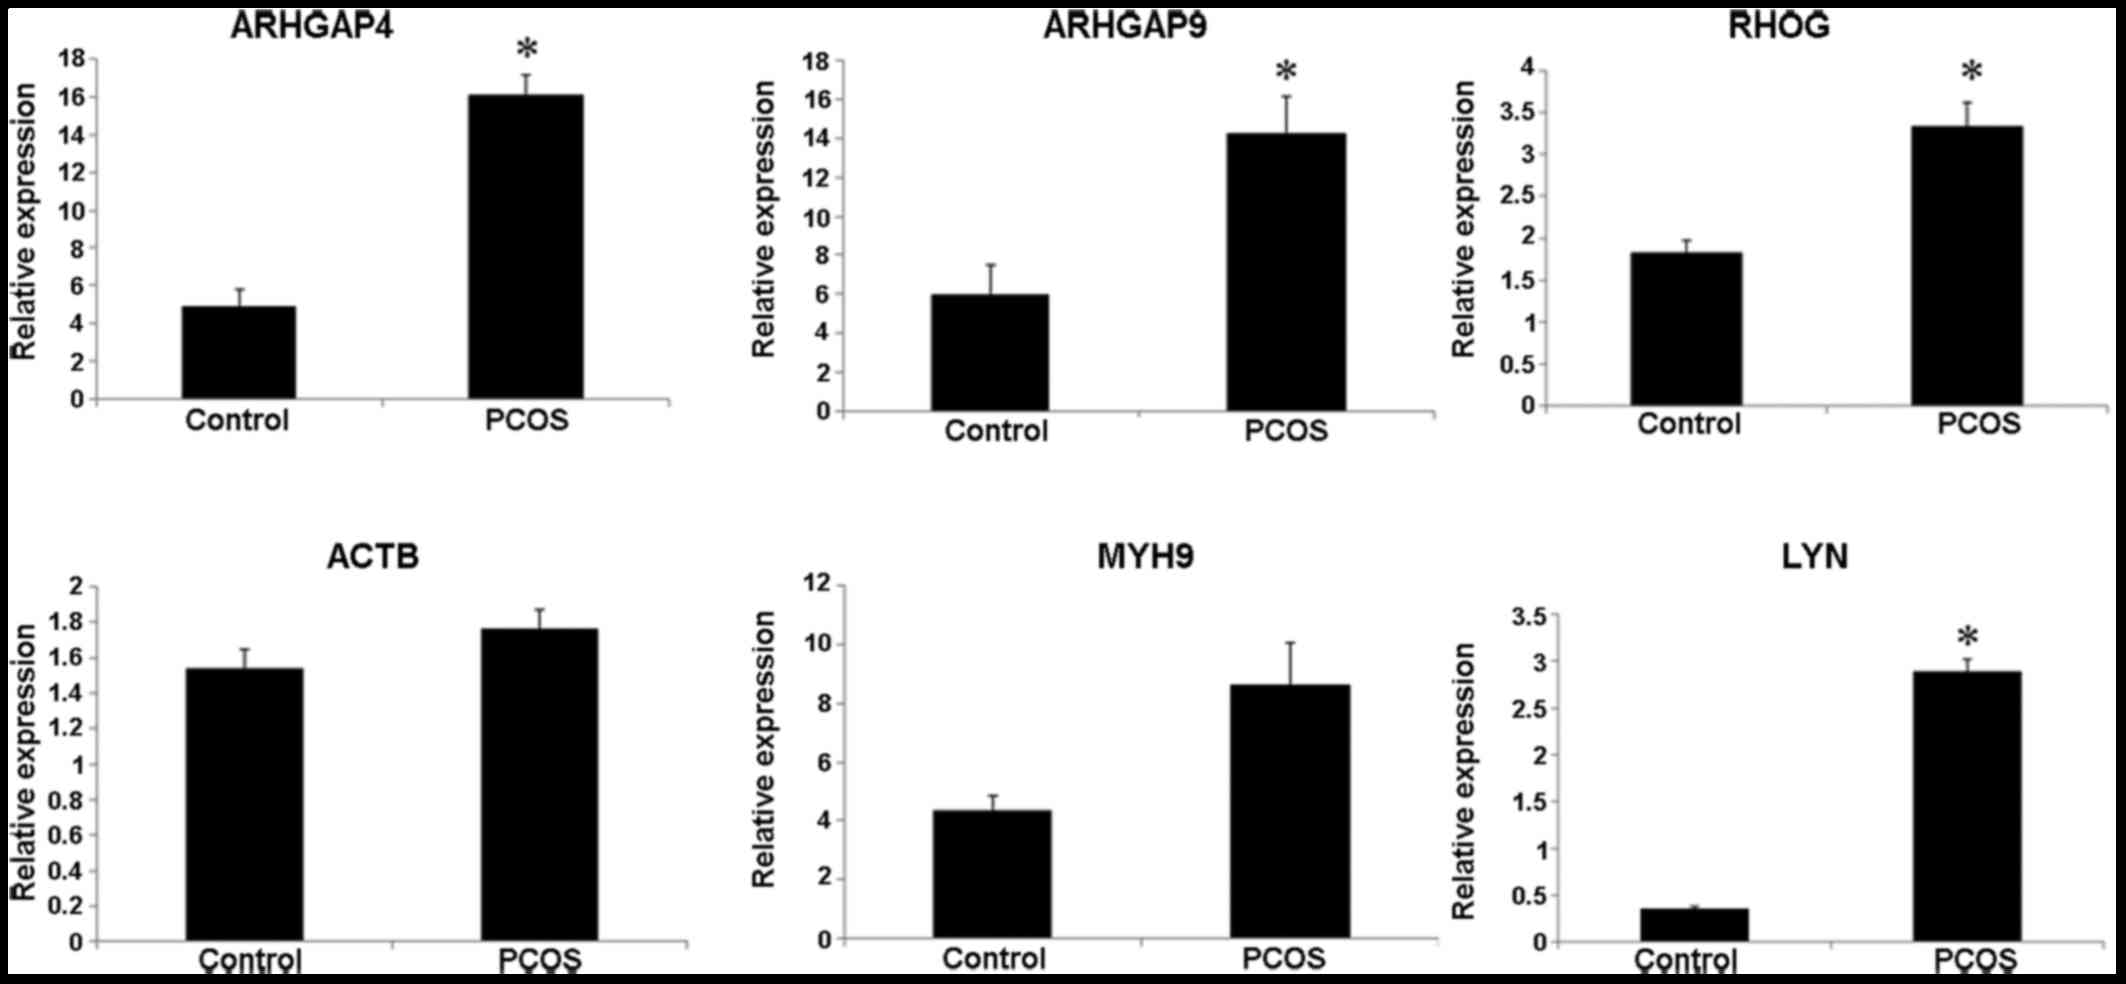 | Figure 7mRNA levels of ARHGAP4, ARHGAP9,
RHOG, ACTB, MYH9 and LYN in granulosa cell samples of polycystic
ovary syndrome (PCOS) patients and normal controls as detected
using RT-PCR. *P<0.05 compared to control. PCOS,
polycystic ovary syndrome; ARHGAP, Rho GTPase activating protein;
RHOG, Ras homolog family member G; ACTB, actin-β; MYH9, myosin,
heavy chain 9, non-muscle; LYN, LYN proto-oncogene, Src family
tyrosine kinase. |
| Table IVDemographic and clinical
characteristics of controls and PCOS patients for PCR analysis. |
Table IV
Demographic and clinical
characteristics of controls and PCOS patients for PCR analysis.
| Variable | Control group
(n=5) | PCOS group
(n=7) | P-value |
|---|
| Age (years) | 27.000±2.121 | 28.857±4.670 | 0.379 |
| FSH (mIU/ml) | 5.438±0.514 | 5.267±0.404 | 0.532 |
| LH (mIU/ml) | 4.196±0.641 | 4.174±1.988 | 0.982 |
| PRL(ng/ml) | 14.988±2.296 | 19.986±4.676 | 0.054 |
| E2 (pg/ml) | 29.200±8.044 | 32.857±13.031 | 0.593 |
| T (ng/ml) | 0.268±0.040 | 0.294±0.157 | 0.725 |
| FBG (mmol/l) | 5.200±0.158 | 5.443±0.288 | 0.092 |
| FINS (mIU/l) | 5.980±0.858 | 10.829±2.780 | 0.004 |
| HOMA-IR | 1.380±0.191 | 2.637±0.759 | 0.005 |
| Height (m) | 1.584±0.054 | 1.607±0.049 | 0.466 |
| Body weight
(kg) | 54.000±8.602 | 70.286±9.656 | 0.013 |
| BMI | 21.467±2.704 | 27.204±3.372 | 0.011 |
| Number of antral
follicles (L) | 6.800±1.304 | 21.714±5.851 |
<0.001 |
| Number of antral
follicles (R) | 7.800±1.304 | 25.714±2.870 |
<0.001 |
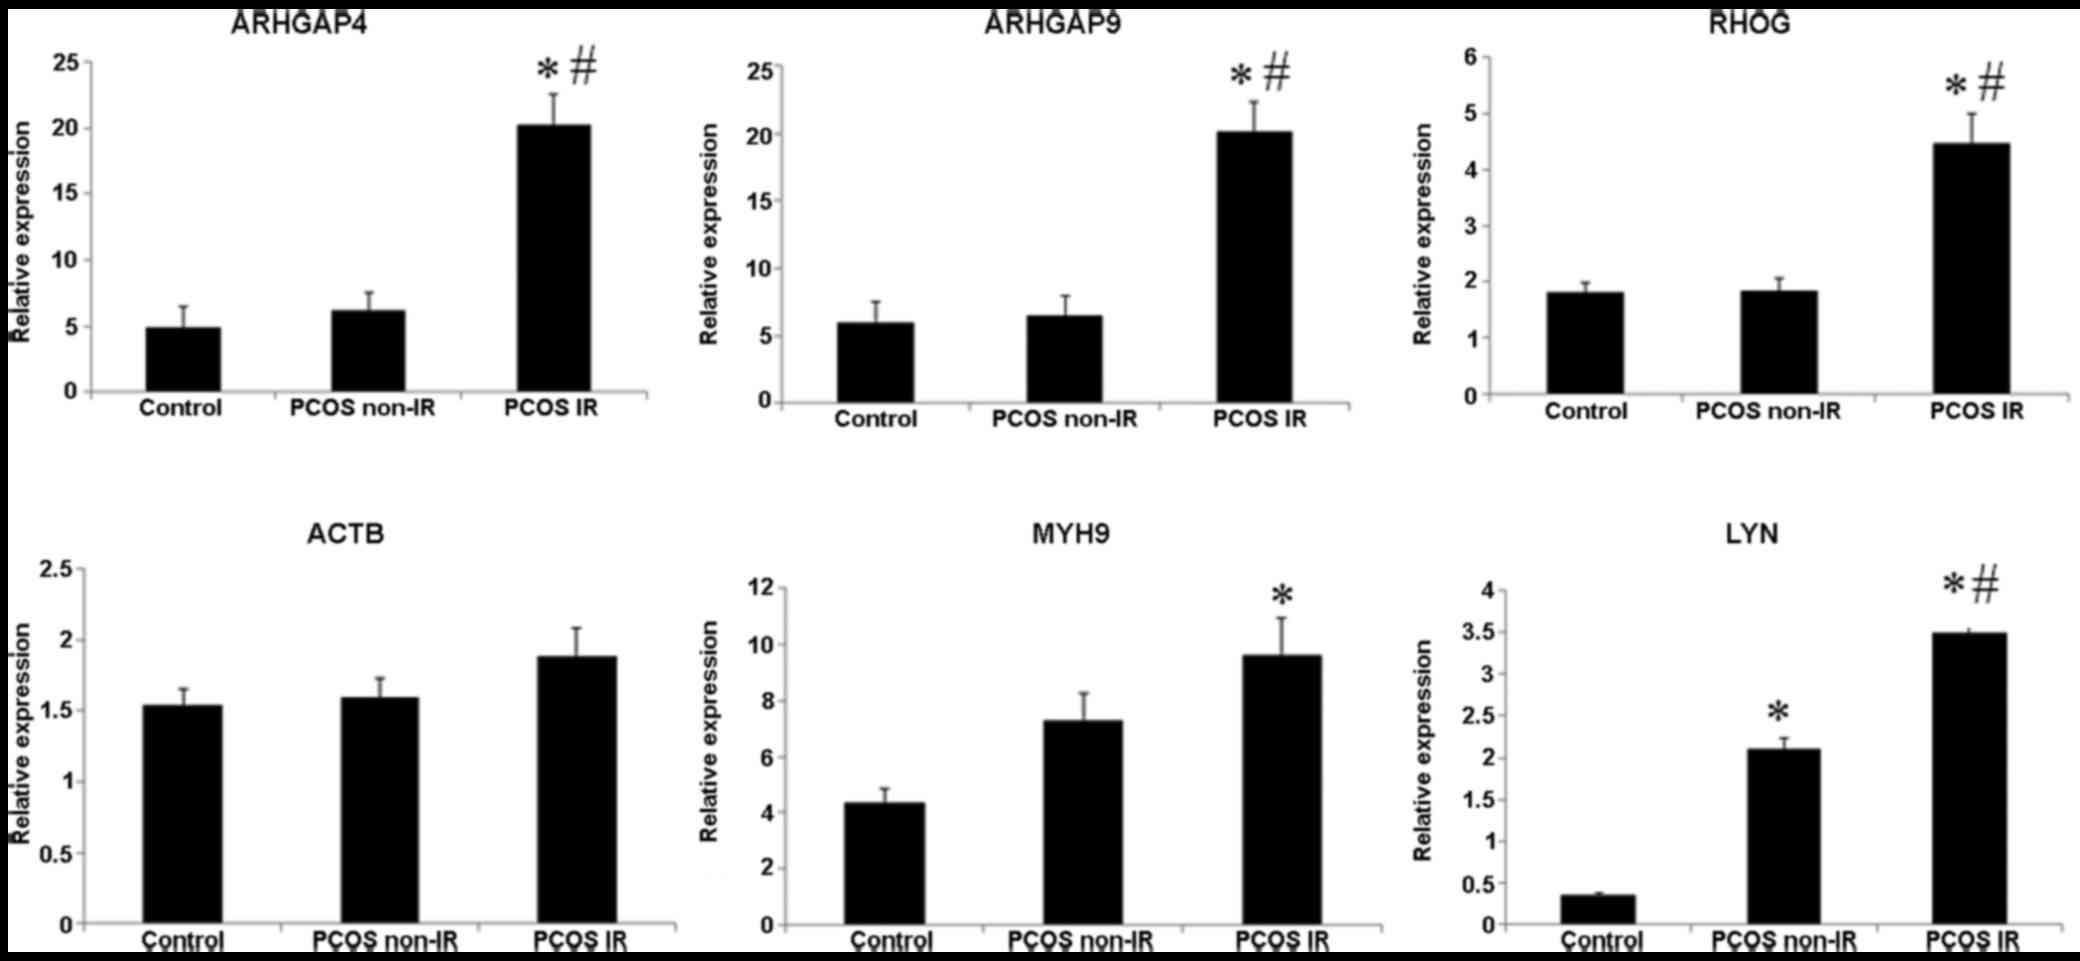
Furthermore, the 7 PCOS samples were divided into
two groups: PCOS non-IR (n=3) and PCOS IR (n=4) groups. The
demographic and clinical characteristic analysis revealed that LH
and E2 were significantly decreased, and FINS, HOMA-IR and BMI were
significantly increased in PCOS IR patients relative to PCOS non-IR
patients (Table V). Results of
RT-PCR found that the PCOS IR group had markedly elevated
expression of ARHGAP4, ARHGAP9, RHOG and LYN when compared to these
parameters in the PCOS non-IR group (Fig. 8).
| Table VDemographic and clinical
characteristics of controls, PCOS non-IR patients and PCOS IR
patients for PCR analysis. |
Table V
Demographic and clinical
characteristics of controls, PCOS non-IR patients and PCOS IR
patients for PCR analysis.
| Variable | Control group
(n=5) | PCOS non-IR group
(n=3) | PCOS IR group
(n=4) | F-value | P-value |
|---|
| Age (years) | 27.000±2.121 | 30.000±5.657 | 28.400±4.879 | 0.425 | 0.666 |
| FSH (mIU/ml) | 5.438±0.514 | 5.705±0.092 | 5.092±0.330 | 1.866 | 0.210 |
| LH (mIU/ml) | 4.196±0.641 | 6.560±0.750a | 3.220±1.343b | 7.615 | 0.012 |
| PRL (ng/ml) | 14.988±2.296 | 17.260±1.485 | 21.076±5.200 | 3.206 | 0.089 |
| E2 (pg/ml) | 29.200±8.044 |
50.000±4.243a |
26.000±6.671b | 8.528 | 0.008 |
| T (ng/ml) | 0.268±0.040 | 0.450±0.212 | 0.232±0.093 | 3.651 | 0.069 |
| FBG (mmol/l) | 5.200±0.158 | 5.200±0.000 | 5.540±0.288 | 3.512 | 0.075 |
| FINS (mIU/l) | 5.980±0.858 | 7.500±1.980 |
12.160±1.689a,b | 24.516 |
<0.001 |
| HOMA-IR | 1.380±0.191 | 1.733±0.458 | 2.999±0.490a,b | 23.613 |
<0.001 |
| Height (m) | 1.584±0.054 | 1.635±0.007 | 1.596±0.055 | 0.709 | 0.517 |
| Body weight
(kg) | 54.000±8.602 | 61.000±7.071 |
74.000±8.185a | 7.439 | 0.012 |
| BMI | 21.467±2.704 | 22.808±2.448 |
28.962±1.425a,b | 15.581 | 0.001 |
| Number of antral
follicles (L) | 6.800±1.304 |
23.000±9.899a |
21.200±5.070a | 14.163 | 0.002 |
| Number of antral
follicles (R) | 7.800±1.304 | 25.500±0.707 |
25.800±3.493a | 75.092 |
<0.001 |
Discussion
PCOS is a complex disease characterized by variable
clinical features. It is largely ascribed to hormone imbalance and
results in a heavy health and economic burden. The present study
identified a list of genes and pathways that may be involved in the
pathogenesis of PCOS by a series of microarray analyses. A total of
674 DEGs were screened between PCOS and control samples. Pathway
enrichment analysis revealed significant enrichment of 41 pathways
with the DEGs. These pathways were predominately related to immune
and inflammation. In line with the finding, it has been reported
that inflammation is enhanced, and production of interleukins and
chemokines is increased in PCOS (29,30). Our result confirms the crucial
role of inflammation and immune in the development of PCOS.
In the present study, 8 highly connected network
modules were extracted from the Reactome FI network. Among these
network modules, module 3 had the highest module signifi-cance. LYN
was the hub gene of module 3. Notably, microarray analysis revealed
that LYN was an upregulated DEG in PCOS, which was in accordance
with the result of RT-PCR. LYN encodes tyrosine-protein Lyn which
is a member of the src family tyrosine kinase. There is in
vivo evidence that Src family kinases are essential for
generation of the inflammatory environment (31). Furthermore, research has
established that Lyn plays both a positive and a negative
regulatory role in neutrophils and macrophages (32). Lyn plays a prominent role in the
activation of innate immune response mediated by nuclear factor-κB
in human mononuclear cells (33).
These findings suggest that Lyn is closely related to inflammation
and immune response. In the present study, pathway analysis for
module 3 revealed that LYN was significantly enriched in the
Inflammation and immune-related TXA2 receptor signaling, Chemokine
signaling, and CXCR4-mediated signaling events pathways, which was
in concordance with previous findings. Dysregulated LYN may
participate in PCOS-related inflammation and immune response.
Furthermore, inflammation is an important mechanism underlying
insulin resistance (34), which
is prevalent in PCOS patients (35). By using RT-PCR, the study found
that LYN expression was significantly increased in PCOS IR patients
compared with PCOS non-IR patients. This indicates that upregulated
LYN may be associated with PCOS-related insulin resistance as
well.
Pathway enrichment analysis revealed that module 0
was significantly associated with Regulation of RhoA activity,
Signaling by Rho GTPases and RhoA signaling pathways. RhoA is a
member of Rho family of GTPases involved in regulating
intracellular actin dynamics (36). It has been demonstrated that RhoA
participates in regulating secretion of insulin (37), and is associated with insulin
resistance via phosphorylation of insulin receptor substrate-1
(38). Moreover, it also mediates
adrenocorticotropin-stimulated cortisol biosynthesis in human
adrenocortical cells (39). These
observations indicate that Regulation of RhoA activity, Signaling
by Rho GTPases and RhoA signaling pathways may be associated with
PCOS-related hormone imbalance, in particular insulin resistance.
Furthermore, the present study also found that Regulation of RhoA
activity and Signaling by Rho GTPases pathways shared 2 DEGs:
ARHGAP4 and ARHGAP9. They are two members of the Rho-GAP family of
GTPase activating proteins participating in the regulation of the
function of Rho GTPases (40).
Moreover, results of the microarray analysis and RT-PCR reached an
agreement that ARHGAP4 and ARHGAP9 were significantly upregulated
in PCOS. It has been speculated that dysregulated ARHGAP4 and
ARHGAP9 may play a role in PCOS-related hormone imbalance,
particular insulin resistance, by regulating Regulation of RhoA
activity and Signaling by Rho GTPases pathways. Consistently, the
study found that expression of ARHGAP4 and ARHGAP9 were markedly
increased in PCOS IR patients relative to PCOS non-IR patients by
using RT-PCR.
RhoG encoded by gene RHOG is a small G protein and
belongs to the Rac subfamily of the Rho family. Recently, it has
been reported that RhoG protein may be implicated in glycoprotein
VI-Fc receptor γ-chain complex-mediated platelet activation
(41). In agreement with the
finding, the study found that RHOG in module 0 was significantly
enriched in the GP VI-mediated activation cascade pathway.
Furthermore, it has been established that impaired platelet
function plays a part in the pathogenesis of PCOS (42). These observations indicate that
RHOG and GP VI-mediated activation cascade pathway may be
implicated in PCOS-related platelet dysfunction. Moreover, the
study found an obviously increased expression of RHOG in PCOS IR
patients relative to PCOS non-IR patients. Platelets are important
players in inflammation (43),
which is a critical mechanism of insulin resistance. Upregulated
RHOG may play a role in insulin resistance by affecting platelet
dysfunction.
The study found that ACTB and MYH9 in module 1 were
upregulated DEGs in PCOS, and significantly related to the
Regulation of actin cytoskeleton and Tight junction pathways. These
pathways and genes are related to cytoskeleton formation. However,
RT-PCR measurement of the two genes revealed that the differences
in mRNA expression of ACTB and MYH9 did not reach significance
between PCOS and normal samples. This suggests that results of the
two genes may be false-positive results of the microarray data
analysis. Nevertheless, the abnormal expression of cytoskeletal
proteins has been reported in PCOS (44,45). Therefore, more studies are needed
to clarify the role of ACTB and MYH9 in PCOS.
HLA genes encode antigen-presenting proteins located
on the cell surface in the human body. There is evidence that
possession of HLA-DQA1*0501, HLA-A11 and
HLA-DRB1*0403 are risk factors of PCOS (46,47). This study also found that the HLA
genes were closely associated with PCOS, as evidenced by the fact
that a group of HLA genes (HLA-DQB1, HLA-DPA1, HLA-DMA, HLA-DQA1
and HLA-DRA) were included in module 6 and enriched in MHC class II
antigen presentation pathway. Moreover, serum HLA-G in women with
PCOS has been reported to be associated with oxidative stress,
ovarian hyperandrogenism and insulin resistance (48). It is speculated that HLA-DQB1,
HLA-DPA1, HLA-DMA, HLA-DQA1 and HLA-DRA may play a role in
PCOS-related oxidative stress, ovarian hyperandrogenism and insulin
resistance by affecting the MHC class II antigen presentation
pathway. In the present study, genes in module 7 were linked to
Toll-like receptor-related pathways. Toll-like receptors are
important participants of the immune system. Toll-like receptor 3
affects β-cell insulin secretion and glucose homeostasis (49), and activation of Toll-like
receptor signaling pathways aid in inducing insulin resistance
(50). These findings lead to a
speculation that Toll-like receptor signaling pathways are possibly
implicated in PCOS-related insulin resistance and immune
abnormality.
The study has some limitations. Firstly, its sample
size is small. Follicular fluid samples are not easy to collect and
many patients may not agree with the study. Secondly, the
microarray dataset GSE34526 did not provide clear information on
whether the PCOS samples in the dataset were resistant to insulin
or not, thus differentially expressed genes between PCOS IR and the
PCOS non-IR samples were not distinguished. Thirdly, it is
necessary to validate the results of microarray data analysis using
experimental methods. In this preliminary study, expression of 6
DEGs in granulosa cell samples of PCOS patients and normal controls
were measured using RT-PCR. Further studies with more experiments,
such as western blotting, and a large cohort of samples are in
process to verify and extend the findings of the present study.
In conclusion, the present study confirmed the
important role of inflammation and immune in PCOS. The Regulation
of RhoA activity, Signaling by Rho GTPases, and GP VI-mediated
activation cascade pathways may be associated with PCOS-related
hormone imbalance and platelet dysfunction. LYN, ARHGAP4, ARHGAP9
and RHOG are promising candidate genes in PCOS, and may be
recommended as possible therapeutic targets for PCOS. Further
experimental studies are warranted to verify the results of the
present study.
Acknowledgments
The present study was supported by the Shanghai
Municipal Commission of Health and Family Planning (grant no.
201540214), and accomplished in Shanghai Key Laboratory of Female
Reproductive Endocrine-Related Diseases.
References
|
1
|
Teede H, Deeks A and Moran L: Polycystic
ovary syndrome: A complex condition with psychological,
reproductive and metabolic manifestations that impacts on health
across the lifespan. BMC Med. 8:412010. View Article : Google Scholar : PubMed/NCBI
|
|
2
|
Kar P and Cummings M: Polycystic ovary
syndrome. Pract Diabetes Int. 22:256–260. 2005. View Article : Google Scholar
|
|
3
|
Naderpoor N, Shorakae S, Joham A, Boyle J,
De Courten B and Teede HJ: Obesity and polycystic ovary syndrome.
Minerva Endocrinol. 40:37–51. 2015.
|
|
4
|
Tehrani FR, Simbar M, Tohidi M,
Hosseinpanah F and Azizi F: The prevalence of polycystic ovary
syndrome in a community sample of Iranian population: Iranian PCOS
prevalence study. Reprod Biol Endocrinol. 9:392011. View Article : Google Scholar : PubMed/NCBI
|
|
5
|
Palioura E and Diamanti-Kandarakis E:
Industrial endocrine disruptors and polycystic ovary syndrome. J
Endocrinol Invest. 36:1105–1111. 2013. View Article : Google Scholar
|
|
6
|
Wang F, Zhang Z and Wang Z, Xiao K, Wang
Q, Su J and Wang Z: Expression and clinical significance of the
HIF-1α/ET-2 signaling pathway during the development and treatment
of polycystic ovary syndrome. J Mol Histol. 46:173–181. 2015.
View Article : Google Scholar : PubMed/NCBI
|
|
7
|
Ding CF, Chen WQ, Zhu YT, Bo YL, Hu HM and
Zheng RH: Circulating microRNAs in patients with polycystic ovary
syndrome. Hum Fertil (Camb). 18:22–29. 2015. View Article : Google Scholar
|
|
8
|
Xu B, Zhang YW, Tong XH and Liu YS:
Characterization of microRNA profile in human cumulus granulosa
cells: Identification of microRNAs that regulate Notch signaling
and are associated with PCOS. Mol Cell Endocrinol. 404:26–36. 2015.
View Article : Google Scholar : PubMed/NCBI
|
|
9
|
Kaur S, Archer KJ, Devi MG, Kriplani A,
Strauss JF III and Singh R: Differential gene expression in
granulosa cells from polycystic ovary syndrome patients with and
without insulin resistance: Identification of susceptibility gene
sets through network analysis. J Clin Endocrinol Metab.
97:E2016–E2021. 2012. View Article : Google Scholar : PubMed/NCBI
|
|
10
|
Liu HY, Liu JQ, Mai ZX and Zeng YT: A
subpathway-based method of drug reposition for polycystic ovary
syndrome. Reprod Sci. 22:423–430. 2015. View Article : Google Scholar
|
|
11
|
Liu HY, Huang YL, Liu JQ and Huang Q:
Transcription factor microRNA synergistic regulatory network
revealing the mechanism of polycystic ovary syndrome. Mol Med Rep.
13:3920–3928. 2016. View Article : Google Scholar : PubMed/NCBI
|
|
12
|
Bohler A, Wu G, Kutmon M, Pradhana LA,
Coort SL, Hanspers K, Haw R, Pico AR and Evelo CT: Reactome from a
WikiPathways perspective. PLoS Comput Biol. 12:e10049412016.
View Article : Google Scholar : PubMed/NCBI
|
|
13
|
Wu G, Dawson E, Duong A, Haw R and Stein
L: ReactomeFIViz: A Cytoscape app for pathway and network-based
data analysis. F1000Res. 3:1462014.PubMed/NCBI
|
|
14
|
Edgar R, Domrachev M and Lash AE: Gene
Expression Omnibus: NCBI gene expression and hybridization array
data repository. Nucleic Acids Res. 30:207–210. 2002. View Article : Google Scholar :
|
|
15
|
Mitra PS, Ghosh S, Zang S, Sonneborn D,
Hertz-Picciotto I, Trnovec T, Palkovicova L, Sovcikova E,
Ghimbovschi S, Hoffman EP, et al: Analysis of the toxicogenomic
effects of exposure to persistent organic pollutants (POPs) in
Slovakian girls: Correlations between gene expression and disease
risk. Environ Int. 39:188–199. 2012. View Article : Google Scholar : PubMed/NCBI
|
|
16
|
Gautier L, Cope L, Bolstad BM and Irizarry
RA: affy - analysis of Affymetrix GeneChip data at the probe level.
Bioinformatics. 20:307–315. 2004. View Article : Google Scholar : PubMed/NCBI
|
|
17
|
Gentleman RC, Carey VJ, Bates DM, Bolstad
B, Dettling M, Dudoit S, Ellis B, Gautier L, Ge Y, Gentry J, et al:
Bioconductor: Open software development for computational biology
and bioinformatics. Genome Biol. 5:R802004. View Article : Google Scholar : PubMed/NCBI
|
|
18
|
Liu J, Yang XY and Shi WJ: Identifying
differentially expressed genes and pathways in two types of
non-small cell lung cancer: Adenocarcinoma and squamous cell
carcinoma. Genet Mol Res. 13:95–102. 2014. View Article : Google Scholar : PubMed/NCBI
|
|
19
|
Szekely GJ and Rizzo ML: Hierarchical
clustering via joint between-within distances: Extending Ward's
minimum variance method. J Classif. 22:151–183. 2005. View Article : Google Scholar
|
|
20
|
Bindea G, Mlecnik B, Hackl H, Charoentong
P, Tosolini M, Kirilovsky A, Fridman WH, Pagès F, Trajanoski Z and
Galon J: ClueGO: A Cytoscape plug-in to decipher functionally
grouped gene ontology and pathway annotation networks.
Bioinformatics. 25:1091–1093. 2009. View Article : Google Scholar : PubMed/NCBI
|
|
21
|
Bindea G, Galon J and Mlecnik B: CluePedia
Cytoscape plugin: Pathway insights using integrated experimental
and in silico data. Bioinformatics. 29:661–663. 2013. View Article : Google Scholar : PubMed/NCBI
|
|
22
|
Thissen D and Kuang D: Quick and easy
implementation of the Benjamini-Hochberg procedure for controlling
the false positive rate in multiple comparisons. J Educ Behav Stat.
27:77–83. 2002. View Article : Google Scholar
|
|
23
|
Luo W and Brouwer C: Pathview: An
R/Bioconductor package for pathway-based data integration and
visualization. Bioinformatics. 29:1830–1831. 2013. View Article : Google Scholar : PubMed/NCBI
|
|
24
|
Barabási AL, Gulbahce N and Loscalzo J:
Network medicine: A network-based approach to human disease. Nat
Rev Genet. 12:56–68. 2011. View
Article : Google Scholar :
|
|
25
|
Guzzi PH and Mina M: AlignMCL: Comparative
analysis of protein interaction networks through Markov clustering.
IEEE International Conference on Bioinformatics and Biomedicine
Workshops. 174–181. 2012.
|
|
26
|
Joshi-Tope G, Gillespie M, Vastrik I,
D'Eustachio P, Schmidt E, de Bono B, Jassal B, Gopinath GR, Wu GR,
Matthews L, et al: Reactome: A knowledgebase of biological
pathways. Nucleic Acids Res. 33:D428–D432. 2005. View Article : Google Scholar :
|
|
27
|
Schaefer CF, Anthony K, Krupa S, Buchoff
J, Day M, Hannay T and Buetow KH: PID: The pathway interaction
database. Nucleic Acids Res. 37:D674–D679. 2009. View Article : Google Scholar :
|
|
28
|
Mi H and Thomas P: PANTHER pathway: An
ontology-based pathway database coupled with data analysis tools.
Methods Mol Biol. 563:123–140. 2009. View Article : Google Scholar : PubMed/NCBI
|
|
29
|
Glintborg D and Andersen M: An update on
the pathogenesis, inflammation, and metabolism in hirsutism and
polycystic ovary syndrome. Gynecol Endocrinol. 26:281–296. 2010.
View Article : Google Scholar : PubMed/NCBI
|
|
30
|
Ojeda-Ojeda M, Murri M, Insenser M and
Escobar-Morreale HF: Mediators of low-grade chronic inflammation in
polycystic ovary syndrome (PCOS). Curr Pharm Des. 19:5775–5791.
2013. View Article : Google Scholar : PubMed/NCBI
|
|
31
|
Kovács M, Németh T, Jakus Z, Sitaru C,
Simon E, Futosi K, Botz B, Helyes Z, Lowell CA and Mócsai A: The
Src family kinases Hck, Fgr, and Lyn are critical for the
generation of the in vivo inflammatory environment without a direct
role in leukocyte recruitment. J Exp Med. 211:1993–2011. 2014.
View Article : Google Scholar : PubMed/NCBI
|
|
32
|
Scapini P, Pereira S, Zhang H and Lowell
CA: Multiple roles of Lyn kinase in myeloid cell signaling and
function. Immunol Rev. 228:23–40. 2009. View Article : Google Scholar : PubMed/NCBI
|
|
33
|
Toubiana J, Rossi AL, Belaidouni N,
Grimaldi D, Pene F, Chafey P, Comba B, Camoin L, Bismuth G,
Claessens YE, et al: Src-family-tyrosine kinase Lyn is critical for
TLR2-mediated NF-κB activation through the PI 3-kinase signaling
pathway. Innate Immun. 21:685–697. 2015. View Article : Google Scholar : PubMed/NCBI
|
|
34
|
Wieser V, Moschen AR and Tilg H:
Inflammation, cytokines and insulin resistance: A clinical
perspective. Arch Immunol Ther Exp (Warsz). 61:119–125. 2013.
View Article : Google Scholar
|
|
35
|
DeUgarte CM, Bartolucci AA and Azziz R:
Prevalence of insulin resistance in the polycystic ovary syndrome
using the homeostasis model assessment. Fertil Steril.
83:1454–1460. 2005. View Article : Google Scholar : PubMed/NCBI
|
|
36
|
Stankiewicz TR and Linseman DA: Rho family
GTPases: Key players in neuronal development, neuronal survival,
and neurodegeneration. Front Cell Neurosci. 8:3142014. View Article : Google Scholar : PubMed/NCBI
|
|
37
|
Liu X, Yan F, Yao H, Chang M, Qin J, Li Y,
Wang Y and Pei X: Involvement of RhoA/ROCK in insulin secretion of
pancreatic β-cells in 3D culture. Cell Tissue Res. 358:359–369.
2014. View Article : Google Scholar : PubMed/NCBI
|
|
38
|
Kanda T, Wakino S, Homma K, Yoshioka K,
Tatematsu S, Hasegawa K, Takamatsu I, Sugano N, Hayashi K and
Saruta T: Rho-kinase as a molecular target for insulin resistance
and hypertension. FASEB J. 20:169–171. 2006.
|
|
39
|
Sewer MB and Li D: Regulation of
adrenocortical steroid hormone production by RhoA-diaphanous 1
signaling and the cytoskeleton. Mol Cell Endocrinol. 371:79–86.
2013. View Article : Google Scholar
|
|
40
|
Vogt DL, Gray CD, Young WS III, Orellana
SA and Malouf AT: ARHGAP4 is a novel RhoGAP that mediates
inhibition of cell motility and axon outgrowth. Mol Cell Neurosci.
36:332–342. 2007. View Article : Google Scholar : PubMed/NCBI
|
|
41
|
Kim S, Dangelmaier C, Bhavanasi D, Meng S,
Wang H, Goldfinger LE and Kunapuli SP: RhoG protein regulates
glycoprotein VI-Fc receptor γ-chain complex-mediated platelet
activation and thrombus formation. J Biol Chem. 288:34230–34238.
2013. View Article : Google Scholar : PubMed/NCBI
|
|
42
|
Rajendran S, Willoughby SR, Chan WPA,
Liberts EA, Heresztyn T, Saha M, Marber MS, Norman RJ and Horowitz
JD: Polycystic ovary syndrome is associated with severe platelet
and endothelial dysfunction in both obese and lean subjects.
Atherosclerosis. 204:509–514. 2009. View Article : Google Scholar
|
|
43
|
Stokes KY and Granger DN: Platelets: A
critical link between inflammation and microvascular dysfunction. J
Physiol. 590:1023–1034. 2012. View Article : Google Scholar :
|
|
44
|
Salvetti NR, Gimeno EJ, Lorente JA and
Ortega HH: Expression of cytoskeletal proteins in the follicular
wall of induced ovarian cysts. Cells Tissues Organs. 178:117–125.
2004. View Article : Google Scholar : PubMed/NCBI
|
|
45
|
Cortón M, Botella-Carretero JI, Benguría
A, Villuendas G, Zaballos A, San Millán JL, Escobar-Morreale HF and
Peral B: Differential gene expression profile in omental adipose
tissue in women with polycystic ovary syndrome. J Clin Endocrinol
Metab. 92:328–337. 2007. View Article : Google Scholar
|
|
46
|
Ober C, Weil S, Steck T, Billstrand C,
Levrant S and Barnes R: Increased risk for polycystic ovary
syndrome associated with human leukocyte antigen
DQA1*0501. Am J Obstet Gynecol. 167:1803–1806. 1992.
View Article : Google Scholar : PubMed/NCBI
|
|
47
|
Kaibe M, Takakuwa K, Murakawa H, Ishii K,
Tamura M and Tanaka K: Studies on the human leukocyte antigens in
patients with polycystic ovary syndrome in a Japanese population -
possible susceptibility of HLA-A11 and -DRB1*0403 to
patient population with polycystic ovary syndrome. Am J Reprod
Immunol. 55:301–306. 2006. View Article : Google Scholar : PubMed/NCBI
|
|
48
|
Ozteki O, Fenkci SM, Fenkci V, Enli Y and
Cabus U: Serum HLA-G levels in women with polycystic ovary
syndrome. Gynecol Endocrinol. 31:243–246. 2015. View Article : Google Scholar
|
|
49
|
Strodthoff D, Ma Z, Wirström T,
Strawbridge RJ, Ketelhuth DF, Engel D, Clarke R, Falkmer S, Hamsten
A, Hansson GK, et al: Toll-like receptor 3 influences glucose
homeostasis and β-cell Insulin Secretion. Diabetes. 64:3425–3438.
2015. View Article : Google Scholar : PubMed/NCBI
|
|
50
|
Hemmati F, Ghasemi R, Mohamed Ibrahim N,
Dargahi L, Mohamed Z, Raymond AA and Ahmadiani A: Crosstalk between
insulin and Toll-like receptor signaling pathways in the central
nervous system. Mol Neurobiol. 50:797–810. 2014. View Article : Google Scholar : PubMed/NCBI
|