Introduction
Myocardial infarction is one of the most prevalent
medical conditions worldwide (1).
Pathological damage caused by myocardial infarction often results
in irreversible injury to myocardial cells (2). This damage grossly affects cardiac
function, due to the markedly decreased number of cardiomyocytes.
The low capacity of adult cardiomyocytes to undergo proliferation
and differentiation is the main reason why myocardial infarction
cannot be repaired. The concept that hypertrophy, but not
proliferation, of cardiomyocytes occurs under some
pathophysiological conditions after birth has long been accepted
(3). However, recent evidence has
challenged this notion. Poss et al investigated myocardial
generative capacity using a ventricular resection model, and
observed that adult myocardial proliferation may exist in adult
teleosts, including zebrafish (4). In addition, Porrello et al
reported that excising partial cardiomyocytes at the apical portion
of the heart in 24-h-old mice could stimulate cardiomyocytes to
repair the damaged region (5),
whereas Naqvi et al demonstrated that a surge of thyroid
hormones during preadolescence may serve an important role in
myocardial proliferation (6).
These phenomena indicate that adult mammalian myocardial
proliferation may be driven through physiological or pathological
stimulation. Furthermore, Mollova et al observed that
cardiomyocytes exhibited increased proliferative potential in
10-year-old children compared with in adults (7). Therefore, analyzing and
investigating the gene expression profile of cardiomyocytes in the
postnatal period may enhance our current understanding of the
molecular mechanisms underlying the limited proliferative capacity
of cardiomyocytes in myocardial growth arrest.
Gan et al conducted an integrative analysis
of the developing postnatal mouse heart transcriptome by comparing
2- and 13-day-old postnatal mouse hearts (8), which reflect the dividing and
growth-arresting phases of cardiomyocytes, respectively. The
results revealed that GATA binding protein 4, myosin heavy chain 7
and insulin like growth factor 1 receptor (IGF1R) may act on
the gene interaction network, whereas taspase 1, transducer of
ERBB2, 1, chromosome 1 open reading frame 61, allograft
inflammatory factor 1, Rho associated coiled-coil containing
protein kinase 1, trefoil factor 2 and microRNA-503-5p were the key
drivers inhibiting cardiomyocyte proliferation. Another study by
Naqvi et al reported that mice exhibited a burst of
cardiomyocyte proliferation during early preadolescent development,
between 7 and 15 days of life, which was regulated by the thyroid
hormone/IGF1/IGF1R/protein kinase B (AKT) pathway (6). Therefore, based on the physiological
characteristics of mouse cardiomyocytes, 13-day-old mice may not
fully reflect either the growth-arrested stage or the proliferative
burst phase. To better elucidate the mechanisms and pathways
involved in myocardial growth and arrest, the present study
analyzed the differentially expressed genes in mouse hearts
obtained from 24-h-old mice, which contain proliferative
cardiomyocytes (5,6); 7-day-old mice, in which
cardiomyocytes are undergoing a proliferative burst (6); and 10-week-old mice, which contain
growth-arrested cardiomyocytes (6).
Furthermore, Gene Ontology (GO) annotation, pathway
enrichment and series test of cluster (STC) were conducted to
investigate the proliferative and growth-arresting phases of
cardiomyocytes from numerous perspectives. Furthermore, the signal
transduction pathway associated with the cell cycle was identified,
in order to characterize the network involved in the phenomenon of
myocardial cell cycle arrest. Elucidating the molecular-genetic
alterations involved in the proliferative, proliferative burst and
growth-arrest phases of cardiomyocytes may enable the
identification of potential signaling factors that can induce the
regeneration of cardiomyocytes in heart disease.
Materials and methods
Animal sample collection
Pregnant C57BL/6 mice (n=9; age, 10–11 weeks;
weight, 25–30 g) were purchased from the National Institutes for
Food and Drug Control (Beijing, China) and were quality inspected
by the National Quality Inspection Center of Experimental Animals
(Beijing, China). All mice were maintained at 22°C and 55% relative
humidity under a 12-h light/dark cycle with free access to normal
food and water. Mice were maintained according to the protocols of
the National Science Council of the People's Republic of China
(Beijing, China). In the present study, all of the mice used at 24
h (n=9; weight, 1–2 g) and 7 days (n=9; weight, 3.5–5 g) of age
were delivered from 9 pregnant mice (10-week group) through
eutocia. Each time-point included three parallel samples, and each
sample consisted of three mouse hearts. The 18 hearts from 24-h-
and 7-day-old mice were obtained from the 9 10-week-old pregnant
mice. The mice were sacrificed by cervical dislocation following
mild sedation with isoflurane. Whole hearts were harvested from
24-h-old, 7-day-old and 10-week-old mice. Ventricular myocardial
samples were immediately dissected from the whole hearts for total
RNA isolation following several washes with D-Hanks solution. The
present study was approved by the Tianjin Medical University Animal
Care and Use Committee (Tianjin, China), and all animal experiments
were performed according to the Guidelines for Animal Experiments
of the Tianjin Medical University, 2014 revision.
Total RNA isolation and gene expression
analysis by microarray
RNA was extracted from the cardiac tissues using
TRIzol® reagent (Invitrogen; Thermo Fisher Scientific,
Inc., Waltham, MA, USA), according to the manufacturer's protocol,
and subsequent purification was conducted using an RNeasy kit
(Qiagen Sciences, Inc., Germantown, MD, USA). cDNA was generated
using One-Cycle Target labeling and control reagents (first-strand
cDNA was incubated in the thermocycler at 25°C for 1 h, 42°C for 1
h, 4°C for 2 min; second-strand cDNA was incubated in the
thermocycler at 16°C for 1 h, 65°C for 1 min, 4°C for 2 min), and
cRNA was generated using a GeneChip IVT labeling kit (both
Affymetrix; Thermo Fisher Scientific, Inc.). Biotin-labeled,
fragmented (≤200 nt) cRNA was hybridized for 16 h at 45°C to
Affymetrix GeneChip Mouse Gene 2.0 arrays (Affymetrix; Thermo
Fisher Scientific, Inc.). The GeneChips were washed and stained
using the Affymetrix Fluidics Station 450 (Affymetrix; Thermo
Fisher Scientific, Inc.), and were scanned using
Affymetrix® GeneChip Command Console, installed in the
GeneChip® Scanner 3000 7G (Affymetrix; Thermo Fisher
Scientific, Inc.). The data were analyzed with the Robust Multichip
Analysis (RMA) algorithm using Affymetrix default analysis settings
and global scaling as the normalization method. Values are
presented as log2 RMA signal intensity.
Reverse transcription-quantitative
polymerase chain reaction (RT-qPCR)
RT-qPCR was used to verify microarray results using
the same RNA samples as used for the microarray analyses. The
primer sequences used in the present study are listed in Table I. Briefly, total purified RNA was
reverse-transcribed using the SuperScript III First-Strand
Synthesis system (Invitrogen; Thermo Fisher Scientific, Inc.). RNA
was incubated in the thermocycler at 44°C for 1 h, 92°C for 10 min
to inactivate the reverse transcriptase. RT-qPCR was performed
using SYBR-Green PCR mix and was run on the ABI 7300 Real-Time PCR
system (both Applied Biosystems; Thermo Fisher Scientific, Inc.).
The reactions were performed in triplicate in a total volume of 25
μl. The cycling conditions consisted of an initial, single
cycle of 5 min at 95°C, followed by 40 cycles of 30 sec at 95°C, 30
sec at 54°C, 15 sec at 72°C, and fluorescence acquisition at 83°C
for 1 sec. A melting curve analysis (60–95°C) was used to assess
amplification specificity. The relative expression levels of each
gene were determined using the 2−ΔΔCq method (9). Statistical analyses were performed
as described for the microarray data. Pearson's correlation
coefficient was further calculated for each gene using the
normalized data to quantify the consistency between microarray
experiments and RT-qPCR (P<0.05 and R>0.9).
 | Table IPrimer sequences. |
Table I
Primer sequences.
| Gene | Primer sequence (5′
to 3′) |
|---|
| BMP1 | F:
ATCCAGGTGTCTGAGGGTTTCC |
| R:
GACTTCCAGGTAGTCGTAGGCA |
| CCNE2 | F:
GTACTGTCTGGAGGAATCAGCC |
| R:
CCAAACCTCCTGTGAACATGCC |
| IGF1 | F:
GTGGATGCTCTTCAGTTCGTGTG |
| R:
TCCAGTCTCCTCAGATCACAGC |
| CDC20 | F:
GATGGACGACATCTGGCAAGTG |
| R:
GTTGCCAGGATATTGGACTGCC |
| PLK1 | F:
CCATCTTCTGGGTCAGCAAGTG |
| R:
CCGTCATTGTAGAGAATCAGGCG |
| CDC25C | F:
AACTCCACGACTCGGCAAACCT |
| R:
GTAGTAAGCGGAGAGGCAGACA |
| MYC | F:
TCGCTGCTGTCCTCCGAGTCC |
| R:
GGTTTGCCTCTTCTCCACAGAC |
| CCNG1 | F:
GCGTTGGAGATCCAAGCACTGA |
| R:
GGAAACAAGCTCTTGCCAGAAGG |
| FGF1 | F:
CCAAGGAAACGTCCACAGTCAG |
| R:
ACGGCTGAAGACATCCTGTCTC |
Multi-class classification
The random variance model (RVM) F-test, which is
commonly used to compare >2 groups, was applied to filter the
differentially expressed genes for the control and experimental
groups, since the RVM F-test effectively increases the degrees of
freedom in cases of small samples. After analysis of significance
and false discovery rate (FDR) analysis using BRB-ArrayTools
version 3.0 [http://linus.nci.nih.gov/BRB-ArrayTools.html (10)], the differentially expressed genes
were selected according to the P-value threshold (P-value <0.05,
FDR <0.05, fold change ≥1.5) (10–12).
Cluster analysis
Genesis suite was used for cluster analysis
(13). The hierarchical
clustering tab was used for hierarchical clustering of the data in
the present study. Hierarchical clustering is a powerful and useful
method used to analyze large genomic datasets. Cluster analysis
performs four types of binary, agglomerative and hierarchical
clustering. The basic aim is to assemble a set of items (genes or
arrays) into a tree, where similar items are joined through short
branches and increasingly longer branches as the similarity between
items decreases. The first step in hierarchical clustering is to
calculate the distance matrix between the gene expression data.
Once this matrix of distances is computed, clustering is initiated.
Agglomerative hierarchical processing includes repeated cycles,
where the two closest remaining items (those with the smallest
distance) are joined by a node/branch of a tree, with the length of
the branch set to the distance between the joined items. The two
joined items are removed from a list of items processed and
replaced by an item that represents the new branch. The distances
between this new item and all other remaining items are computed,
and the process is repeated until only a single item remains.
GO analysis
GO analysis was applied to analyze the main function
of the differentially expressed genes according to GO, which is the
key functional classification of the National Centers for
Biotechnology Information that organizes genes into hierarchical
categories and can be used to identify the gene regulatory network
on the basis of biological process and molecular function (14,15).
Specifically, two-side Fisher's exact test and
χ2 test were used to classify the GO category, and the
FDR (16) was calculated to
correct the P-value; the smaller the FDR, the smaller the error in
judging the P-value. The FDR was defined as FDR = 1 −
Nk / T, where Nk refers
to the number of Fisher's test P-values less than χ2
test P-values. P-values were computed for the GO terms of all the
differentially expressed genes. Enrichment provides a measure of
the significance of the function; as the enrichment increases, the
corresponding function is more specific, which helps to identify
the GO terms with more concrete functions in the experiment. Within
the significant category, the enrichment Re was given by: Re =
(nf / n) / (Nf /
N) where 'nf' is the number of flagged
genes within the particular category, 'n' is the total
number of genes within the same category, 'Nf' is
the number of flagged genes in the entire microarray, and
'N' is the total number of genes in the microarray (17).
Pathway analysis
Pathway analysis was used to identify the
significant pathways of the differentially expressed genes
according to Kyoto Encyclopedia of Genes and Genomes [KEGG
(18–20)], Biocarta (19,20) and Reactome (20). Fisher's exact test and the
χ2 test were used to select the significant pathways,
and the threshold of significance was defined according to the
P-value and FDR. The enrichment Re was calculated as aforementioned
(18–20).
STC analysis
According to the RVM corrective analysis,
differentially expressed genes were selected at a logical sequence.
In accordance with the different signal density alteration
tendencies of genes under different situations, a set of unique
model expression tendencies were identified. The raw expression
values were converted into a log2 ratio. Using a strategy for
clustering short time-series gene expression data, some unique
profiles were defined. The expression model profiles are associated
with the actual or expected number of genes assigned to each model
profile. Significant profiles have higher probability than expected
according to Fisher's exact test and multiple comparison tests
(21,22).
Signal-net analysis
The gene-gene interaction network was constructed
based on the data for differentially expressed genes. Using Java
(23), which enables users to
build and analyze molecular networks, the network maps were
constructed. For example, if there was confirmatory evidence that
two genes interacted, then an interaction edge was assigned between
the two genes. The considered evidence included the source of the
interaction database from KEGG. The networks were stored and
presented as graphs, where the nodes primarily represent genes
(protein, compound, etc.) and the edges represent relation types
between the nodes, e.g., activation or phosphorylation. The
networks were examined using the powerful tools implemented in R
(24).
To investigate the global network, the most
important nodes were identified. To this end, connectivity, also
known as degree, was defined as the sum of connection strengths
between the network genes: where Ki is the sum of
connection strengths between the network genes;
aui represents the weight relations between gene
i and gene j.
In gene networks, connectivity measures how
correlated a gene is with the other network genes. For a gene in
the network, the number of source genes of a gene is known as the
in-degree and the number of target genes of a gene is known as the
out-degree. The character of genes is described using 'betweenness'
and centrality measures, which reflect the importance of a node in
a graph relative to other nodes. For a graph G:(V, E) with n
vertices, the relative 'betweenness' centrality
C′B(V) is defined according to the
following equation: where σst is the
number of shortest paths from s to t, and σst(V)
is the number of shortest paths from s to t that pass through a
vertex v (24–28).
Results
Global gene expression analysis of 24-h-,
7-day- and 10-week-old mouse hearts
Affymetrix Mouse Gene 1.0 ST microarray chips were
used to generate the transcriptome profiles of 24-h-, 7-day- and
10-week-old mouse hearts, and 35,557 transcripts were presented in
the global gene expression profiles. To reduce selection bias, the
RVM was used to modify the F-test to calculate the level of
significant difference (P-value), and the FDR was used to obtain
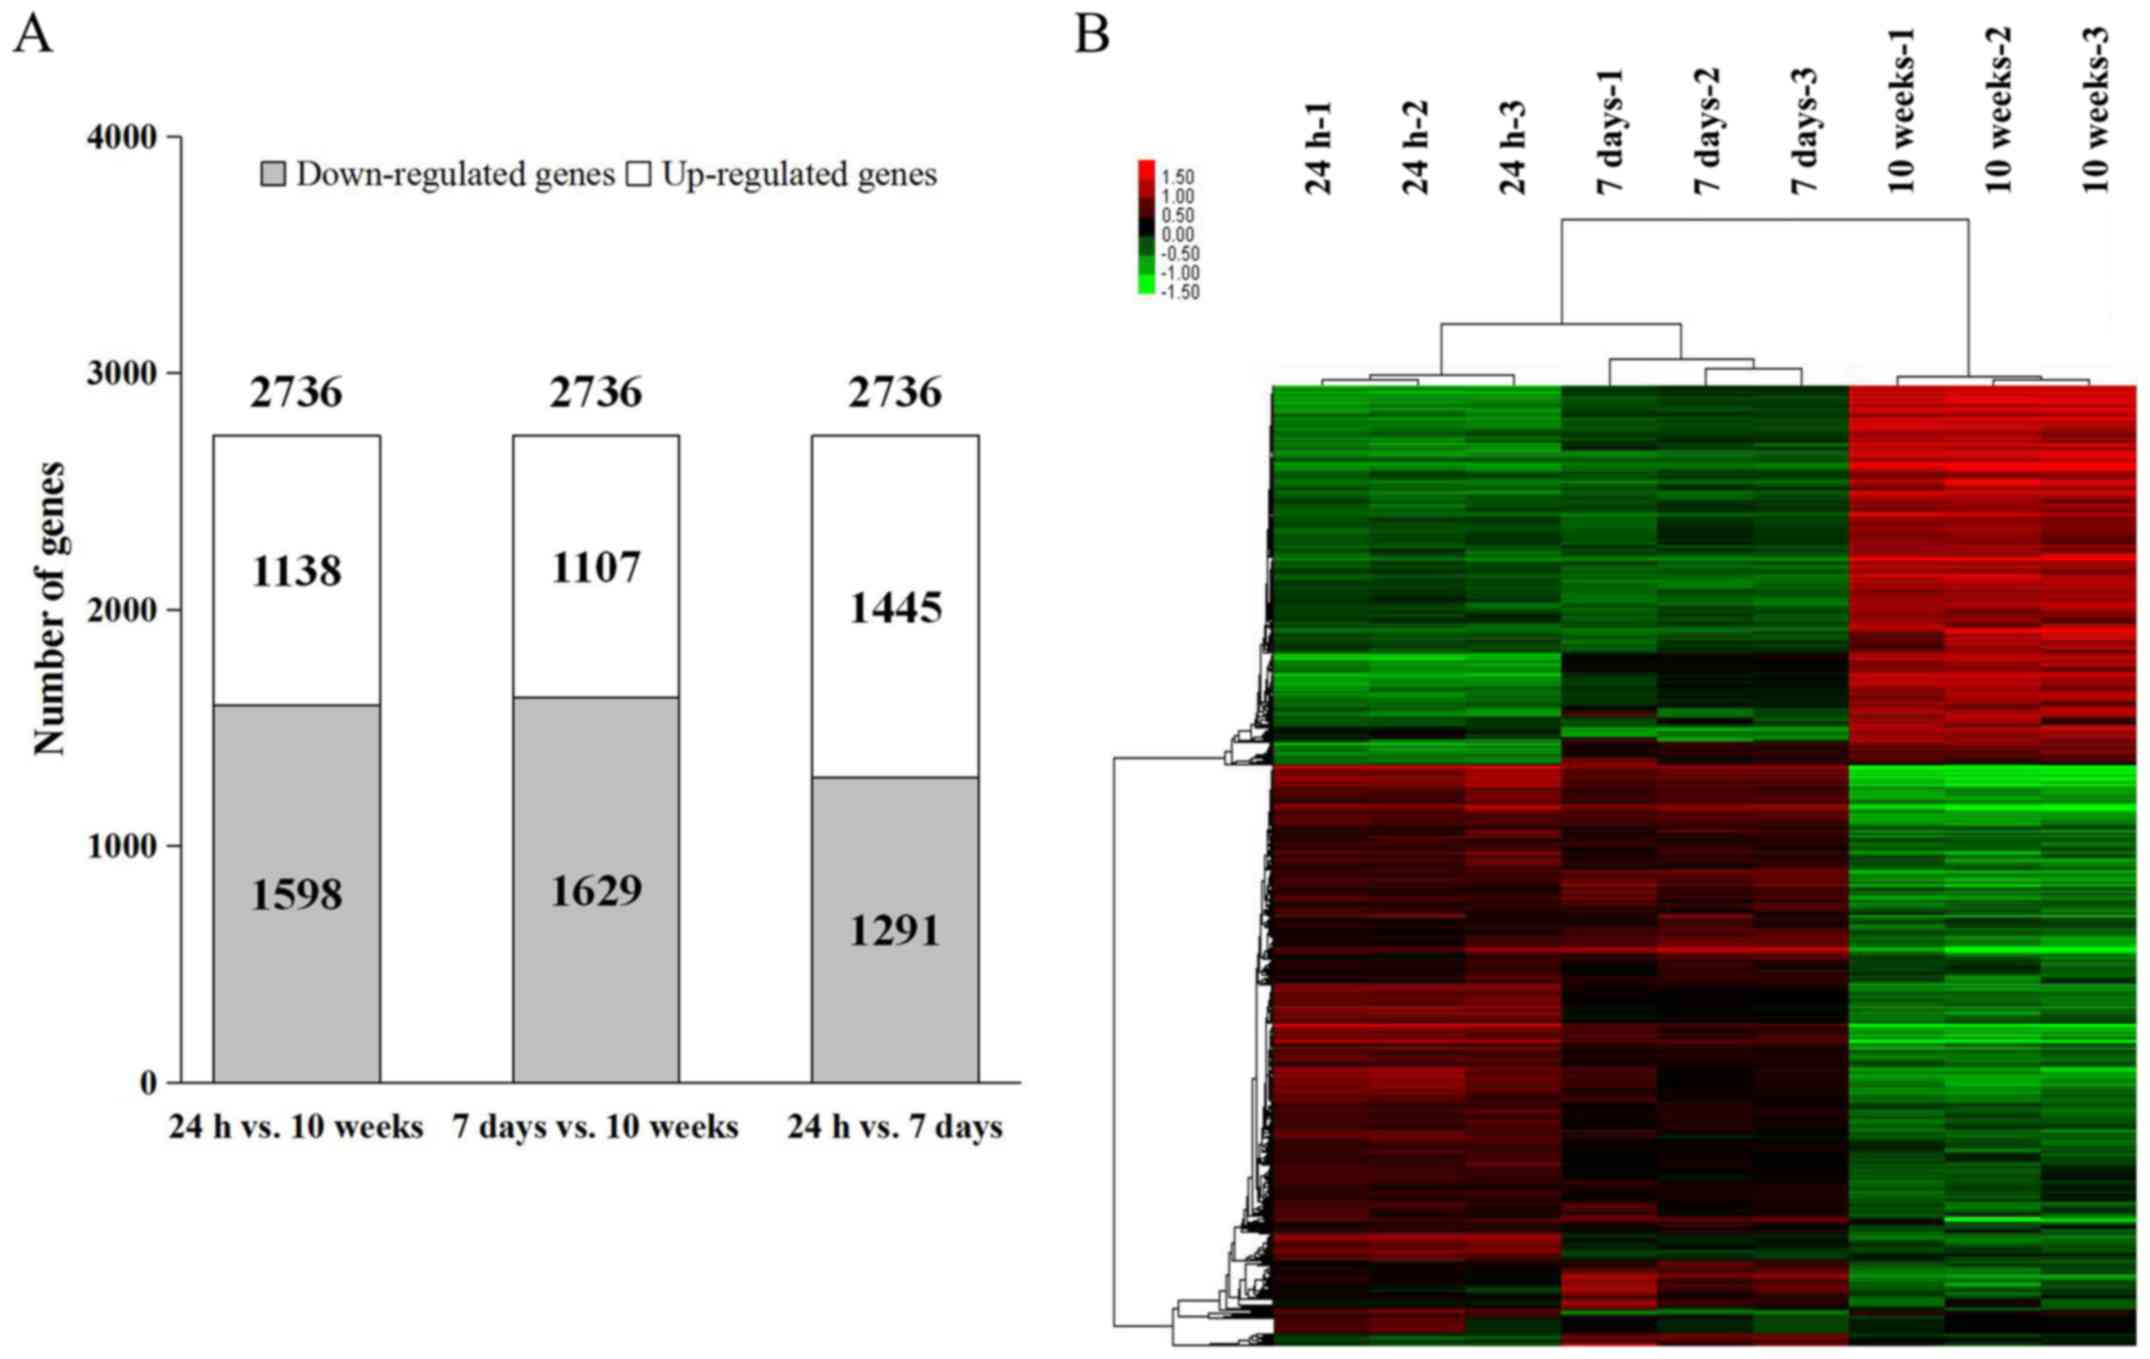
the differentially expressed genes. A total of 2,736 differentially
expressed genes were selected according to the threshold of
P<0.05, FDR<0.05, and fold-change ≥1.5 in 24-h-, 7-day- and
10-week-old mouse hearts. A comparison between 24-h- and 7-day-old
mouse hearts demonstrated a larger proportion of upregulated genes
(1,445 upregulated genes vs. 1,291 downregulated genes), whereas
the other pairwise comparisons of the groups (24-h- vs. 10-week-old
hearts and 7-day- vs. 10-week-old hearts) revealed that the
downregulated genes accounted for the majority of expression
alterations (Fig. 1A). Using the
hierarchical clustering tab, a clear separation between 24-h-,
7-day- and 10-week-old mouse heart samples was observed among the
2,736 differentially expressed transcripts (Fig. 1B). These results suggested that
the differences between the three groups were predominant, and not
strongly affected by biological variations and differences within
the groups. Therefore, 2,736 differentially expressed genes,
accounting for 7.69% of the 35,557 identified transcripts, were
selected for further analysis.
Significant functional annotation of the
differentially expressed genes
To understand the significant functional alterations
in the differentially expressed genes, a GO analysis was conducted,
which matches the functional annotation to each gene based on
cellular component, molecular function and biological process.
Subsequently, using Fisher's test and multiple comparison tests,
the P-value (significance level) of each functional annotation was
obtained. The standard of significant screening was set at
P<0.001. A total of 357 significant categories were identified
from the GO analysis. The top 10 categories are presented in
Fig. 2A. The results demonstrated
that with increasing age, the differentially expressed genes were
involved in 'cell cycle', 'cell division', 'mitosis', 'metabolic
process', 'oxidation-reduction process', 'regulation of
transcription, DNA-dependent', and 'protein phosphorylation'. These
results indicated that the progressive loss of proliferative
potential of cardiomyocytes reflects multifunctional and
multisystem co-regulation.
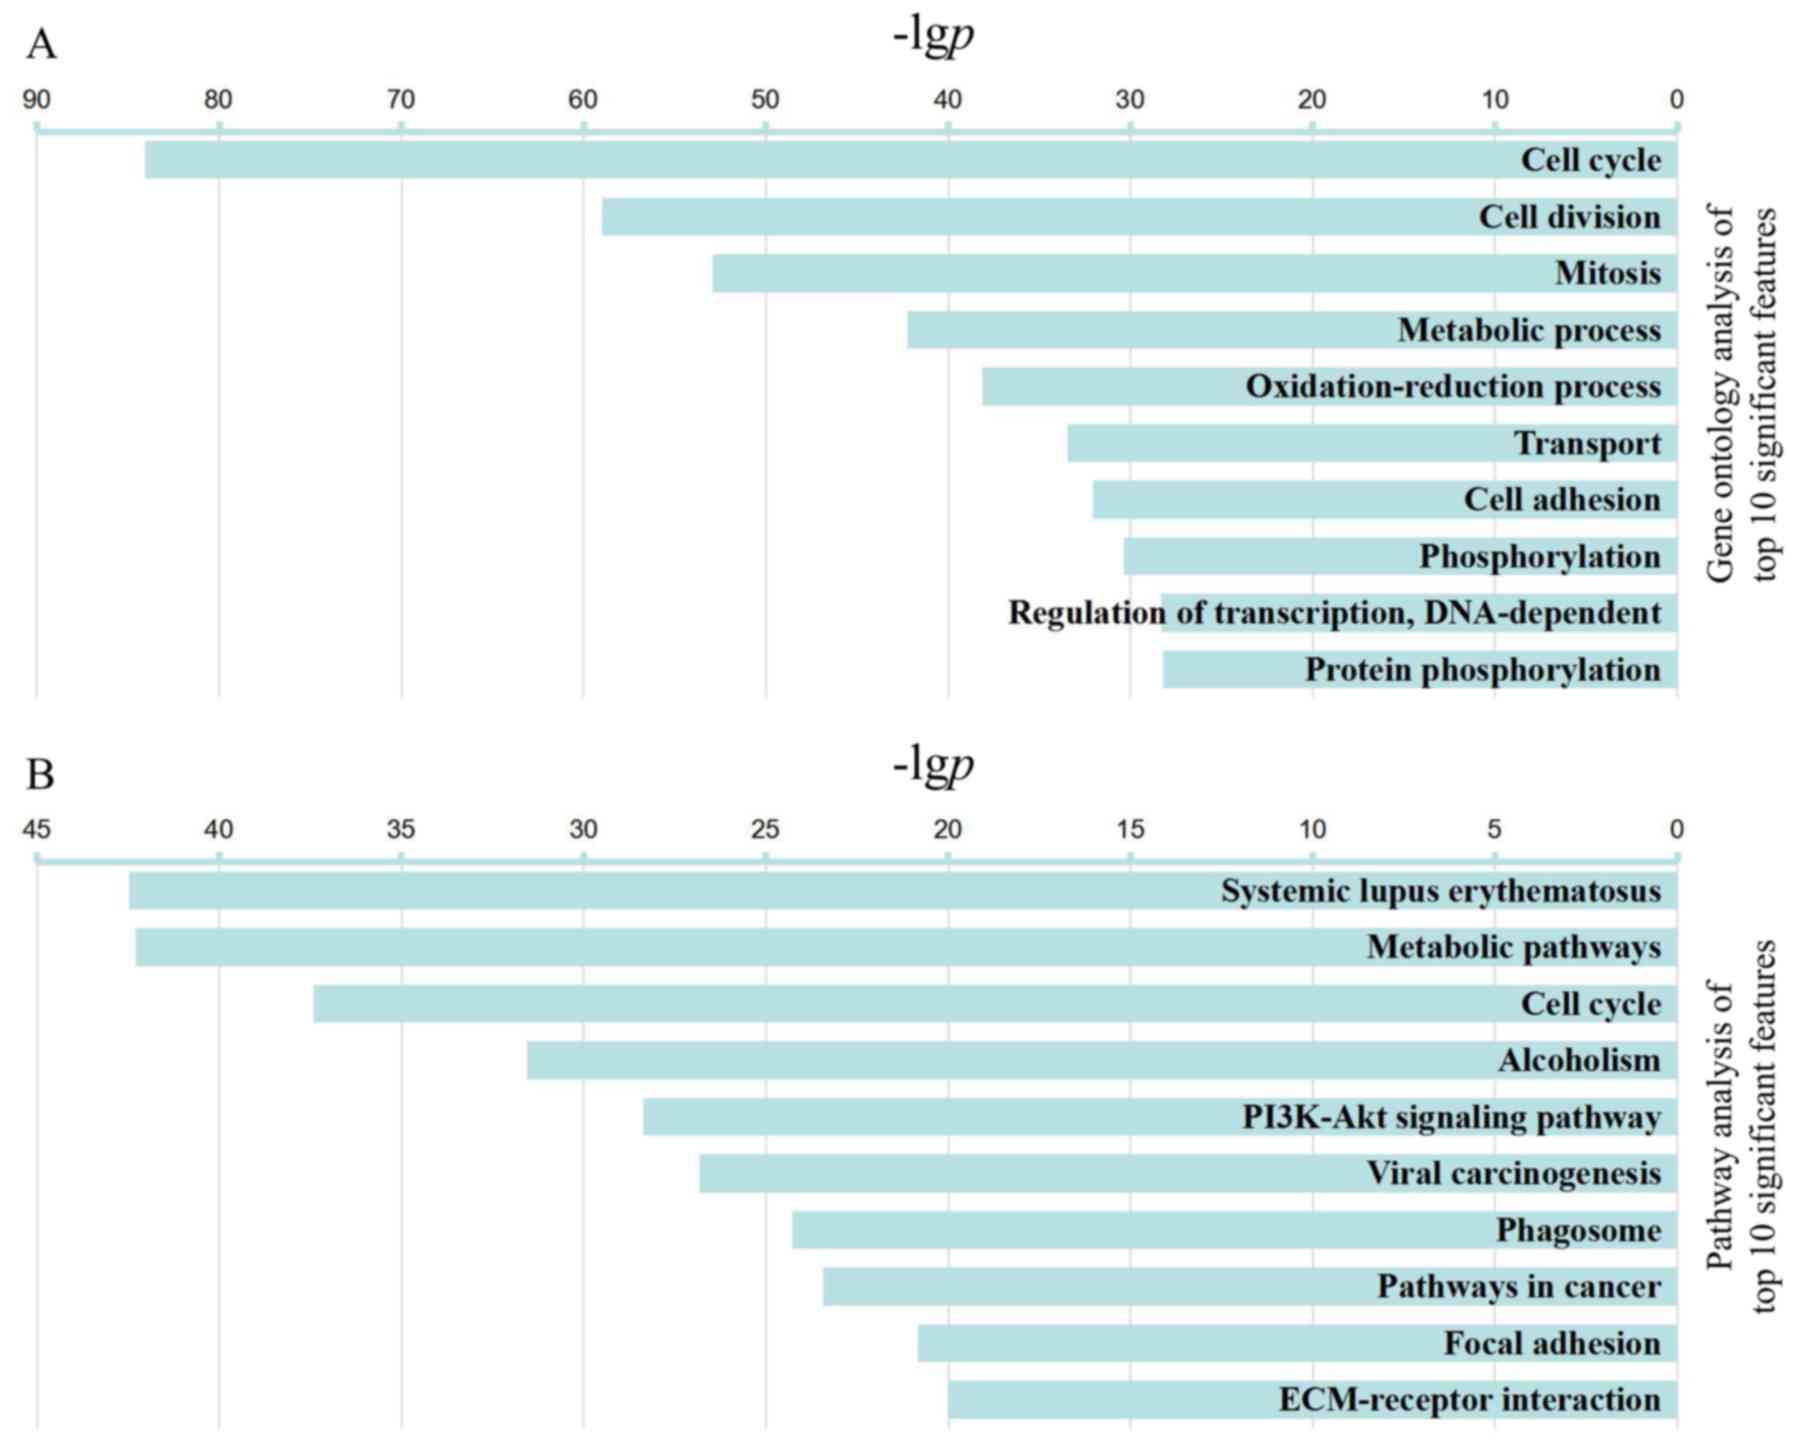 | Figure 2Top 10 significant GO functions
(P<6E-29, FDR<3E-26) and pathways (P<10E-21, FDR
<2.5E-19). (A) Representative GO annotations. With increasing
age, the following enriched GO categories were identified: 'cell
cycle', 'cell division', 'mitosis', 'metabolic process',
'oxidation-reduction process', 'transport', 'cell adhesion',
'phosphorylation', 'regulation of transcription, DNA-dependent' and
'protein phosphorylation'. (B) Representative pathways. With
increasing age, the following enriched pathway categories were
identified; 'systemic lupus erythematosus', 'metabolic pathways',
'cell cycle', 'alcoholism', 'PI3K-AKT signaling pathway', 'viral
carcinogenesis', 'phagosome', 'pathways in cancer', 'focal
adhesion' and 'ECM-receptor interaction'. The -lgp is displayed on
the x-axis. The greater the -lgp, the higher the significance. GO,
Gene Ontology; KEGG, Kyoto Encyclopedia of Genes and Genomes. |
Signal transduction pathways associated
with the differentially expressed genes
Using KEGG, Biocarta and Reactome databases, the
pathways were identified according to systematic relationships,
functions and genomic information of the differentially expressed
genes. Fisher's test and the χ2 test were used to
calculate the P-values, in order to identify the significant signal
transduction pathways. A total of 161 significant pathways were
identified in the pathway analysis (P<0.05). The 10 most
significant pathways are listed in Fig. 2B, including classical 'cell
cycle', and proliferation pathways, including 'PI3K-AKT signaling
pathway'. 'metabolic pathways' and 'alcoholism'. In addition,
pathways associated with the immune system were significantly
enriched, which included 'systemic lupus erythematosus', 'viral
carcinogenesis', 'phagosome' and 'focal adhesion'. In addition, the
'ECM-receptor interaction' pathway, which is associated with
structural and biochemical support for cardiomyocytes, was also
enriched. These findings indicated that postnatal cardiac
development is a complex regulatory network associated with
numerous proliferative, metabolic and immune-associated
pathways.
Analysis of gene expression tendency
STC was used to analyze the differentially expressed
genes, in order to accurately and intuitively visualize the genes
with the same expression tendency between 24-h-, 7-day- and
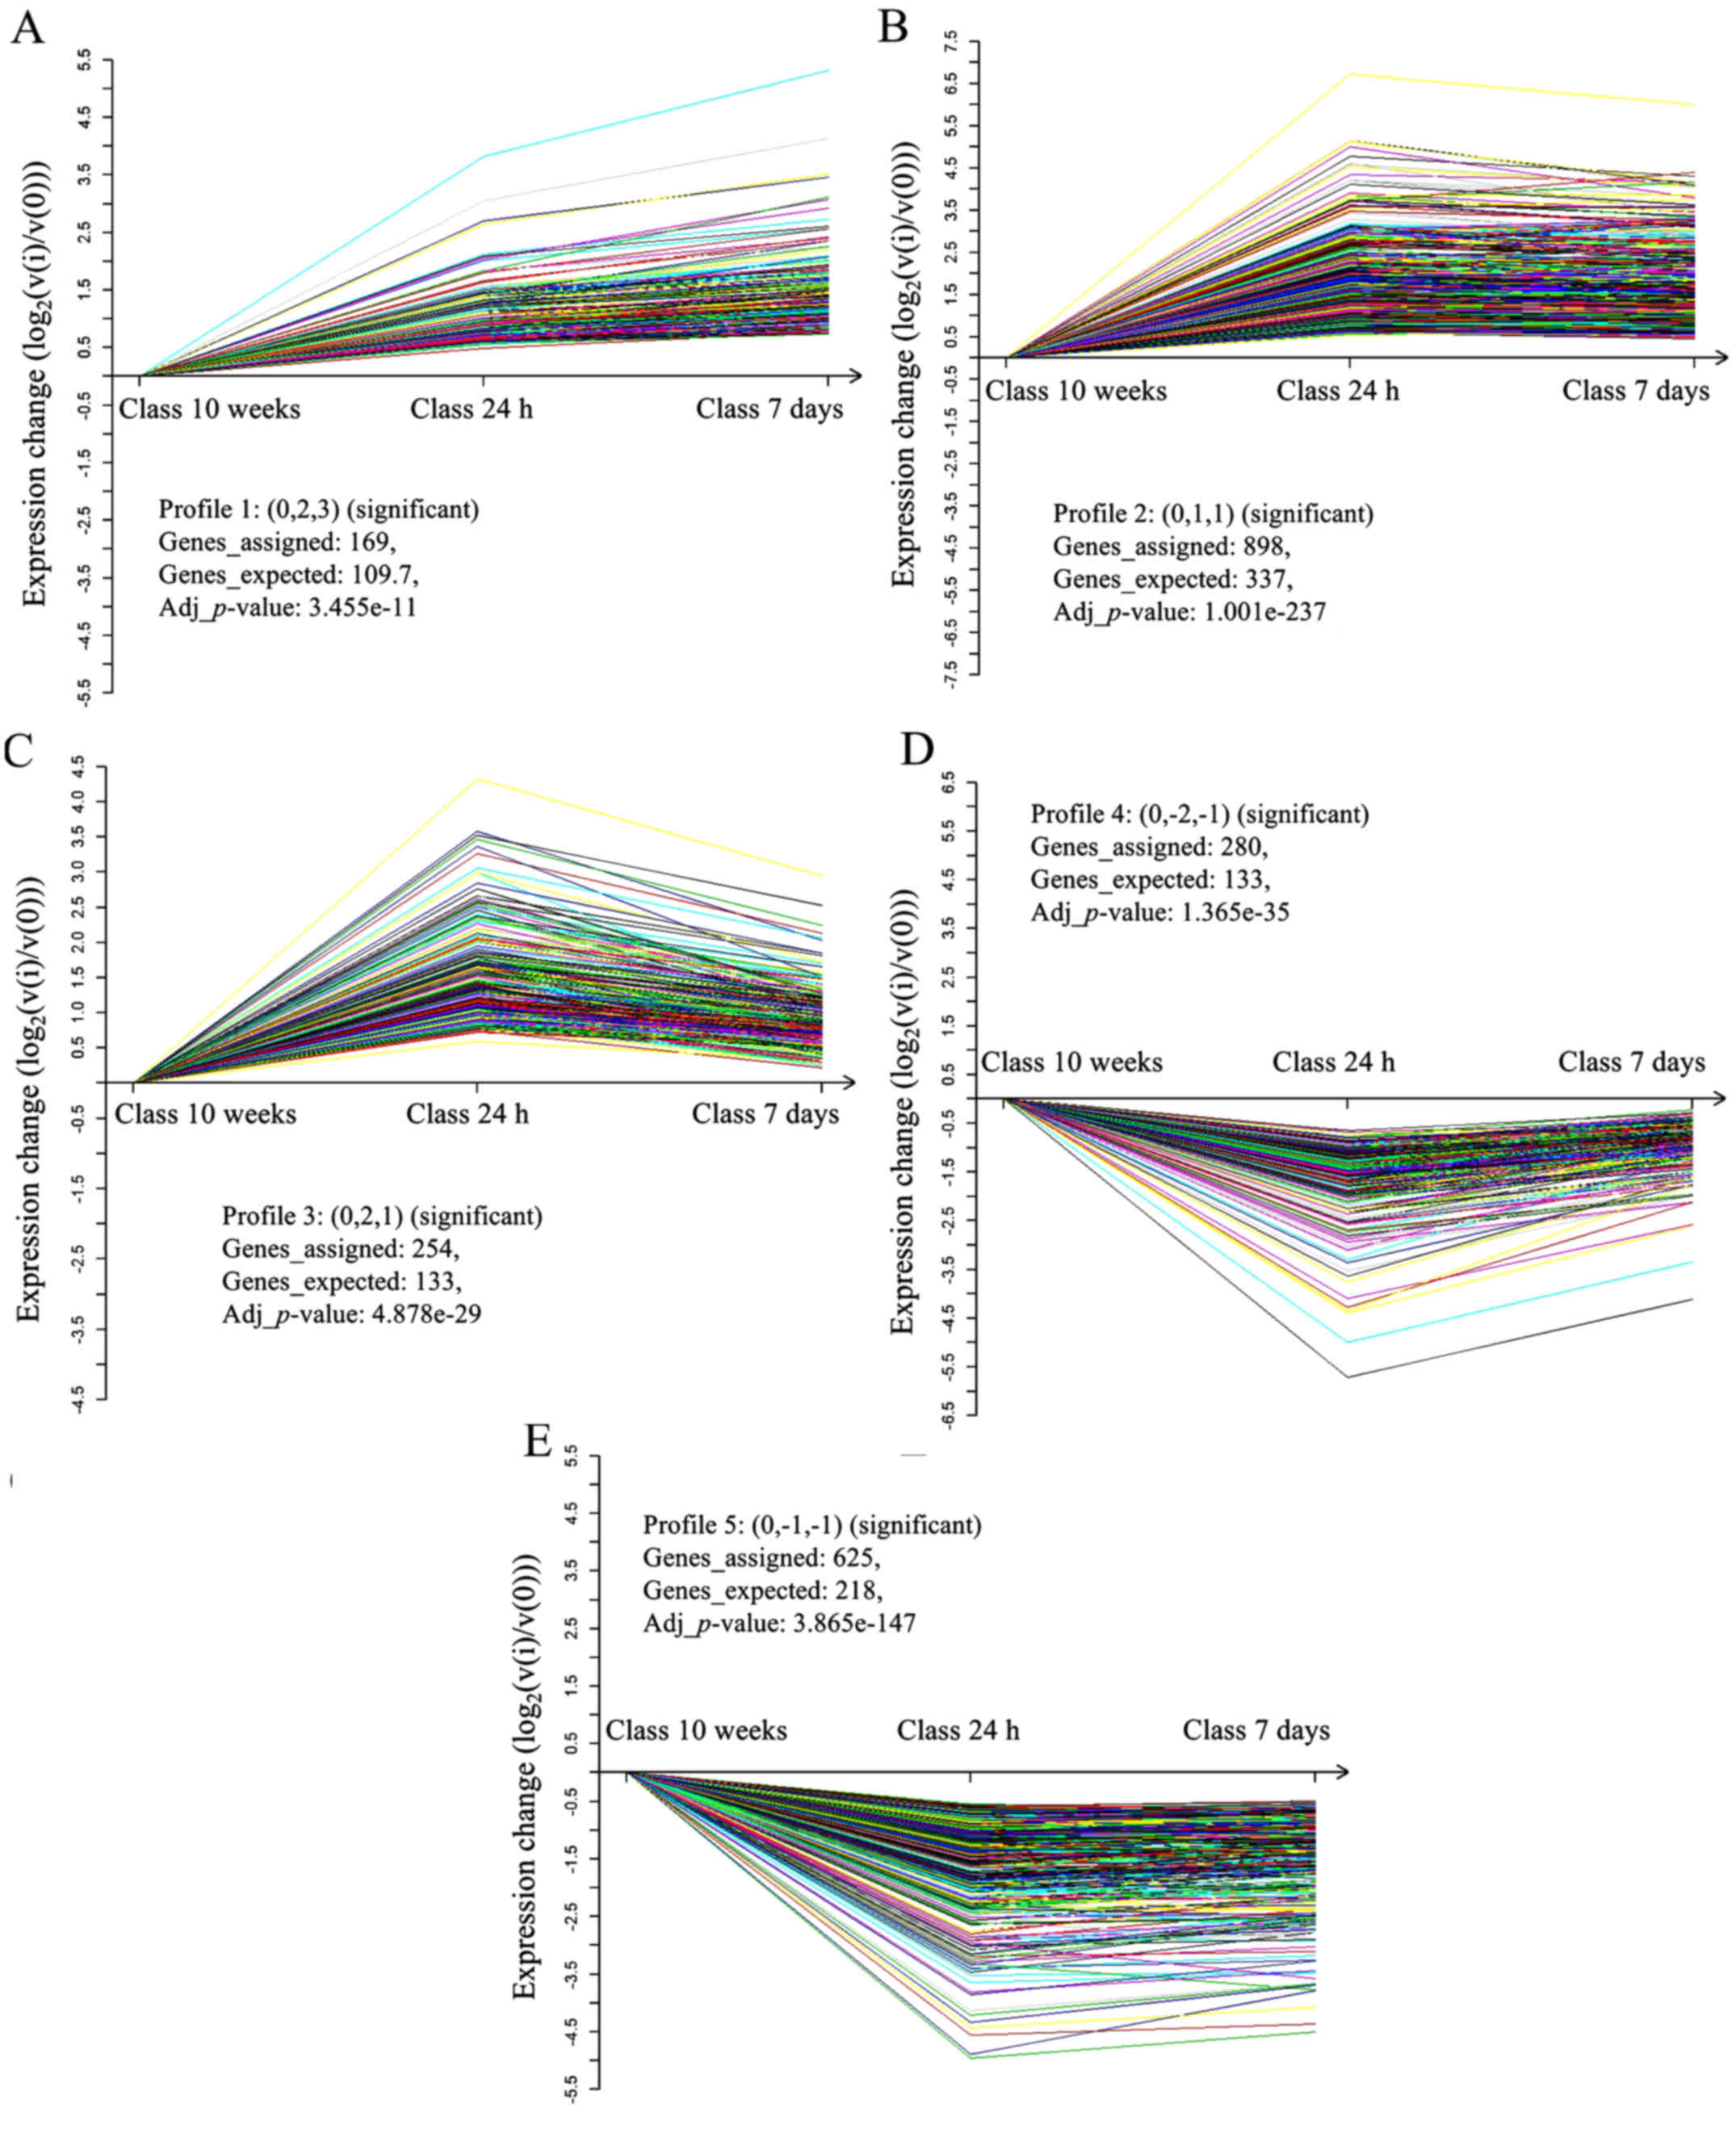
10-week-old mouse hearts. Using a significance threshold of
P<0.05, differentially expressed genes were grouped into five
significant patterns (Fig. 3). In
profile 1, which contained 169 genes, gene expression was
significantly increased in 7 day hearts compared with in 24 h
hearts, and was markedly decreased compared with in 10 week hearts
(Fig. 3A). In profile 2, which
contained 898 genes, there was no obvious difference between the 24
h and 7 day hearts; however a significant decrease in expression
was observed in 10 week hearts (Fig.
3B). Profile 3, which contained 254 genes, exhibited
continuously decreasing expression from 24 h to 7 day to 10 week
hearts (Fig. 3C). Conversely,
profile 4, which included 280 genes, exhibited continuously
increasing expression from 24 h to 7 day to 10 week hearts
(Fig. 3D). In profile 5, which
contained 625 genes, there was no significant difference in gene
expression between the 24 h and 7 day hearts, whereas much higher
expression was observed in 10 week hearts (Fig. 3E).
These five significant patterns indicated that the
genes were involved in dynamic activation in 24-h-old mouse hearts,
which contain proliferative cardiomyocytes; 7-day-old mouse hearts,
which contain cardiomyoctes undergoing a proliferative burst; and
10-week-old mouse hearts, which contain growth-arrested
cardiomyocytes. The dynamically regulated genes included the cyclin
genes [downregulated, cyclin (CCN) A2, CCNB1,
CCNB2, CCND3 and CCNE1; upregulated,
CCNG1], the genes encoding cyclin-dependent kinases (CDKs)
(downregulated, CDK1, CDK2, CDK4 and
CDK6; upregulated, CDK18), downregulated cell
cycle-related genes [cell division cycle (CDC)20,
CDC25A and CDC25B], and downregulated transcription
factor genes [MYC proto-oncogene, bHLH transcription factor
(MYC) and E2F transcription factor 1 (E2F1)]. In
addition, growth factor genes [downregulated bone morphogenetic
protein (BMP)1, BMPR1a, BMP2,
BMP5, BMP7, BMP10, IGF1, IGF2
and IGF2R; upregulated BMP6, fibroblast growth factor
(FGF)1 and FGF2], downregulated mitotic
checkpoint serine/threonine-protein kinase genes [BUB1 mitotic
checkpoint serine/threonine kinase (BUB1) and BUB1B]
and downregulated CDK-interacting protein/kinase inhibitory protein
genes [CDK inhibitor (CDKN)1C, CDKN2D and
CDKN3] were also well enriched. The gene encoding checkpoint
kinase 1 (CHEK1), which interacts with numerous downstream
effectors to induce cell cycle arrest, was also downregulated in
10-week-old group. Notably, the expression of BMP1,
BMP10, CCNE2, E2F1 and IGF1, which were
involved in profile 1, peaked in hearts obtained from 7-day-old
mice, which was consistent with the findings of Naqvi et al
(6).
Signal-net analysis and cell cycle signal
transduction network
Signal-net analysis, based on the KEGG database of
interactions between different gene products and the theory of
network biology, was established to illustrate the inter-gene
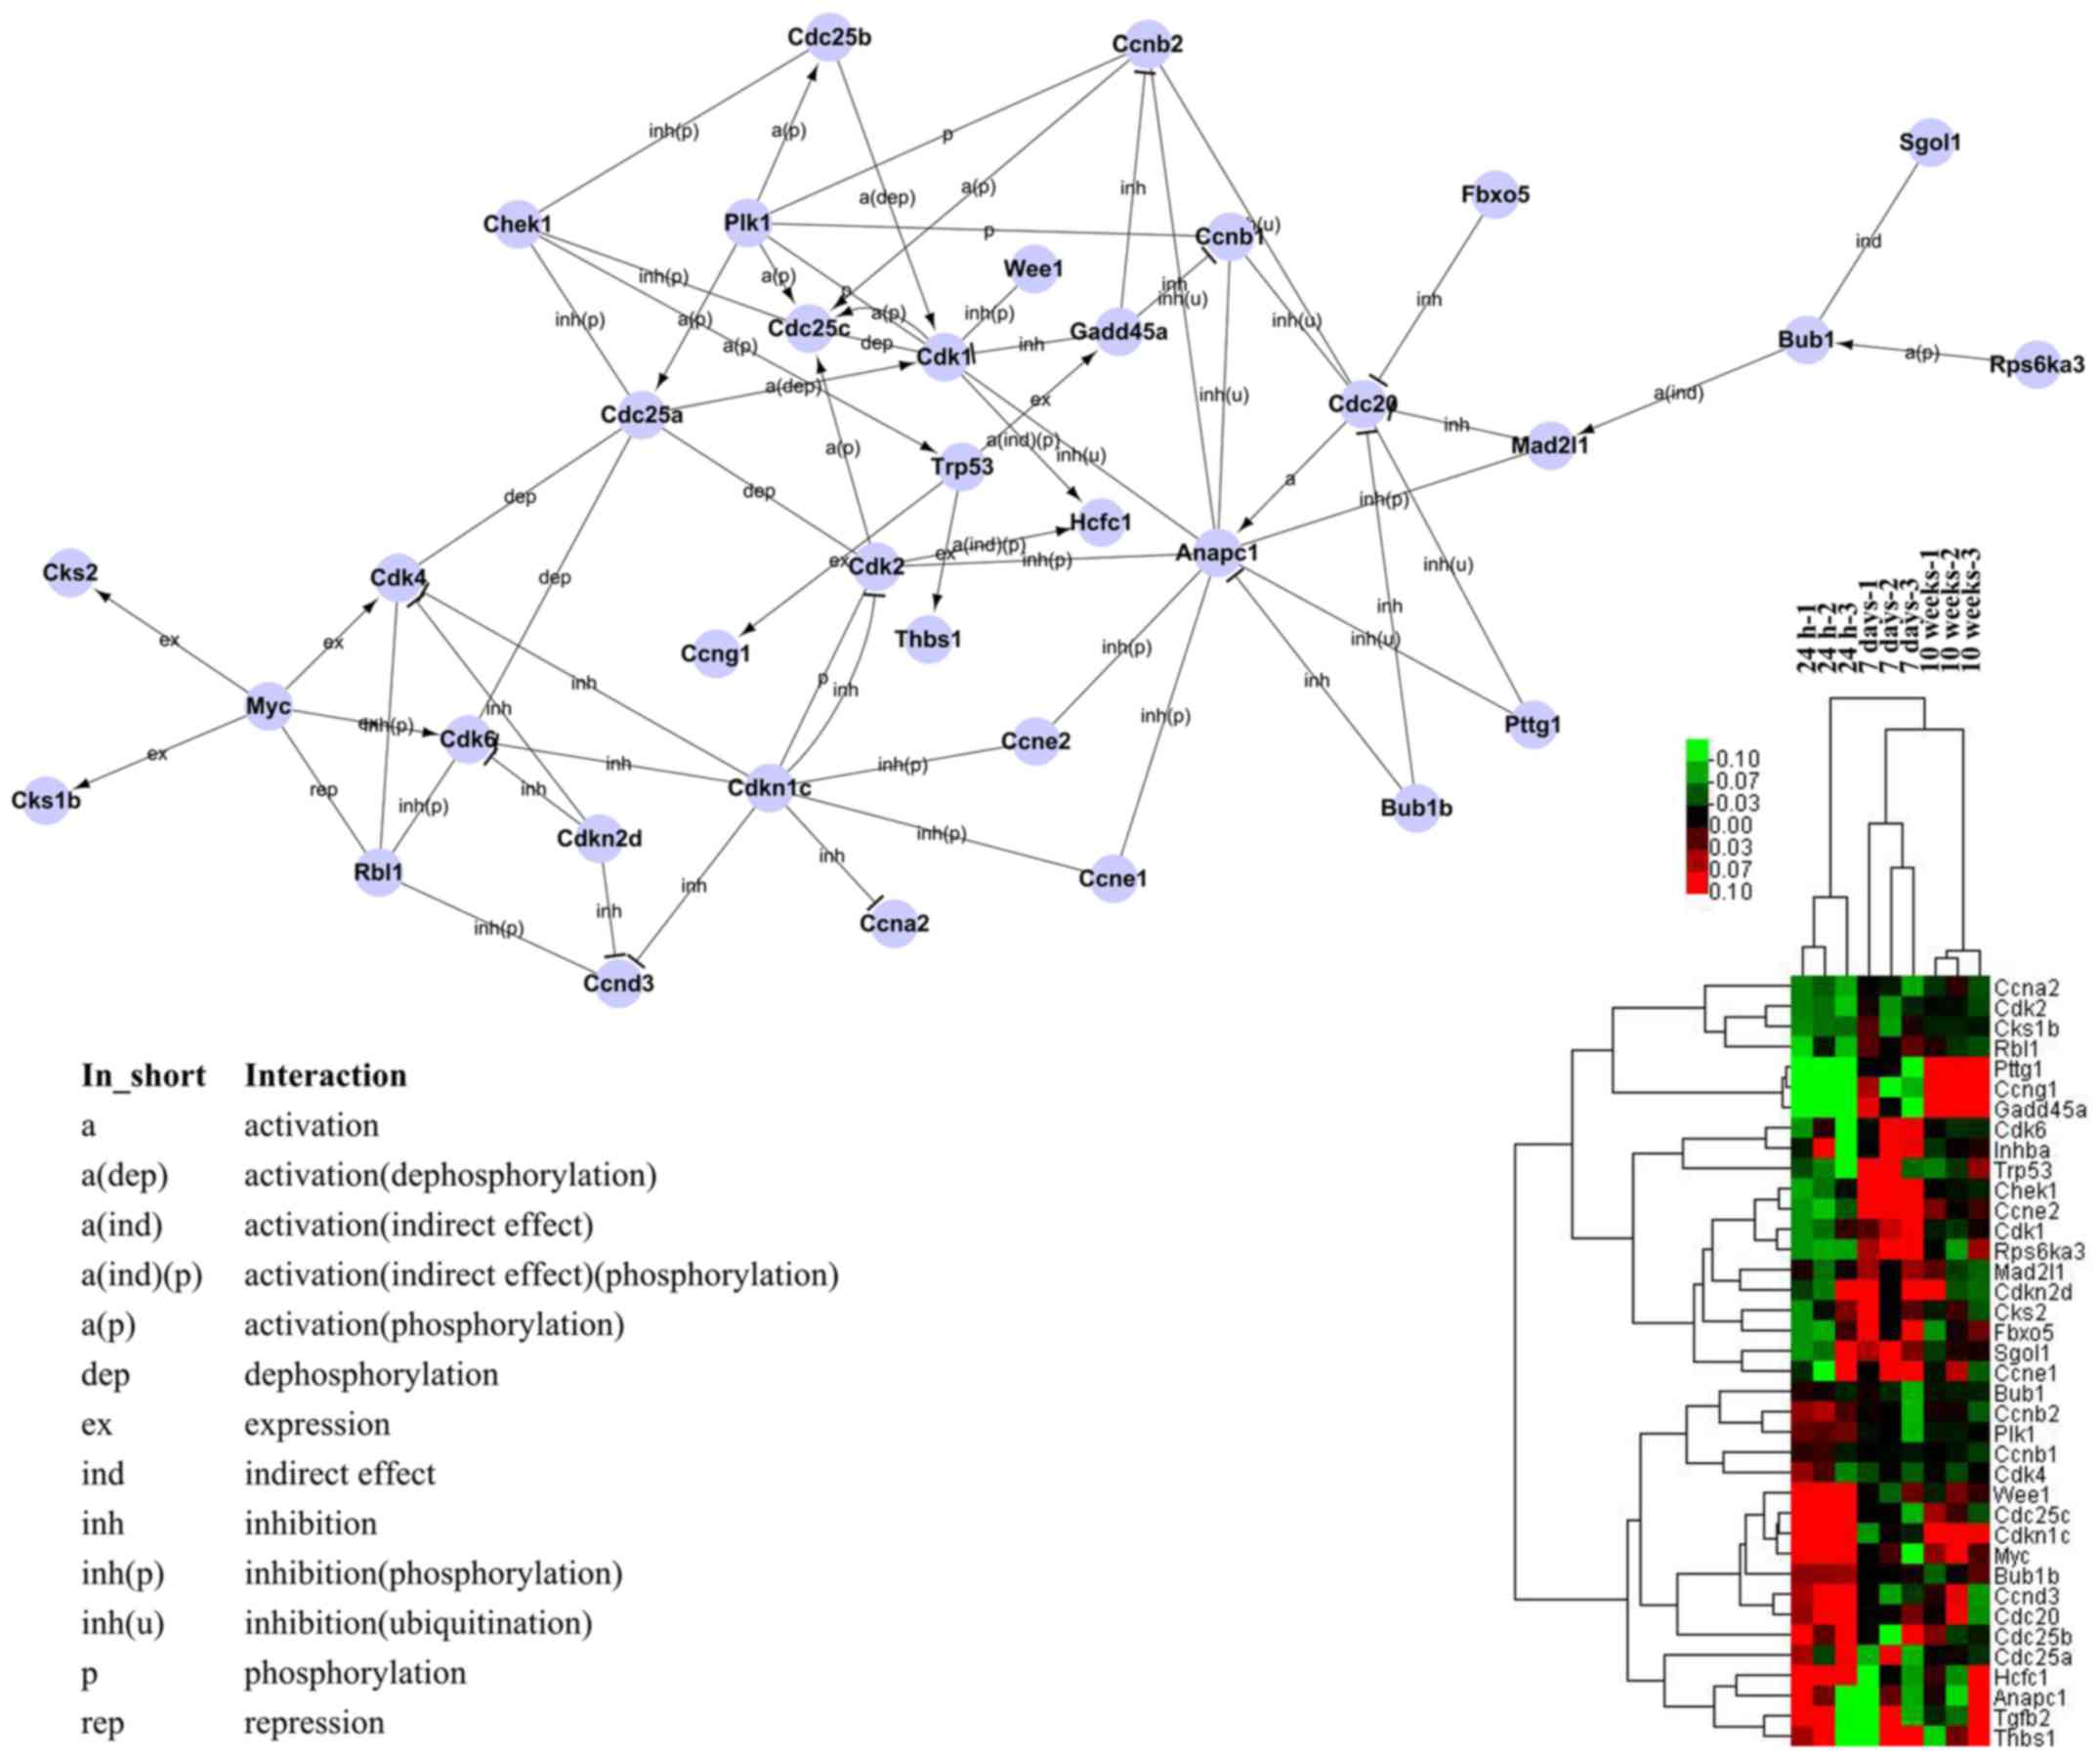
signaling between the differentially expressed genes. To
specifically assess gene interaction, 38 genes were used to
construct the cell cycle signal transduction network (0.11% of all
tested genes; the genes selected were the genes involved in the
annotations and pathways related to 'cell cycle', selected based on
the GO and pathway analyses) (Fig.
4). The majority of these genes were involved in profile 2,
including classical cell cycle genes, such as cyclin genes
(CCNA2, CCNB1, CCNB2 and CCNE1), genes
encoding CDKs (CDK1, CDK2, CDK4 and
CDK6), CDKN2D, genes encoding the cyclin-dependent
kinase regulatory subunit [CDC28 protein kinase regulatory subunit
(CKS)1b and CKS2], and cell cycle-associated
genes (CDC20, CDC25A and CDC25B). The genes
encoding cell cycle checkpoints, regulators and growth factors,
including BUB1, BUB1B, CHEK1, anaphase
promoting complex subunit 1 (ANAPC1), mitotic arrest deficient 2
like 1, polo like kinase 1 (PLK1), RB transcriptional
corepressor like 1 (p107), transformation related protein 53,
shugosin 1, ribosomal protein S6 kinase A3, transforming growth
factor-β2 (TGF-β2) and thrombospondin 1, were also enriched
in this network. The genes involved in profile 5, including growth
arrest and DNA-damage-inducible protein 45α (GADD45α) and
pituitary tumor-transforming 1 (PTTG1; APC substrate);
profile 3, including CDC25C, CCND3, CDKN1C,
WEE1 G2 checkpoint kinase (Cdk1 inhibitor), MYC
(transcription factor), and host cell factor C1 (transcription
factor); profile 4 (CCNG1); and profile 1 (CCNE2)
were also well enriched. Notably, in the network, the genes with
higher degree (interactive ability), including ANAPC1,
CDC20, CDK1, MYC and CDC25C, may serve
important roles in myocardial cell cycle arrest from 7 days to 10
weeks. In the network, ANAPC1, which inhibits CCNB1,
CCNB2, CDK1 and PTTG1 through ubiquitination,
was activated through CDC20. CDC20 also inhibited
CCNB1 and CCNB2 through ubiquitination. CDC25C
achieved its function through the dephosphorylation of CDK1.
These data indicated that the regulation of these five genes
(ANAPC1, CDC20, CDK1, MYC and
CDC25C) may induce cardiomyocytes to maintain proliferative
capacity after preadolescence. Furthermore, in the network,
GADD45α is likely to inhibit the expression of CCNB1
and CCNB2, and CDK1 may regulate myocardial cell
cycle at birth.
RT-qPCR verification of gene
expression
RT-qPCR was used to examine nine representative
genes, including BMP1, CCNE2 and IGF1 from
profile 1, CDC20 and PLK1 from profile 2,
CDC25C and MYC from profile 3, CCNG1 from
profile 4 and FGF1 from profile 5, to validate the
microarray data. As presented in Fig.
5, these results were consistent with the normalized microarray
data, based on either fold changes in expression and/or potential
functions.
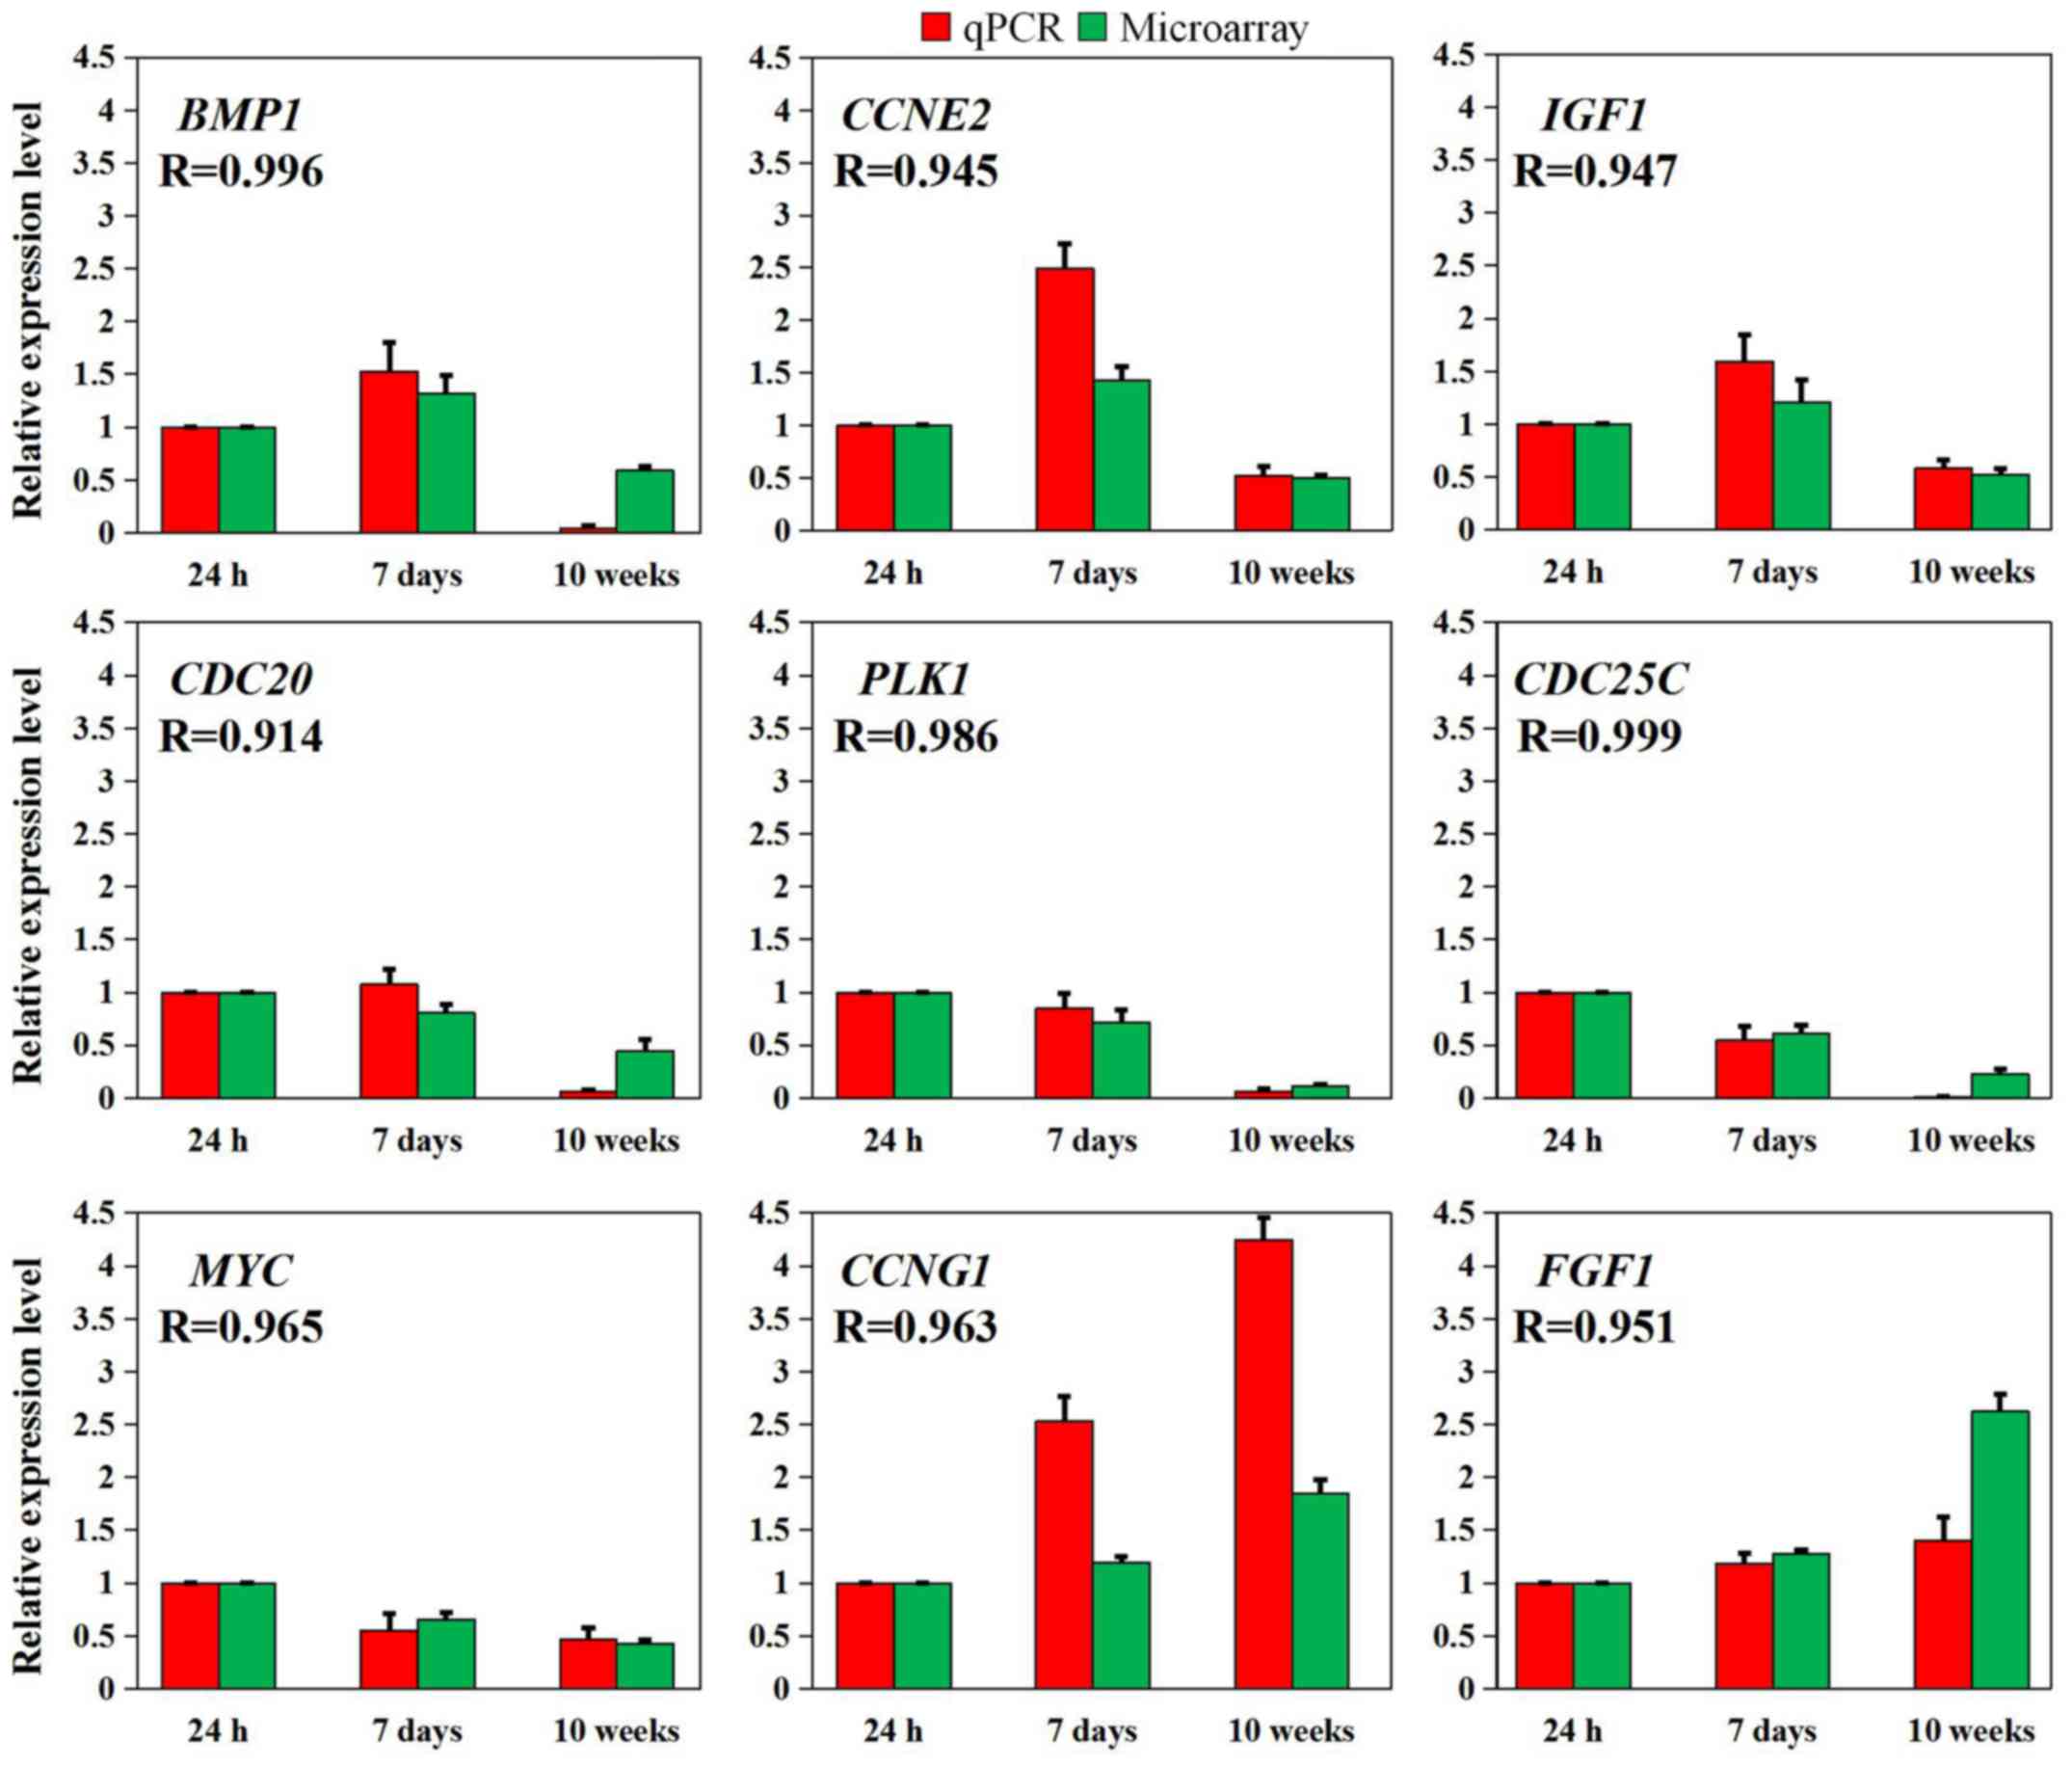 | Figure 5Nine representative differentially
expressed genes validated using RT-qPCR. The relative expression
levels of the nine genes detected using RT-qPCR (red box) were
consistent with the results of the normalized microarray (green
box) based on Pearson's correlation analysis (R>0.9, P<0.05).
The data are expressed as the mean ± standard error of the mean of
three independent experiments. BMP1, bone morphogenetic
protein 1; CCNE2, cyclin E2; CCNG1, cyclin G1;
CDC20, cell division cycle 20; CDC25C, cell division
cycle 25C; FGF1, fibroblast growth factor 1; IGF1,
insulin like growth factor 1; MYC, MYC proto-oncogene, bHLH
transcription factor; PLK1, polo like kinase 1; R, Pearson's
correlation coefficient; RT-qPCR, reverse
transcription-quantitative polymerase chain reaction. |
Discussion
Mammalian cardiomyocytes retain relatively high
proliferative potential at birth, which gradually diminishes after
a few days as a result of myocardial cell cycle arrest (29–31). Furthermore, during adolescence, a
burst of proliferation occurs in cardiomyocytes (6). However, the alterations in gene
expression during the critical period from birth to adolescence and
then to adulthood remain unknown. To elucidate the molecular
mechanism and the gene expression alterations that occur during
this key period, the present study conducted global gene expression
profiling to generate transcriptomes from 24-h-, 7-day- and
10-week-old C57BL/6 mouse hearts. These time-points reflect the
phases of proliferative activation, proliferative burst and
proliferative arrest, respectively. In addition, GO annotation,
STC, pathway enrichment and network construction were conducted to
identify the state of cardiomyocytes from numerous
perspectives.
As expected, the GO analysis revealed that, with
increasing age, the expression of genes involved in the cell cycle,
cell division and mitosis, as well as metabolic process, protein
synthesis and protein modification was significantly altered. These
results were highly consistent with the findings of the pathway
analysis, which indicated that the phosphoinositide 3-kinase
(PI3K)-protein kinase B (AKT) signaling pathway was enriched. These
findings indicated that the cell cycle and protein modification are
important in postnatal mouse heart development. Numerous
proliferative stimulators directly activate the PI3K-AKT pathway by
promoting nuclear trans-location, and increasing the
phosphorylation and degradation of proteins associated with
myocardial proliferation (32).
The progressive loss of proliferative potential in cardiomyocytes
reflects multifunctional and multisystem co-regulation. In
addition, pathways associated with the immune system were enriched,
reflecting the fact that neonatal mice are undergoing a transition
from reliance on the intrauterine physiological environment to
self-sufficiency. Following birth, the immune system faces the
challenge of transferring from a sterile environment to a
microbe-containing environment (33).
Notably, in the present study the differentially
expressed genes were grouped into five patterns, according to the
relative expression of the differentially expressed genes at three
different time-points. Specifically, the majority of cyclin genes
(CCNA2, CCNB1, CCNB2 and CCNE1), CDK
genes (CDK1, CDK2, CDK4 and CDK6) and
cell cycle-related genes (CDC20, CDC25A and
CDC25B) were involved in profile 2. In addition, cyclin
genes (CCNE2) and growth factors, including BMP1,
BMP10, E2F1 and IGF1, were involved in profile
1, which exhibited a burst of increased expression in 7-day-old
hearts. These genes may increase mice myocardial proliferative
potential within 7 days of age and could potentially elicit
myocardial proliferation in damaged adult hearts. These data were
consistent with the findings of Naqvi et al, which generated
a molecular model of myocardial proliferation involving thyroid
hormones and the IGF1/AKT pathway (6). In addition, Rochais et al
reported that IGF1 regulated activation of the PI3K/AKT
pathway to downregulate the expression of p21 and p27 in
proliferating cardiomyocytes (34). BMP1 is essential for normal
heart development; also this gene serves non-redundant roles in the
genetic and morphogenetic processes in human congenital heart
disease (35). Furthermore,
BMP10 is essential for maintaining cardiac growth during
murine cardiogenesis (36).
Although E2Fs promote S-phase entry and DNA synthesis, Ebelt et
al reported that E2F1 promotes mitotic cell division by
increasing the expression of cyclin B1 and B2 in neonatal
cardiomyocytes (37). Therefore,
these genes are likely to be involved in the burst of cardiomyocyte
proliferation during early preadolescence. Theoretically,
stimulating the expression of these genes may increase
proliferative capacity in post-adolescent and adult hearts.
To date, some critical genes, including
BUB1, dynein light chain Tctex-type 1A (DYNLT1α),
tropomodulin 4 (TMOD4) and glutamate metabotropic receptor
1, which were screened in the present study, have not been
described in the context of myocardial proliferation. However, in
other tissues, these genes serve regulatory roles in cell
proliferation. Bieniek et al reported that the marked
downregulation of key proteins in kinetochore/centromere assembly,
including Cdc20, Ndc80, Bub1 and Plk1, may arrest prostate cancer
proliferation (38). Yeh et
al reported that DYNLT1α encodes Tctex-1, which is
involved in the IGF1R-Gbg-phospho (T94) Tctex-1 signaling pathway
and promotes the proliferation of neural progenitors via the
modulation of ciliary resorption and G1 length (39). Berger et al reported that
loss of the Tmod4 protein may cause cytoplasmic rod formation and
muscle weakness reminiscent of nemaline myopathy in zebrafish
(40). Therefore, it may be
hypothesized that these genes serve important roles in myocardial
proliferation.
Notably, genes associated with progenitor cells,
pluripotent stem cells and fibroblasts were also well enriched in
the present study. A previous study confirmed that cardiac
progenitor cells reside in postnatal hearts (41). These genes were identified using
the expression of surface markers, such as c-Kit (42,43), which was encoded by KIT and was
downregulated in the present study. BMP genes (BMP1,
BMP5, BMP7, BMP10 and BMPR1a), which
are required for the optimization of efficient cardiac
differentiation from pluripotent stem cells, were also
downregulated in the present study (44). Fibroblasts and myofibroblasts
secrete collagens (encoded by COL genes), which function as
primary structural proteins and provide mechanical support
(45). Collagens can be degraded
by matrix metalloproteinases (MMPs), which are a group of
endopeptidases, thus enabling cell migration into the injured area
(46). MMPs are inhibited
via the tissue inhibitors of metalloproteinases (TIMP)
family, which is associated with extracellular matrix (ECM)
expansion and cardiac fibrosis (47). In the present study, COL
genes, MMP genes (MMP2, MMP14 and
MMP16) and TIMP1 were downregulated. The homeostasis
of ECM factors, which exhibited a similar expression trend between
24-h- and 10-week-old hearts, provides a perfect scaffold for all
cardiomyocytes. In addition, the 'ECM-receptor interaction' pathway
was enriched in the pathway analysis. Other factors associated with
cardiac fibrosis were also well enriched; TGFβ-2,
FGF12, FGFR2 and platelet derived growth factor
(PDGF)A were continuously decreased after birth,
whereas FGF1, FGF2, FGF7, FGF16 and
PDGFD were highly expressed in 10-week-old hearts.
Considering the fact that at birth, the heart can completely repair
its site of injury without scar, whereas fibrotic scar formation
occurs in injured adult hearts, the results of the present study
may provide a basis for the physiological condition of progenitor
cells, pluripotent stem cell differentiation and fibrotic scar
formation.
A signal transduction network analysis of the cell
cycle was used to efficiently investigate the phenomenon of
myocardial cell cycle arrest. The results suggested that
ANAPC1, CDC20, CDK1, MYC, CDC25C
and GADD45α, which exhibited the CDK1 and
PTTG1 through ubiquitination, and was activated by
CDC20, which also inhibited the expression CCNB1 and
CCNB2 via ubiquitination. A previous study reported that
APC/cyclosome (C) regulates the ubiquitin-dependent proteolysis of
specific cell-cycle proteins to coordinate chromosome segregation
in mitosis and entry into the G1 phase (48). The catalytic activity of the APC/C
and its ability to initiate the destruction of particular proteins
at different phases of the cell cycle are controlled through
interactions with the structurally related coactivator subunit,
Cdc20. In cardiomyocytes, blocking APC/CCdc20 may lead
to G2 arrest (49).
These findings are also consistent with the data from the GO and
pathway analyses. ANAPC1 and CDC20 shared the same
functional annotation, which included cell cycle, cell division and
mitosis, and both participate in cell cycle and ubiquitin-mediated
proteolysis pathways. These genes were involved in profile 2, which
exhibited downregulation from 7 days to 10 weeks of age. Together,
these results suggested that ANAPC1 and CDC20 may
have important roles in the phenomenon of myocardial cell cycle
arrest from early puberty to adulthood.
In the network, CDC25C was activated through
the dephosphorylation of CDK1, which activates CDC25C
by phosphorylation. Consistent with a previous study by Forester
et al Cdk1 activity is controlled through the phosphatase
Cdc25C, which is turned on at the G2/M transition to
catalyze Cdk1 activation (50).
This constitutive activation of Cdc25C and Cdk1 leads to a delayed
exit from mitosis. Franckhauser et al observed that during
mitosis, the nonphosphorylated mutant forms of CDC25C impair
mitotic progression in human cells (51). In addition, cell cycle, cell
division, mitosis and protein phosphorylation were well enriched in
CDK1, and CDK1 and CDC25C were involved in the
cell cycle pathway. MYC activates CDK4 and
CDK6 in the network. Villa Del Campo et al reported
that overexpression of MYC increases the population of
cardiomyocytes and enhances the epicardial contribution to the
developing heart (52). In
addition, GO analysis revealed that MYC has a large role in
the regulation of transcription and participates in the cell cycle,
and PI3K-Akt, Hippo, mitogen-activated protein kinase (MAPK) and
TGF-β signaling pathways in the pathway analysis. These results
suggested that MYC may be involved in various functions, and
function as an intermediate mediator of various pathways in
myocardial cell cycle arrest. MYC and CDC25C were
both involved in profile 3, which began to decrease in 24-h-old
hearts and may initiate regulatory functions in the cell cycle at
birth.
In the network, GADD45α inhibited the
expression of CCNB1, CCNB2 and CDK1.
GADD45α serves a role in S-phase and G2/M arrest
(53). Similarly, Gadd45α binds
Cdk1, likely preventing its association with cyclin B1, inhibiting
Cdk1 activity, and arresting the cell at the G2/M
checkpoint (54). At present, no
report has been published regarding the relationship between
myocardial cell cycle arrest and GADD45α. However, the
results of an in vitro assay of cortical neuron development
indicated that overexpression and knockdown of GADD45α
transcription suppressed the formation of distal neurite processes
and often promoted aberrantly shaped and sized cell bodies. In
addition, overexpression did not affect migration but rather led to
irregular and hypertrophied cell body development (55). The results of the pathway analysis
in the present study indicated that GADD45α may be involved
in the p53 and MAPK signaling pathways, and was the only gene from
profile 1 with increased expression at 7 days old. These results
suggested that the increased expression of GADD45α may serve
important roles in myocardial cell cycle arrest from early puberty
to adulthood.
Gene expression profile analyses have the advantage
of generating huge amounts of biological information, which can be
objectively filtered and accurately analyzed. The present study
used GO annotation, pathway analysis and STC to analyze the
specific functions, pathways and logical patterns of the
differentially expressed genes. Notably, a potential cell cycle
signal transduction network was constructed in the present study.
This network enables the screening of the potential genes
associated with a single function, the cell cycle. The present
study may have value as an important reference concerning the gene
expression profile in the heart during proliferation.
Acknowledgments
The present study was supported by the National
Natural Science Foundation of China [grant no. 81570256 (to M.W.)],
and the China Scholarship Council [grant no. 201506940022 (to
R.W.)]. The authors would like to thank Dongjia Ge for contributing
to the design of the figures. The global gene expression data are
available at the Gene Expression Omnibus website (https://www.ncbi.nlm.nih.gov/geo/) under
accession no. GSE93426.
References
|
1
|
Mozaffarian D, Benjamin EJ, Go AS, Arnett
DK, Blaha MJ, Cushman M, Das SR, de Ferranti S, Després JP,
Fullerton HJ, et al Writing Group Members; American Heart
Association; Statistics Committee: Stroke Statistics Subcommittee:
Heart Disease and Stroke Statistics-2016 Update: A Report From the
American Heart Association. Circulation. 133:e38–e360. 2016.
View Article : Google Scholar
|
|
2
|
Murry CE, Reinecke H and Pabon LM:
Regeneration gaps: Observations on stem cells and cardiac repair. J
Am Coll Cardiol. 47:1777–1785. 2006. View Article : Google Scholar : PubMed/NCBI
|
|
3
|
Linzbach AJ: Heart failure from the point
of view of quantitative anatomy. Am J Cardiol. 5:370–382. 1960.
View Article : Google Scholar : PubMed/NCBI
|
|
4
|
Poss KD, Wilson LG and Keating MT: Heart
regeneration in zebrafish. Science. 298:2188–2190. 2002. View Article : Google Scholar : PubMed/NCBI
|
|
5
|
Porrello ER, Mahmoud AI, Simpson E, Hill
JA, Richardson JA, Olson EN and Sadek HA: Transient regenerative
potential of the neonatal mouse heart. Science. 331:1078–1080.
2011. View Article : Google Scholar : PubMed/NCBI
|
|
6
|
Naqvi N, Li M, Calvert JW, Tejada T,
Lambert JP, Wu J, Kesteven SH, Holman SR, Matsuda T, Lovelock JD,
et al: A proliferative burst during preadolescence establishes the
final cardiomyocyte number. Cell. 157:795–807. 2014. View Article : Google Scholar : PubMed/NCBI
|
|
7
|
Mollova M, Bersell K, Walsh S, Savla J,
Das LT, Park SY, Silberstein LE, Dos Remedios CG, Graham D, Colan
S, et al: Cardiomyocyte proliferation contributes to heart growth
in young humans. Proc Natl Acad Sci USA. 110:1446–1451. 2013.
View Article : Google Scholar : PubMed/NCBI
|
|
8
|
Gan J, Sonntag HJ, Tang MK, Cai D and Lee
KK: Integrative Analysis of the Developing Postnatal Mouse Heart
Transcriptome. PLoS One. 10:e01332882015. View Article : Google Scholar : PubMed/NCBI
|
|
9
|
Livak KJ and Schmittgen TD: Analysis of
relative gene expression data using real-time quantitative PCR and
the 2(−Delta Delta C(T)) Method. Methods. 25:402–408. 2001.
View Article : Google Scholar
|
|
10
|
Wright GW and Simon RM: A random variance
model for detection of differential gene expression in small
microarray experiments. Bioinformatics. 19:2448–2455. 2003.
View Article : Google Scholar : PubMed/NCBI
|
|
11
|
Yang H, Crawford N, Lukes L, Finney R,
Lancaster M and Hunter KW: Metastasis predictive signature profiles
pre-exist in normal tissues. Clin Exp Metastasis. 22:593–603. 2005.
View Article : Google Scholar
|
|
12
|
Clarke R, Ressom HW, Wang A, Xuan J, Liu
MC, Gehan EA and Wang Y: The properties of high-dimensional data
spaces: Implications for exploring gene and protein expression
data. Nat Rev Cancer. 8:37–49. 2008. View Article : Google Scholar :
|
|
13
|
Eisen MB, Spellman PT, Brown PO and
Botstein D: Cluster analysis and display of genome-wide expression
patterns. Proc Natl Acad Sci USA. 95:14863–14868. 1998. View Article : Google Scholar : PubMed/NCBI
|
|
14
|
Gene Ontology Consortium: The Gene
Ontology (GO) project in 2006. Nucleic Acids Res. 34:D322–D326.
2006. View Article : Google Scholar
|
|
15
|
Ashburner M, Ball CA, Blake JA, Botstein
D, Butler H, Cherry JM, Davis AP, Dolinski K, Dwight SS, Eppig JT,
et al: The Gene Ontology Consortium: Gene ontology: Tool for the
unification of biology. Nat Genet. 25:25–29. 2000. View Article : Google Scholar : PubMed/NCBI
|
|
16
|
Dupuy D, Bertin N, Hidalgo CA, Venkatesan
K, Tu D, Lee D, Rosenberg J, Svrzikapa N, Blanc A, Carnec A, et al:
Genome-scale analysis of in vivo spatiotemporal promoter activity
in Caenorhabditis elegans. Nat Biotechnol. 25:663–668. 2007.
View Article : Google Scholar : PubMed/NCBI
|
|
17
|
Schlitt T, Palin K, Rung J, Dietmann S,
Lappe M, Ukkonen E and Brazma A: From gene networks to gene
function. Genome Res. 13:2568–2576. 2003. View Article : Google Scholar : PubMed/NCBI
|
|
18
|
Kanehisa M, Goto S, Kawashima S, Okuno Y
and Hattori M: The KEGG resource for deciphering the genome.
Nucleic Acids Res. 32:D277–D280. 2004. View Article : Google Scholar :
|
|
19
|
Yi M, Horton JD, Cohen JC, Hobbs HH and
Stephens RM: WholePathwayScope: A comprehensive pathway-based
analysis tool for high-throughput data. BMC Bioinformatics.
7:302006. View Article : Google Scholar : PubMed/NCBI
|
|
20
|
Draghici S, Khatri P, Tarca AL, Amin K,
Done A, Voichita C, Georgescu C and Romero R: A systems biology
approach for pathway level analysis. Genome Res. 17:1537–1545.
2007. View Article : Google Scholar : PubMed/NCBI
|
|
21
|
Ramoni MF, Sebastiani P and Kohane IS:
Cluster analysis of gene expression dynamics. Proc Natl Acad Sci
USA. 99:9121–9126. 2002. View Article : Google Scholar : PubMed/NCBI
|
|
22
|
Miller LD, Long PM, Wong L, Mukherjee S,
McShane LM and Liu ET: Optimal gene expression analysis by
microarrays. Cancer Cell. 2:353–361. 2002. View Article : Google Scholar : PubMed/NCBI
|
|
23
|
Dysvik B and Jonassen I: J-Express:
exploring gene expressiondata using Java. Bioinformatics.
17:369–370. 2001. View Article : Google Scholar : PubMed/NCBI
|
|
24
|
Jansen R, Greenbaum D and Gerstein M:
Relating whole-genome expression data with protein-protein
interactions. Genome Res. 12:37–46. 2002. View Article : Google Scholar : PubMed/NCBI
|
|
25
|
Li C and Li H: Network-constrained
regularization and variable selection for analysis of genomic data.
Bioinformatics. 24:1175–1182. 2008. View Article : Google Scholar : PubMed/NCBI
|
|
26
|
Wei Z and Li H: A Markov random field
model for network-based analysis of genomic data. Bioinformatics.
23:1537–1544. 2007. View Article : Google Scholar : PubMed/NCBI
|
|
27
|
Zhang JD and Wiemann S: KEGGgraph: A graph
approach to KEGG PATHWAY in R and bioconductor. Bioinformatics.
25:1470–1471. 2009. View Article : Google Scholar : PubMed/NCBI
|
|
28
|
Spirin V and Mirny LA: Protein complexes
and functional modules in molecular networks. Proc Natl Acad Sci
USA. 100:12123–12128. 2003. View Article : Google Scholar : PubMed/NCBI
|
|
29
|
Burton PB, Raff MC, Kerr P, Yacoub MH and
Barton PJ: An intrinsic timer that controls cell-cycle withdrawal
in cultured cardiac myocytes. Dev Biol. 216:659–670. 1999.
View Article : Google Scholar
|
|
30
|
Tane S, Kubota M, Okayama H, Ikenishi A,
Yoshitome S, Iwamoto N, Satoh Y, Kusakabe A, Ogawa S, Kanai A, et
al: Repression of cyclin D1 expression is necessary for the
maintenance of cell cycle exit in adult mammalian cardiomyocytes. J
Biol Chem. 289:18033–18044. 2014. View Article : Google Scholar : PubMed/NCBI
|
|
31
|
Tane S, Ikenishi A, Okayama H, Iwamoto N,
Nakayama KI and Takeuchi T: CDK inhibitors, p21(Cip1) and
p27(Kip1), participate in cell cycle exit of mammalian
cardiomyocytes. Biochem Biophys Res Commun. 443:1105–1109. 2014.
View Article : Google Scholar : PubMed/NCBI
|
|
32
|
Lin Z, Zhou P, von Gise A, Gu F, Ma Q,
Chen J, Guo H, van Gorp PR, Wang DZ and Pu WT: Pi3kcb links
Hippo-YAP and PI3K-AKT signaling pathways to promote cardiomyocyte
proliferation and survival. Circ Res. 116:35–45. 2015. View Article : Google Scholar :
|
|
33
|
Marshall-Clarke S, Reen D, Tasker L and
Hassan J: Neonatal immunity: How well has it grown up. Immunol
Today. 21:35–41. 2000. View Article : Google Scholar : PubMed/NCBI
|
|
34
|
Rochais F, Sturny R, Chao CM, Mesbah K,
Bennett M, Mohun TJ, Bellusci S and Kelly RG: FGF10 promotes
regional foetal cardiomyocyte proliferation and adult cardiomyocyte
cell-cycle re-entry. Cardiovasc Res. 104:432–442. 2014. View Article : Google Scholar : PubMed/NCBI
|
|
35
|
Thomas PS, Rajderkar S, Lane J, Mishina Y
and Kaartinen V: AcvR1-mediated BMP signaling in second heart field
is required for arterial pole development: Implications for
myocardial differentiation and regional identity. Dev Biol.
390:191–207. 2014. View Article : Google Scholar : PubMed/NCBI
|
|
36
|
Chen H, Shi S, Acosta L, Li W, Lu J, Bao
S, Chen Z, Yang Z, Schneider MD, Chien KR, et al: BMP10 is
essential for maintaining cardiac growth during murine
cardiogenesis. Development. 131:2219–2231. 2004. View Article : Google Scholar : PubMed/NCBI
|
|
37
|
Ebelt H, Hufnagel N, Neuhaus P, Neuhaus H,
Gajawada P, Simm A, Müller-Werdan U, Werdan K and Braun T:
Divergent siblings: E2F2 and E2F4 but not E2F1 and E2F3 induce DNA
synthesis in cardiomyocytes without activation of apoptosis. Circ
Res. 96:509–517. 2005. View Article : Google Scholar : PubMed/NCBI
|
|
38
|
Bieniek J, Childress C, Swatski MD and
Yang W: COX-2 inhibitors arrest prostate cancer cell cycle
progression by downregulation of kinetochore/centromere proteins.
Prostate. 74:999–1011. 2014. View Article : Google Scholar : PubMed/NCBI
|
|
39
|
Yeh C, Li A, Chuang JZ, Saito M, Cáceres A
and Sung CH: IGF-1 activates a cilium-localized noncanonical Gβγ
signaling pathway that regulates cell-cycle progression. Dev Cell.
26:358–368. 2013. View Article : Google Scholar : PubMed/NCBI
|
|
40
|
Berger J, Tarakci H, Berger S, Li M, Hall
TE, Arner A and Currie PD: Loss of Tropomodulin4 in the zebrafish
mutant träge causes cytoplasmic rod formation and muscle weakness
reminiscent of nemaline myopathy. Dis Model Mech. 7:1407–1415.
2014. View Article : Google Scholar : PubMed/NCBI
|
|
41
|
Segers VF and Lee RT: Stem-cell therapy
for cardiac disease. Nature. 451:937–942. 2008. View Article : Google Scholar : PubMed/NCBI
|
|
42
|
Passier R, van Laake LW and Mummery CL:
Stem-cell-based therapy and lessons from the heart. Nature.
453:322–329. 2008. View Article : Google Scholar : PubMed/NCBI
|
|
43
|
Bearzi C, Rota M, Hosoda T, Tillmanns J,
Nascimbene A, De Angelis A, Yasuzawa-Amano S, Trofimova I, Siggins
RW, Lecapitaine N, et al: Human cardiac stem cells. Proc Natl Acad
Sci USA. 104:14068–14073. 2007. View Article : Google Scholar : PubMed/NCBI
|
|
44
|
Kattman SJ, Witty AD, Gagliardi M, Dubois
NC, Niapour M, Hotta A, Ellis J and Keller G: Stage-specific
optimization of activin/nodal and BMP signaling promotes cardiac
differentiation of mouse and human pluripotent stem cell lines.
Cell Stem Cell. 8:228–240. 2011. View Article : Google Scholar : PubMed/NCBI
|
|
45
|
Horn MA and Trafford AW: Aging and the
cardiac collagen matrix: Novel mediators of fibrotic remodelling. J
Mol Cell Cardiol. 93:175–185. 2016. View Article : Google Scholar :
|
|
46
|
Lindsey ML, Iyer RP, Jung M,
DeLeon-Pennell KY and Ma Y: Matrix metalloproteinases as input and
output signals for post-myocardial infarction remodeling. J Mol
Cell Cardiol. 91:134–140. 2016. View Article : Google Scholar : PubMed/NCBI
|
|
47
|
Vanhoutte D and Heymans S: TIMPs and
cardiac remodeling: 'Embracing the MMP-independent-side of the
family'. J Mol Cell Cardiol. 48:445–453. 2010. View Article : Google Scholar
|
|
48
|
Zhang S, Chang L, Alfieri C, Zhang Z, Yang
J, Maslen S, Skehel M and Barford D: Molecular mechanism of APC/C
activation by mitotic phosphorylation. Nature. 533:260–264. 2016.
View Article : Google Scholar : PubMed/NCBI
|
|
49
|
Yamada K, Tamamori-Adachi M, Goto I,
Iizuka M, Yasukawa T, Aso T, Okazaki T and Kitajima S: Degradation
of p21Cip1 through anaphase-promoting complex/cyclosome and its
activator Cdc20 (APC/CCdc20) ubiquitin ligase complex-mediated
ubiquitylation is inhibited by cyclin-dependent kinase 2 in
cardiomyocytes. J Biol Chem. 286:44057–44066. 2011. View Article : Google Scholar : PubMed/NCBI
|
|
50
|
Forester CM, Maddox J, Louis JV, Goris J
and Virshup DM: Control of mitotic exit by PP2A regulation of
Cdc25C and Cdk1. Proc Natl Acad Sci USA. 104:19867–19872. 2007.
View Article : Google Scholar : PubMed/NCBI
|
|
51
|
Franckhauser C, Mamaeva D, Heron-Milhavet
L, Fernandez A and Lamb NJ: Distinct pools of cdc25C are
phosphorylated on specific TP sites and differentially localized in
human mitotic cells. PLoS One. 5:e117982010. View Article : Google Scholar : PubMed/NCBI
|
|
52
|
Villa Del Campo C, Lioux G, Carmona R,
Sierra R, Muñoz-Chápuli R, Clavería C and Torres M: Myc
overexpression enhances of epicardial contribution to the
developing heart and promotes extensive expansion of the
cardiomyocyte population. Sci Rep. 6:353662016. View Article : Google Scholar : PubMed/NCBI
|
|
53
|
Hollander MC and Fornace AJ Jr: Genomic
instability, centrosome amplification, cell cycle checkpoints and
Gadd45a. Oncogene. 21:6228–6233. 2002. View Article : Google Scholar : PubMed/NCBI
|
|
54
|
Zhan Q, Antinore MJ, Wang XW, Carrier F,
Smith ML, Harris CC and Fornace AJ Jr: Association with Cdc2 and
inhibition of Cdc2/Cyclin B1 kinase activity by the p53-regulated
protein Gadd45. Oncogene. 18:2892–2900. 1999. View Article : Google Scholar : PubMed/NCBI
|
|
55
|
Sarkisian MR and Siebzehnrubl D: Abnormal
levels of Gadd45alpha in developing neocortex impair neurite
outgrowth. PLoS One. 7:e442072012. View Article : Google Scholar : PubMed/NCBI
|