Introduction
Head and neck squamous cell carcinoma (HNSCC) is one
of the leading cancer types by incidence worldwide, with ~500,000
new cases each year worldwide and a five-year survival rate of
40–50% (1). Oral squamous cell
carcinoma (OSCC) is the most prevalent malignancy in oral cavity
and ranks sixth among the most common cancers worldwide (2,3).
Furthermore, OSCC is prevalent particularly in developing
countries, such as Indian subcontinent, and mainly a problem of
older men, accounting for 90% in the over 45 year-old group
(4). With characteristics of
rapid progression and worse outcome, OSCC is a deadly and
particularly risky because it progresses without producing pain or
symptoms that may be readily recognized by the patient in its early
stages (5). It is usually
discovered when the cancer has metastasized to the lymph nodes of
the neck (6). The etiology of
OSCC has not yet been well illustrated, and some risk factors may
be associated with it. Tobacco and alcohol consumption are the most
important risk factors, and tobacco smoking and alcohol intake have
a strong interactive effect on the risk of OSCC (7,8).
Other factors in OSCC include dietary factors, immunodeficiency and
viral infections such as chronic candidosis and herpes simplex
virus (8–10). Besides, the mutagen sensitivity is
related to the progression of OSCC (11–13). From relative risk factors, it has
been estimated that 75% of all oral cancers are preventable.
However, in the remaining 25% of patients who are not exposed to
these substances, the causes of their tumors remain unknown
(14). In this study, the gene
expression microarray data of OSCC samples both with lymph nodes
metastasis and without metastasis were investigated via microarray
analysis, in order to screen some potential pathogenic genes of
OSCC and provide some clues for the diagnose and treatment.
Materials and methods
mRNA expression microarray data
The mRNA expression microarray datasets GSE2280
(15) and GSE3524 (16) were downloaded from the Gene
Expression Omnibus (GEO, http://www.ncbi.nlm.nih.gov/geo/) database. The
microarray dataset GSE2280 contained 22 OSCC samples without
metastasis and 5 OSCC samples with lymph node metastasis. In
GSE3524, there were 16 OSCC samples and 4 normal tissue samples.
The former was detected with GPL96 [HG-U133A] Affymetrix Human
Genome U133A array platform, and the latter with GPL96 [HG-U133A]
Affymetrix Human Genome U133A array platform.
Data pre-processing and identification of
differentially expressed genes
The original data were converted into the
recognizable format by R, and the Robust Multi Array (RMA) of the
affy (17) package was used for
the background correction and normalization. After the data
pre-processing, the differentially expressed genes (DEGs) in OSCC
samples with lymph node metastasis compared with those without
metastasis (named as DEGs-1), regarding DEGs in IOSCC samples
compared with normal tissue samples (named as DEGs-2), were
selected out via the limma (18)
package of R according to the criteria: P-value <0.05 and
|log(fold2change)| >1. Besides, the two-way cluster
analysis of the 2 sets DEGs was conducted via the gplots package in
R, and their overlapped genes were found.
Functional enrichment analysis
Gene Ontology (GO) terms and Kyoto Encyclopedia of
Genes and Genomes (KEGG) pathway enrichment analysis of DEGs-1 and
DEGs-2 were performed via Database for Annotation, Visualization
and Integrated Discovery (DAVID, http://david.abcc.ncifcrf.gov/) (19). The GO terms and KEGG pathways with
P<0.05 were screened out.
Construction of the miRNA-gene regulated
network
The known and predictable miRNA regulating the
overlapped genes were selected via the TargetScan (20) database, and afterwards, the
miRNA-gene regulated pairs were obtained. Ultimately, the
miRNA-gene regulated network was constructed and visualized by
Cytoscape (21) software. The
nodes were screened out in the network, when the degree of node
attributes was ≥1, and 'degree' represented the connections with
other nodes.
Results
DEGs
A total of 233 DEGs (133 up- and 100 downregulated)
were identified in the sets of DEGs-1, and 410 (99 up- and 313
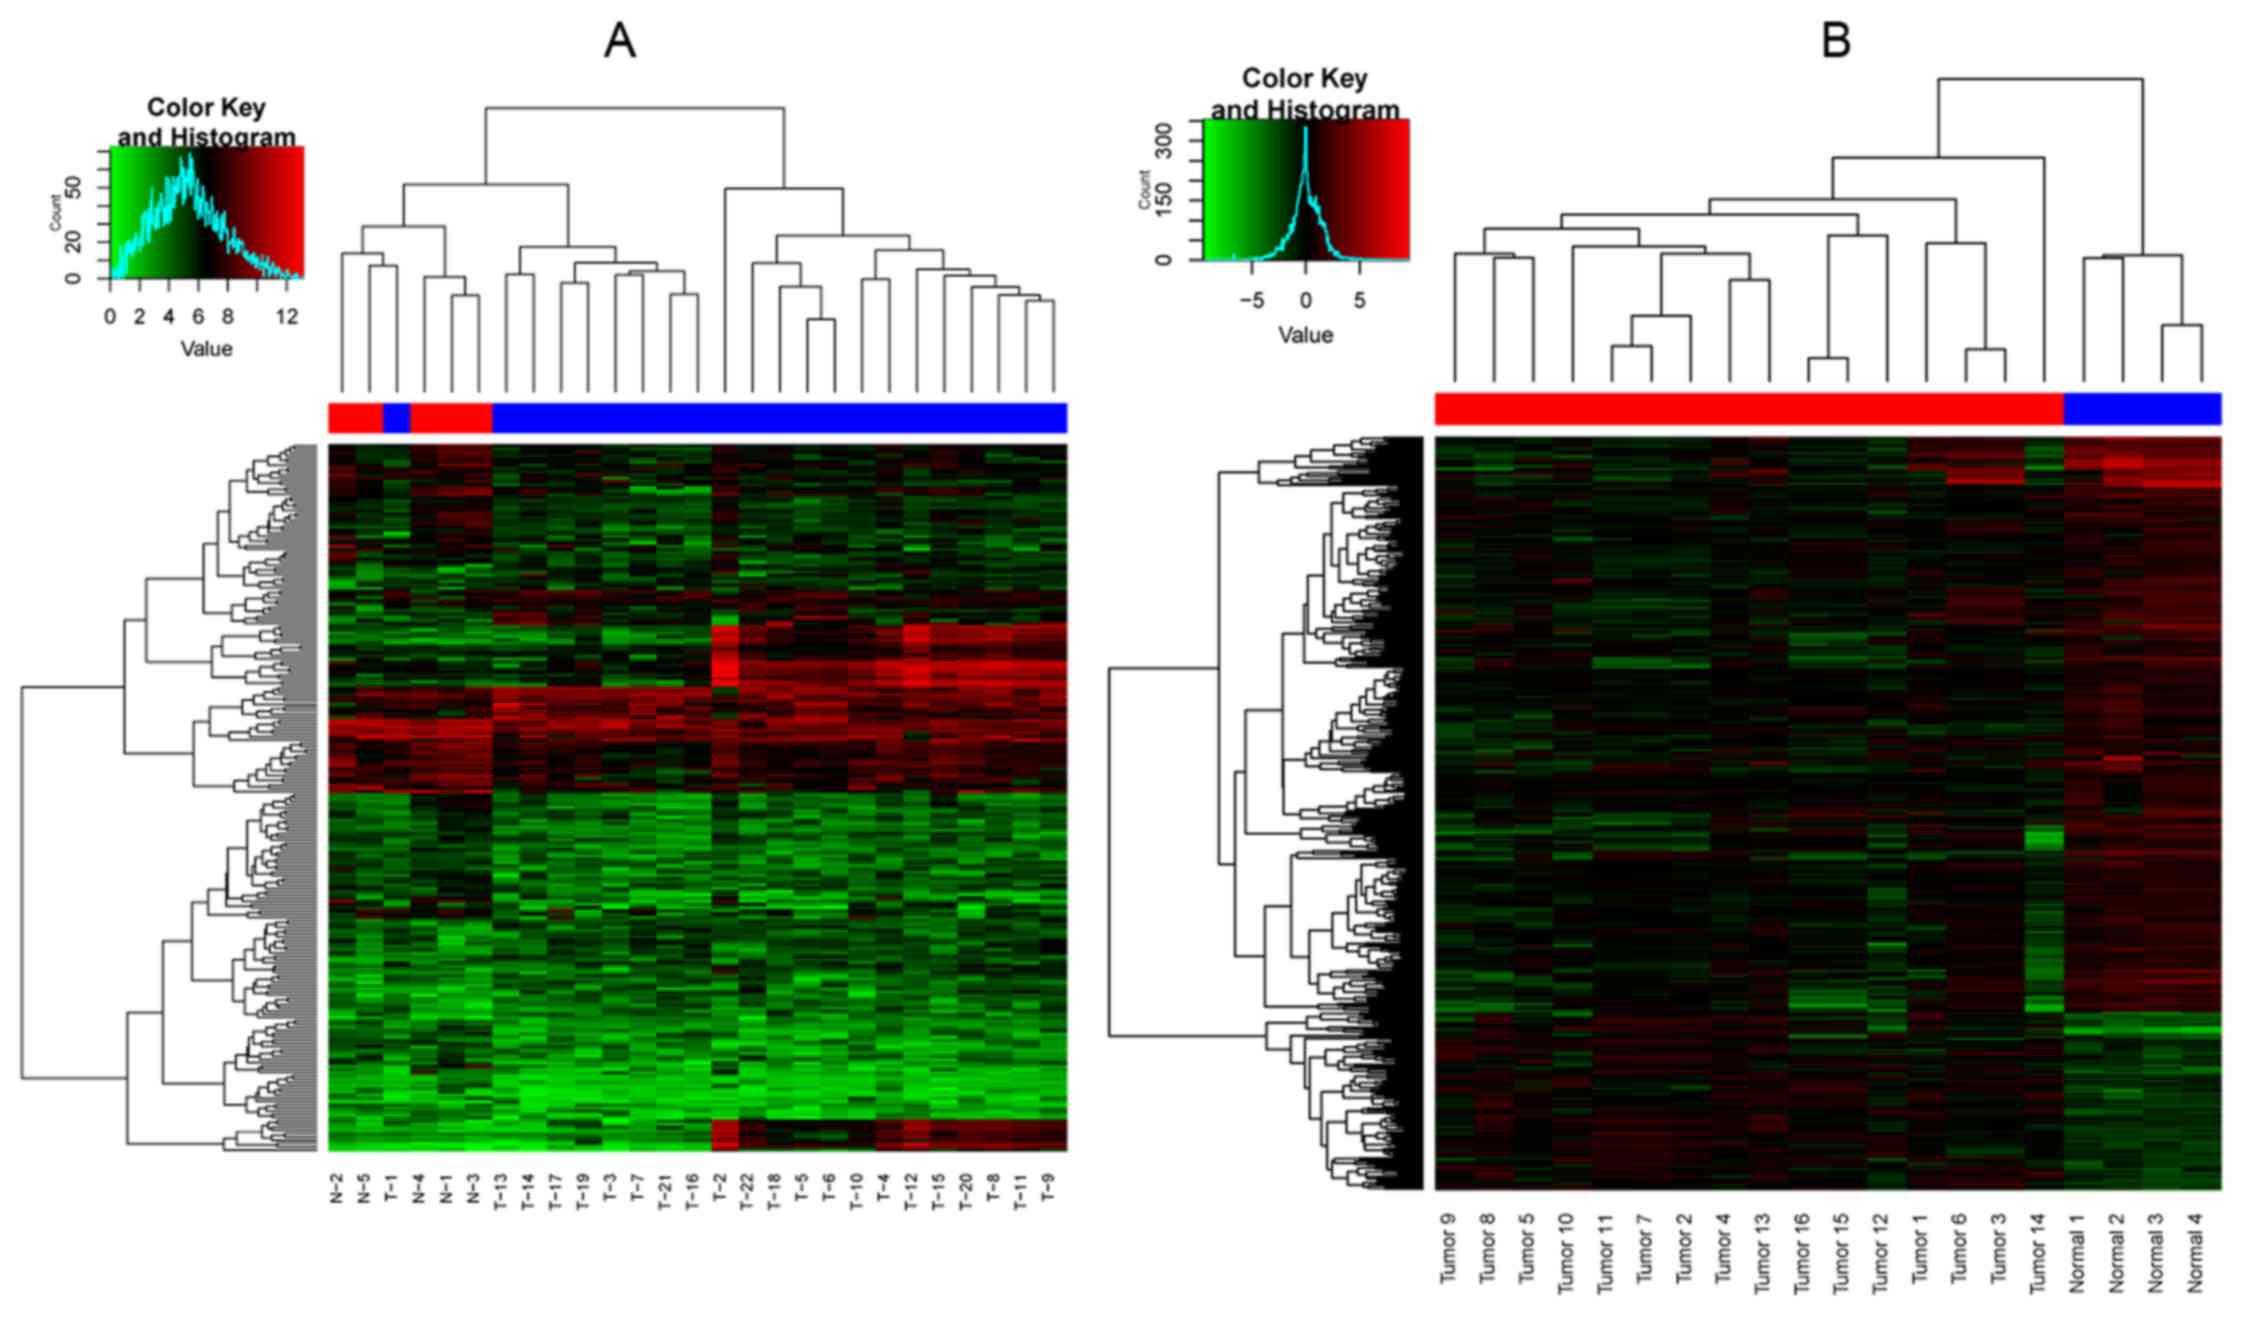
downregulated) in the sets of DEGs-2. The two-way cluster graph is
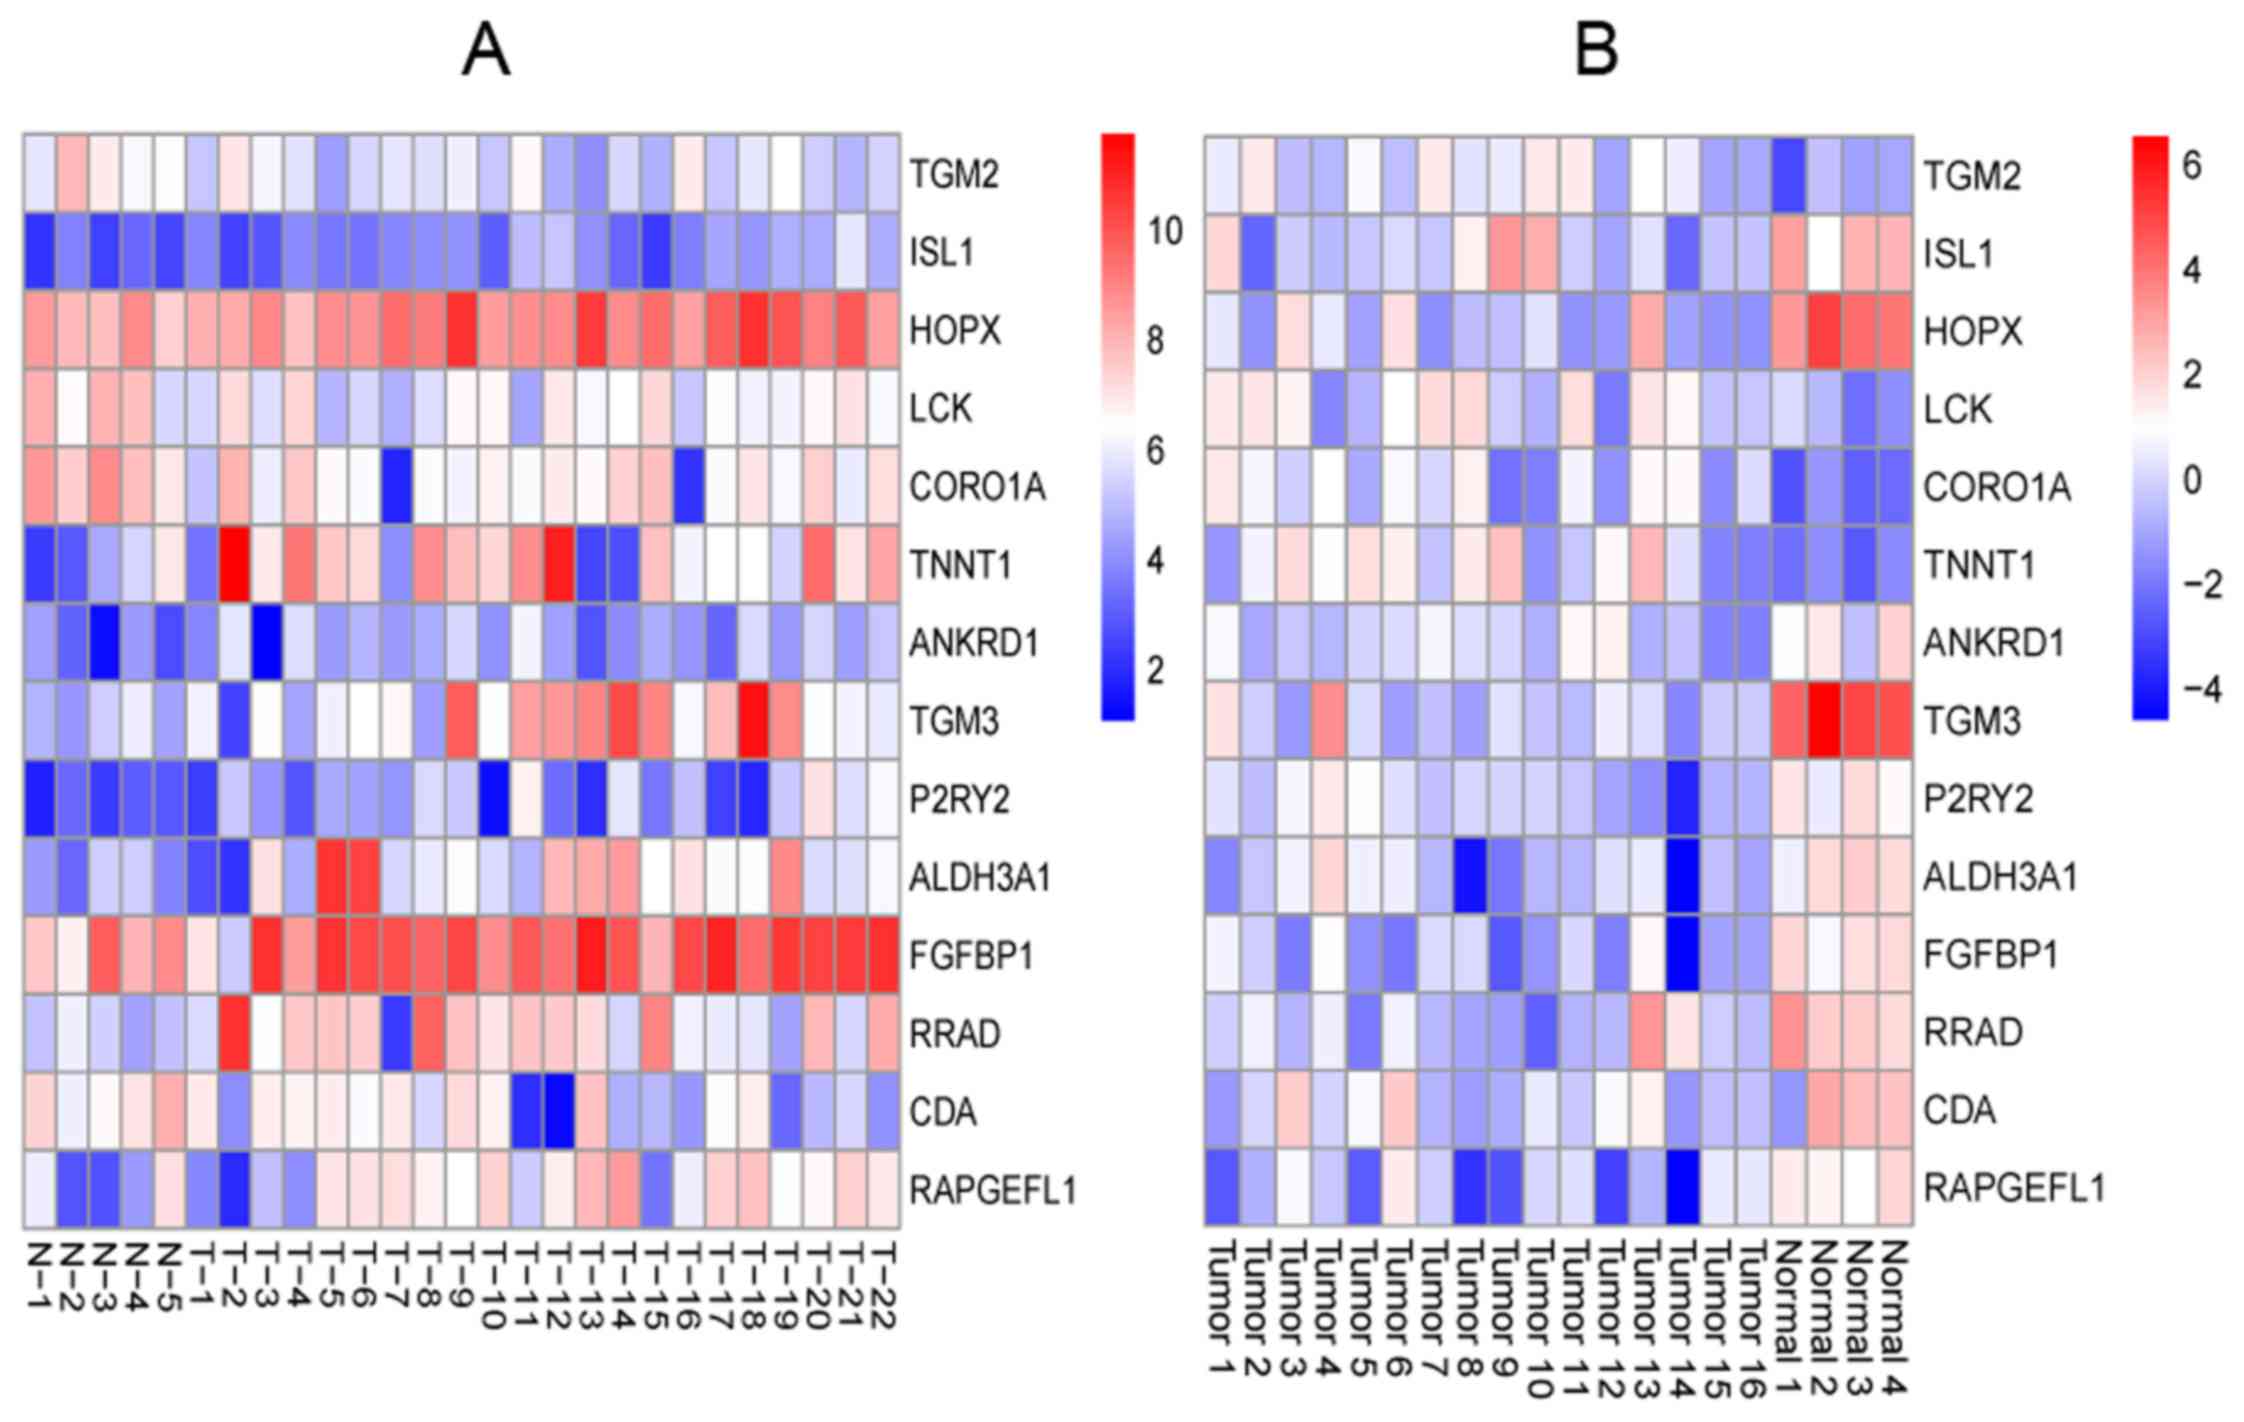
shown in Fig. 1. Fourteen
overlapped genes of the 2 set DEGs were found, and the heatmap of
the overlapped genes is shown in Fig.
2.
GO terms and KEGG pathways
DEGs-1 were enriched in 188 GO terms and 8 KEGG
pathways, and the top 10 GO terms and all the KEGG pathways are
shown in Tables IA and IIA. DEGs-2 were enriched in 228 GO
terms and 6 KEGG pathways, and the top 10 GO terms and all the KEGG
pathways are shown in Tables IB
and IIB.
 | Table IThe top 10 GO terms of DEGs-1 and
DEGs-2. |
Table I
The top 10 GO terms of DEGs-1 and
DEGs-2.
A, The top 10 GO
terms of DEGs-1
|
|---|
| Category | GO ID | GO name | Gene no. | P-value |
|---|
| CC | GO:0043292 | Contractile
fiber | 25 | 1.57E-21 |
| CC | GO:0030016 | Myofibril | 24 | 3.94E-21 |
| CC | GO:0030017 | Sarcomere | 22 | 1.06E-19 |
| CC | GO:0044449 | Contractile fiber
part | 23 | 1.26E-19 |
| BP | GO:0006936 | Muscle
contraction | 22 | 7.37E-15 |
| BP | GO:0003012 | Muscle system
process | 22 | 4.98E-14 |
| BP | GO:0006941 | Striated muscle
contraction | 14 | 6.77E-14 |
| MF | GO:0008307 | Structural
constituent of muscle | 12 | 5.45E-12 |
| CC | GO:0015629 | Actin
cytoskeleton | 23 | 1.54E-11 |
| CC | GO:0005865 | Striated muscle
thin filament | 8 | 4.69E-10 |
B, The top 10 GO
terms of DEGs-2
|
|---|
| Category | GO ID | GO name | Gene no. | P-value |
|---|
| BP | GO:0008544 | Epidermis
development | 29 | 9.63E-15 |
| BP | GO:0007398 | Ectoderm
development | 30 | 1.01E-14 |
| BP | GO:0009913 | Epidermal cell
differentiation | 17 | 1.57E-11 |
| CC | GO:0001533 | Cornified
envelope | 11 | 1.63E-11 |
| BP | GO:0030855 | Epithelial cell
differentiation | 22 | 2.01E-11 |
| BP | GO:0018149 | Peptide
cross-linking | 11 | 2.75E-10 |
| BP | GO:0030216 | Keratinocyte
differentiation | 15 | 5.79E-10 |
| CC | GO:0005792 | Microsome | 23 | 2.31E-08 |
| CC | GO:0042598 | Vesicular
fraction | 23 | 3.91E-08 |
| BP | GO:0060429 | Epithelium
development | 23 | 4.65E-08 |
| Table IIThe KEGG pathways of DEGs-1 and
DEGs-2. |
Table II
The KEGG pathways of DEGs-1 and
DEGs-2.
A, The KEGG
pathways of DEGs-1
|
|---|
| Category | Pathway name | Gene no. | P-value |
|---|
| KEGG_PATHWAY |
hsa04640:Hematopoietic cell lineage | 11 | 4.27E-06 |
| KEGG_PATHWAY | hsa04662:B cell
receptor signaling pathway | 10 | 1.02E-05 |
| KEGG_PATHWAY | hsa05416:Viral
myocarditis | 7 | 0.002174 |
| KEGG_PATHWAY |
hsa05410:Hypertrophic cardiomyopathy
(HCM) | 7 | 0.005363 |
| KEGG_PATHWAY | hsa05414:Dilated
cardiomyopathy | 7 | 0.007861 |
| KEGG_PATHWAY | hsa04670:Leukocyte
transendothelial migration | 7 | 0.024504 |
| KEGG_PATHWAY | hsa05340:Primary
immunodeficiency | 4 | 0.02834 |
| KEGG_PATHWAY | hsa04530:Tight
junction | 7 | 0.041961 |
B, The KEGG
pathways of DEGs-2
|
|---|
| Category | Pathway name | Gene no. | P-value |
|---|
| KEGG_PATHWAY | hsa00830:Retinol
metabolism | 9 | 1.12E-04 |
| KEGG_PATHWAY | hsa00982:Drug
metabolism | 8 | 0.00162 |
| KEGG_PATHWAY |
hsa00590:Arachidonic acid metabolism | 7 | 0.004545 |
| KEGG_PATHWAY | hsa00591:Linoleic
acid metabolism | 5 | 0.007262 |
| KEGG_PATHWAY | hsa00980:Metabolism
of xenobiotics by cytochrome p450 | 6 | 0.02595 |
| KEGG_PATHWAY | hsa00983:Drug
metabolism | 5 | 0.031687 |
The miRNA-gene regulated network
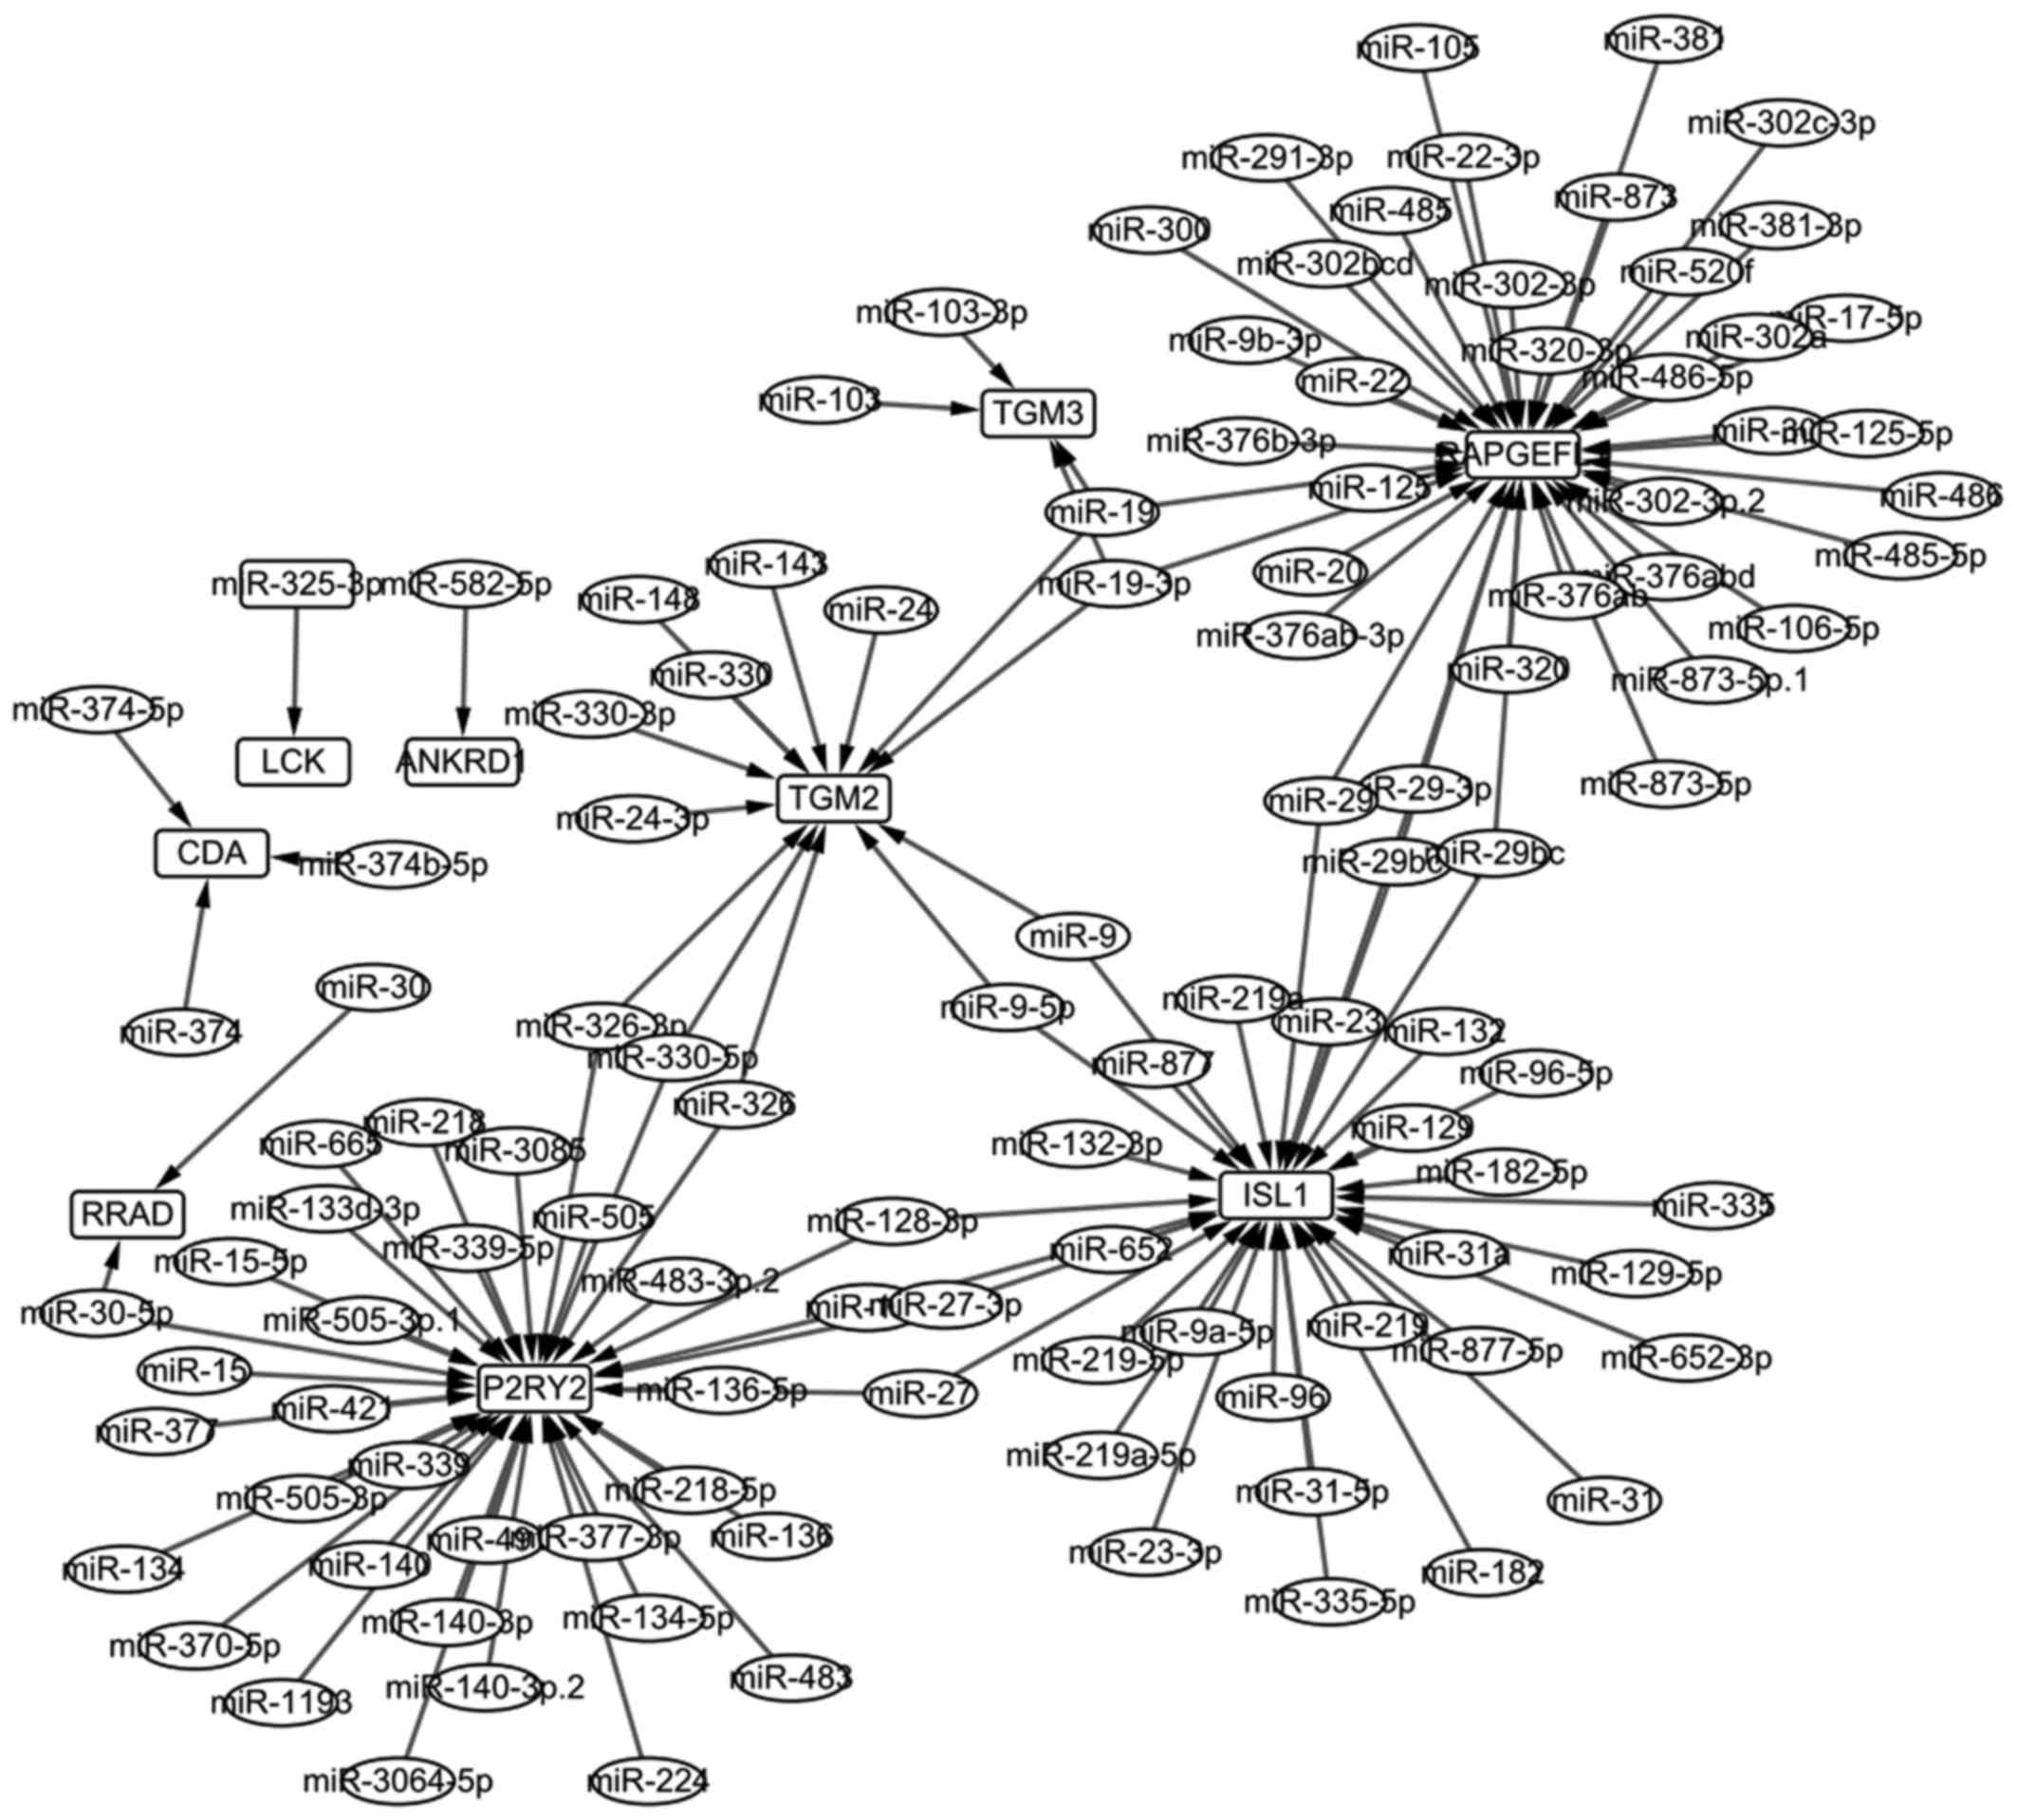
In total, 116 miRNAs regulating the overlapped genes
were screened out, and then 135 miRNA-gene regulated pairs were
obtained. Ultimately, the miRNA-gene regulated network was
constructed and is shown Fig. 3.
The network of 126 nodes were selected, and the top 20 are listed
in Table III.
| Table IIIThe top 20 in the miRNA-gene
regulated network. |
Table III
The top 20 in the miRNA-gene
regulated network.
| Node | Degree | Node | Degree |
|---|
| RAPGEFL1 | 39 | miR-27 | 2 |
| P2RY2 | 37 | miR-27-3p | 2 |
| ISL1 | 34 | miR-29 | 2 |
| TGM2 | 13 | miR-29-3p | 2 |
| TGM3 | 4 | miR-29bc | 2 |
| CDA | 3 | miR-29bc-3p | 2 |
| miR-19 | 3 | miR-30-5p | 2 |
| miR-19-3p | 3 | miR-325-3p | 2 |
| miR-128 | 2 | miR-326 | 2 |
| miR-128-3p | 2 | miR-326-3p | 2 |
Discussion
Two sets of DEGs were identified in this study,
namely DEGs in OSCC samples with lymph node metastasis compared
with those without (DEGs-1), and DEGs in OSCC samples compared with
normal tissue samples (DEGs-2). The two-way cluster analysis was
performed, and it was obvious that only one OSCC sample with
metastasis gathered in the OSCC samples without metastasis
(Fig. 1A), and none of OSCC
samples gathered in normal tissue samples (Fig. 1B). The result indicated that the
identified DEGs, both DEGs-1 and DEGs-2, were comparatively
accurate. Furthermore, 14 overlapped genes were obtained after
comparison of the 2 sets of DEGs. Fig. 2 shows that TGM2 was
overexpressed not only in OSCC samples but also in OSCC samples
with lymph node metastasis, while ISL1 expression was low.
TGM2 encoded TGM2, which was the most diverse and
ubiquitously expressed member of the oncostatin-M receptor (OSMR)
family. It was reported that OSMR is directly affected by the
increasing of cell migration and invasiveness (22). TGM2 is a multifunctional protein
and has both enzymatic and non-enzymatic functions. It was closely
related to its subcellular location and depended on the
pathophysiological context (23).
TGM2 was overexpressed in a range of cancer types, where it
was associated with metastasis and decreased overall patient
survival (24,25). Miyoshi et al (26) confirmed that TGM2 was a
novel marker for prognosis and therapeutic target in colorectal
cancer. Besides, ISL1 encoded ISL1, a LIM-homeodomain
transcription factor, which was essential for promoting pancreatic
islets proliferation and maintaining endocrine cells survival in
embryonic and postnatal pancreatic islets (27). In 2008, Cheung et al
(28) explored biomarkers of
neuroblastoma via microarray analysis and found that ISL1
was overexpressed in stage IV, which was related to the overall
survival rate and the degree of tumor progression. Another study
reported that ISL1 was a reliable marker of pancreatic endocrine
tumors and metastases thereof (29). Thus, it was indicated that
TGM2 and ISL1 may be biomarkers of OSCC and their
metastases.
In this study, DEGs-1 and DEGs-2 were enriched in
only 8 and 6 KEGG pathways (Tables
IIA and IIB) respectively, which was a small amount and
convenient to experimental study. DEGs of OSCC samples with lymph
metastasis were mainly enriched in cardiomyopathy-related pathways
(such as viral myocarditis, hypertrophic cardiomyopathy and dilated
cardiomyopathy) and immune-related pathways (such as B cell
receptor signaling pathway, leukocyte transendothelial migration
and primary immunodeficiency). Nevertheless, DEGs of OSCC samples
compared with normal tissue samples were all enriched in drug
metabolism or other metabolic processes of organic compounds (e.g.
retinol metabolism, arachidonic acid metabolism, linoleic acid
metabolism and metabolism of xenobiotics by cytochrome p450). A
report verified that it was similar in patients between with lung
squamous cell carcinoma and dilated cardiomyopathy induced by
myocardial metastasis (30).
Besides, immunodeficiency and other immune reactions were critical
in the occurrence and development of tumors. Although more
explorations are necessary to excavate relationships of these
pathways and OSCC, it was suspected that these cardiomyopathy or
immune related pathways may be associated with the metastasis of
OSCC. Similarly, these metabolic processes may be related to the
emergence of OSCC.
RAPGEFL1 and P2RY2 were the top two
nodes with the highest degree in the miRNA-gene regulated network.
In 2013, Takahashi et al (31) reported that RAPGEFL1 was
highly methylated in some esophageal squamous cell carcinoma (ESCC)
cell lines and it could be used to estimate the fraction of cancer
cells in tumor DNA. However, another study screened aberrant
methylation profile in ESCC, and results showed that
RAPGEFL1 was not involved in any biological processes
(32). In this study, we found
that RAPGEFL1 was not enriched in any GO terms or KEGG
pathways, but it could be regulated by most miRNAs (Fig. 3). P2RY2 was a member of
purinergic receptors (P2-receptors), which is considered
associating with both growth inhibition and programmed cell death
(33–35). Besides, extracellular ATP could
inhibit growth and induced apoptosis of various tumors by
activating specific P2-receptors (36–38). P2Y2-receptors were considered as
promising target proteins for innovative approaches in esophageal
cancer therapy (39). Therefore,
RAPGEFL1 and P2RY2 may be the potential pathogenic
genes for OSCC.
In conclusion, this study indicated that TGM2
and ISL1 may be the biomarkers of OSCC and their metastases.
Moreover, it also provided some other potential pathogenic genes
(e.g. P2RY2 and RAPGEFL1) in OSCC.
Acknowledgments
Not applicable.
Notes
[1]
Funding
This study was supported by the Beijing Natural
Science Foundation (no. 7164265) and the National Natural Science
Foundation (no. 81400560).
[2] Availability
of data and material
The datasets used and/or analyzed during the current
study are available from the corresponding author on reasonable
request.
[3] Authors'
contributions
JH designed the experiments. YD and PL performed
data analysis. YD and SZ wrote the main manuscript text and
prepared all the figures. JH and LT discussed the results and
revised the manuscript. All authors contributed to discussions
regarding the results and the manuscript. All authors have read and
approved the final manuscript.
[4] Ethics
approval and consent to participate
Not applicable.
[5] Consent for
publication
Not applicable.
[6] Competing
interests
The authors declare that they have no competing
interests.
References
|
1
|
Jemal A, Bray F, Center MM, Ferlay J, Ward
E and Forman D: Global cancer statistics. CA Cancer J Clin.
61:69–90. 2011. View Article : Google Scholar : PubMed/NCBI
|
|
2
|
Cao ZG and Li CZ: A single nucleotide
polymorphism in the matrix metalloproteinase-1 promoter enhances
oral squamous cell carcinoma susceptibility in a Chinese
population. Oral Oncol. 42:32–38. 2006. View Article : Google Scholar
|
|
3
|
Warnakulasuriya S: Living with oral
cancer: Epidemiology with particular reference to prevalence and
life-style changes that influence survival. Oral Oncol. 46:407–410.
2010. View Article : Google Scholar : PubMed/NCBI
|
|
4
|
Scully C and Bagan J: Oral squamous cell
carcinoma: Overview of current understanding of aetiopathogenesis
and clinical implications. Oral Dis. 15:388–399. 2009. View Article : Google Scholar : PubMed/NCBI
|
|
5
|
Ryu MH, Park HM, Chung J, Lee CH and Park
HR: Hypoxia-inducible factor-1alpha mediates oral squamous cell
carcinoma invasion via upregulation of alpha5 integrin and
fibronectin. Biochem Biophys Res Commun. 393:11–15. 2010.
View Article : Google Scholar : PubMed/NCBI
|
|
6
|
Severino P, Oliveira LS, Andreghetto FM,
Torres N, Curioni O, Cury PM, Toporcov TN, Paschoal AR and Durham
AM: Small RNAs in metastatic and non-metastatic oral squamous cell
carcinoma. BMC Med Genomics. 8:312015. View Article : Google Scholar : PubMed/NCBI
|
|
7
|
Zhang ZF, Morgenstern H, Spitz MR, Tashkin
DP, Yu GP, Hsu TC and Schantz SP: Environmental tobacco smoking,
mutagen sensitivity, and head and neck squamous cell carcinoma.
Cancer Epidemiol Biomarkers Prev. 9:1043–1049. 2000.PubMed/NCBI
|
|
8
|
Lewin F, Norell SE, Johansson H,
Gustavsson P, Wennerberg J, Biörklund A and Rutqvist LE: Smoking
tobacco, oral snuff, and alcohol in the etiology of squamous cell
carcinoma of the head and neck: A population-based case-referent
study in Sweden. Cancer. 82:1367–1375. 1998. View Article : Google Scholar : PubMed/NCBI
|
|
9
|
Binnie WH, Rankin KV and Mackenzie IC:
Etiology of oral squamous cell carcinoma. J Oral Pathol. 12:11–29.
1983. View Article : Google Scholar : PubMed/NCBI
|
|
10
|
Mehrotra R and Yadav S: Oral squamous cell
carcinoma: Etiology, pathogenesis and prognostic value of genomic
alterations. Indian J Cancer. 43:60–66. 2006. View Article : Google Scholar : PubMed/NCBI
|
|
11
|
Hsu TC, Spitz MR and Schantz SP: Mutagen
sensitivity: A biological marker of cancer susceptibility. Cancer
Epidemiol Biomarkers Prev. 1:83–89. 1991.PubMed/NCBI
|
|
12
|
Schantz SP, Zhang ZF, Spitz MS, Sun M and
Hsu TC: Genetic susceptibility to head and neck cancer: Interaction
between nutrition and mutagen sensitivity. Laryngoscope.
107:765–781. 1997. View Article : Google Scholar
|
|
13
|
Székely G, Remenár E, Kásler M and Gundy
S: Mutagen sensitivity of patients with cancer at different sites
of the head and neck. Mutagenesis. 20:381–385. 2005. View Article : Google Scholar : PubMed/NCBI
|
|
14
|
Walker DM, Boey G and McDonald LA: The
pathology of oral cancer. Pathology. 35:376–383. 2003. View Article : Google Scholar : PubMed/NCBI
|
|
15
|
O'Donnell RK, Kupferman M, Wei SJ, Singhal
S, Weber R, O'Malley B, Cheng Y, Putt M, Feldman M, Ziober B, et
al: Gene expression signature predicts lymphatic metastasis in
squamous cell carcinoma of the oral cavity. Oncogene. 24:1244–1251.
2005. View Article : Google Scholar
|
|
16
|
Manikandan M, Deva Magendhra Rao AK,
Arunkumar G, Manickavasagam M, Rajkumar KS, Rajaraman R and
Munirajan AK: Oral squamous cell carcinoma: microRNA expression
profiling and integrative analyses for elucidation of
tumourigenesis mechanism. Mol Cancer. 15:282016. View Article : Google Scholar : PubMed/NCBI
|
|
17
|
Gautier L, Cope L, Bolstad BM and Irizarry
RA: affy - analysis of Affymetrix GeneChip data at the probe level.
Bioinformatics. 20:307–315. 2004. View Article : Google Scholar : PubMed/NCBI
|
|
18
|
Diboun I, Wernisch L, Orengo CA and
Koltzenburg M: Microarray analysis after RNA amplification can
detect pronounced differences in gene expression using limma. BMC
Genomics. 7:2522006. View Article : Google Scholar : PubMed/NCBI
|
|
19
|
Sherman BT, Huang W, Tan Q, Guo Y, Bour S,
Liu D, Stephens R, Baseler MW, Lane HC and Lempicki RA: DAVID
Knowledgebase: A gene-centered database integrating heterogeneous
gene annotation resources to facilitate high-throughput gene
functional analysis. BMC Bioinformatics. 8:4262007. View Article : Google Scholar : PubMed/NCBI
|
|
20
|
Agarwal V, Bell GW, Nam JW and Bartel DP:
Predicting effective microRNA target sites in mammalian mRNAs.
eLife. 4:42015. View Article : Google Scholar
|
|
21
|
Shannon P, Markiel A, Ozier O, Baliga NS,
Wang JT, Ramage D, Amin N, Schwikowski B and Ideker T: Cytoscape: A
software environment for integrated models of biomolecular
interaction networks. Genome Res. 13:2498–2504. 2003. View Article : Google Scholar : PubMed/NCBI
|
|
22
|
Winder DM, Chattopadhyay A, Muralidhar B,
Bauer J, English WR, Zhang X, Karagavriilidou K, Roberts I, Pett
MR, Murphy G, et al: Overexpression of the oncostatin M receptor in
cervical squamous cell carcinoma cells is associated with a
pro-angiogenic phenotype and increased cell motility and
invasiveness. J Pathol. 225:448–462. 2011. View Article : Google Scholar : PubMed/NCBI
|
|
23
|
Wang Z and Griffin M: TG2, a novel
extracellular protein with multiple functions. Amino Acids.
42:939–949. 2012. View Article : Google Scholar
|
|
24
|
Mehta K, Kumar A and Kim HI:
Transglutaminase 2: A multitasking protein in the complex circuitry
of inflammation and cancer. Biochem Pharmacol. 80:1921–1929. 2010.
View Article : Google Scholar : PubMed/NCBI
|
|
25
|
Jung HJ, Chen Z, Wang M, Fayad L,
Romaguera J, Kwak LW and McCarty N: Calcium blockers decrease the
bortezomib resistance in mantle cell lymphoma via manipulation of
tissue transglutaminase activities. Blood. 119:2568–2578. 2012.
View Article : Google Scholar : PubMed/NCBI
|
|
26
|
Miyoshi N, Ishii H, Mimori K, Tanaka F,
Hitora T, Tei M, Sekimoto M, Doki Y and Mori M: TGM2 is a novel
marker for prognosis and therapeutic target in colorectal cancer.
Ann Surg Oncol. 17:967–972. 2010. View Article : Google Scholar
|
|
27
|
Guo T, Wang W, Zhang H, Liu Y, Chen P, Ma
K and Zhou C: ISL1 promotes pancreatic islet cell proliferation.
PLoS One. 6:e223872011. View Article : Google Scholar : PubMed/NCBI
|
|
28
|
Cheung IY, Feng Y, Gerald W and Cheung NK:
Exploiting gene expression profiling to identify novel minimal
residual disease markers of neuroblastoma. Clin Cancer Res.
14:7020–7027. 2008. View Article : Google Scholar : PubMed/NCBI
|
|
29
|
Schmitt AM, Riniker F, Anlauf M, Schmid S,
Soltermann A, Moch H, Heitz PU, Klöppel G, Komminoth P and Perren
A: Islet 1 (Isl1) expression is a reliable marker for pancreatic
endocrine tumors and their metastases. Am J Surg Pathol.
32:420–425. 2008. View Article : Google Scholar : PubMed/NCBI
|
|
30
|
Ogino H, Nishimura N, Kitamura A, Ishikawa
G, Okafuji K, Tomishima Y, Jinta T, Yamazoe M, Yang Y and
Chohnabayashi N: A patient with lung squamous cell carcinoma
presenting with severe cardiac dysfunction similar to dilated
cardiomyopathy with left bundle branch block induced by myocardial
metastasis. Intern Med. 53:2353–2357. 2014. View Article : Google Scholar : PubMed/NCBI
|
|
31
|
Takahashi T, Matsuda Y, Yamashita S,
Hattori N, Kushima R, Lee YC, Igaki H, Tachimori Y, Nagino M and
Ushijima T: Estimation of the fraction of cancer cells in a tumor
DNA sample using DNA methylation. PLoS One. 8:e823022013.
View Article : Google Scholar : PubMed/NCBI
|
|
32
|
Chen Y, Yin D, Li L, Deng YC and Tian W:
Screening aberrant methylation profile in esophageal squamous cell
carcinoma for Kazakhs in Xinjiang area of China. Mol Biol Rep.
42:457–464. 2015. View Article : Google Scholar
|
|
33
|
Fang WG, Pirnia F, Bang YJ, Myers CE and
Trepel JB: P2-purinergic receptor agonists inhibit the growth of
androgen-independent prostate carcinoma cells. J Clin Invest.
89:191–196. 1992. View Article : Google Scholar : PubMed/NCBI
|
|
34
|
Duncan G, Riach RA, Williams MR, Webb SF,
Dawson AP and Reddan JR: Calcium mobilisation modulates growth of
lens cells. Cell Calcium. 19:83–89. 1996. View Article : Google Scholar : PubMed/NCBI
|
|
35
|
McConkey DJ and Orrenius S: The role of
calcium in the regulation of apoptosis. Biochem Biophys Res Commun.
239:357–366. 1997. View Article : Google Scholar : PubMed/NCBI
|
|
36
|
Fredholm BB, Abbracchio MP, Burnstock G,
Daly JW, Harden TK, Jacobson KA, Leff P and Williams M:
Nomenclature and classification of purinoceptors. Pharmacol Rev.
46:143–156. 1994.PubMed/NCBI
|
|
37
|
Bronte V, Macino B, Zambon A, Rosato A,
Mandruzzato S, Zanovello P and Collavo D: Protein tyrosine kinases
and phosphatases control apoptosis induced by extracellular
adenosine 5′-triphosphate. Biochem Biophys Res Commun. 218:344–351.
1996. View Article : Google Scholar : PubMed/NCBI
|
|
38
|
Ishikawa S, Higashiyama M, Kusaka I and
Saito T, Nagasaka S, Fukuda S and Saito T: Extracellular ATP
promotes cellular growth of renal inner medullary collecting duct
cells mediated via P2u receptors. Nephron. 76:208–214. 1997.
View Article : Google Scholar : PubMed/NCBI
|
|
39
|
Maaser K, Höpfner M, Kap H, Sutter AP,
Barthel B, von Lampe B, Zeitz M and Scherübl H: Extracellular
nucleotides inhibit growth of human oesophageal cancer cells via
P2Y(2)-receptors. Br J Cancer. 86:636–644. 2002. View Article : Google Scholar : PubMed/NCBI
|