Introduction
Breast cancers are often classified by stage,
pathology, grade, and the expression of estrogen receptor (ER),
progesterone receptor (PR) or human epidermal growth factor
receptor 2 (Her2/neu). While hormone-based pharmacotherapies
directly target these receptors (1–3),
triple-negative breast cancer (TNBC) is more likely to recur
earlier at distant sites, thus resulting in poor overall prognoses
(4–7), due to the absence of these targets
(4,5,7).
Notably, ~15% of breast cancer cases are diagnosed as TNBC
(8–10). However, successful therapies for
the treatment of TNBC are currently unavailable. Therefore, novel
therapeutic strategies are required for TNBC treatment.
Previous studies have reported that histone
deacetylase inhibitors (HDACis) may be considered a promising novel
class of anticancer agents (11,12). HDACis are able to induce numerous
cellular epigenetic alterations, enhance acetylation of various
proteins, including transcription factors, molecular chaperones and
structural components (11,13,14), and modulate the growth,
differentiation and survival of cells (15–18). Notably, it has been revealed that
HDACis serve a critical role in modulating cell cycle arrest,
apoptosis, angiogenesis, oncogene expression, and tumor cell
invasion and metastasis (11,12,19,20). However, the exact mechanism
underlying the anticancer effects of HDACis remains unclear.
Previous studies have demonstrated that HDACis
suppress breast cancer cells in vitro and in vivo.
The effects of HDACis on breast cancer cells may be due to their
ability to alter the expression of hormone receptors, including ER
and PR. Specifically, previous studies have reported that HDACis
can increase ER and PR expression levels (21,22). In addition, HDACis can induce
apoptosis and autophagy of breast cancer cells exhibiting Her-2
overexpression and basal-like/TNBC, and may reduce Her-2 gene
expression. While previous studies have indicated that microRNAs
(miRNAs/miRs) serve an important role in the effects of HDACis on
Her-2 gene expression, the mechanisms underlying the effects of
HDACis on ER and PR expression remain unknown (23–25). Therefore, the present study aimed
to examine the role of miRNAs in the effects of HDAC is on breast
cancer cells.
Materials and methods
Cell culture
The human breast cancer cell lines MDA-MB-231 and
BT474 were obtained from the American Type Culture Collection
(Manassas, VA, USA). All cells were maintained in Dulbecco's
modified Eagles's medium/F-12 (1:1) medium (Invitrogen; Thermo
Fisher Scientific, Inc., Waltham, MA, USA) supplemented with 10%
fetal bovine serum (Invitrogen; Thermo Fisher Scientific, Inc.),
and were cultured at 37°C in a humidified atmosphere containing 95%
air and 5% CO2. The cells were split twice a week.
miRNA expression microarray
Total RNA was isolated from cells using
TRIzol® (Invitrogen; Thermo Fisher Scientific, Inc.). An
ND-1000 spectrophotometer (NanoDrop Technologies; Thermo Fisher
Scientific, Inc., Wilmington, DE, USA) with an Experion system
(Bio-Rad Laboratories, Inc., Hercules, CA, USA) was used to
quantify and confirm the quality of RNA samples. Extracted total
RNA was labeled with Hy5 using the miRCURY LNA™ microRNA Hy5 Power
Labeling kit (Exiqon, Inc., Woburn, MA, USA). Labeled RNAs were
hybridized onto 3D-Gene Human miRNA Oligo chips (v.14 1.0.1; Toray
Industries, Inc., Tokyo, Japan). The annotation and oligonucleotide
sequences of the probes were confirmed using the miRBase miRNA
database release 14 (http://www.mirbase.org/). After numerous washes with
3D-Gene Human miRNA Oligo chips, fluorescent signals were scanned
using the ScanArray Lite Scanner (Perkin-Elmer, Inc., Waltham, MA,
USA) and were analyzed with GenePix Pro 7 software (Molecular
Devices, LLC, Sunnyvale, CA, USA). Raw data were normalized by
subtracting the mean intensity of the background signal (blank
spots). Signal intensities >2 standard deviations of the
background signal intensity were considered to be valid. The
relative expression levels of a given miRNA were calculated by
comparing the signal intensities of the averaged valid spots with
their mean value throughout the microarray experiments. The data
were normalized, and the significantly differentially expressed
miRNAs were obtained by comparing cMCL with aMCL using an
independent sample t-test (P<0.05). A heat map of expression
data from the selected miRNAs was generated using MeV software
(http://mev.tm4.org/).
Reverse transcription-polymerase chain
reaction (RT)-PCR and RT-quantitative (q)PCR
Total RNA was extracted using a modified
chloroform/phenol procedure (TRIzol®; Invitrogen; Thermo
Fisher Scientific, Inc.). First-strand cDNA was generated using a
High Capacity cDNA Reverse Transcription kit (Applied Biosystems;
Thermo Fisher Scientific, Inc.) according to the manufacturer's
protocol. To quantify mRNA levels, RT-qPCR was performed using
ABsolute Blue qPCR Master Mix (Thermo Fisher Scientific, Inc.)
according to the manufacturer's protocol. The primers used were as
follows: ERα forward, 5′-TGATGAAAGGTGGGATACGA-3′ and reverse,
5′-AAGGTTGGCAGCTCTCATGT-3′; PR forward,
5′-TCGAGTCATTACCTCAGAAGAT-3′ and reverse,
5′-CCCACAGGTAAGGACACCATA-3′; HER2 forward,
5′-AACTGCACCCACTCCTGTGT-3′ and reverse, 5′-TGATGAGGATCCCAAAGACC-3′;
β-actin forward, 5′-CTGTGGCATCCACGAAACTA-3′ and reverse,
5′-CGCTCAGGAGGAGCAATG-3′. β-actin expression was used as an
internal control for conventional RT-PCR and RT-qPCR. The
thermocycling conditions were as follows: RT-PCR, 1 µg total
RNA was reverse-transcribed using the GeneAmp RNA PCR kit
(Perkin-Elmer, Inc.). Subsequently, 2 µl of the resulting
cDNA samples was used in each PCR. The routine PCR program was 30
cycles of 1 min at 94°C, 1 min at 60°C (annealing temperature), and
1 min at 72°C; RT-qPCR, first-strand cDNA was generated using a
High Capacity cDNA Reverse Transcription kit (Applied Biosystems;
Thermo Fisher Scientific, Inc.) according to the manufacturer's
protocol. To quantify mRNA levels, RT-qPCR was performed using
ABsolute Blue qPCR Master Mix (Thermo Fisher Scientific, Inc.)
according to the manufacturer's protocol. All RT-qPCR reactions
were conducted using a 7500 Fast Real-Time PCR system (Applied
Biosystems; Thermo Fisher Scientific, Inc.) under the following
conditions: 95°C for 3 min, followed by 40 cycles of 15 sec at 95°C
and 30 sec at 55°C. All RT-qPCR reactions were conducted using a
7500 Fast Real-Time PCR system (Applied Biosystems; Thermo Fisher
Scientific, Inc.). For RT-PCR, after PCR, the products were
resolved in 2% agarose gel with ethidium bromide. The images were
captured under UV transillumination. For RT-qPCR, the mRNA
expression level was quantified by determining the cycle threshold
(CT), which is the number of PCR cycles required for the
fluorescence to exceed a value significantly higher than the
background fluorescence.
Analysis of miRNA expression
Total RNA, including small RNA, was extracted and
purified using the miRNeasy Mini kit (Qiagen, Inc., Valencia, CA,
USA) according to the manufacturer's protocol. TaqMan MicroRNA RT
kit (Applied Biosystems; Thermo Fisher Scientific, Inc.) was first
used to generate cDNA using hairpin primers. The expression levels
of specific miRNAs were measured by qPCR using TaqMan MicroRNA
Assays, according to the manufacturer's protocol. RNU6B was used as
an internal control to normalize all data using the TaqMan RNU6B
assay (Applied Biosystems; Thermo Fisher Scientific, Inc.). RNU6B
levels were unaffected by HDACis treatment. The relative miRNA
expression levels were calculated using the comparative Cq method
(ΔΔCq) (26).
Transfection of cells with miRNA
inhibitors
Cell transfection with miRNA hairpin inhibitors or
negative control inhibitors was conducted using HiPerFect
Transfection Reagent (Qiagen, Inc.) according to the manufacturer's
protocol. The miRIDIAN hairpin inhibitors of miR-762 or miR-642a-3p
and the corresponding negative control (NC) were purchased from
Thermo Scientific Dharmacon (Shanghai, China). BT474 cells were
seeded into 96-well plates at a density of 2×10⁵
cells/well and cultured at 37°C for 24 h. A final concentration of
10 nM miR-762 or miR-642a-3p or NC was transfected into target
cells using Hiperfect (Qiagen, Inc.) and Opti-MEM® I
reduced serum medium (Thermo Fisher Scientific, Inc.), according to
the manufacturer's protocol.
Cell proliferation assay and
quantification of apoptosis
Cell viability was determined using the CellTiter
96® AQueous Non-Radioactive Cell Proliferation Assay kit
(Thermo Fisher Scientific, Inc.). Briefly, cells (2×10⁵
cells/well) were plated into 96-well plates with complete medium
for 24 h, and were cultured in control medium or medium containing
a series of doses of HDACis for a further 48 h at 37°C. In
addition, a specific apoptotic ELISA kit (cat. no. 11544675001;
Roche Diagnostics, Indianapolis, IN, USA) was used to
quantitatively measure cytoplasmic histone-associated DNA fragments
(mononucleosomes and oligonucleosomes) according to the
manufacturer's protocol.
Western blot analysis
Protein expression levels were determined by western
blot analysis. Cells were lysed in RIPA buffer (50 mM Tris-HCl, pH
7.4, 150 mM NaCl, 1% Triton X-100, 1% sodium dodecyl sulfate, 1%
sodium deoxycholate, 1 mM EDTA) together with a complete
(EDTA-free) protease inhibitor cocktail (Kodak, Rochester, NY,
USA), 1 mM phenylmethylsulfonyl fluoride, and phosphatase
inhibitors (5 mM sodium orthovanadate). Protein concentration was
determined using Bradford Reagent (Bio-Rad Laboratories, Inc.).
Equal amounts of total cell lysates were boiled in Laemmli
SDS-sample buffer. Samples containing equal amounts of protein (50
µg) per lane were loaded and separated by SDS-PAGE in 10%
gels and transferred to nitrocellulose membranes (Bio-Rad
Laboratories, Inc.). The membranes were incubated for 1 h in 5%
skimmed milk and probed overnight with specific primary antibodies
(mouse monoclonal anti-β-actin (A5316; dilution 1:1,000;
Sigma-Aldrich, Shanghai, China), rabbit monoclonal anti-ERα
(ab108398; dilution 1:1,000), rabbit monoclonal anti-HER2/ErbB2
(ab134182; dilution 1:1,000), and rabbit polyclonal
anti-progesterone receptor (ab32085; dilution 1:1,000) (all from
Abcam, Shanghai, China) at 4°C. Subsequently, the blots were
incubated with horseradish peroxidase-labeled secondary goat
anti-rabbit antibody (Sigma-Aldrich). Finally, the signals were
detected using enhanced chemiluminescence reagents (GE Healthcare
Bio-Sciences, Pittsburgh, PA, USA).
Statistical analysis
All experiments were repeated at least two times.
Data are presented as means ± SD. Statistical analyses of the
experimental data were determined using one-way analysis of
variance followed by Bonferroni correction, where appropriate.
Statistical analysis was performed using SPSS version 11.0
statistic software package. P<0.05 was considered to indicate a
statistically significant difference.
Results
Effects of HDACis on the mRNA expression
levels of ER, PR and Her2/neu in breast cancer cells
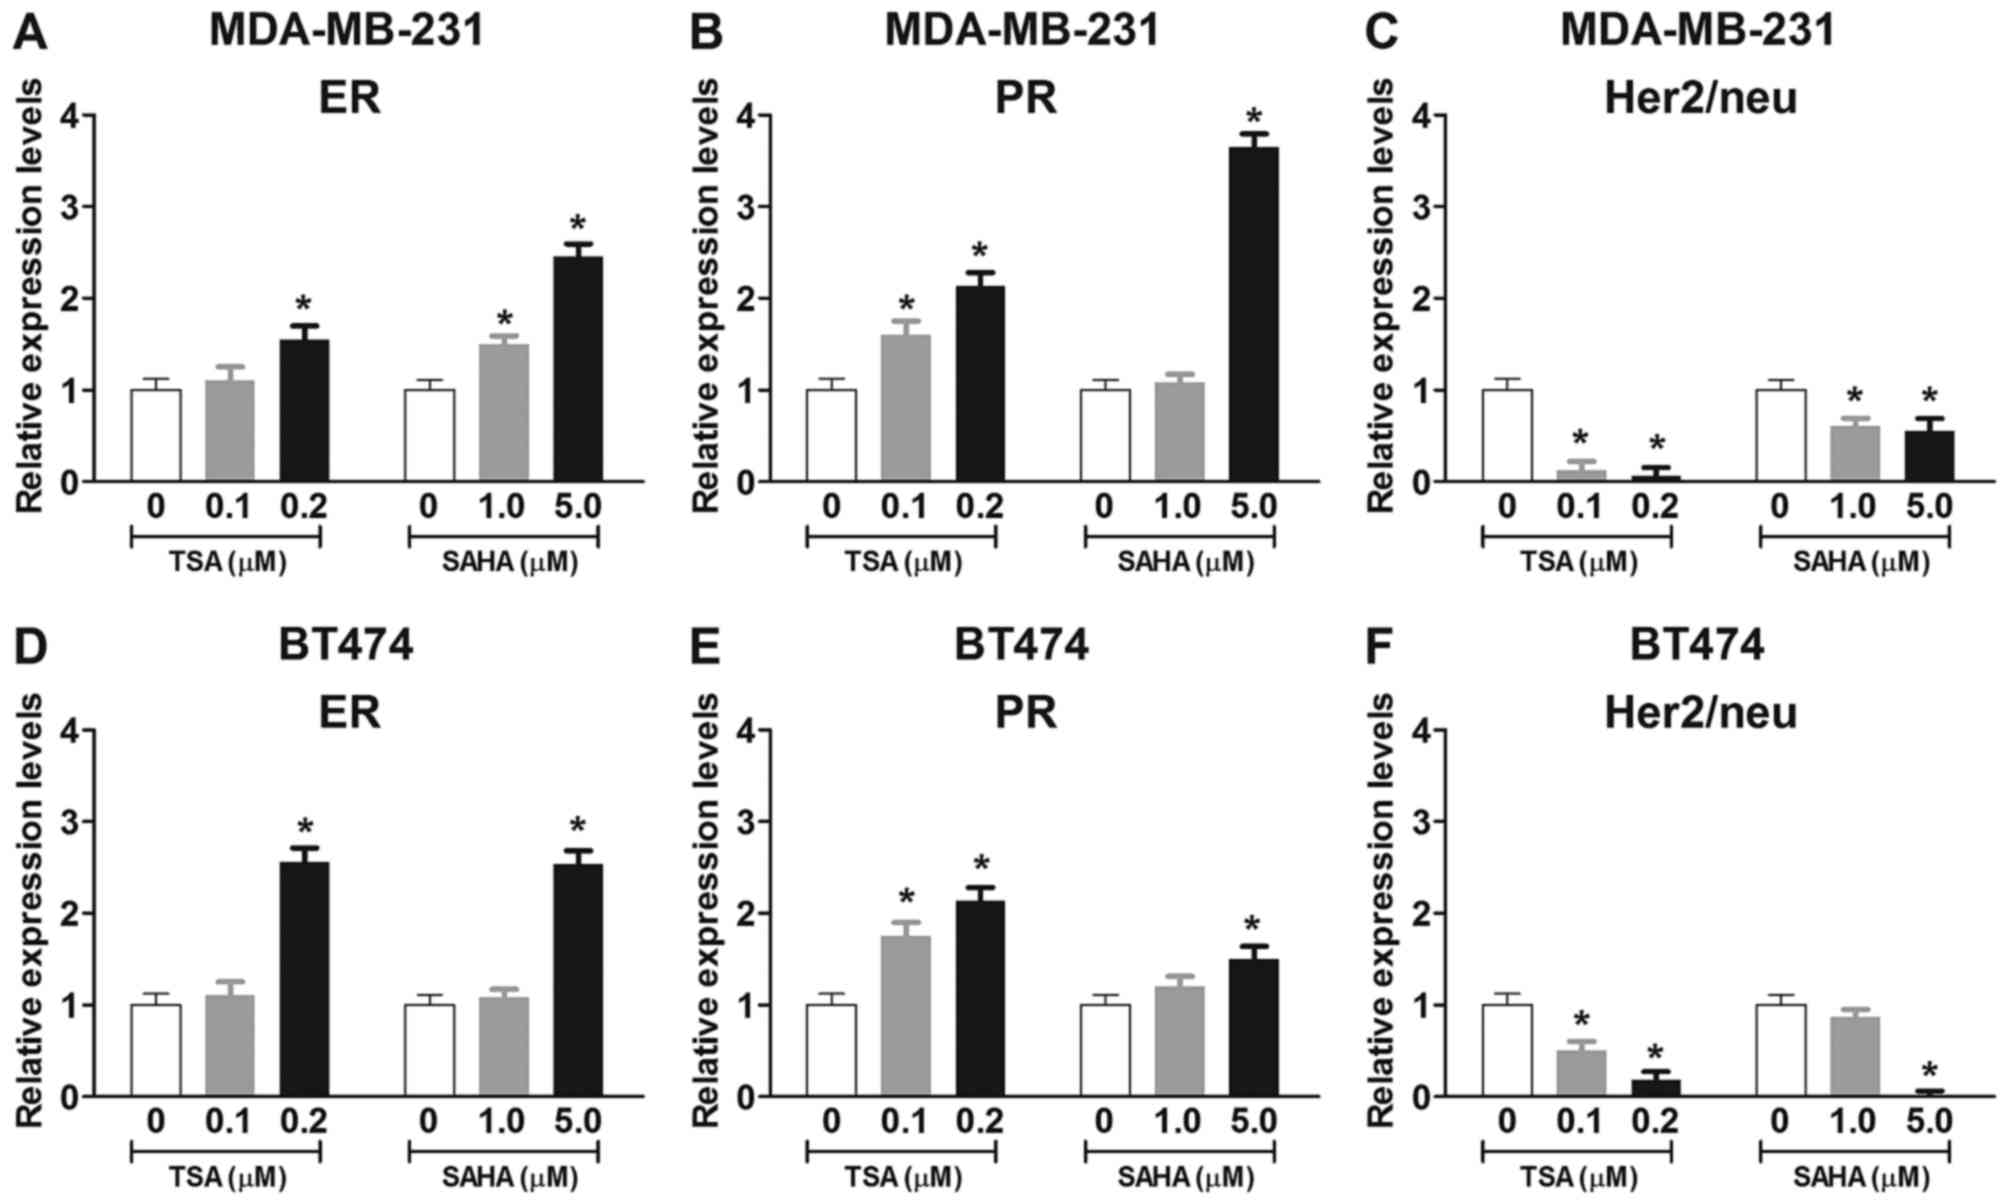
In order to examine the effects of HDACis on the
mRNA expression levels of ER, PR and Her2/neu in breast cancer
cells, MDA-MB-231 and BT474 cells were treated with trichostatin A
(TSA; 0.1 or 0.2 µM) or vorinostat (SAHA; 1.0 or 5.0
µM) for 48 h (Fig. 1).
Conventional RT-PCR and RT-qPCR revealed that treatment with TSA or
SAHA for 48 h dose-dependently enhanced the mRNA expression levels
of ER and PR in MDA-MB-231 and BT474 cells (Fig. 1A, B, D and E). Furthermore,
treatment with TSA or SAHA for 48 h dose-dependently reduced the
mRNA expression levels of Her2/neu in MDA-MB-231 and BT474 cells
(Fig. 1C and F). These findings
suggested that TSA and SAHA may alter ER, PR and Her2/neu
expression via a transcription-dependent mechanism.
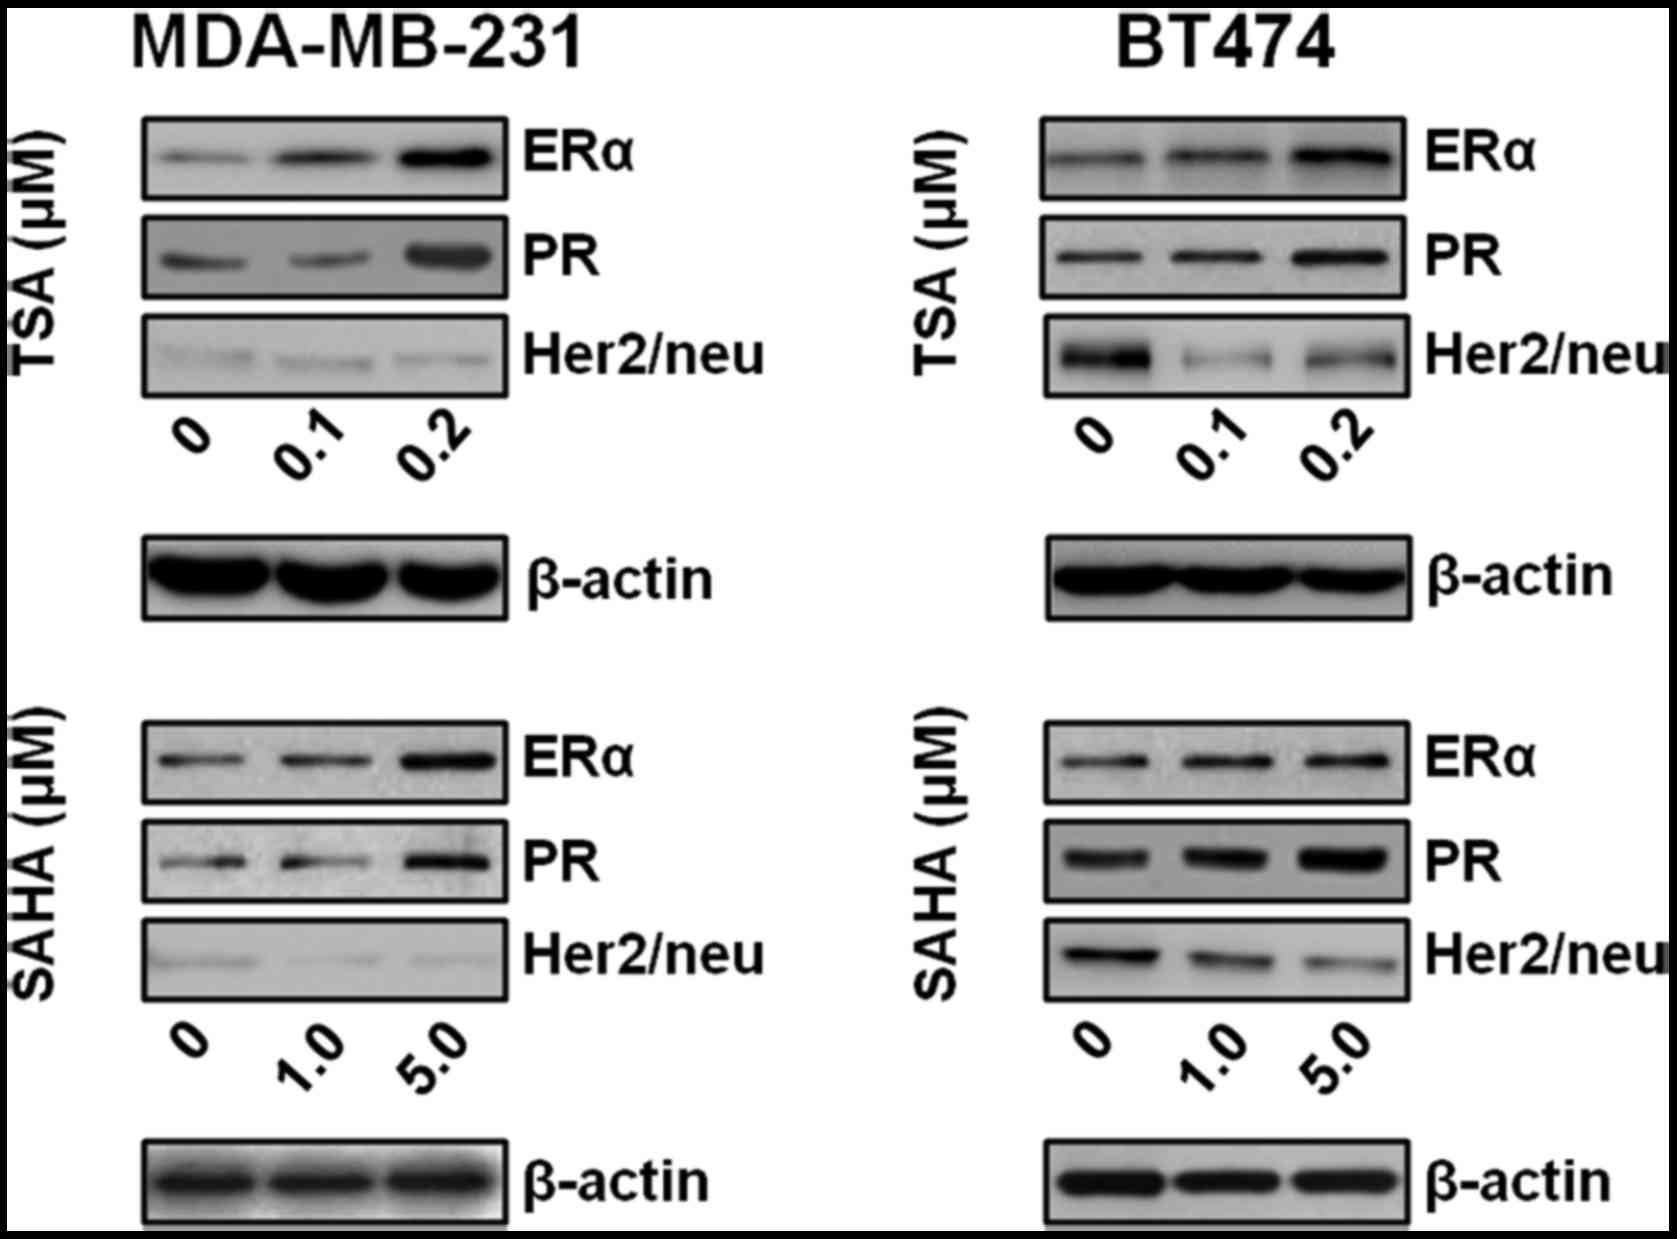
TSA and SAHA enhance the protein
expression levels of ER and PR, and reduce the protein expression
levels of Her2/neu
The present study also investigated whether TSA or
SAHA may alter ER, PR and Her2/neu expression at the protein level.
TSA and SAHA increased the protein expression levels of ER and PR
in MDA-MB-231 and BT474 cells (Fig.
2). In addition, TSA and SAHA dose-dependently reduced the
protein expression levels of Her2/neu in BT474 cells, which exhibit
Her2/neu overexpression, but not in MDA-MB-231 cells, which is a
TNBC cell line (Fig. 2).
TSA and SAHA treatment alters miRNA
expression levels in BT474 cells
It is well known that miRNAs generally regulate gene
expression by targeting mRNAs for degradation or translational
repression (27–29). In addition, it has been reported
that HDAC inhibition leads to rapid alteration of miRNA expression
(30). In the present study, the
mRNA and protein expression levels of ER, PR and Her2/neu were
markedly altered in Her2/neu-overexpressing BT474 cells upon TSA or
SAHA treatment. Therefore, it may be hypothesized that TSA or SAHA
induces the expression of specific miRNAs that target ER, PR and
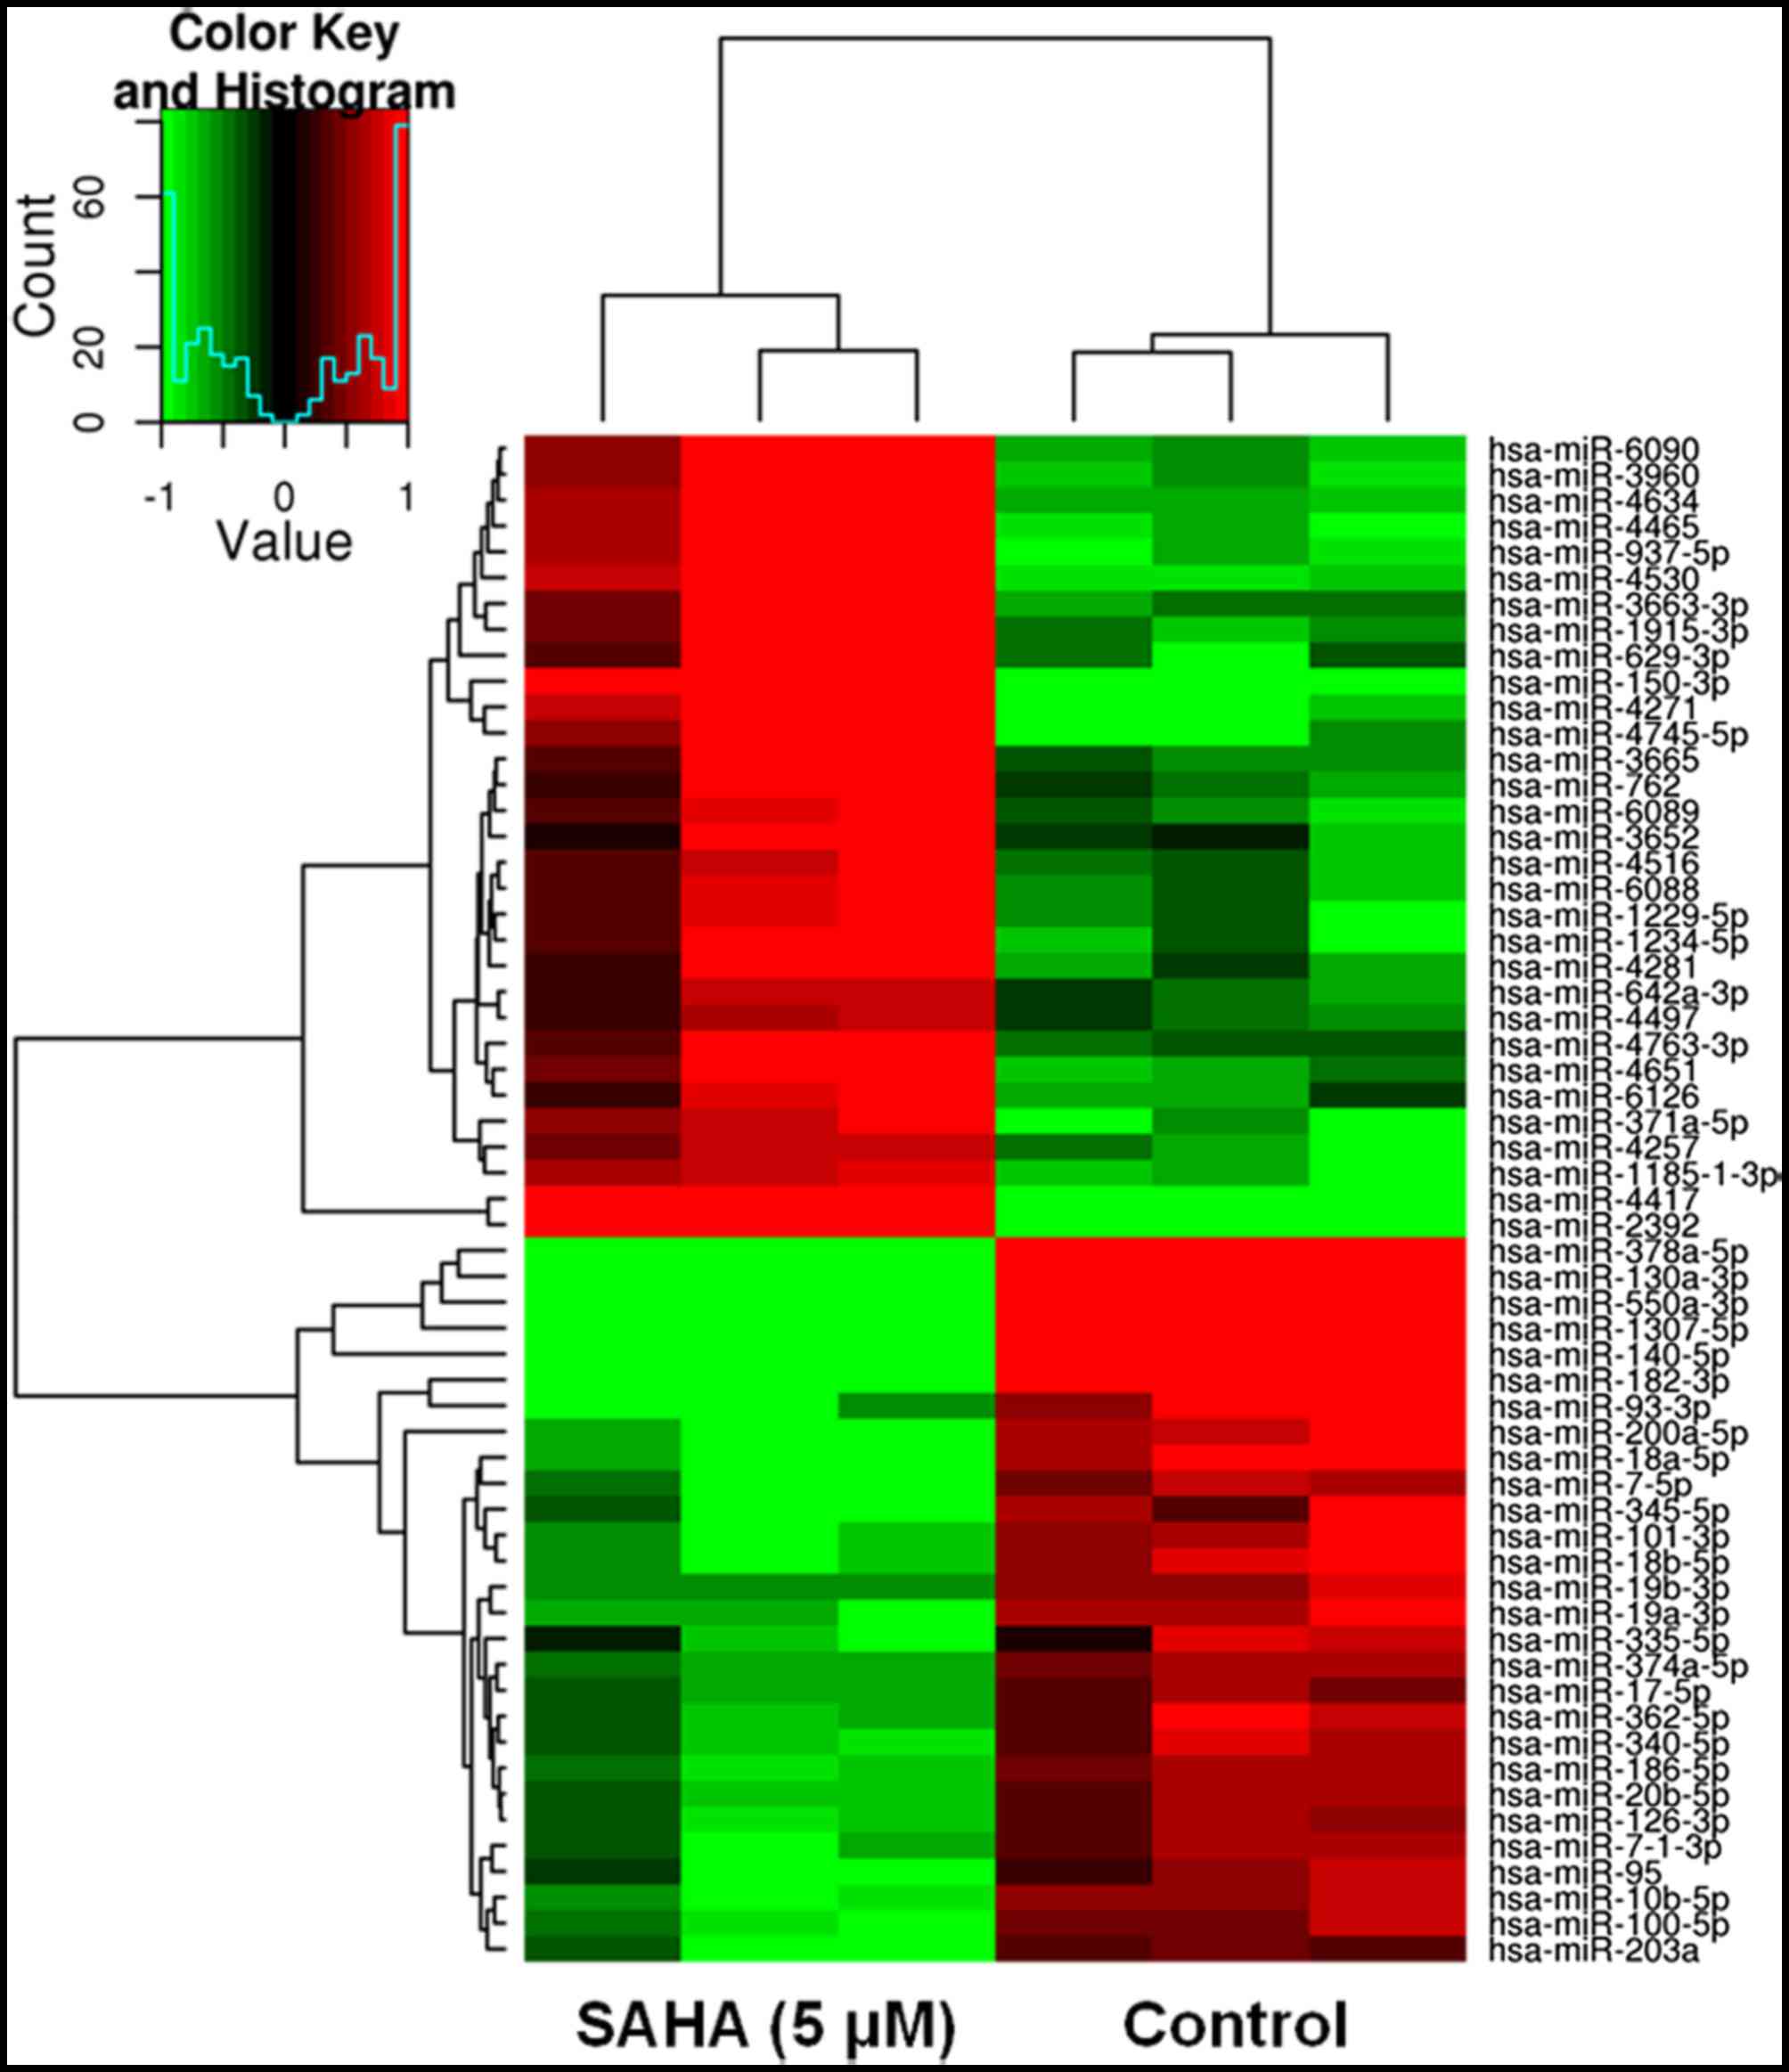
Her2/neu mRNA. In order to explore the putative miRNAs that may be
involved in modulation of ER, PR and Her2/neu mRNA and protein
expression in BT474 cells, miRNA expression profiling was conducted
using microarrays, after BT474 cells were treated with TSA (0.2
µM) or SAHA (5.0 µM) for 48 h. A representative heat
map was subsequently generated, as shown in Fig. 3. In general, treatment with TSA
(0.2 µM) and SAHA (5.0 µM) induced marked alterations
in the expression levels of various miRNAs in BT474 cells. The
specific miRNAs are listed in Tables
ITable II–III.
 | Table IEffects of trichostatin (0.2
µM) on miRNA expression in BT474 cells. |
Table I
Effects of trichostatin (0.2
µM) on miRNA expression in BT474 cells.
| miRNA | Fold-change | P-value |
|---|
| miR-10a-5p | ↑8.41 | 0.04 |
| miR-1587 | ↑1.24 | 0.03 |
| miR-4634 | ↑1.47 | 0.03 |
| miR-4687 | ↑1.17 | 0.04 |
| miR-17-5p | ↓1.21 | 0.04 |
| miR-18b-5p | ↓1.60 | 0.04 |
| miR-20a-5p | ↓1.31 | 0.01 |
| miR-20b-5p | ↓1.20 | 0.003 |
| miR-301a-3p | ↓1.41 | 0.03 |
| miR-5100 | ↓1.40 | 0.03 |
| Table IIEffects of vorinostat (5 µM)
on miRNA expression in BT474 cells. |
Table II
Effects of vorinostat (5 µM)
on miRNA expression in BT474 cells.
| miRNA | Fold-change | P-value |
|---|
| miR-150-3p | ↑5.01 | 0.0006 |
| miR-937-5p | ↑4.45 | 0.004 |
| miR-629-3p | ↑4.48 | 0.03 |
| miR-4634 | ↑3.63 | 0.016 |
| miR-371a-5p | ↑3.02 | 0.002 |
| miR-762 | ↑2.42 | 0.03 |
| miR-642a-3p | ↑2.11 | 0.008 |
| miR-18a-5p | ↓4.01 | 0.000 |
| miR-200a-5p | ↓6.01 | 0.04 |
| miR-10b-5p | ↓2.61 | 0.001 |
| miR-18b-5p | ↓3.02 | 0.01 |
| miR-19a-3p | ↓2.50 | 0.001 |
| miR-19b-3p | ↓2.31 | 0.004 |
| miR-20b-5p | ↓2.20 | 0.002 |
| miR-17-5p | ↓2.02 | 0.001 |
| miR-20a-5p | ↓1.80 | 0.005 |
| miR-100b-5p | ↓2.50 | 0.005 |
| Table IIIComparison of the effects of SAHA (5
µM) and TSA (0.2 µM) on miRNA expression levels in
BT474 cells. |
Table III
Comparison of the effects of SAHA (5
µM) and TSA (0.2 µM) on miRNA expression levels in
BT474 cells.
| miRNA | TSA (fold) | SAHA (fold) |
|---|
| miR-4634 | ↑1.47 | ↑3.63 |
| miR-17-5p | ↓1.21 | ↓2 |
| miR-18b-5p | ↓1.60 | ↓3 |
| miR-20a-5p | ↓1.30 | ↓1.8 |
| miR-20b-5p | ↓1.20 | ↓2.2 |
| miR-301a-3p | ↓1.40 | ↓1.6 |
| miR-5100 | ↓1.41 | ↓1.34 |
SAHA downregulates Her2/neu expression
and induces apoptosis of BT474 cells via miR-762 and
miR-642a-3p
The present study aimed to determine whether the
induction of specific miRNAs may have a causal role in
downregulation of Her2/neu and apoptosis. Treatment with SAHA (5.0
µM) for 48 h reduced Her2/neu mRNA expression and markedly
reduced the protein expression levels of Her2/neu in BT474 cells.
In addition, SAHA increased the expression levels of miR-762 and
miR-642a-3p. Therefore, it was hypothesized that miR-762 and
miR-642a-3p may serve a critical role in the effects of SAHA on
Her2/neu expression and apoptosis of BT474 cells.
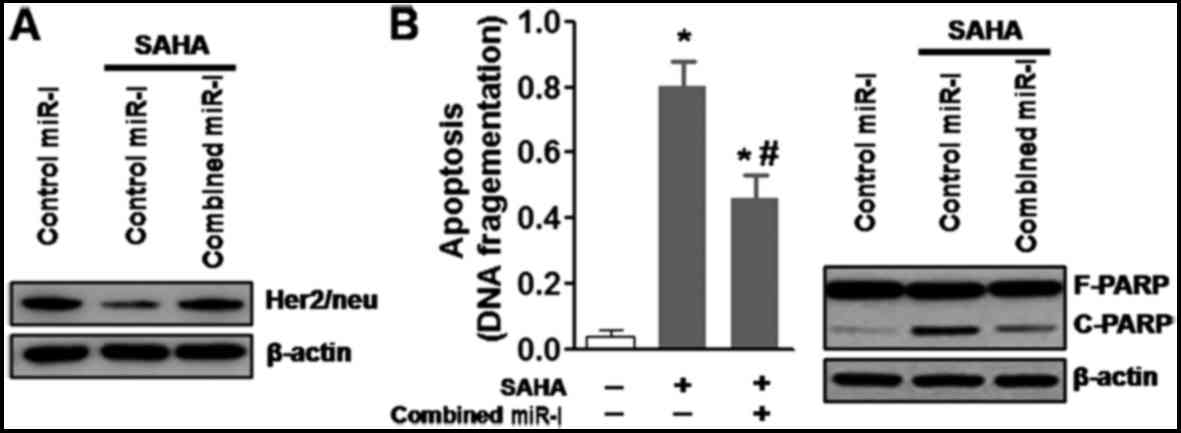
Initially, the present study confirmed that
treatment with SAHA (5.0 µM) for 48 h increased the
expression levels of miR-762 and miR-642a-3p in BT474 cells, as
determined using RT-qPCR (Fig.
4A). Specific miRIDIAN hairpin inhibitors were then transfected
into BT474 cells to inhibit miR-762 or miR-642a-3p expression, the
cells were then treated with or without SAHA (5.0 µM). The
results indicated that miR-762 and miR-642a-3p inhibitors
significantly decreased SAHA-induced upregulation of miR-762 and
miR-642a-3p, respectively (Fig.
4B). Notably, neither of the single inhibitors altered
SAHA-induced downregulation of Her2/neu in BT474 cells (Fig. 4C). Furthermore, ELISA and western
blot analyses were used to detect apoptosis; the results
demonstrated that the single miRNA inhibitors did not alter
SAHA-induced DNA fragmentation and poly (ADP-ribose) polymerase
(PARP) cleavage, which are hallmarks of apoptosis (Fig. 4D). These results suggested that
inhibition of a single miRNA may be insufficient to attenuate the
effects of SAHA on Her2/neu expression and cell apoptosis.
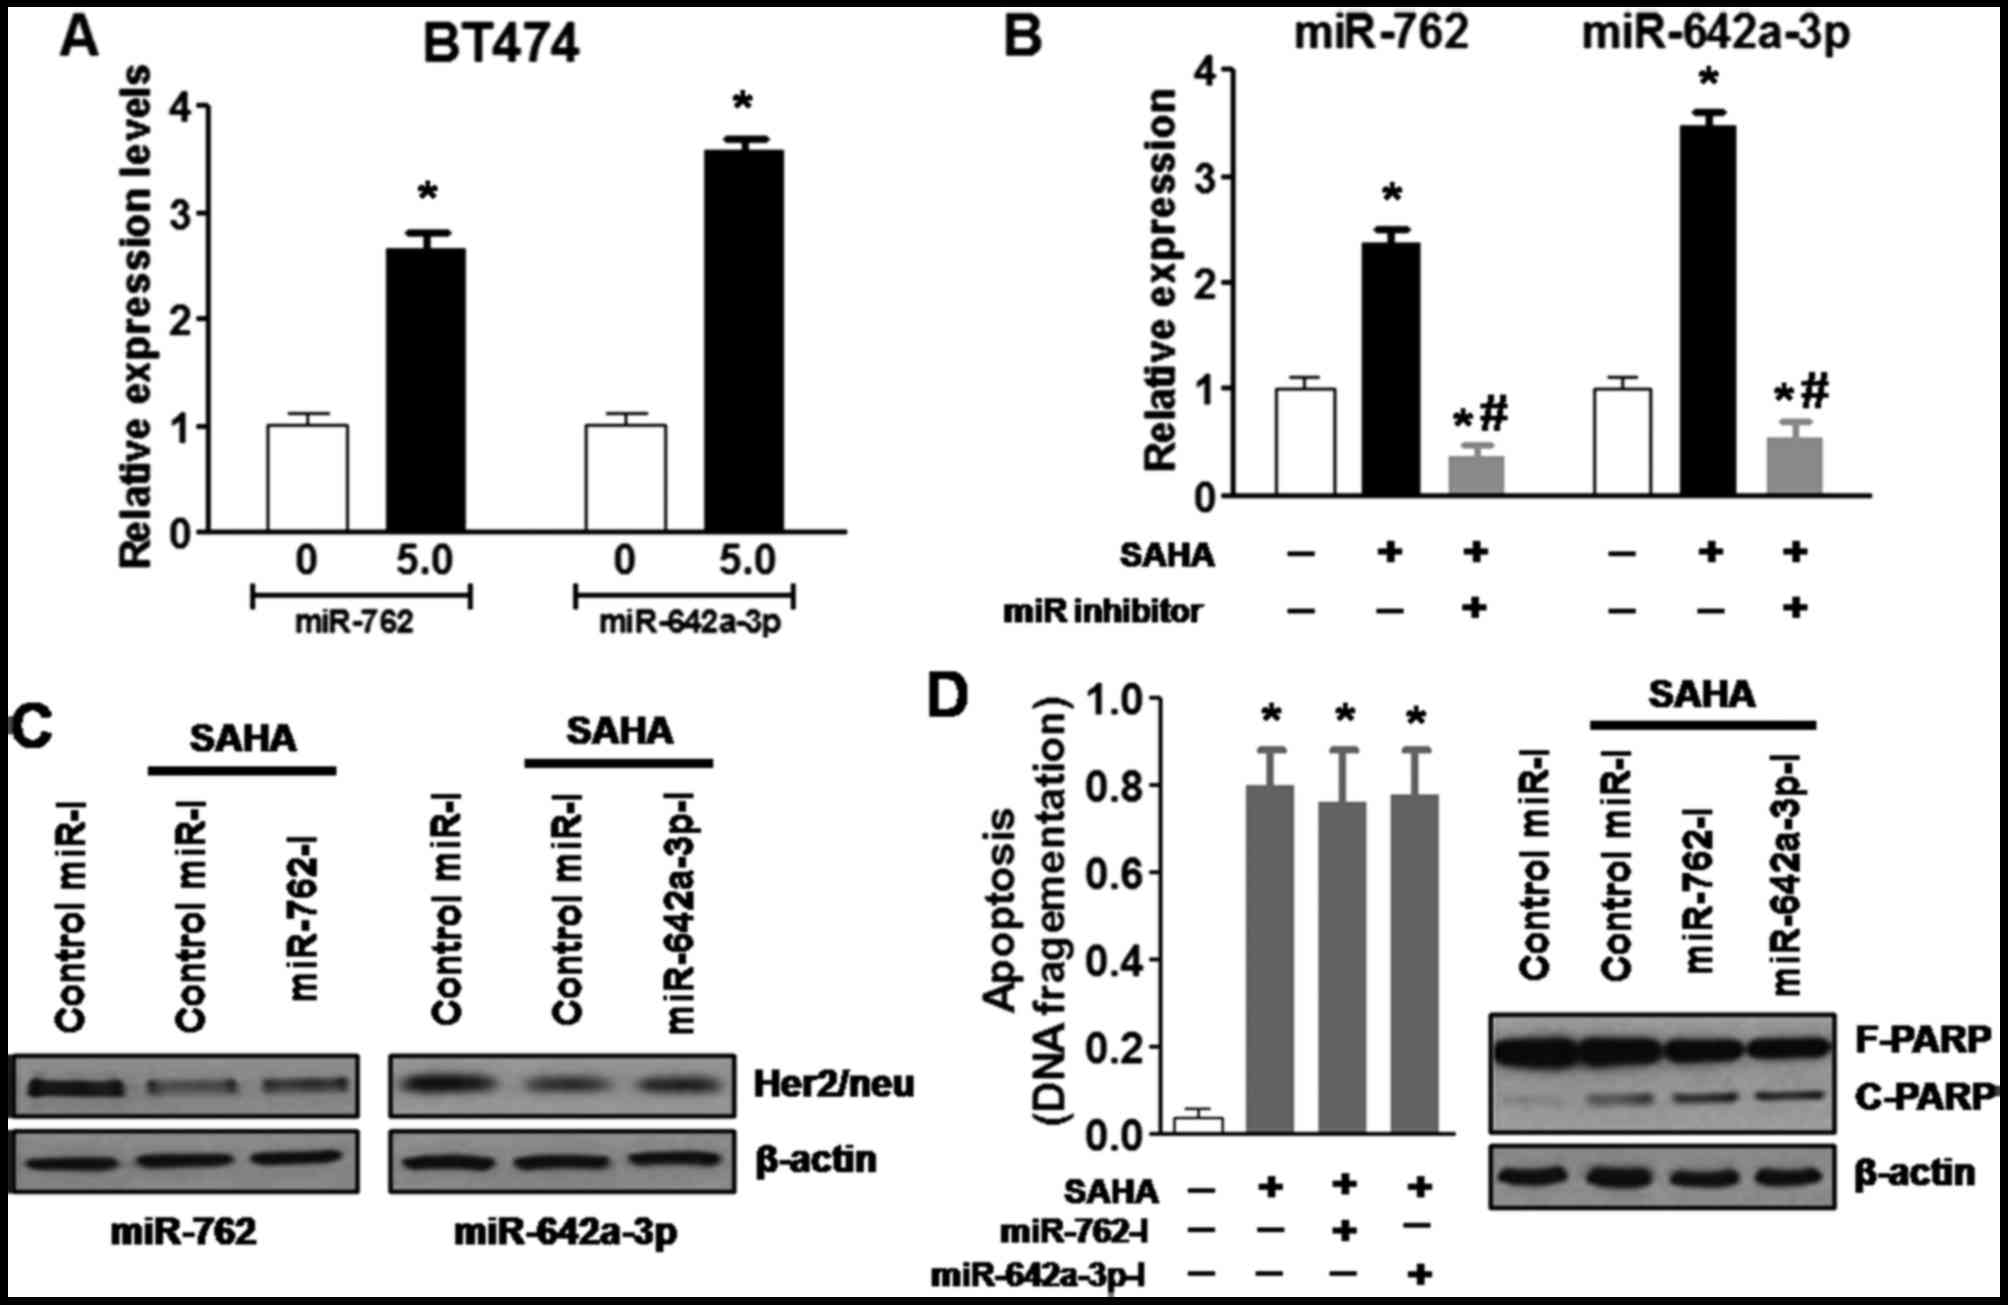 | Figure 4SAHA downregulates Her2/neu
expression and induces apoptosis of BT474 cells, potentially via
miR-762 and miR-642a-3p. (A) SAHA (5.0 µM) treatment for 48
h increased miR-762 and miR-642a-3p expression in BT474 cells, as
determined by reverse transcription-quantitative polymerase chain
reaction. (B) miR-762 and miR-642a-3p inhibitors significantly
decreased SAHA-induced upregulation of miR-762 and miR-642a-3p,
respectively. (C) Single miRNA inhibitors did not alter
SAHA-induced downregulation of Her2/neu in BT474 cells. (D) Single
miRNA inhibitors did not alter SAHA-induced DNA fragmentation and
PARP cleavage, which are hallmarks of apoptosis.
*P<0.05, compared with the control group;
#P<0.05, compared with the SAHA group. F-PARP,
full-length PARP; C-PARP, cleaved-PARP; Her2/neu, human epidermal
growth factor receptor 2; miR/miRNA, microRNA; PARP, poly
(ADP-ribose) polymerase; SAHA, vorinostat. |
It has previously been suggested that numerous
miRNAs work cooperatively to reduce the protein expression levels
of Her2/neu (25); therefore, the
present study cotransfected BT474 cells with the two miRNA
inhibitors. Similarly, cotransfection with the two specific
inhibitors markedly reduced expression of their corresponding
miRNAs in BT474 cells (data not shown). In addition, cotransfection
with miR-762 and miR-642a-3p inhibitors markedly inhibited
SAHA-induced downregulation of Her2/neu in BT474 cells (Fig. 5A). Similarly, simultaneous
inhibition of the two miRNAs reduced SAHA-induced apoptosis and
PARP cleavage (Fig. 5B) in BT474
cells. These results indicated that numerous SAHA-induced miRNAs
may be necessary to downregulate Her2/neu expression and promote
apoptosis of Her2-overexpressing breast cancer cells.
Discussion
The present study demonstrated that TSA and SAHA
dose-dependently enhanced the mRNA expression levels of ER and PR,
and reduced Her2/neu mRNA expression in MDA-MB-231 and BT474 cells.
Western blot analysis also confirmed that TSA and SAHA increased
the protein expression levels of ER and PR in MDA-MB-231 and BT474
cells. In addition, TSA and SAHA dose-dependently reduced the
protein expression levels of Her2/neu in the
Her2/neu-overexpressing cell line, BT474, but not in the TNBC cell
line, MDA-MB-231. It has previously been reported that HDAC
inhibition leads to marked alterations in miRNA expression
(30). Therefore, the present
study explored the putative miRNAs that may be involved in the
modulation of ER, PR and Her2/neu mRNA and protein expression in
BT474 cells. Briefly, miRNA expression profiling was conducted
using microarrays after BT474 cells were treated with TSA (0.2
µM) or SAHA (5.0 µM) for 48 h. The results indicated
that TSA (0.2 µM) and SAHA (5.0 µM) induced a marked
alteration in the expression levels of various miRNAs in BT474
cells. Subsequently, the present study aimed to determine whether
induction of these miRNAs serves a causal role in the
downregulation of Her2/neu and apoptosis. Focusing on miR-762 and
miR-642a-3p, the present study confirmed that SAHA (5.0 µM)
treatment for 48 h increased miR-762 and miR-642a-3p expression in
BT474 cells. Notably, compared with delivery of miR-762 and
miR-642a-3p inhibitors alone, cotransfection with the inhibitors
markedly inhibited SAHA-induced downregulation of Her2/neu, and
significantly reduced SAHA-induced apoptosis and PARP cleavage in
BT474 cells. These results indicated that numerous SAHA-induced
miRNAs are required to downregulate Her2/neu and promote apoptosis
of Her2-overexpressing breast cancer cells.
Notably, whereas the mRNA expression levels of Her2
were decreased in both MDA-MB-231 and BT474 cells following TSA or
SAHA treatment, the protein expression levels of Her2 were not
altered in MDA-MB-231 cells. Numerous processes exist between
transcription and translation, which may contribute to this
discrepancy. In addition, the correlation between mRNA and protein
expression can be as little as 40%, depending on the type of cells
and tissues (31,32). There are various regulatory
processes that occur following mRNA production, including
post-transcriptional and translational regulation, and protein
degradation, which may have a critical role in controlling
steady-state protein levels (31). In addition, the half-life of
various proteins can vary from minutes to days, whereas the
degradation rate of mRNA falls within a much tighter range.
Furthermore, the mRNA transcription rate is usually lower compared
with protein translation in mammalian cells. Therefore, reduced
mRNA levels may not alter protein levels, since slower degradation
and/or a higher translation rate may overcome the lower levels of
mRNA. Finally, the MDA-MB-231 cell line is a Her2-negative cell
line; therefore, the basal levels of Her2 protein are much lower.
The negative effects of HDACis on Her2 protein expression may also
be due to the basement effects.
A previous study has revealed the functional
cooperation of miR-125a, miR-125b and miR-205 in entinostat-induced
Her2/neu downregulation and apoptosis of breast cancer cells
(25). The present study
suggested that miR-762 and miR-642a-3p may have a critical role in
the modulation of Her2/neu expression in Her2-overexpressing breast
cancer cells. A previous study also demonstrated that SAHA can
reduce the mRNA expression levels of Her2/neu (25). Consistent with these findings, in
the present study, SAHA and TSA reduced the mRNA expression levels
of Her2/neu in MDA-MB-231 and BT474 cells. Compared with the
effects of entinostat on miRNA expression, the present microarray
results indicated that TSA and SAHA did not alter the expression
levels of miR-125a, miR-15b or miR-205 in BT474 cells. Therefore,
these results suggested that specific HDACis may induce a unique
profile of miRNAs, and certain HDACis may regulate Her2/neu
expression via different miRNAs.
It has previously been demonstrated that miRNA
clusters may function cooperatively to regulate specific signaling
pathways (33). Furthermore, it
has been confirmed that numerous miRNAs can target the same gene
(25,34). To the best of our knowledge, the
present study is the first to demonstrate that miR-762 and
miR-642a-3p act cooperatively to regulate the expression of
Her2/neu in breast cancer cells. Compared with simultaneous
inhibition of the two miRNAs, inactivation of one single miRNA was
unable to inhibit SAHA-induced downregulation of Her2/neu. However,
cotransfection with the two miRNA inhibitors did not exhibit full
efficacy, thus suggesting that additional miRNAs may be involved in
regulating SAHA-induced downregulation of Her2/neu. Future studies
are requited to further elucidate the mechanisms.
The Her family consists of at least four members,
including EGFR (Her1, erbB1), Her2 (erbB2, Her2/neu), Her3 (erbB3)
and Her4 (erbB4) (35). These
family members are often aberrantly activated in various types of
cancer, particularly in breast cancer, and are excellent targets
for selective anticancer therapies. In clinical treatment,
erbB-targeted therapies usually consist of antibodies, including
trastuzumab, which target erbB2, and tyrosine kinase inhibitors,
such as lapatinib, which target EGFR and erbB2. In addition,
erbB3-targeted therapies are currently being evaluated in
preclinical studies (36,37), and numerous anti-erbB3 antibodies
may be considered promising therapies for cancer treatment
(38). Notably, erbB2 and erbB3
functionally interact with each other. For example, it has been
reported that erbB3 is required for erbB2 to promote breast cancer
cell proliferation (39,40). Furthermore, erbB3 is critically
involved in erbB2-mediated tamoxifen and paclitaxel resistance
(41,42). Therefore, future studies may aim
to examine the effects of TSA and SAHA, as well as other HDACis, on
erbB3, since simultaneously targeting erbB2 and erbB3 may have a
broader impact on the treatment of breast cancer.
The molecular mechanisms by which SAHA and TSA
induce expression of various miRNAs in breast cancer cells remain
unclear. Numerous studies have indicated that epigenetic
alterations, including DNA methylation and histone modifications,
are likely the major mechanisms underlying miRNA expression
regulation. Both acetylated-histone H3 and methylated-histone H3
are associated with open chromatin structure and active gene,
including miRNA, expression (43,44). Previous studies have demonstrated
that TSA and SAHA treatment may increase acetylation of histone H3
and induce candidate miRNA expression (45,46). It has also been reported that
entinostat enhances acetylated-histone H3 and reduces HDAC1
(47). In addition, HDACis induce
degradation of DNA methyltransferase 1, which is an enzyme
responsible for maintaining DNA methylation patterns in eukaryotic
cells and breast cancer cells (44,48). Therefore, it is possible that both
increased acetylated-histone H3and reduced promoter methylation
contribute to TSA and SAHA-induced upregulation of miRNAs in breast
cancer cells.
In conclusion, the present study demonstrated that
TSA and SAHA dose-dependently enhanced the mRNA and protein
expression levels of ER and PR in MDA-MB-231 and BT474 cells,
reduced Her2/neu mRNA expression in MDA-MB-231 cells, and reduced
Her2/neu mRNA and protein expression in BT474 cells. Furthermore,
TSA and SAHA treatment induced a marked alteration in the
expression levels of various miRNAs in BT474 cells. Notably, when
miR-762 and miR-642a-3p inhibitors were delivered together,
combined inhibition markedly suppressed SAHA-induced downregulation
of Her2/neu, and significantly reduced SAHA-induced apoptosis and
PARP cleavage in BT474 cells. These results indicated that numerous
HDACi-induced miRNAs are required to downregulate Her2/neu and
promote apoptosis of Her2-overexpressing breast cancer cells. These
findings may help further understanding regarding the roles of
miRNA networks in cancer biology.
Acknowledgments
Not applicable.
References
|
1
|
Fernández Y, Cueva J, Palomo AG, Ramos M,
de Juan A, Calvo L, García-Mata J, García-Teijido P, Peláez I and
García-Estévez L: Novel therapeutic approaches to the treatment of
metastatic breast cancer. Cancer Treat Rev. 36:33–42. 2010.
View Article : Google Scholar
|
|
2
|
Beaumont T and Leadbeater M: Treatment and
care of patients with metastatic breast cancer. Nurs Stand.
25:49–56. 2011. View Article : Google Scholar : PubMed/NCBI
|
|
3
|
Watanabe T: Treatment of metastatic breast
cancer patients: What is the standard care of the patients? Jpn J
Clin Oncol. 28:355–356. 1998. View Article : Google Scholar : PubMed/NCBI
|
|
4
|
Schneider BP, Winer EP, Foulkes WD, Garber
J, Perou CM, Richardson A, Sledge GW and Carey LA: Triple-negative
breast cancer: Risk factors to potential targets. Clin Cancer Res.
14:8010–8018. 2008. View Article : Google Scholar : PubMed/NCBI
|
|
5
|
Dent R, Trudeau M, Pritchard KI, Hanna WM,
Kahn HK, Sawka CA, Lickley LA, Rawlinson E, Sun P and Narod SA:
Triple-negative breast cancer: clinical features and patterns of
recurrence. Clin Cancer Res. 13:4429–4434. 2007. View Article : Google Scholar : PubMed/NCBI
|
|
6
|
De Laurentiis M, Cianniello D, Caputo R,
Stanzione B, Arpino G, Cinieri S, Lorusso V and De Placido S:
Treatment of triple negative breast cancer (TNBC): Current options
and future perspectives. Cancer Treat Rev. 36(Suppl 3): S80–S86.
2010. View Article : Google Scholar : PubMed/NCBI
|
|
7
|
Chacón RD and Costanzo MV: Triple-negative
breast cancer. Breast Cancer Res. 12(Suppl 2): S32010. View Article : Google Scholar :
|
|
8
|
Jemal A, Bray F, Center MM, Ferlay J, Ward
E and Forman D: Global cancer statistics. CA Cancer J Clin.
61:69–90. 2011. View Article : Google Scholar : PubMed/NCBI
|
|
9
|
Anders CK and Carey LA: Biology,
metastatic patterns, and treatment of patients with triple-negative
breast cancer. Clin Breast Cancer. 9(Suppl 2): S73–S81. 2009.
View Article : Google Scholar : PubMed/NCBI
|
|
10
|
Hudis CA and Gianni L: Triple-negative
breast cancer: An unmet medical need. Oncologist. 16(Suppl 1):
1–11. 2011. View Article : Google Scholar : PubMed/NCBI
|
|
11
|
Drummond DC, Noble CO, Kirpotin DB, Guo Z,
Scott GK and Benz CC: Clinical development of histone deacetylase
inhibitors as anticancer agents. Annu Rev Pharmacol Toxicol.
45:495–528. 2005. View Article : Google Scholar : PubMed/NCBI
|
|
12
|
Liu T, Kuljaca S, Tee A and Marshall GM:
Histone deacetylase inhibitors: Multifunctional anticancer agents.
Cancer Treat Rev. 32:157–165. 2006. View Article : Google Scholar : PubMed/NCBI
|
|
13
|
Kikuchi H, Barman HK, Nakayama M, Takami Y
and Nakayama T: Participation of histones, histone modifying
enzymes and histone chaperones in vertebrate cell functions.
Subcell Biochem. 40:225–243. 2006.
|
|
14
|
Konstantinopoulos PA, Karamouzis MV and
Papavassiliou AG: Focus on acetylation: The role of histone
deacetylase inhibitors in cancer therapy and beyond. Expert Opin
Investig Drugs. 16:569–571. 2007. View Article : Google Scholar : PubMed/NCBI
|
|
15
|
Johnstone RW: Histone-deacetylase
inhibitors: Novel drugs for the treatment of cancer. Nat Rev Drug
Discov. 1:287–299. 2002. View
Article : Google Scholar : PubMed/NCBI
|
|
16
|
Vigushin DM and Coombes RC: Histone
deacetylase inhibitors in cancer treatment. Anticancer Drugs.
13:1–13. 2002. View Article : Google Scholar : PubMed/NCBI
|
|
17
|
Richon VM and O'Brien JP: Histone
deacetylase inhibitors: A new class of potential therapeutic agents
for cancer treatment. Clin Cancer Res. 8:662–664. 2002.PubMed/NCBI
|
|
18
|
Lin HY and Chen CS, Lin SP, Weng JR and
Chen CS: Targeting histone deacetylase in cancer therapy. Med Res
Rev. 26:397–413. 2006. View Article : Google Scholar : PubMed/NCBI
|
|
19
|
Kim HJ and Bae SC: Histone deacetylase
inhibitors: Molecular mechanisms of action and clinical trials as
anticancer drugs. Am J Transl Res. 3:166–179. 2011.PubMed/NCBI
|
|
20
|
Xu WS, Parmigiani RB and Marks PA: Histone
deacetylase inhibitors: Molecular mechanisms of action. Oncogene.
26:5541–5552. 2007. View Article : Google Scholar : PubMed/NCBI
|
|
21
|
Wang C, Fu M, Angeletti RH, Siconolfi-Baez
L, Reutens AT, Albanese C, Lisanti MP, Katzenellenbogen BS, Kato S,
Hopp T, et al: Direct acetylation of the estrogen receptor alpha
hinge region by p300 regulates transactivation and hormone
sensitivity. J Biol Chem. 276:18375–18383. 2001. View Article : Google Scholar : PubMed/NCBI
|
|
22
|
Gaughan L, Logan IR, Cook S, Neal DE and
Robson CN: Tip60 and histone deacetylase 1 regulate androgen
receptor activity through changes to the acetylation status of the
receptor. J Biol Chem. 277:25904–25913. 2002. View Article : Google Scholar : PubMed/NCBI
|
|
23
|
Bouchalova K, Cizkova M, Cwiertka K,
Trojanec R and Hajduch M: Triple negative breast cancer - current
status and prospective targeted treatment based on Her1 (EGFR),
TOP2A and C-MYC gene assessment. Biomed Pap Med Fac Univ Palacky
Olomouc Czech Repub. 153:13–17. 2009. View Article : Google Scholar : PubMed/NCBI
|
|
24
|
Rao R, Balusu R, Fiskus W, Mudunuru U,
Venkannagari S, Chauhan L, Smith JE, Hembruff SL, Ha K, Atadja P,
et al: Combination of pan-histone deacetylase inhibitor and
autophagy inhibitor exerts superior efficacy against
triple-negative human breast cancer cells. Mol Cancer Ther.
11:973–983. 2012. View Article : Google Scholar : PubMed/NCBI
|
|
25
|
Wang S, Huang J, Lyu H, Lee CK, Tan J,
Wang J and Liu B: Functional cooperation of miR-125a, miR-125b, and
miR-205 in entinostat-induced downregulation of erbB2/erbB3 and
apoptosis in breast cancer cells. Cell Death Dis. 4:e5562013.
View Article : Google Scholar : PubMed/NCBI
|
|
26
|
Livak KJ and Schmittgen TD: Analysis of
relative gene expression data using real-time quantitative PCR and
the 2(-Delta Delta C(T)) Method. Methods. 25:402–408. 2001.
View Article : Google Scholar
|
|
27
|
Bartels CL and Tsongalis GJ: MicroRNAs:
Novel biomarkers for human cancer. Clin Chem. 55:623–631. 2009.
View Article : Google Scholar
|
|
28
|
Bartel DP: MicroRNAs: Target recognition
and regulatory functions. Cell. 136:215–233. 2009. View Article : Google Scholar : PubMed/NCBI
|
|
29
|
Friedman RC, Farh KK, Burge CB and Bartel
DP: Most mammalian mRNAs are conserved targets of microRNAs. Genome
Res. 19:92–105. 2009. View Article : Google Scholar :
|
|
30
|
Scott GK, Mattie MD, Berger CE, Benz SC
and Benz CC: Rapid alteration of microRNA levels by histone
deacetylase inhibition. Cancer Res. 66:1277–1281. 2006. View Article : Google Scholar : PubMed/NCBI
|
|
31
|
Vogel C and Marcotte EM: Insights into the
regulation of protein abundance from proteomic and transcriptomic
analyses. Nat Rev Genet. 13:227–232. 2012. View Article : Google Scholar : PubMed/NCBI
|
|
32
|
Maier T, Güell M and Serrano L:
Correlation of mRNA and protein in complex biological samples. FEBS
Lett. 583:3966–3973. 2009. View Article : Google Scholar : PubMed/NCBI
|
|
33
|
Mestdagh P, Boström AK, Impens F, Fredlund
E, Van Peer G, De Antonellis P, von Stedingk K, Ghesquière B,
Schulte S, Dews M, et al: The miR-17-92 microRNA cluster regulates
multiple components of the TGF-β pathway in neuroblastoma. Mol
Cell. 40:762–773. 2010. View Article : Google Scholar : PubMed/NCBI
|
|
34
|
Wu S, Huang S, Ding J, Zhao Y, Liang L,
Liu T, Zhan R and He X: Multiple microRNAs modulate p21Cip1/Waf1
expression by directly targeting its 3′ untranslated region.
Oncogene. 29:2302–2308. 2010. View Article : Google Scholar : PubMed/NCBI
|
|
35
|
Moasser MM: The oncogene Her2: Its
signaling and transforming functions and its role in human cancer
pathogenesis. Oncogene. 26:6469–6487. 2007. View Article : Google Scholar : PubMed/NCBI
|
|
36
|
Schoeberl B, Faber AC, Li D, Liang MC,
Crosby K, Onsum M, Burenkova O, Pace E, Walton Z, Nie L, et al: An
ErbB3 antibody, MM-121, is active in cancers with ligand-dependent
activation. Cancer Res. 70:2485–2494. 2010. View Article : Google Scholar : PubMed/NCBI
|
|
37
|
Schoeberl B, Pace EA, Fitzgerald JB, Harms
BD, Xu L, Nie L, Linggi B, Kalra A, Paragas V, Bukhalid R, et al:
Therapeutically targeting ErbB3: A key node in ligand-induced
activation of the ErbB receptor-PI3K axis. Sci Signal. 2:ra312009.
View Article : Google Scholar : PubMed/NCBI
|
|
38
|
Aurisicchio L, Marra E, Roscilli G,
Mancini R and Ciliberto G: The promise of anti-ErbB3 monoclonals as
new cancer therapeutics. Oncotarget. 3:744–758. 2012. View Article : Google Scholar : PubMed/NCBI
|
|
39
|
Holbro T, Beerli RR, Maurer F, Koziczak M,
Barbas CF III and Hynes NE: The ErbB2/ErbB3 heterodimer functions
as an oncogenic unit: ErbB2 requires ErbB3 to drive breast tumor
cell proliferation. Proc Natl Acad Sci USA. 100:8933–8938. 2003.
View Article : Google Scholar : PubMed/NCBI
|
|
40
|
Lee-Hoeflich ST, Crocker L, Yao E, Pham T,
Munroe X, Hoeflich KP, Sliwkowski MX and Stern HM: A central role
for Her3 in Her2-amplified breast cancer: Implications for targeted
therapy. Cancer Res. 68:5878–5887. 2008. View Article : Google Scholar : PubMed/NCBI
|
|
41
|
Liu B, Ordonez-Ercan D, Fan Z, Edgerton
SM, Yang X and Thor AD: Downregulation of erbB3 abrogates
erbB2-mediated tamoxifen resistance in breast cancer cells. Int J
Cancer. 120:1874–1882. 2007. View Article : Google Scholar : PubMed/NCBI
|
|
42
|
Wang S, Huang X, Lee CK and Liu B:
Elevated expression of erbB3 confers paclitaxel resistance in
erbB2-overexpressing breast cancer cells via upregulation of
Survivin. Oncogene. 29:4225–4236. 2010. View Article : Google Scholar : PubMed/NCBI
|
|
43
|
Chuang JC and Jones PA: Epigenetics and
microRNAs. Pediatr Res. 61:24R–29R. 2007. View Article : Google Scholar : PubMed/NCBI
|
|
44
|
Veeck J and Esteller M: Breast cancer
epigenetics: From DNA methylation to microRNAs. J Mammary Gland
Biol Neoplasia. 1:5–17. 2010. View Article : Google Scholar
|
|
45
|
Su X, Qian C, Zhang Q, Hou J, Gu Y, Han Y,
Chen Y, Jiang M and Cao X: miNomes of haematopoietic stem cells and
dendritic cells identify miR-30b as a regulator of Notch1. Nat
Commun. 4:29032013. View Article : Google Scholar
|
|
46
|
Drogaris P, Villeneuve V, Pomiès C, Lee
EH, Bourdeau V, Bonneil E, Ferbeyre G, Verreault A and Thibault P:
Histone deacetylase inhibitors globally enhance h3/h4 tail
acetylation without affecting h3 lysine 56 acetylation. Sci Rep.
2:2202012. View Article : Google Scholar : PubMed/NCBI
|
|
47
|
Huang X, Gao L, Wang S, Lee CK, Ordentlich
P and Liu B: HDAC inhibitor SNDX-275 induces apoptosis in
erbB2-overexpressing breast cancer cells via down-regulation of
erbB3 expression. Cancer Res. 69:8403–8411. 2009. View Article : Google Scholar : PubMed/NCBI
|
|
48
|
Zhou Q, Agoston AT, Atadja P, Nelson WG
and Davidson NE: Inhibition of histone deacetylases promotes
ubiquitin-dependent proteasomal degradation of DNA
methyltransferase 1 in human breast cancer cells. Mol Cancer Res.
6:873–883. 2008. View Article : Google Scholar : PubMed/NCBI
|