Introduction
Liver cancer is one of the most prevalent types of
cancer. Hepatoblastoma is a malignant liver cancer with a poor
prognosis and is most commonly diagnosed in the first 3 years of
life of children. Moreover, hepatocellular carcinoma (HCC) is the
third leading cause of cancer-related mortality worldwide (1). This statistic is attributed to the
fact that a large number of patients are diagnosed with HCC at an
advance stage, which leads to a poor prognosis. For these patients,
systemic chemotherapy is considered an alternative option. However,
HCC is relatively chemotherapy-resistant and patients receiving
chemotherapy still have an unsatisfactory prognosis and a high rate
of recurrence (2). Some studies
have demonstrated that HCC resistance to chemotherapy may be due to
the presence of hepatic tumor-derived cells, which are commonly
considered to be responsible for tumor initiation, self-renewal,
metastasis and chemoresistance (3). Therefore, a greater understanding of
the mechanisms of tumor chemore-sistance and potential molecular
targets is urgently required.
Hepatic lipase (LIPC), a member of the lipase gene
family, is a hydrolytic enzyme with lipolytic and ligand function
and plays an important role in lipoprotein metabolism and cytokine
homeostasis (4). LIPC has been
reported to be closely associated with coronary artery disease and
diabetes (5). Recent studies have
demonstrated the effects of LIPC in cancer progression and
metastasis. A previous study suggested that monoacylglycerol lipase
(MAGL) promotes tumor cell proliferation, invasion and migration by
regulating a fatty acid network with carcinogenesis signaling
molecules (6). Another study by
Ding et al reported that apolipoprotein B mRNA editing
enzyme catalytic polypeptide-like 3G (APOBEC3G), S100P, LIPC and
CD133 played a critical role in promoting liver metastasis of
colorectal cancer, and could be potential markers for predicting
the likelihood of hepatic metastasis (7). More recently, another study
indicated that the intratumoral level of LIPC positively correlated
with the prognosis of non-small cell lung carcinoma (NSCLC), and
patients with relatively low expression of LIPC may benefit from
chemotherapy (8). However, the
precise role of LIPC in tumor development and chemotherapy remains
unknown. CD133 has been commonly considered as a marker of
tumor-derived cells in various tumors including liver cancer and
colon cancer. It has been also found to be involved in
chemoresistance (9,10). Ding et al demonstrated that
both LIPC and CD133 promote the liver metastasis of colorectal
cancer (7). However, no evidence
has been provided as to whether they function interactively or
independently in tumors.
In this study, we aimed to investigate the role of
LIPC in cancer cells and to elucidate the potential underlying
mechanisms. We demonstrate that the downregulation of LIPC
expression significantly decreases cell proliferation and the
colony formation rate of HepG2 cells. The expression of CD133
significantly decreased in short hairpin RNA (shLIPC)-transfected
HepG2 cells compared with control short hairpin RNA
(shCON)-transfected HepG2 cells. The knockdown of LIPC increased
resistance to doxorubicin and 5-floxuridine (5-FU). Microarray
analysis of gene expression profiles in the
shCON/shLIPC-transfected HepG2 cells identified differentially
expressed genes for further analysis.
Materials and methods
Cell lines, cell culture and
reagents
All cells [human colorectal cancer cells SW620
(CCL-227), SW480 (CCL-228), LoVo (CCL-229), LS174T (CL-188), HCT
116 (CCL-247), HT29 (HTB-38), hepatoblastoma cells HepG2 (HB-8065),
and mouse colorectal cancer cells CT26 (CRL-2638)] were purchased
from the American Type Culture Collection (ATCC, Manassas, VA,
USA). The cells were grown in Dulbecco’s modified Eagle’s medium
(DMEM; Gibco, Grand Island, NY, USA), supplemented with 10% fetal
bovine serum (FBS). The cells were maintained at 37°C under 5%
CO2. Doxorubicin and 5-FU were dissolved in dimethyl
sulfoxide (DMSO) (all from Sigma (St. Louis, MO, USA) and stored as
10 mmol/l stock solutions in the dark at −20°C.
LIPC activity assay
The cell culture supernatants were collected and the
activity of LIPC was measured using a human hepatic triglyceride
lipase (HTGL) enzyme linked immunosorbent assay (ELISA) kit
(Cusabio, Wuhan, China) according to the manufacturer’ s
instructions.
RNA extraction and RT-qPCR
Total RNA was extracted from the cells using TRIzol
reagent (Invitrogen, Carlsbad, CA, USA) and First Strand cDNA
synthesis was performed with a PrimeScript™ RT reagent kit
(DRR037A; Takara, Shiga, Japan). qPCR was performed using
SYBR-Green Premix Ex Taq (RR091A; Takara) and analyzed with the
LC480 system (Roche, Mannheim, Germany). Specific primer sequences
were designed using NCBI primerblast for: LIPC, 5′-TCC CAA AGT ACC
CAA AGG C-3′ (sense) and 5′-ACT CCA GCC TTG ACC CAC TC-3′
(antisense); glyceraldehyde phosphate dehydrogenase (GAPDH), 5′-TGG
AAG GAC TCA TGA CCA CA-3′ (sense) and 5′-TTC AGC TCA GGG ATG ACC
TT-3′ (anti-sense). The qPCR conditions were 95°C for 5 min,
followed by 45 cycles of 95°C for 10 sec, 58°C for 30 sec, and 72°C
for 20 sec. A final extension at 72°C for 5 min was included before
a temperature ramp from 72 to 95°C at 0.1°C/sec. GAPDH was used as
an internal reference gene, and the 2−ΔΔCq method
(11) was used to calculate cycle
threshold values. All experiments were repeated at least 3 times
and the data are presented as mean ± standard deviation (SD).
Western blot analysis
Total cellular protein was extracted from the cells
using RIPA buffer containing 1X protease inhibitor cocktail (Thermo
Fisher Scientific, Waltham, MA, USA) and 1X PMSF. The protein
concentration was determined using a BCA protein assay kit
(Beyotime Institute of Biotechnology, Shanghai, China). Forty
micrograms of protein lysate were separated by 10% sodium dodecyl
sulfate-polyacrylamide gel electrophoresis (SDS-PAGE)
electrophoresis and transferred onto PVDF membranes (Millipore,
Billerica, MA, USA). Mouse anti-human LIPC (1:500, sc-21740) and
mouse anti-human β-actin (1:5,000, sc-47778) (both from Santa Cruz
Biotechnology, Inc., Santa Cruz, CA, USA) were used as primary
antibodies, followed by incubation with a secondary antibody (goat
anti-mouse IgG-HRP; 1:5,000, sc-2005; Santa Cruz Biotechnology,
Inc.). After washing, the immunoreactive bands were detected by
enhanced chemiluminescence (ECL) reagents (Millipore).
Lentiviral transduction and construction
of stable cell lines
We selected the HepG2 cell line for shRNA
interference assays as the HepG2 cells were found to have a high
expression of LIPC. For the knockdown experiments, a LIPC siRNA
lentiviral vector and a control vector were constructed (GenePharma
Co., Ltd., Shanghai, China). The mouse LIPC gene sequence
(NM-008280) was amplified by PCR and cloned into the pCMV6-Kan/Neo
plasmid (OriGene, Rockvile, MD, USA). A specific LIPC siRNA
sequence was designed as: 5′-GGA GAA ACC CAG CAA AGA AdTdT-3′
(10). Both constructs were
confirmed by DNA sequencing before use. To make the lentiviral
particle, LIPC/control shRNA plasmid constructs were co-transfected
with the helper plasmids pGag/Pol, pRev and pVSV-G into 293T cells
(purchased from ATCC) using RNAi-Mate transfection reagent
(GenePharma Co., Ltd.) according to the manufacturer’s
instructions. The viral particles were collected and the lentiviral
titer was determined by quantifying the EGFP-positive cells by flow
cytometry analysis following infection of the 293T cells. To
prepare stably transfected cell lines, HepG2 cells at 40–60%
confluence (in 24-well plates) were transfected with moieties of
infection (MOI) of 10, in the presence of 5 µg/ml polybrene
(Sigma). G418 was used to select cells at a concentration of 400
g/ml. The efficiency of transfection was determined by measuring
the LIPC levels by western blot analysis after 48–72 h.
Flow cytometric analysis of CD133
expression
To determine the expression of the tumor-derived
cell biomarker, CD133, single cell suspensions were collected and
re-suspended in 200 µl at a density of 1×10⁶ cells/ml in
phosphate-buffered saline (PBS) containing 0.1–0.5% bovine serum
albumin (BSA). The cells were incubated with antigen presenting
cell x(APC)-conjugated anti-human CD133 (130-090-826; Miltenyi
Biotec, Bergisch Gladbach, Germany) for 30 min at 4°C in the dark.
Cells incubated with anti-mouse-IgG (sc-2005; Santa Cruz
Biotechnology, Inc.) were used as the isotype control. The cells
were washed with pre-chilled PBS twice and re-suspended for flow
cytometric analysis. For detecting CD133 expression in the
cytoplasm, the cells were first fixed with 100 µl 1%
permeabilization buffer in PBS before staining with CD133
antibodies. The assay was repeated 3 times.
Cell proliferation and colony formation
assay
The HepG2 cells transfected with shLIPC or shCON
vectors were seeded into a 96-well plate at a density of 5,000
cells/well and incubated for 72 h. Subsequently, 20 µl of
3-(4,5-dimethylthiazol-2-yl)-2,5-diphenyltetrazolium bromide (MTT)
(0.5 mg/ml) was added and incubated for another 4 h at 37°C. The
medium was aspirated and 150 ml DMSO was added to dissolve the
formazan crystals. After the crystals were completely dissolved,
the absorbance was measured using a microplate reader (ELX800;
Bio-Tek Instruments, Winooski, VT, USA). The number of viable cells
was expressed as a percentage of absorbance. For colony formation
assays, transfected cells were plated in triplicate into 6-well
plates at a density of 200–800 cells/well and incubated for 14 days
(12). After being washed and
fixed with 70% methanol for 15 min, the cells colonies were stained
with 0.1–0.5% crystal violet for 10–15 min. The plates were washed
with water and left to dry. The number of colonies containing
>50 cells was counted. The experiment was repeated 3 times.
Drug resistance
The cells were treated with or without doxorubicin
(0.03–0.3 µM) and 5-FU (0.2–2.0 µM) and further incubated for 48 h.
The proliferation of both the shLIPC- and shCON-transfected HepG2
cells was determined by MTT assay as described above.
cDNA microarray analysis
Microarray experiments were performed by RiboBio
Co., Ltd. (Guangzhou, China). Initially, total RNA of the
shLIPC/shCON-transfected HepG2 cell lines was extracted and the
quantity of RNA was determined using an Agilent 2200 Bioanalyzer
(Agilent, Santa Clara, CA, USA). Three independent samples of each
group were prepared and an equal amount of total RNA from each
preparation was pooled, respectively. The CDNA was synthesized and
labeled with Cy3/Cy5, and randomly hybridized to a RiboArray™
Custom array 1×40K (RiboBio, Guangzhou, China) according to the
manufacturer’s instructions. The hybridized microarray was scanned
and the data were analyzed and normalized. The differentially
expressed genes were identified at a fold change ≥2.
GO analysis and pathway enrichment
The gene ontology (GO) and Kyoto Encyclopedia of
Genes and Genomes (KEGG) pathway enrichment analysis of the
differentially expressed genes were performed using DAVID
tools.
Statistical analyses
Statistical analyses were performed using SPSS 20
software. All data were presented as the means ± SD of three
independent experiments. For cell functional assays, the 3
significance between the shLIPC and shCON groups were determined by
a two-tailed unpaired Student’s t-test. For chemo-resistance
experiments, data were analyzed with two-factor variance analysis
and Student-Newman-Keuls (SNK) test. P-values <0.05 were
considered statistically significant.
Results
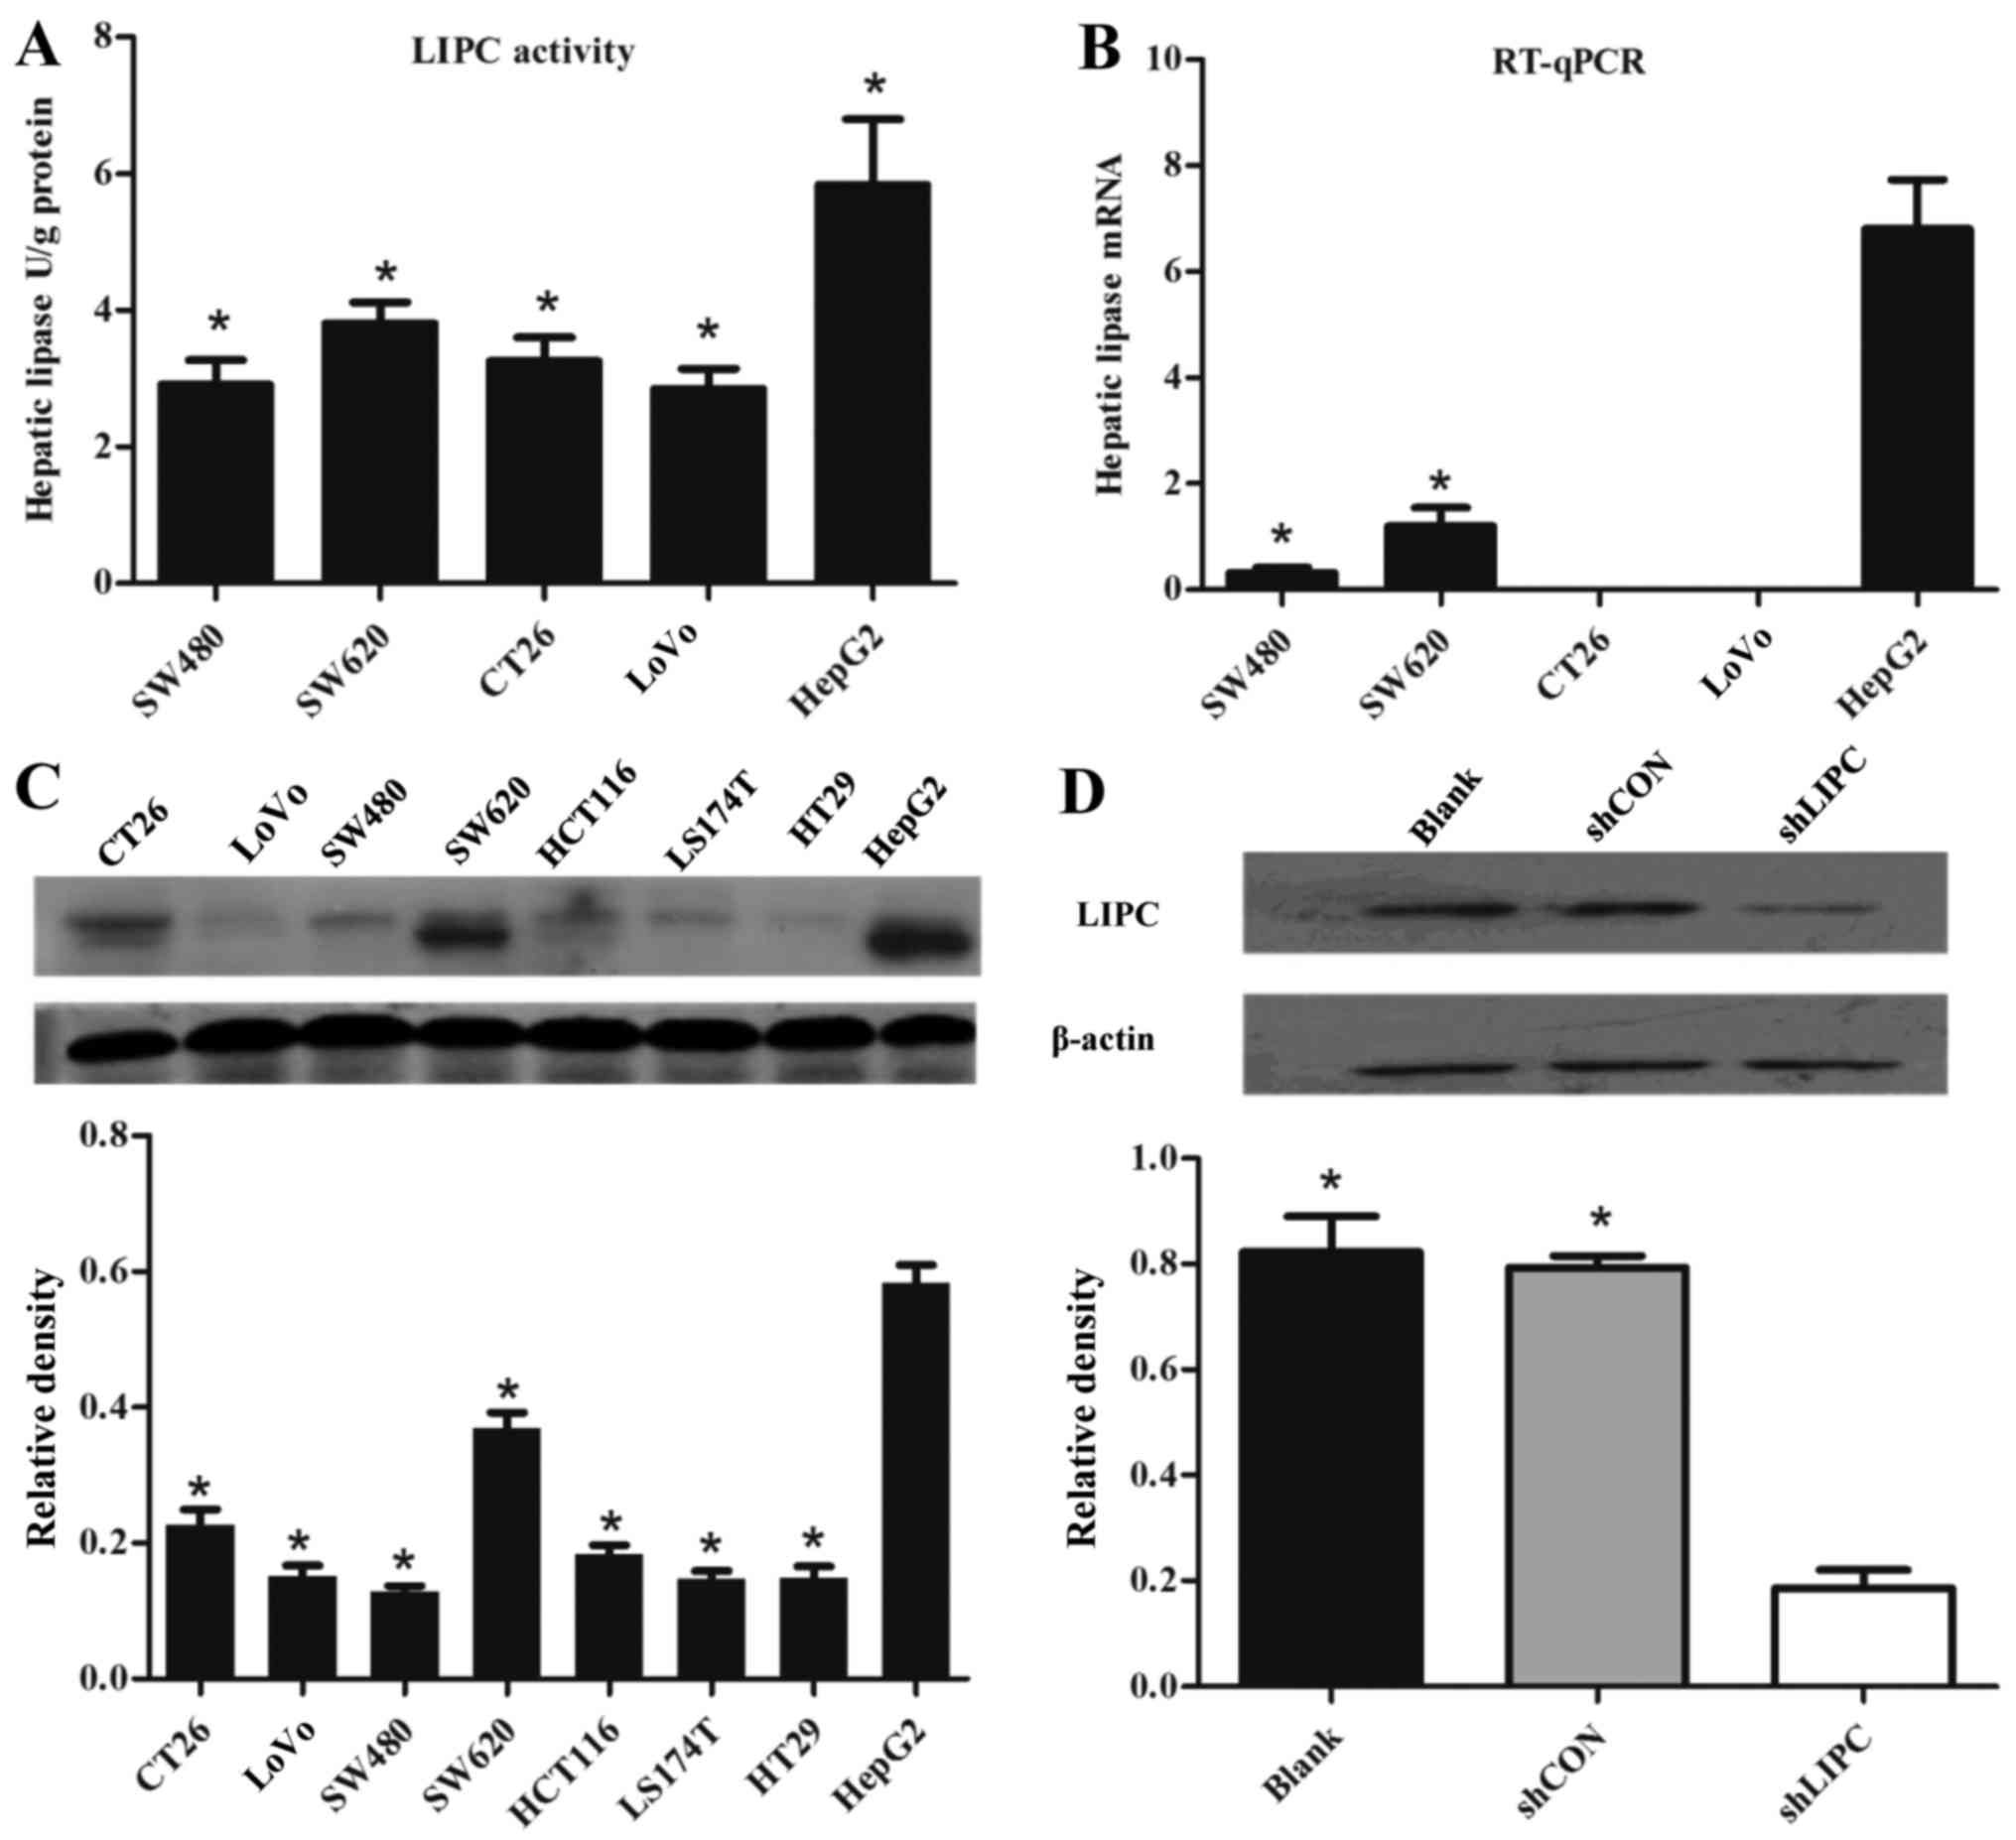
Differential expression of LIPC in cancer
cells
LIPC activity was examined in colorectal cancer
cells (human SW620, SW480 and LoVo cells, and mouse CT26 cells) and
hepatoblastoma HepG2 cells. The HepG2 cells exhibited a 1.92-fold
higher LIPC activity compared to the other cells (P<0.001)
(Fig. 1A). The LIPC mRNA levels
in the HepG2 cells determined by RT-qPCR were the highest among the
cell lines (P<0.001) (Fig.
1B). Similarly, the protein levels of LIPC in the HepG2 cells
were significantly increased compared with the other cell lines
(P<0.001) (Fig. 1C). The HepG2
cells exhibited relatively higher levels of LIPC compared to the
other cell lines, and were thus selected as a suitable model for
shRNA interference assays. The protein levels of LIPC were
determined by western blot analysis. Compared with the
shCON-transfected cells, the mRNA and protein levels of LIPC were
significantly decreased in the shLIPC-transfected cells
(P<0.001) (Fig. 1D).
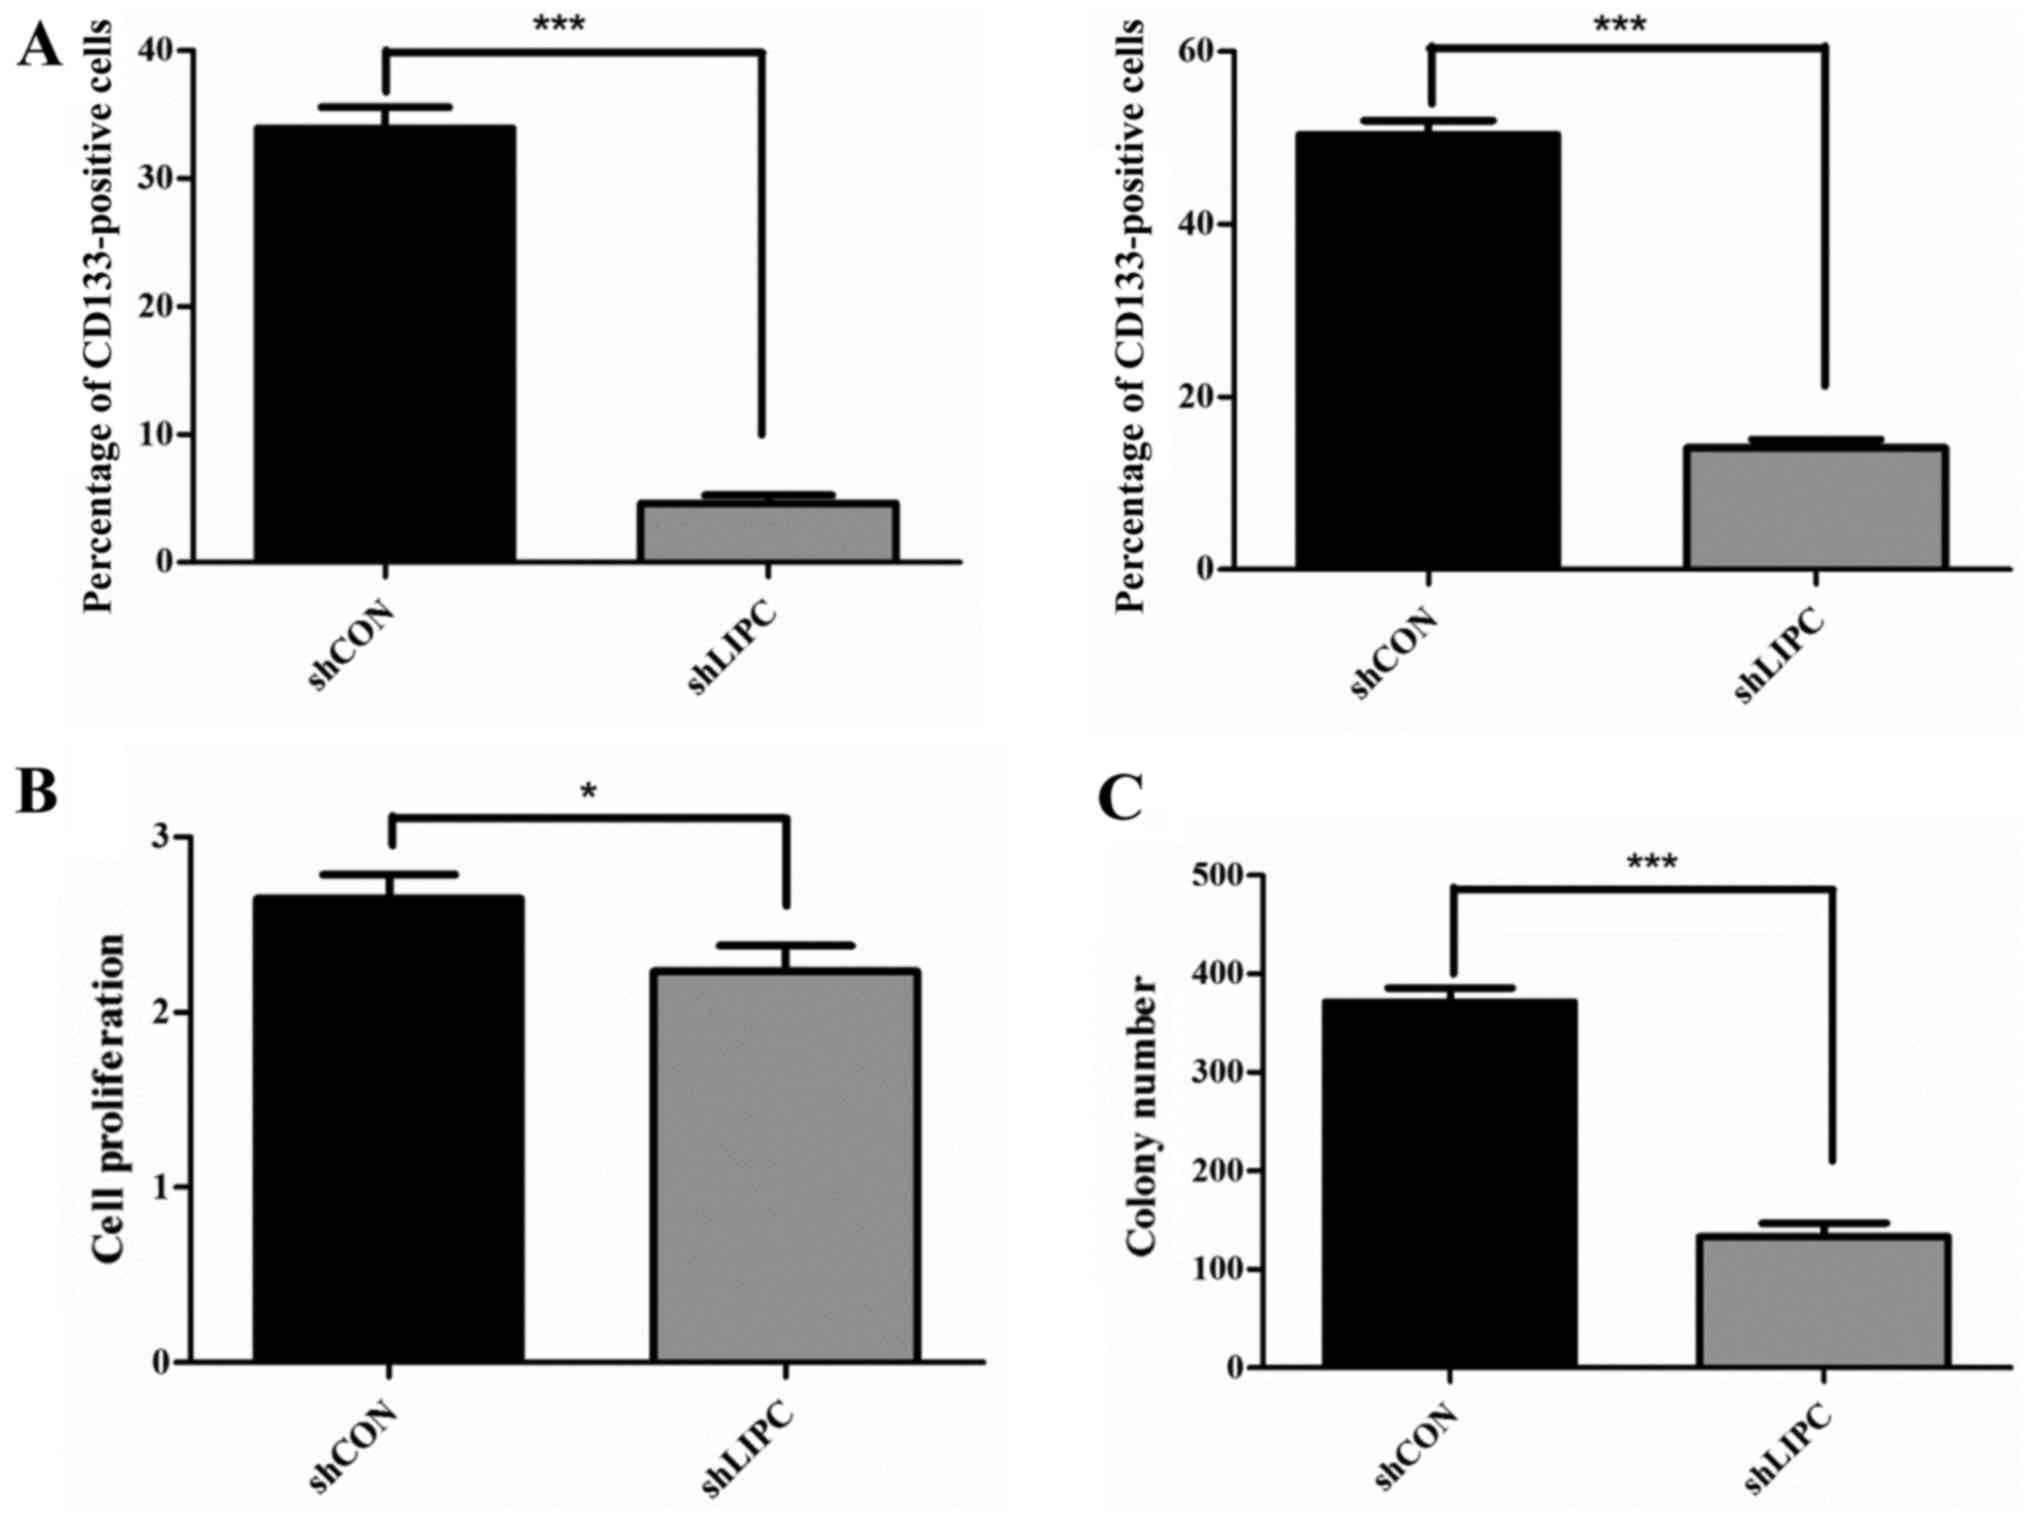
Downregulation of LIPC decreases the
expression of CD133
The association between LIPC and the tumor-derived
cell marker, CD133, was explored. CD133 expression was decreased
significantly in the HepG2 cells transfected with shLIPC
(4.62±0.36%) compared to the HepG2 shCON-transfected cells
(33.94±0.94%) (P<0.001) (Fig.
2A, left panel). Similar results were observed for CD133
expression in the cytoplasm. The expression of CD133 in the
cytoplasm of the HepG2 shLIPC-transfected cells (14.11±0.57%) was
significantly decreased compared to that of the HepG2
shCON-transfected cells (50.35 ±0.97%) (P<0.001) (Fig. 2A, right panel).
Downregulation of LIPC decreases cell
proliferation and colony formation
MTT assays indicated that cell proliferation was
slightly decreased after LIPC knockdown compared to the respective
control groups (P<0.05) (Fig.
2B). We also performed a colony formation assay to analyze the
proliferative potential of single cells after the silencing of LIPC
in vitro. The size of single colony formation in
shLIPC-transfected HepG2 cells was markedly smaller and the number
of colonies containing ≥50 cells was reduced by 64.4±2.7% compared
to the shCON-transfected cells (P<0.001) (Fig. 2C). These data suggest that the
knockdown of LIPC inhibits the proliferation and colony formation
of HepG2 cells.
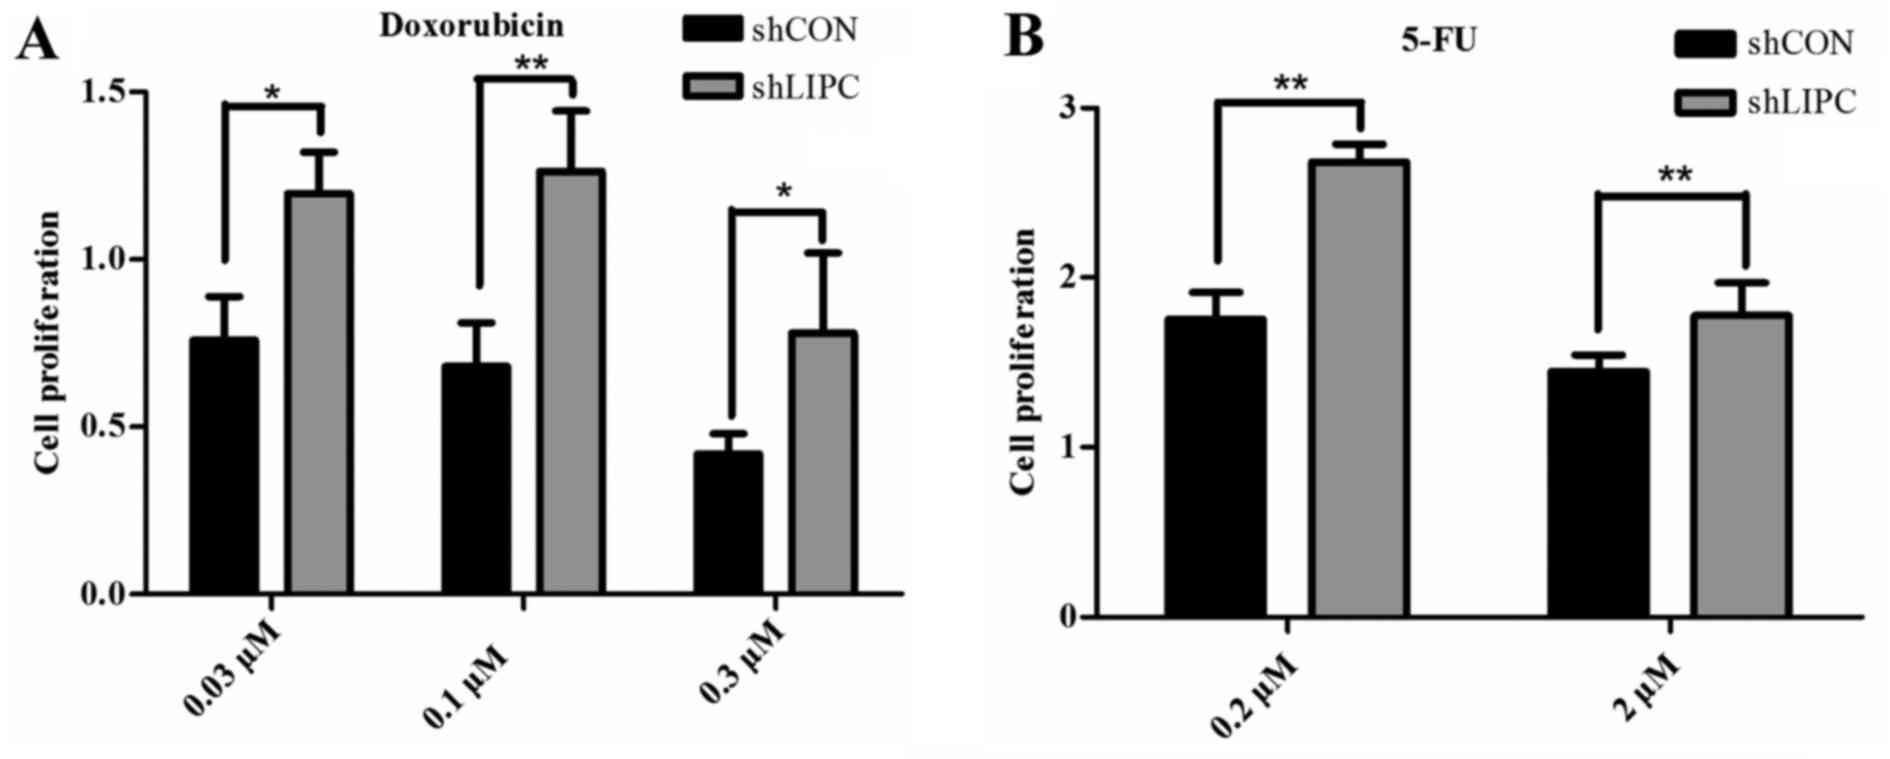
Downregulation of LIPC increases
chemoresistance in HepG2 cells
Cells transfected with shLIPC exhibited an increased
cell viability following treatment with 0.03, 0.1 and 0.3 µM
doxorubicin compared to the shCON-transfected cells (P<0.05)
(Fig. 3A). Similar results were
observed in cells treated with 0.2 and 2.0 µM 5-FU (P<0.01)
(Fig. 3B). The current data
suggest that the downregulation of LIPC enhances resistance to
doxorubicin and 5-FU in HepG2 cells. We observed no significant
differences in drug resistance assays following LIPC upregulation
(data not shown).
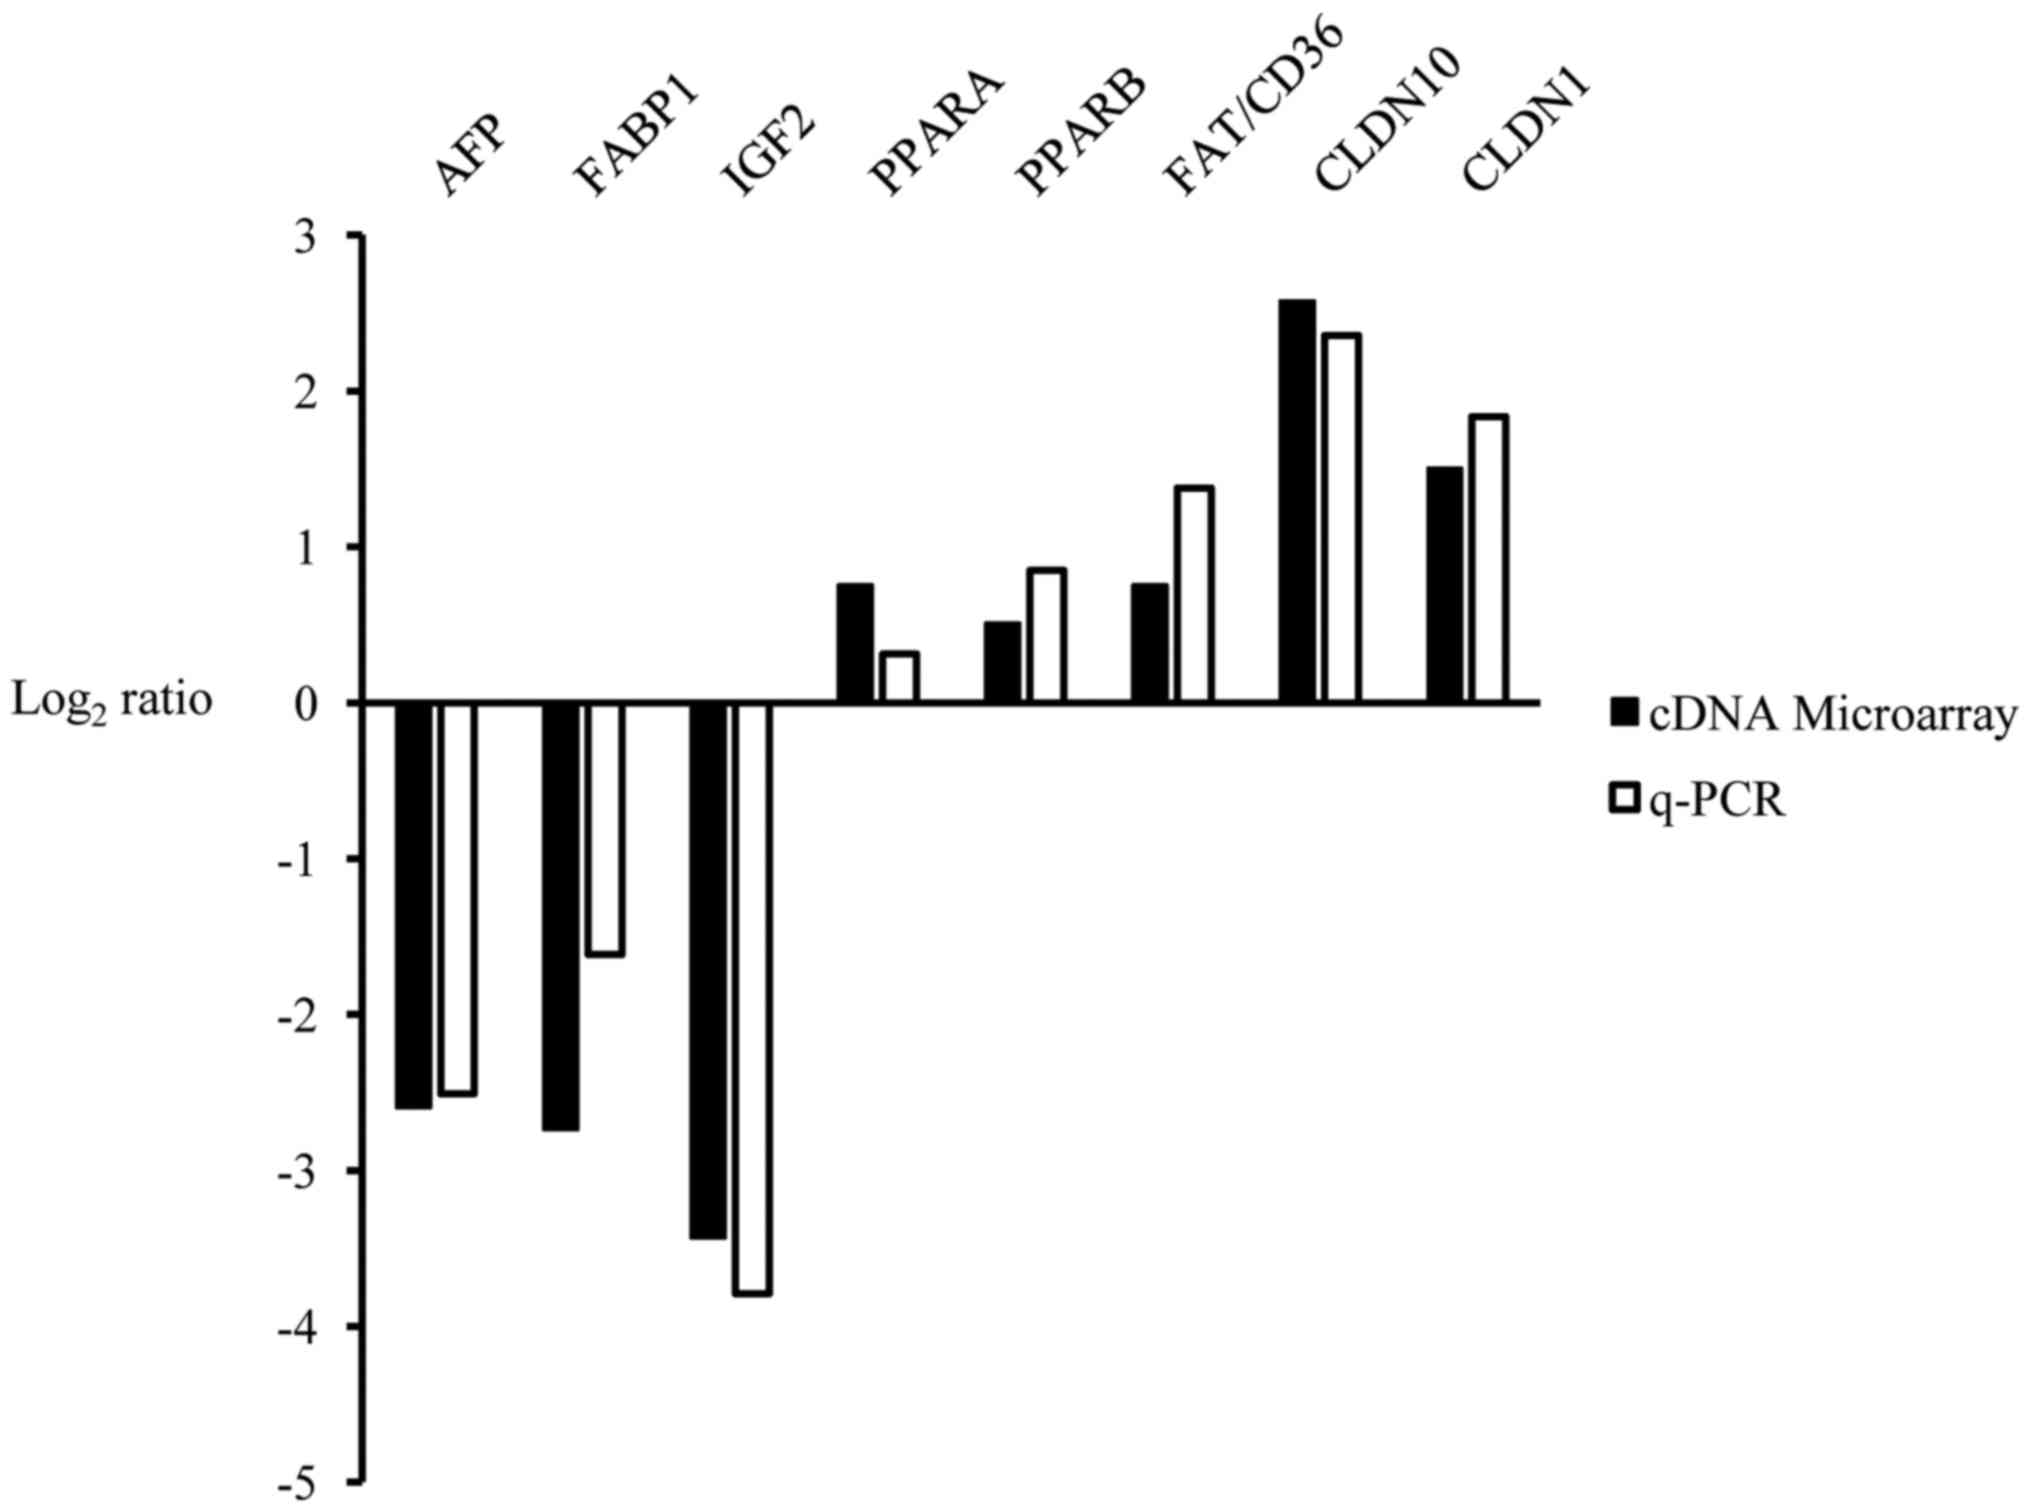
Genes differentially expressed following
the knockdown of LIPC
We found 1,602 genes that were upregulated and 716
genes that were downregulated in the shLIPC-transfected cells
compared with the shCON-transfected cells using a log2
(fold change) ≥1 as the standard selection criteria. Detailed gene
lists of the top 25 of the most differentially expressed genes are
summarized in Table I. Eight
candidate genes from the microarray analysis were selected for
validation by RT-qPCR (Fig.
4).
 | Table ITop 25 upregulated and downregulated
transcripts in HepG2 cells after the knockdown of hepatic lipase
(LIPC). |
Table I
Top 25 upregulated and downregulated
transcripts in HepG2 cells after the knockdown of hepatic lipase
(LIPC).
| Upregulated
accession | Downregulated gene
ID | Gene symbol | Ratio | Accession | Gene ID | Gene symbol | Ratio |
|---|
| NM_007342 | 11097 | NUPL2 | 22.08 | NM_001005482 | 79310 | OR5H2 | 12.12 |
| NM_001024644 | 2829 | XCR1 | 17.16 | NR_038404 | 100506801 | LOC100506801 | 11.08 |
| NR_037897 | 386627 | FLJ38109 | 14.97 | NM_001127598 | 3481 | IGF2 | 10.80 |
| XR_132758 | 440157 | LOC440157 | 9.665 | NM_001135189 | 3267 | AGFG1 | 10.30 |
| NM_181706 | 120526 | DNAJC24 | 9.400 | NM_182715 | 6856 | SYPL1 | 9.487 |
| NR_029975 | 574413 | MIR409 | 8.755 | NM_021871 | 2243 | FGA | 8.808 |
| NM_001214 | 750 | C16orf3 | 8.626 | NM_014628 | 9587 | MAD2L1BP | 7.579 |
| NM_033306 | 837 | CASP4 | 8.566 | NM_004536 | 4671 | NAIP | 7.358 |
| XR_159202 | 100506518 | LOC100506518 | 8.246 | NM_001443 | 2168 | FABP1 | 6.662 |
| NM_001170796 | 79752 | ZFAND1 | 7.770 | NM_000509 | 2266 | FGG | 6.559 |
| NM_007224 | 11247 | NXPH4 | 7.133 | NM_000612 | 3481 | IGF2 | 6.381 |
| NM_003644 | 8522 | GAS7 | 6.800 | NM_001134 | 174 | AFP | 6.050 |
| NM_001136508 | 284546 | C1orf185 | 6.701 | NM_001100912 | 222389 | BEND7 | 5.778 |
| NM_022746 | 64757 | MARC1 | 6.611 | NR_003512 | 723961 | INS-IGF2 | 5.378 |
| NR_037456 | 100500802 | MIR3685 | 6.551 | NM_019855 | 56344 | CABP5 | 5.132 |
| XR_133419 | 100653086 | LOC100653086 | 6.527 | NM_000327 | 6094 | ROM1 | 5.128 |
| NM_153448 | 80712 | ESX1 | 6.475 | NM_001007559 | 6760 | SS18 | 5.118 |
| NM_206922 | 401262 | CRIP3 | 6.406 | NM_00101172 | 144983 | HNRNPA1L2 | 5.044 |
| NM_014294 | 23471 | TRAM1 | 6.101 | NR_036141 | 100422870 | MIR3180-1 | 5.007 |
| XM_003403794 | 100509542 | LOC100509542 | 6.034 | NR_033832 | 340113 | LOC340113 | 4.978 |
| NM_015474 | 25939 | SAMHD1 | 6.015 | NM_000014 | 2 | A2M | 4.824 |
| NM_006984 | 100500882 | CLDN10 | 5.983 | NM_001063 | 7018 | TF | 4.809 |
| NR_037440 | 9071 | MIR3667 | 5.968 | NM_001025253 | 7163 | TPD52 | 4.751 |
| NR_015364 | 441204 | LOC441204 | 5.911 | NM_001256654 | 7594 | ZNF43 | 4.493 |
| NR_026562 | 55969 | C20orf24 | 5.853 | NR_001443 | 339240 | LOC339240 | 4.422 |
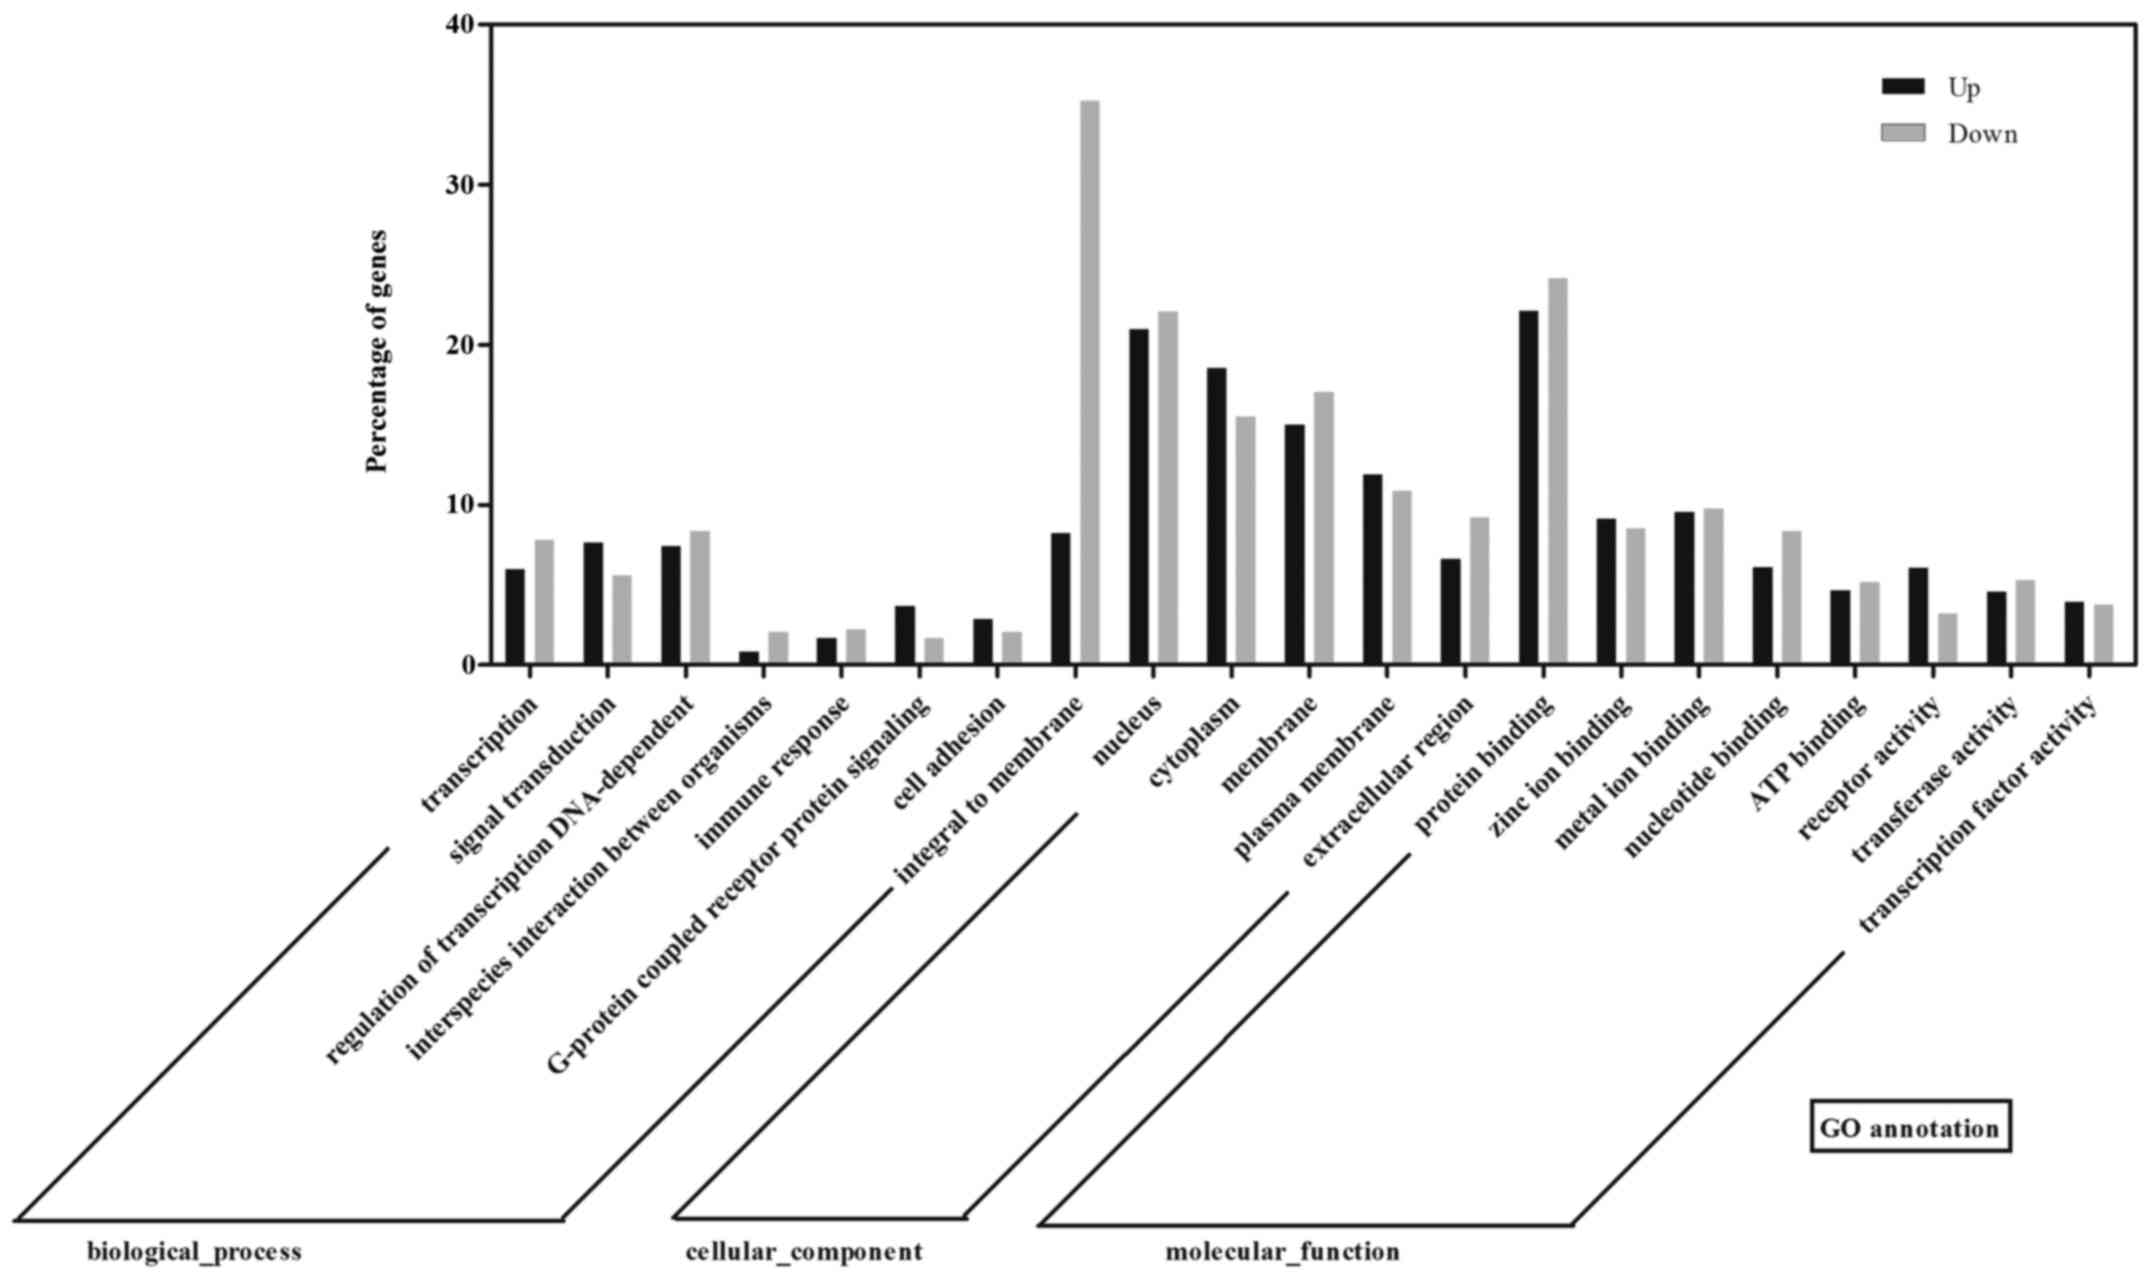
To examine the function of the differentially
expressed mRNAs and identify the biological pathway involved, the
data were further analyzed using Gene Ontology (GO) and the Kyoto
Encyclopedia of Genes and Genomes (KEGG) database. GO analysis
revealed that the differentially expressed genes fell into the
following categories: Regulation of transcription, NA-dependent,
signal transduction in biological process ontology; integral to
membrane, nucleus and cytoplasm in cellular component ontology; and
protein binding, zinc ion binding, and metal ion binding in
molecular function ontology (Fig.
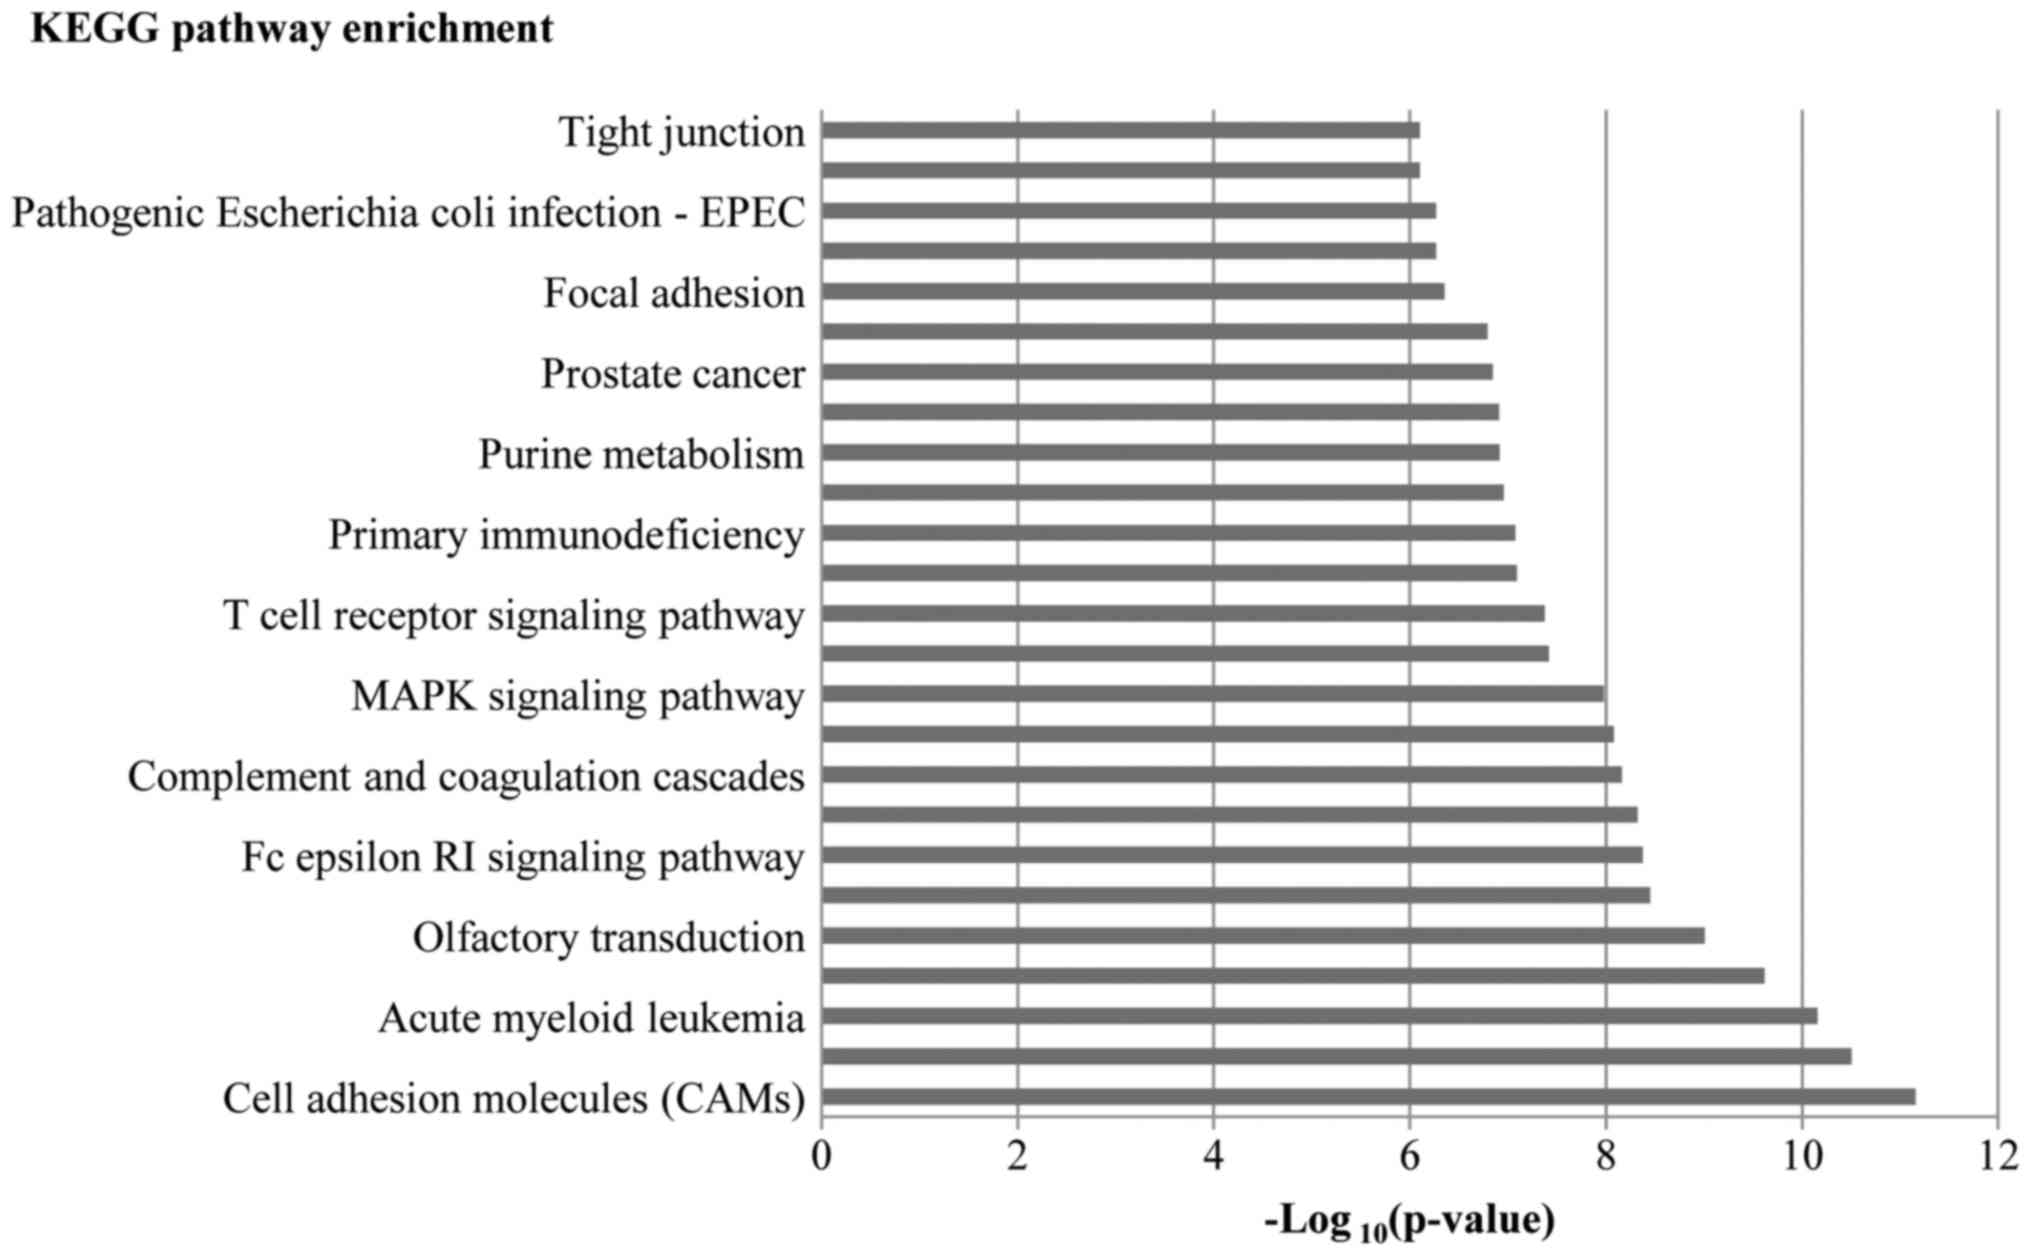
5). In KEGG analysis, a total of 124 pathways were regulated by
the differentially expressed genes, which mainly involved cell
adhesion molecules (CAMs), axon guidance, the vascular endothelia
growth factor (VEGF) signaling pathway, and the Wnt signaling
pathway. The top 12 regulated pathways are listed in Fig. 6.
Discussion
Little is known about the mechanisms of action of
LIPC in cancer cells. Previous studies reported that serum lipase
activities were elevated before detection of tumor relapse or
progression (13–15). These findings suggest that lipase
may play a tumor marker-like role and contributed to the early
detection of malignant neoplasm. In this study, we demonstrated
that the downregulation of LIPC inhibited CD133 expression in and
the colony formation of HepG2 cells.
CD133, also known as prominin-1, is considered a
marker for a tumor-derived cell population of brain tumors
(16), melanoma (17), prostate (18,19), colon (20,21) and liver cancers (22,23). A number of studies have indicated
that CD133(+) cells are capable of greater tumorigenicity and a
higher incidence of metastasis compared to CD133(−) cells. O’Brien
et al demonstrated that only CD133(+) colon cancer cells
were able to initiate tumor growth in immunodeficient mice
(20). Bao et al found
that CD133(+) glioma cancer cells promoted tumor angiogenesis
through VEGF (24). However, the
role of CD133 as a tumor-derived cell marker is controversial. In
fact, a number of studies have indicated that the CD133(−)
population is equally capable, if not more aggressive, of tumor
initiation (25,26). Jaksch et al argued that
differential CD133 expression may be a marker of different cell
cycle stages rather than a marker of stable tumor-derived cells
(27). Taken together, these
studies suggest that too much attention has been placed on the role
of CD133 for the identification of tumor-derived cells, while the
actual biological functions of this molecule remain unknown. A
previous study by Ding et al revealed that both LIPC and
CD133 contributed to liver metastasis (7). The data from the present study
revealed that a decreased CD133 expression was associated with LIPC
deficiency in HepG2 cells, which was demonstrated to inhibit cell
proliferation and decrease the colony formation rates.
However, in terms of chemoresistance, there was no
result that was consistent with that of previous literature
(8), since the reduction in CD133
expression did not decrease chemoresistance to doxorubicin and
5-FU. It might be that it is LIPC not CD133, which plays a role in
regulating drug resistance. As regards the use of CD133 as a stable
marker for tumor-derived cells, some previous studies have
indicated that the biological behavior of tumor-derived cells is
influenced by the surrounding microenvironment, which is affected
by tumor stages, histopathological types, nutritional conditions
and therapies (28). We found
that in LIPC-silenced cells, a higher percentage of
‘membrane-integrated’ genes were downregulated and more cell
adhesion molecules were regulated. Under the conditions of cell
culture, different surrounding microenvironments affecting cell
adhesion in vitro might result in such drug resistance
results. In the next step, the drug resistance in vivo is
worth investigating.
One intriguing finding of the present study was that
the CAM pathway was demonstrated to be the most significantly
regulated pathway by the differentially expressed genes. Moreover,
the mRNA levels of CLDN10 and CLDN1, which participate in the CAMs
pathway, were found to be almost six times and three times higher
in shLIPC cells compared to shCON cells, respectively. Some
previous studies have indicated that a high expression of CLDN10
was associated with the recurrence of primary hepatic carcinoma,
and CLDN10 enhanced cell invasiveness and motility (29,30). Suh et al found that CLDN1
could promote metastasis of liver cancer by inducing
epithelial-mesenchymal transition (EMT) (31). However, in the present study, we
did not see obvious differences in cell migration after the
knockdown of LIPC (data not shown). We speculate that the CAM
pathway may have important implications for the mechanisms involved
in the tumor colony formation induced by LIPC expression.
A limitation of our study was that we performed the
experiments in a hepatoma cell in culture, which may present
distinct biological features without the regulation of the
surrounding microenvironment. Another limitation is that data on
more cell lines were not provided in this study. Further studies
using animal models and clinical tissue specimens are required in
the future. The present findings reveal the potential role of LIPC
as a therapeutic target in liver cancer. The association of LIPC
and CD133 remains to be determined, and further studies are
warranted to determine the specific mechanisms through which LIPC
participates in tumor progression.
Acknowledgments
The authors would like to acknowledge Medjaden
Bioscience Limited for the English language editing service.
Funding
The study was sponsored by the Returned Scientific
Research Foundation of the Ministry of Education and National
Natural Science Foundation of China (grant no. 81471080) to B.N.
This study was supported by the Guangzhou Pilot Project of Clinical
and Translational Research Center (early gastrointestinal cancers,
no. 7415696196402) and the Guangdong Provincial Bio-engineering
Research Center for Gastroenterology Diseases.
Availability of data and materials
The datasets used and/or analyzed during the current
study are available from the corresponding author on reasonable
request.
Authors’ contributions
XL, JZ and YF finished most of the experiments and
wrote the manuscript. JW and HZ performed the FACS. FD constructed
the stable cell lines. BJ, JW and BN designed the experiments and
revised the manuscript. All authors read and approved the final
manuscript.
Ethics approval and consent to
participate
Not applicable.
Patient consent for publication
Not applicable
Competing interests
The authors declare that they have no competing
interests.
References
|
1
|
Jemal A, Bray F, Center MM, Ferlay J, Ward
E and Forman D: Global cancer statistics. CA Cancer J Clin.
61:69–90. 2011. View Article : Google Scholar : PubMed/NCBI
|
|
2
|
Asghar U and Meyer T: Are there
opportunities for chemotherapy in the treatment of hepatocellular
cancer? J Hepatol. 56:686–695. 2012. View Article : Google Scholar
|
|
3
|
Sukowati CH, Rosso N, Crocè LS and
Tiribelli C: Hepatic cancer stem cells and drug resistance:
Relevance in targeted therapies for hepatocellular carcinoma. World
J Hepatol. 2:114–126. 2010. View Article : Google Scholar : PubMed/NCBI
|
|
4
|
Wong H and Schotz MC: The lipase gene
family. J Lipid Res. 43:993–999. 2002. View Article : Google Scholar : PubMed/NCBI
|
|
5
|
Santamarina-Fojo S, González-Navarro H,
Freeman L, Wagner E and Nong Z: Hepatic lipase, lipoprotein
metabolism, and atherogenesis. Arterioscler Thromb Vasc Biol.
24:1750–1754. 2004. View Article : Google Scholar : PubMed/NCBI
|
|
6
|
Nomura DK, Long JZ, Niessen S, Hoover HS,
Ng SW and Cravatt BF: Monoacylglycerol lipase regulates a fatty
acid network that promotes cancer pathogenesis. Cell. 140:49–61.
2010. View Article : Google Scholar : PubMed/NCBI
|
|
7
|
Ding Q, Chang CJ, Xie X, Xia W, Yang JY,
Wang SC, Wang Y, Xia J, Chen L, Cai C, et al: APOBEC3G promotes
liver metastasis in an orthotopic mouse model of colorectal cancer
and predicts human hepatic metastasis. J Clin Invest.
121:4526–4536. 2011. View
Article : Google Scholar : PubMed/NCBI
|
|
8
|
Galluzzi L, Goubar A, Olaussen KA, Vitale
I, Senovilla L, Michels J, Robin A, Dorvault N, Besse B, Validire
P, et al: Prognostic value of LIPC in non-small cell lung
carcinoma. Cell Cycle. 12:647–654. 2013. View Article : Google Scholar : PubMed/NCBI
|
|
9
|
Ma S, Lee TK, Zheng BJ, Chan KW and Guan
XY: CD133+ HCC cancer stem cells confer chemoresistance
by preferential expression of the Akt/PKB survival pathway.
Oncogene. 27:1749–1758. 2008. View Article : Google Scholar
|
|
10
|
Galluzzi L, Senovilla L, Vitale I, Michels
J, Martins I, Kepp O, Castedo M and Kroemer G: Molecular mechanisms
of cisplatin resistance. Oncogene. 31:1869–1883. 2012. View Article : Google Scholar
|
|
11
|
Livak and Schmittgen: Analysis of relative
gene expression data using real-time quantitative PCR and the
2(-Delta Delta C(T)) Method. Methods. 25:402–408. 2001. View Article : Google Scholar
|
|
12
|
Franken NA, Rodermond HM, Stap J, Haveman
J and van Bree C: Clonogenic assay of cells in vitro. Nat Protoc.
1:2315–2319. 2006. View Article : Google Scholar
|
|
13
|
Stein W, Bohner J and Bahlinger M: Macro
lipase - a new member of the family of immunoglobulin-linked
enzymes. J Clin Chem Clin Biochem. 25:837–843. 1987.PubMed/NCBI
|
|
14
|
Muñoz-Perez M, Sarrion-Pelous D,
Jimenez-Jimenez J, Martinez-Montiel P and Gallego-Valdes M: Chronic
increased serum lipase in a patient with suspected pancreatic
adenocarcinoma. Clin Chem. 43:191–193. 1997.PubMed/NCBI
|
|
15
|
Diani G, Poma G, Novazzi F, Zanirato S,
Porta C, Moroni M, Melzi d’ Eril GV and Moratti R: Increased serum
lipase with associated normoamylasemia in cancer patients. Clin
Chem. 44:1043–1045. 1998.PubMed/NCBI
|
|
16
|
Singh SK, Clarke ID, Terasaki M, Bonn VE,
Hawkins C, Squire J and Dirks PB: Identification of a cancer stem
cell in human brain tumors. Cancer Res. 63:5821–5828.
2003.PubMed/NCBI
|
|
17
|
Fang D, Nguyen TK, Leishear K, Finko R,
Kulp AN, Hotz S, Van Belle PA, Xu X, Elder DE and Herlyn M: A
tumorigenic subpopulation with stem cell properties in melanomas.
Cancer Res. 65:9328–9337. 2005. View Article : Google Scholar : PubMed/NCBI
|
|
18
|
Collins AT, Berry PA, Hyde C, Stower MJ
and Maitland NJ: Prospective identification of tumorigenic prostate
cancer stem cells. Cancer Res. 65:10946–10951. 2005. View Article : Google Scholar : PubMed/NCBI
|
|
19
|
Miki J, Furusato B, Li H, Gu Y, Takahashi
H, Egawa S, Sesterhenn IA, McLeod DG, Srivastava S and Rhim JS:
Identification of putative stem cell markers, CD133 and CXCR4, in
hTERT-immortalized primary nonmalignant and malignant tumor-derived
human prostate epithelial cell lines and in prostate cancer
specimens. Cancer Res. 67:3153–3161. 2007. View Article : Google Scholar : PubMed/NCBI
|
|
20
|
O’Brien CA, Pollett A, Gallinger S and
Dick JE: A human colon cancer cell capable of initiating tumour
growth in immunodeficient mice. Nature. 445:106–110. 2007.
View Article : Google Scholar
|
|
21
|
Ricci-Vitiani L, Lombardi DG, Pilozzi E,
Biffoni M, Todaro M, Peschle C and De Maria R: Identification and
expansion of human colon-cancer-initiating cells. Nature.
445:111–115. 2007. View Article : Google Scholar
|
|
22
|
Suetsugu A, Nagaki M, Aoki H, Motohashi T,
Kunisada T and Moriwaki H: Characterization of CD133+
hepatocellular carcinoma cells as cancer stem/progenitor cells.
Biochem Biophys Res Commun. 351:820–824. 2006. View Article : Google Scholar : PubMed/NCBI
|
|
23
|
Yin S, Li J, Hu C, Chen X, Yao M, Yan M,
Jiang G, Ge C, Xie H, Wan D, et al: CD133 positive hepatocellular
carcinoma cells possess high capacity for tumorigenicity. Int J
Cancer. 120:1444–1450. 2007. View Article : Google Scholar : PubMed/NCBI
|
|
24
|
Bao S, Wu Q, Sathornsumetee S, Hao Y, Li
Z, Hjelmeland AB, Shi Q, McLendon RE, Bigner DD and Rich JN: Stem
cell-like glioma cells promote tumor angiogenesis through vascular
endothelial growth factor. Cancer Res. 66:7843–7848. 2006.
View Article : Google Scholar : PubMed/NCBI
|
|
25
|
Shmelkov SV, Butler JM, Hooper AT, Hormigo
A, Kushner J, Milde T, St Clair R, Baljevic M, White I, Jin DK, et
al: CD133 expression is not restricted to stem cells, and both
CD133+ and CD133− metastatic colon cancer
cells initiate tumors. J Clin Invest. 118:2111–2120.
2008.PubMed/NCBI
|
|
26
|
Meng X, Li M, Wang X, Wang Y and Ma D:
Both CD133+ and CD133− subpopulations of A549
and H446 cells contain cancer-initiating cells. Cancer Sci.
100:1040–1046. 2009. View Article : Google Scholar : PubMed/NCBI
|
|
27
|
Jaksch M, Múnera J, Bajpai R, Terskikh A
and Oshima RG: Cell cycle-dependent variation of a CD133 epitope in
human embryonic stem cell, colon cancer, and melanoma cell lines.
Cancer Res. 68:7882–7886. 2008. View Article : Google Scholar : PubMed/NCBI
|
|
28
|
Yang JD, Nakamura I and Roberts LR: The
tumor microenvironment in hepatocellular carcinoma: Current status
and therapeutic targets. Semin Cancer Biol. 21:35–43. 2011.
View Article : Google Scholar :
|
|
29
|
Cheung ST, Leung KL, Ip YC, Chen X, Fong
DY, Ng IO, Fan ST and So S: Claudin-10 expression level is
associated with recurrence of primary hepatocellular carcinoma.
Clin Cancer Res. 11:551–556. 2005.PubMed/NCBI
|
|
30
|
Ip YC, Cheung ST, Lee YT, Ho JC and Fan
ST: Inhibition of hepatocellular carcinoma invasion by suppression
of claudin-10 in HLE cells. Mol Cancer Ther. 6:2858–2867. 2007.
View Article : Google Scholar : PubMed/NCBI
|
|
31
|
Suh Y, Yoon CH, Kim RK, Lim EJ, Oh YS,
Hwang SG, An S, Yoon G, Gye MC, Yi JM, et al: Claudin-1 induces
epithelial-mesenchymal transition through activation of the
c-Abl-ERK signaling pathway in human liver cells. Oncogene.
32:4873–4882. 2013. View Article : Google Scholar
|