Introduction
Aerobic glycolysis is one of the characteristics of
tumor metabolism (1). Normally,
90% adenosine 5′-triphosphate (ATP) is produced via mitochondrial
oxidative phosphorylation in non-cancerous cells, whereas only 10%
of ATP is obtained from aerobic glycolysis. By contrast, cancer
cells exhibit active glucose uptake, enhancement of aerobic
glycolysis and possess an abnormal metabolic phenotype in which
glucose carbons are predominantly converted to lactate, even under
the conditions of adequate oxygen. This unique phenomenon of
metabolic alteration in cancer is referred to as the ‘Warburg
effect’ (2). In previous years,
aerobic glycolysis has become a focus of study due to its crucial
role in the maintenance and development of tumor cells.
Additionally, the close association between increased levels of
lactate and poor patient prognosis or overall survival in different
cancer types has been demonstrated by clinical studies (3). Therefore, the investigation of the
molecular mechanisms resulting in this phenotype and their
contributions to cancer initiation and development is of major
importance for clinical treatment.
MicroRNAs (miRNAs/miRs) are endogenous non-coding
RNA molecules between 21–25 nucleotides in length, and serve
complicated and various roles in a number of cellular biological
processes by post-transcriptionally modulating gene expression
through binding to the 3′untranslated region (3′UTR) of the target
mRNA (4). At present, the
critical roles of miRNAs in cancer have been well-documented and
miRNA-based medical treatment approaches are expected to result in
a breakthrough for cancer biotherapy (5). miR-199a-3p, the well-conserved
miRNA, is derived from its precursor miR-199a which exists in two
different loci: miR-199a-1 is located in the intron 15 of the
Dynamin 2 gene on chromosome 19; miR-199a-2 is located in intron 14
of Dynamin 3 gene on chromosome 1 (6,7).
Generally, the functions and roles of miRNAs are defined by their
expression level and relevance of their target genes. miR-199a-3p
was identified to be important in multiple biological processes
including cell cycle regulation, cell proliferation, apoptosis,
differentiation, osteogenesis, chondrogenesis, adipogenesis and
tumorigenesis through association with the modulation of different
target genes, including mechanistic target of rapamycin, MET
proto-oncogene, receptor tyrosine kinase, MYC proto-oncogene, BHLH
transcription factor, cyclin D1, SMAD family member 1, LIF,
interleukin 6 family cytokine, cyclooxygenase-2 and
mitogen-activated protein kinase kinase kinase II (7). It was also demonstrated to be
dysregulated and may be an inhibitor in several cancer types
including hepatocellular carcinoma (8), renal cell carcinoma (9), papillary thyroid carcinoma (10), and prostate (11) and gastric cancer (12). The present study group and Liu
et al (13) demonstrated
that the expression of miR-199a-3p is low in testicular tumors and
that overexpression of miR-199a-3p in vitro, including in
the Ntera-2 cell line, inhibits cell proliferation, migration and
invasion. Chen et al (14)
demonstrated that the deregulation of miR-199a-3p expression in
testicular germ cell tumors may be due to hypermethylation of its
promoter. The similar phenomenon was also investigated in ovarian
cancer (15). In addition,
miR-199a-3p was identified to improve cisplatin sensitivity in
cholangiocarcinoma cells or breast cancer cells (16,17). Although these studies have
addressed the association between miR-199a-3p and tumorigenesis
using different models, little is known about its role in the
Warburg effect.
Previously, our study group suggested that
miR-199a-3p markedly increased the lactate production in Ntera-2
cells, and 4 significant genes [lactate dehydrogenase A (LDHA),
tumor protein 53 induced glycolysis regulatory phosphatase (TIGAR),
phosphoglycerate kinase 1 (PGK1) and solute carrier family 16
member 1 (MCT1)] downregulated by miR-199a-3p were identified
through qPCR array technology (13). The mechanism of how miR-199a-3p
downregulated these metabolic genes was unclear as the 4 selected
genes lacked the potential recognition sites of miR-199a-3p,
indicating that the regulation of miR-199a-3p on these 4 genes is
indirect. Therefore, the present study performed bioinformatics
analyses to search for potential explanations. All target genes of
miR-199a-3p predicted by TargetScan databases were identified and
termed the ‘A’ data set, and the transcription factor binding sites
of the promoters of the 4 metabolic genes were predicted using the
Genomatix transcription factor database and termed the ‘B’ data
set. By integrating data sets ‘A’ and ‘B’, the transcription factor
specificity protein 1 (Sp1) was demonstrated to overlap across the
two datasets, suggesting that it may be associated with miR-199a-3p
and the 4 metabolic genes. In the present study, this observation
was discussed and the potential of the miR-199a-3p/Sp1/LDHA axis to
modulate the glycolytic pathway, consequently promoting tumor
development, was demonstrated.
Materials and methods
Cell culture and transient
transfection
Human testicular teratoma Ntera-2 (CRL-1973 cells,
American Type Culture Collection, Manassas, VA, USA) were cultured
in RPMI-1640 medium (Gibco; Thermo Fisher Scientific, Inc.,
Waltham, MA, USA) supplemented with 10% fetal bovine serum (Gibco;
Thermo Fisher Scientific, Inc.), 100 U/ml penicillin and 100 mg/ml
streptomycin at 37°C with 5% CO2 and 95% humidity. Cell
transfection was performed using TurboFect™ in vitro
Transfection reagent (Thermo Fisher Scientific, Inc.) according to
the manufacturer’s protocol. For the rescue experiments, Ntera-2
cells were transfected with pcDNA3.1-Sp1 or pcDNA3.1 empty plasmids
(Vigene Biosciences, Ji’nan, Shandong, China) with miR-199a-3p
mimics (100 nM; Table I; Shanghai
GenePharma Co., Ltd., Shanghai, China) and cultured for 72 h to
investigate whether Sp1 overexpression rescued the metabolic
phenotype of Ntera-2 cells.
 | Table ISequences of microRNA and siRNA. |
Table I
Sequences of microRNA and siRNA.
| miR/siRNA | Primer sequence
(5′-3′) |
|---|
| miR-199a-3p
mimics | F:
5′-ACAGUAGUCUGCACAUUGGUUA-3′ |
| R:
5′-ACCAAUGUGCAGACUACUGUUU-3′ |
| Sp1-homo-si588 | F:
5′-CCUGGAGUGAUGCCUAAUATT-3′ |
| R:
5′-UAUUAGGCAUCACUCCAGGTT-3′ |
| Sp1-homo-si721 | F:
5′-GUGCAAACCAACAGAUUAUTT-3′ |
| R:
5′-AUAAUCUGUUGGUUUGCACTT-3′ |
|
Sp1-homo-si1093 | F:
5′-GUGCAAACCAACAGAUUAUTT-3′ |
| R:
5′-AUAAUCUGUUGGUUUGCACTT-3′ |
For the RNA interference (RNAi)-mediated inhibition
of Sp1 expression, Ntera-2 cells were transfected with 3 kinds of
Sp1 small interfering RNA (siRNA) oligonucleotides or control siRNA
oligonucleotides (Table I;
Shanghai GenePharma Co., Ltd.) and cultured for 72 h before
subsequent experimentation.
Measurement of glucose consumption and
lactate production
Ntera-2 cells were transfected with either
miR-199a-3p mimics or negative control miRNA mimics (NC mimics) as
above. Following transfection, cells were cultured in complete
medium as above for 48 h at 37°C, the supernatants were harvested
by centrifugation (1,000 × g for 5 min at room temperature) and
detected for the measurement of intracellular glucose utilization
and lactate concentration using an Automatic Biochemical Analyzer
(7170A; Hitachi, Ltd., Tokyo, Japan).
Measurement of reactive oxygen species
(ROS) and ATP
For the measurement of ROS, 105 Ntera-2
cells were plated into blank 96-well plates. Following transfection
as above and culture for 48 h, the cells were washed with Hanks’
Balanced Salt Solution and then incubated with 10 µM
dichlorofluorescein diacetate (DCF-DA) in RPMI-1640 for 1 h at
37°C. The formation of the fluorescent-oxidized derivative of
DCF-DA was monitored at an emission wavelength of 525 nm and
excitation wavelength of 500 nm in a fluorescence multi-detection
reader.
For the measurement of ATP, 105 Ntera-2
cells were lysed with ATP detection kit lysis buffer (Beyotime
Institute of Biotechnology, Haimen, China) in 6-well plates and
moved to 1.5 ml tubes, and then centrifuged at 13,200 × g for 5 min
at 4°C. Subsequently, the supernatant was treated with an ATP
detection kit (Beyotime Institute of Biotechnology), according to
the manufacturer’s protocol. Finally, the fluorescence intensities
of the samples were measured with Glomax 20/20 (Promega
Corporation, Madison, WI, USA) instrument to calculate the
concentration of ATP.
Polymerase chain reaction (PCR)
amplification and recombinant plasmid construction
The human genomic DNA was extracted from Ntera-2
cells with a genomic DNA kit (Tiangen Biotech, Co., Ltd., Beijing,
China). For the construction of Sp1-3′ UTR reporter plasmid and its
mutant, the wild-type 3′UTR (3′UTR-wt) of Sp1 containing the
miR-199a-3p binding sites was obtained by PCR. DNA was extracted
from Ntera-2 cells using 2X TSINGKE Master Mix (TSINGKE, Beijing,
China) and primer sequences are given in Table II. The reaction conditions: 95°C
for 5 min, 30 cycles of 95°C for 15 sec, 55°C for 30 sec and 72°C
for 30 sec, 72°C for 5 min. The mutant Sp1 3′UTR (3′UTR-mut), in
which the mutations occurred in the conserved binding sites for
miR-199a-3p, were generated by using overlapping extension PCR: Sp1
3′UTR-mut primers F1 and R1, F2 and R2 (Table II) were respectively used to
amplify 2 fragments by PCR first (95°C for 5 min, 30 cycles of 95°C
for 15 sec, 55°C for 30 sec and 72°C for 30 sec, 72°C for 5 min).
There is an overlap region in these 2 fragments. Then primers F1,
R2 and 2 fragments were used to do overlapping PCR (95°C for 5 min,
30 cycles of 95°C for 15 sec, 55°C for 30 sec and 72°C for 30 sec,
72°C for 5 min). The fragment of Sp1 3′UTR-wt (1 µg) and the
mutant 3′UTR fragment (1 µg) were inserted into
XhoI/NotI-digested pmiR-RB-Reporter™ Vector (Guangzhou RiboBio Co.,
Ltd., Guangzhou, China) containing both firefly and Renilla
luciferase reporter genes, respectively. Recombinant plasmid (1
µg) were characterized by sequencing analysis (TSINGKE) and
enzyme digestion (Fastdigest XhoI FD0694 and Fastdigest NotI
FD0593, incubated at 37°C for 2 h; Thermo Fisher Scientific,
Inc.).
| Table IIPrimers for reverse transcription
quantitative polymerase chain reaction analysis. |
Table II
Primers for reverse transcription
quantitative polymerase chain reaction analysis.
| Gene | Primer sequence
(5′-3′) | Length, bp |
|---|
| GAPDH | F:
GTCTCCTCTGACTTCAACAGCG | 243 |
| R:
ACCACCCTGTTGCTGTAGCCAA | |
| Sp1 | F:
CTCCAGACCATTAACCTCAGTG | 147 |
| R:
ATCATGTATTCCATCACCACCAG | |
| TIGAR | F:
ACTCAAGACTTCGGGAAAGGA | 144 |
| R:
CACGCATTTTCACCTGGTCC | |
| LDHA | F:
TTGACCTACGTGGCTTGGAAG | 90 |
| R:
GGTAACGGAATCGGGCTGAAT | |
| MCT1 | F:
GGTGGAGGTCCTATCAGCAGT | 107 |
| R:
CAGAAAGAAGCTGCAATCAAGC | |
| PGK1 | F:
TGGACGTTAAAGGGAAGCGG | 152 |
| R:
GCTCATAAGGACTACCGACTTGG | |
| Sp1 3′ UTR wt | F: CCGCTCGAGGCACTCCTTCCCTAACTCAA (Xho
I site is underlined) | 445 |
| R: ATTTGCGGCCGCGTCCAAATACTCCACTAACTCCTG
(Not I site is underlined) | |
| Sp1 3′ UTR mut | F1: CCGCTCGAGGCACTCCTTCCCTAACTCAA (Xho
I) | 207 |
| R1: TGCCTGCG
TTATTGGTAT | |
| F2:
ATGCCAATAACGCAGGCA | 256 |
| R2:
ATTTGCGGCCGCGTCCAAATACTCCACTAACTCCTG
(Not I) | |
| pLDHA1257 | F: CGGGGTACCGGCAATGGAATCAGCAAGAATACAG
(KpnI) |
1,257 |
| R: CCCAAGCTTCGTGGCAATGAGATCCGGAAT
(HindIII) | |
For the construction of the LDHA promoter reporter
plasmid, a 1,257 bp fragment containing LDHA 5′UTR sequences from
−1,040 to +217 bp (Table III)
relative to the transcription initiation site, was amplified by PCR
using human genomic DNA obtained from Ntera-2 cells (DNA
polymerase; TSINGKE) as template and then subcloned into the
pGL3-basic plasmid. The primer sequences are given in in Table II and the reaction conditions of
PCR were: 95°C for 5 min, 30 cycles of 95°C for 15 sec, 55°C for 30
sec and 72°C for 90 sec. Based on the length of the promoter
fragments, the recombinant was labelled pLDHA1257. Recombinant
plasmid (1 µg) were characterized by sequencing analysis
(TSINGKE) and enzyme digestion (Fastdigest KpnI FD0524 and
Fastdigest HindIII FD0504, incubated at 37°C for 2 h, Thermo Fisher
Scientific, Inc.). All the primers used are summarized in Table II.
| Table IIISequence of LDHA 5′UTR from −1,040 to
+160 bp. |
Table III
Sequence of LDHA 5′UTR from −1,040 to
+160 bp.
| bp | Sequence
(5′-3′) |
|---|
| −1,040 |
GGCAATGGAATCAGCAAGAATACAGGCCCAGAGGTAAGTATGATAAGAAAACAAAAAATT |
| −980 |
GAGCTGGGCACGGTGGCTCACGCCTGTAATCCCAGCTCTTTGTGAGGCCGAGGCGGCCAG |
| −920 |
ATCACTTGAGGCCAGGAGTTTGAGATCAGCCTGACCAACATGGTGAAACCCCGTCTCTAC |
| −860 |
TAAAAATTACAAAAATTAGCCGGGCGTGGTGGCGCCTGGCTGTAATCCCATCTTCTCAGG |
| −800 |
AGGCTGAGGCAGGAGATTCGCTTGAACCCGGGAGGCGGAGGTTGCAGTGAGCCGAGATCA |
| −740 |
GCCCACTGCACTCCAGCCTGGGCGACAGAGCGACTCCGTTTCAAAAAAAAAAAAATTAAT |
| −680 |
AATTAAAAAAAAAATCGCAGGGCAAGTGGGCGCGCTTGTAGTCCCAGTCACTTCGGGGAG |
| −620 |
CCGAGGTGGGAGGATCGCTTGAGCCAGAAGGTCGAGGCTGCAGGAAGCCATGATCACGCC |
| −560 |
ACTGCCCTCCAGCCTGGGTGACAGAGTGAGACCCTGTCTCGAAAAATACCAAAAAACAAA |
| −500 |
TAAACAAACAAAAAACCAAAACCAAAAAAACAAGCCACTGACAGTTCTTGGGTATGGTTG |
| −440 |
AGACTCGAGATGAGATGCCAGTGGGGTGGGCAGTAGAAAGTGCAGAATAAAATGTACATT |
| −380 |
TGAACTGAGTCACCCTGCAAGGCCTGAGAGGCCAAGGCTTCACTGTGAGTGGGAGCTGGT |
| −320 |
AGGCTTAGCAGCAGAGGGAAAAGCAGCGTCGAGTTTTGGAGGTCACTCGACTTAGGTAAG |
| −260 |
AACAGACTGACTGACTGCTAGGCATTTTCTTCCTTTCGTTCAACAAATATTTGTGGAGTG |
| −200 |
CCTATTACGTGCCAGAAGCTGTTCTGGACACTGAGAAACAGGGATGAAGAAGAAACAGAT |
| −140 |
CCAAGCCTTCCTGAGAGTAACCTCCCCAGGTTTCATGGATGAGGAAACTGAAGGTCGTCC |
| −80 |
TGACTCAGGCTCATGGCTCCGACCCCGGCTTCTGTGGTTGGAGGGCAGCACCTTACTTAG |
| −20 |
ACTCCCAGCGCACGTGGAGCAGTCTGCCGGTCGGTTGTCTGGCTGCGCGCGCCACCCGGG |
| 40 |
CCTCTCCAGTGCCCCGCCTGGCTCGGCATCCACCCCCAGCCCGACTCACACGTGGGTTCC |
| 100 |
CGCACGTCCGCCGGCCCCCCCCGCTGACGTCAGCATAGCTGTTCCACTTAAGGCCCCTCC |
| 160 |
CGCGCCCAGCTCAGAGTGCTGCAGCCGCTGCCGCCGATTCCGGATCTCATTGCCACG |
Dual luciferase reporter assay
For the reporter system analysis, Ntera-2 cells
(105) were seeded in each well of 6- or 24-well plates
24 h prior to transfection. Each of the luciferase-containing
plasmids (Vigene Biosciences), with Renilla (Promega
Corporation) as an internal control, were co-transfected into
Ntera-2 cells and cultured for 48 h.
For the measurement of Sp1-3′UTR reporter activity,
Ntera-2 cells were transiently co-transfected for 48 h with
reporter plasmids and miR-199a-3p mimics or NC mimics (as
aforementioned), then were harvested in reporter lysis buffer
(Promega Corporation). Firefly luciferase and Renilla
luciferase activities were measured using the Dual Luciferase assay
kit (Promega Corporation), according to manufacturer’s protocol.
The luciferase activity normalized against the protein
concentration was expressed as a ratio of firefly luciferase to
Renilla luciferase units.
For the measurement of LDHA promoter activity, a
luciferase assay was performed using luciferase assay reagent
(Promega Corporation) according to the manufacturer’s protocol (as
aforementioned). The luciferase activity driven by the LDHA
promoter was measured using Modulus™ (Turner BioSystems; Thermo
Fisher Scientific, Inc.) instrument in Ntera-2 cells following
transfection for 48 h with the indicated LDHA promoter reporters in
the absence (Sp1 siRNA treatment) or presence (overexpression of
pcDNA3.1-Sp1 constructed by our group) of Sp1. LDHA
promoter-luciferase activities in transfected cells were normalized
to Renilla activity. All results were representative of at
least three independent experiments performed in triplicate.
cDNA synthesis and reverse
transcription-quantitative PCR (RT-qPCR) for miRNA and mRNA
detection
Total cellular RNA was extracted using
TRIzol® reagent (Takara Biotechnology Co., Ltd., Dalian,
China), according to the manufacturer’s protocol. Then, the
PrimeScript miRNA qPCR Starter kit version 2.0 (Takara
Biotechnology Co., Ltd.) was used for miRNA RT, and PrimeScript RT
reagent kit with gDNA Eraser (Takara Biotechnology Co., Ltd.) was
used for mRNA RT, according to the protocol of the manufacturer.
Finally, qPCR was performed using 2X SYBR Green qPCR Master Mix
(Low Rox) kit (Bimake, Houston, TX, USA) and MX3000 (Stratagene;
Agilent Technologies, Inc., Santa Clara, CA, USA) instrument. The
reaction conditions of PCR were: 95°C for 5 min, 40 cycles of 95°C
for 15 sec, 58°C for 30 sec and 72°C for 30 sec. The relative
expression was analyzed by the 2−ΔΔCq method. For miRNA,
U6 was used as an internal control. For mRNA, GAPDH was used as an
internal control and primer sequences are summarized in Table II.
Western blot analysis
Protein samples were isolated from whole cell
lysates (RIPA lysis buffer, Beyotime) and the concentration of
total protein was measured using BCA Protein Assay kit (Bejing
Dingguo Changsheng Biotechnology Co., Ltd., Beijing, China).
Amounts of samples (50 µg/lane) were separated by 10%
SDS-PAGE and then transferred onto a polyvinylidene difluoride
membrane. Subsequent to blocking in 5% skimmed milk dissolved in
TBST at 4°C for 2 h, the membrane was incubated with specific
primary antibodies. The following primary antibodies were incubated
at 4°C for 12 h: Sp1 (1:500; cat. no., CSB-PA050124; Cusabio
Technology LLC, Wuhan, China), LDHA (1:2,000; cat. no. 19987-1-AP;
Wuhan Sanying Biotechnology, Wuhan, China), TIGAR (1:1,000, cat.
no., CSB-PA162542, Cusabio Technology LLC), MCT1 (1:1,000; cat.
no., sc-365501; Santa Cruz Biotechnology, Inc., Dallas, TX, USA),
PGK1 (1:1,000; cat. no., CSB-PA00035A0Rb; Cusabio Technology LLC),
actin (1:10,000; cat. no., AC026; ABclonal, Woburn, MA, USA) and
GAPDH (1:5,000; cat. no., AP0063; Bioworld Technology, Inc., St.
Louis, MN, USA). Goat anti-mouse (1:2,000; cat. no., A0216) and
anti-rabbit (1:2,000; cat. no., A0208) IgG antibodies conjugated to
horseradish peroxidase were used as the secondary antibodies (both
Beyotime Institute of Biotechnology). Secondary antibody were
incubated with the membrane at 4°C for 2 h. The blotted proteins
were then determined by using enhanced chemiluminescence reagents
(SuperSignal™ West Pico PLUS Chemiluminescent Substrate, Thermo
Fisher Scientific, Inc.). Image Lab version 5.0 (Bio-Rad
Laboratories, Inc., Hercules, CA, USA) was used to analyze the
protein expression.
Bioinformatics prediction
TargetScan (www.targetscan.org) and Genomatix (www.genomatix.de) were applied to predict the putative
target genes of miR-199a-3p and the binding sites of Sp1 on LDHA
promoter, according to the given protocols.
Statistical analysis
All experiments were performed in triplicate, and
the results are presented as the mean ± standard deviation. All
statistical analyses were performed using SPSS software, version
17.0 (SPSS, Inc., Chicago, IL, USA). All data were analyzed with
analysis of variance and Student-Newman-Keuls test for continuous
variables. P≤0.05 was considered to indicate a statistically
significant difference.
Results
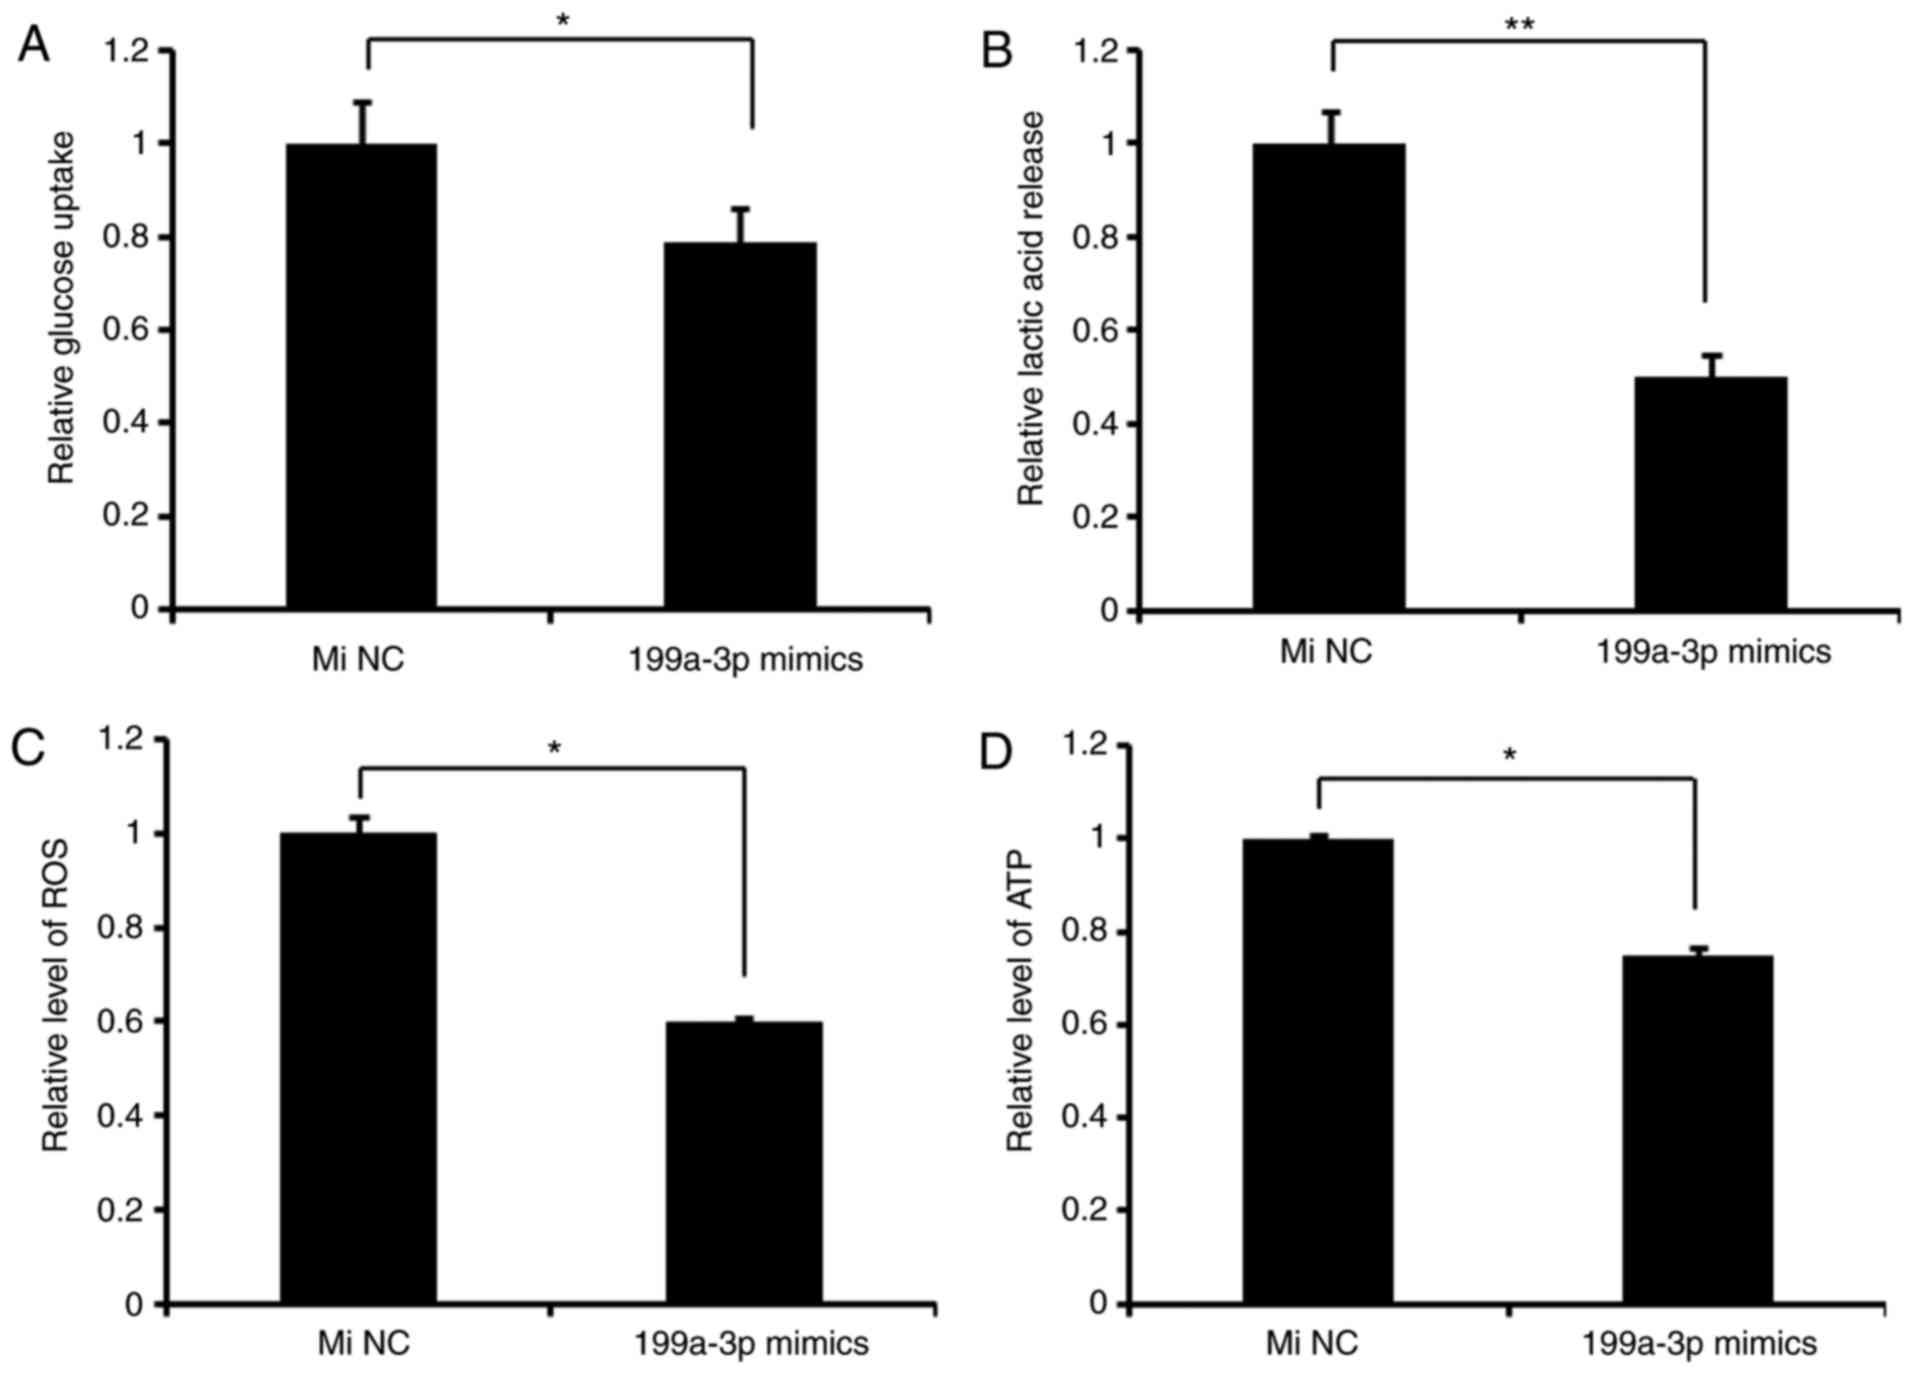
miR-199a-3p inhibits glycolysis in
Ntera-2 cells
To determine the effect of miR-199a-3p on glucose
metabolism in vitro, miR-199a-3p mimics or miNC were
transfected in Ntera-2 cells, and the results indicated that
compared with miNC groups, miR-199a-3p decreased the rates of
lactic acid production and glucose intake, and ROS and ATP levels,
indicating that miR-199a-3p inhibits glycolysis in Ntera-2 cells
(Fig. 1).
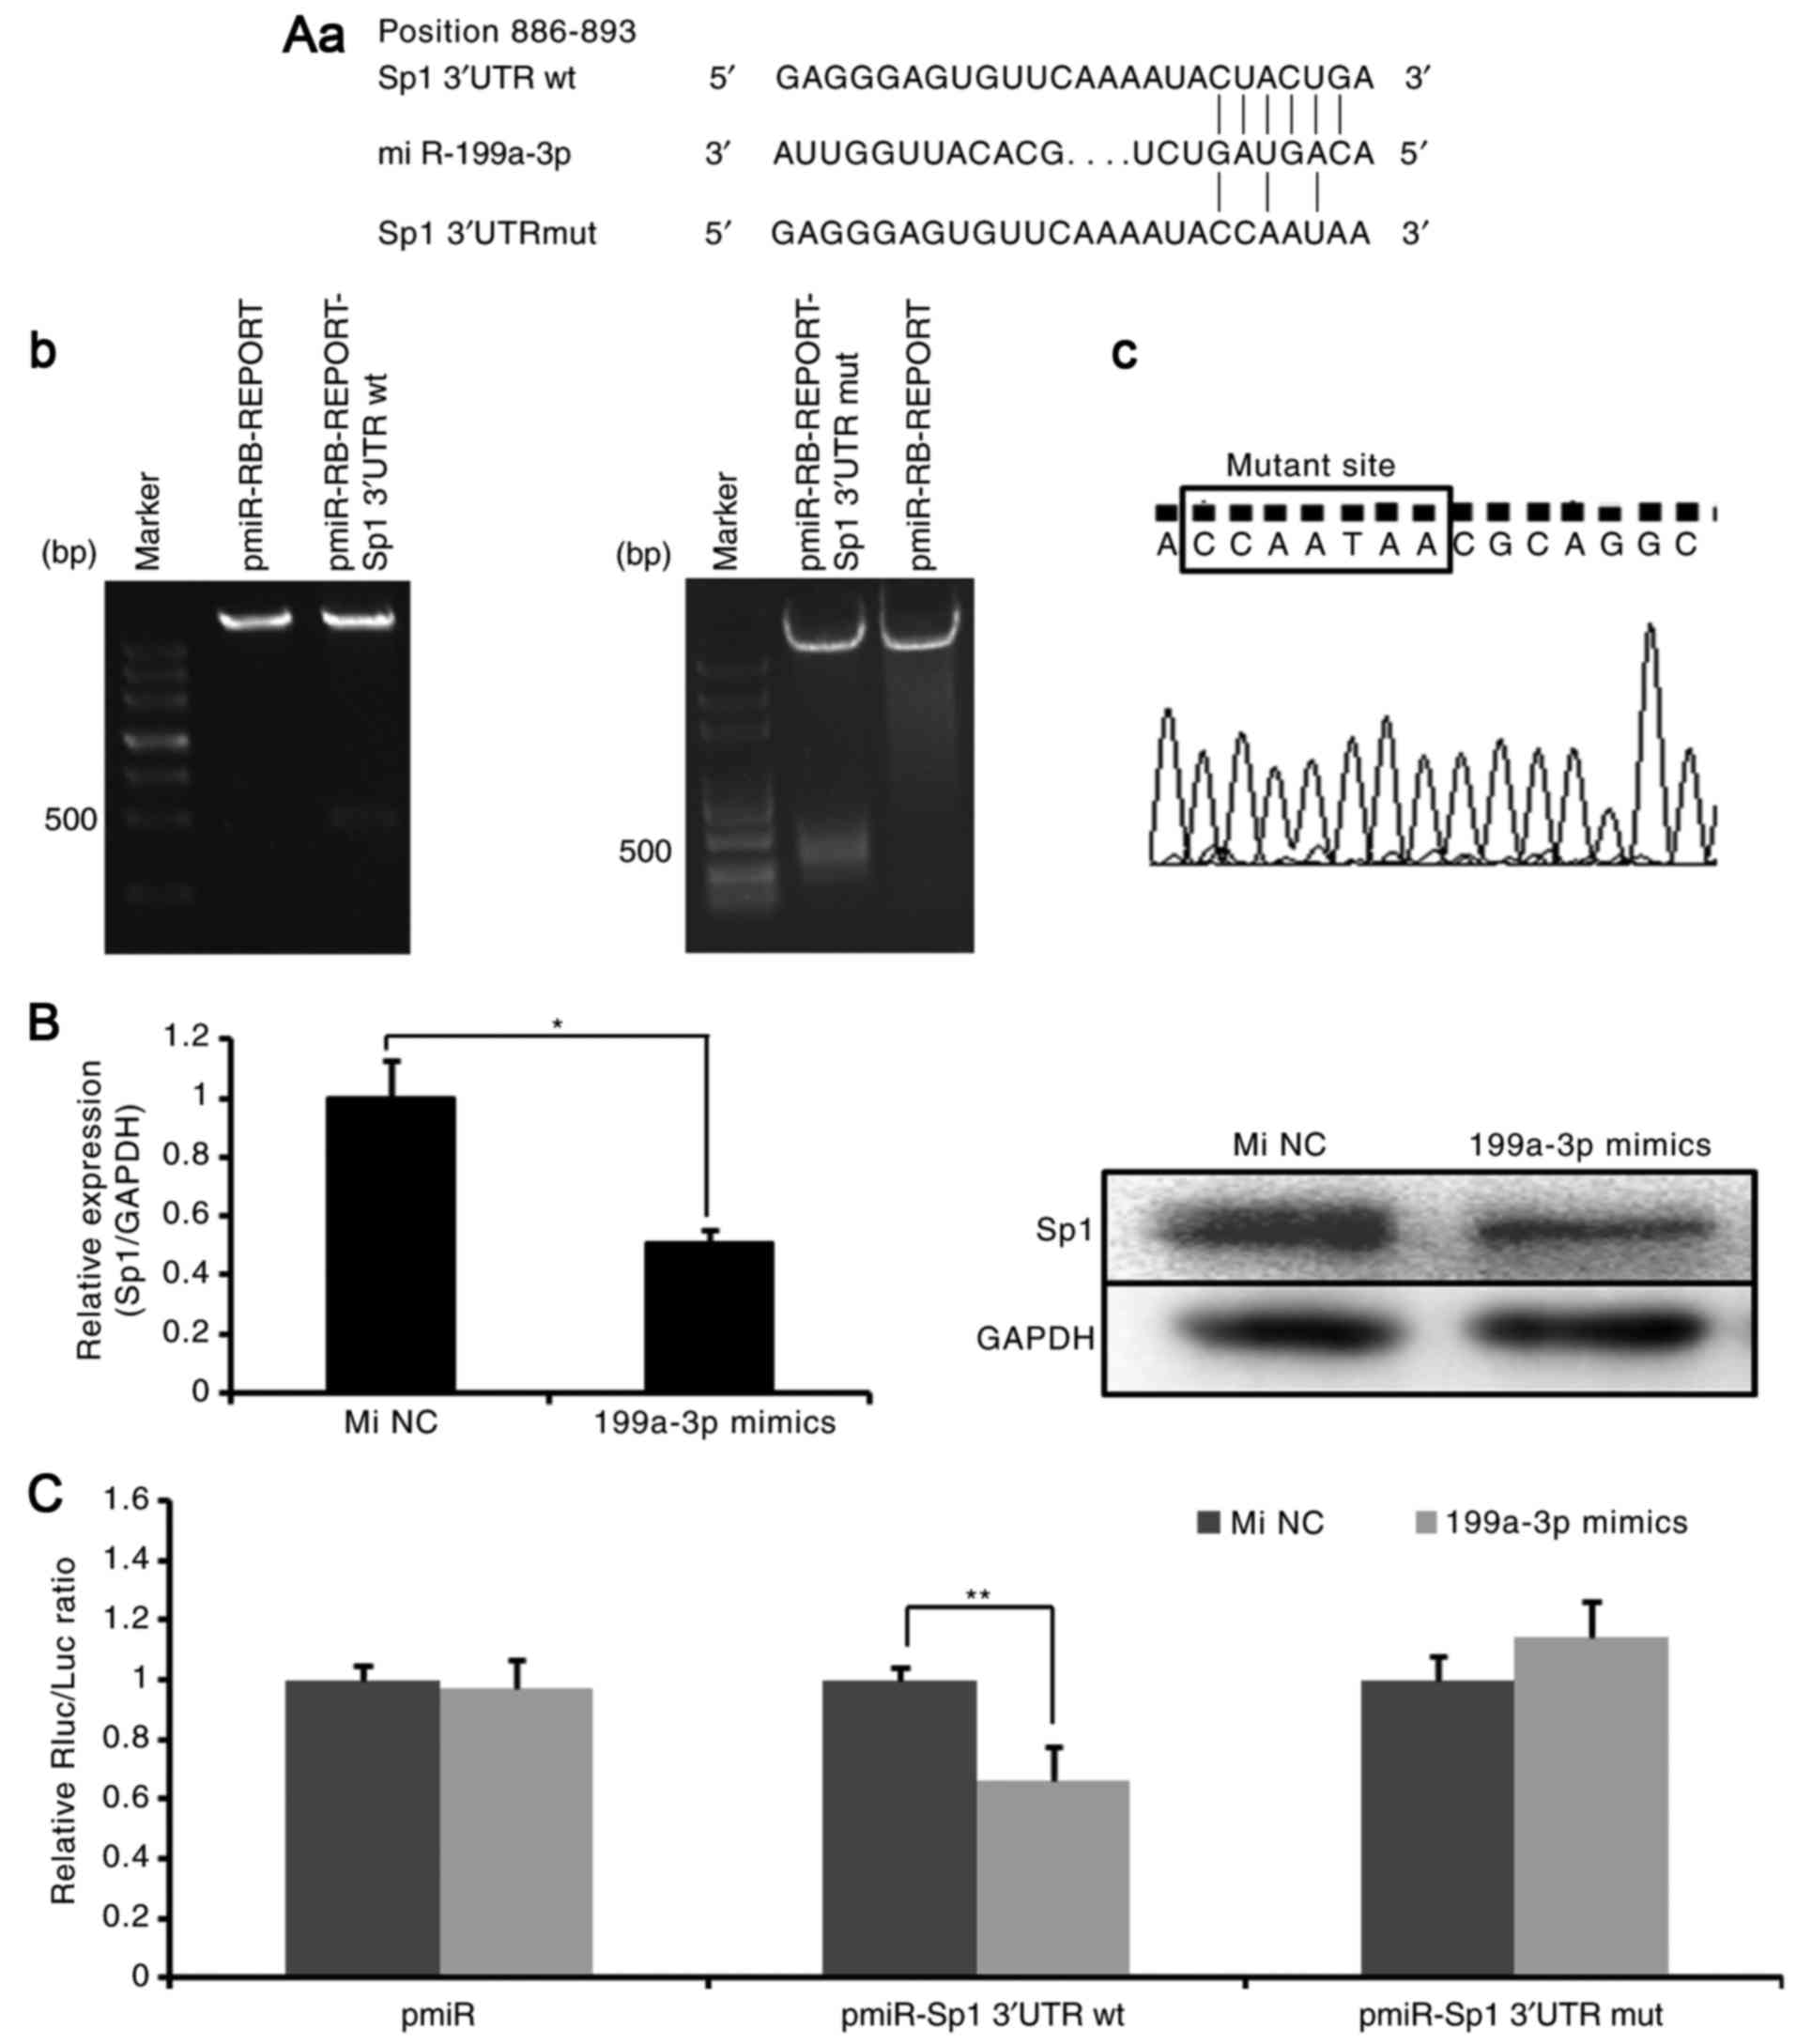
Sp1 is a target of miR-199a-3p
TargetScan predicted that miR-199a-3p binds to the
target sequences (location 886-893) in the 3′UTR of Sp1 mRNA
(Fig. 2A-a) (18). To confirm the reliability of the
putative recognition site of miR-199a-3p, the expression of Sp1 in
Ntera-2 cells treated with miR-199a-3p mimics was first detected.
As demonstrated in Fig. 2B,
miR-199a-3p markedly suppressed the expression of Sp1 at mRNA and
protein levels. Then, wild-type recombinant (pmiR-RB-REPORT
Sp1-3′UTRwt) and point mutation recombinant (pmiR-RB-REPORT
Sp1-3′UTRmut) plasmids were generated. The recombinant plasmids
were confirmed by double-enzyme digestion (Fig. 2A-b) and sequencing (Fig. 2A-c). Next, the plasmids were
transfected into Ntera-2 cells combined with miR-199a-3p mimics or
miRNA NC mimics. As indicated in Fig.
2C, in the Sp1-3′UTRwt group, the dual luciferase reporter
system demonstrated a significant decrease in relative luciferase
activity following miR-199a-3p mimics transfection compared with
miRNA NC mimics transfection. However, in the Sp1-3′UTRmut group,
no difference between miR-199a-3p mimics treatment and miRNA NC
mimics treatment was identified. These observations indicated that
miR-199a-3p may directly target the 3′UTR of Sp1 mRNA and decrease
Sp1 expression.
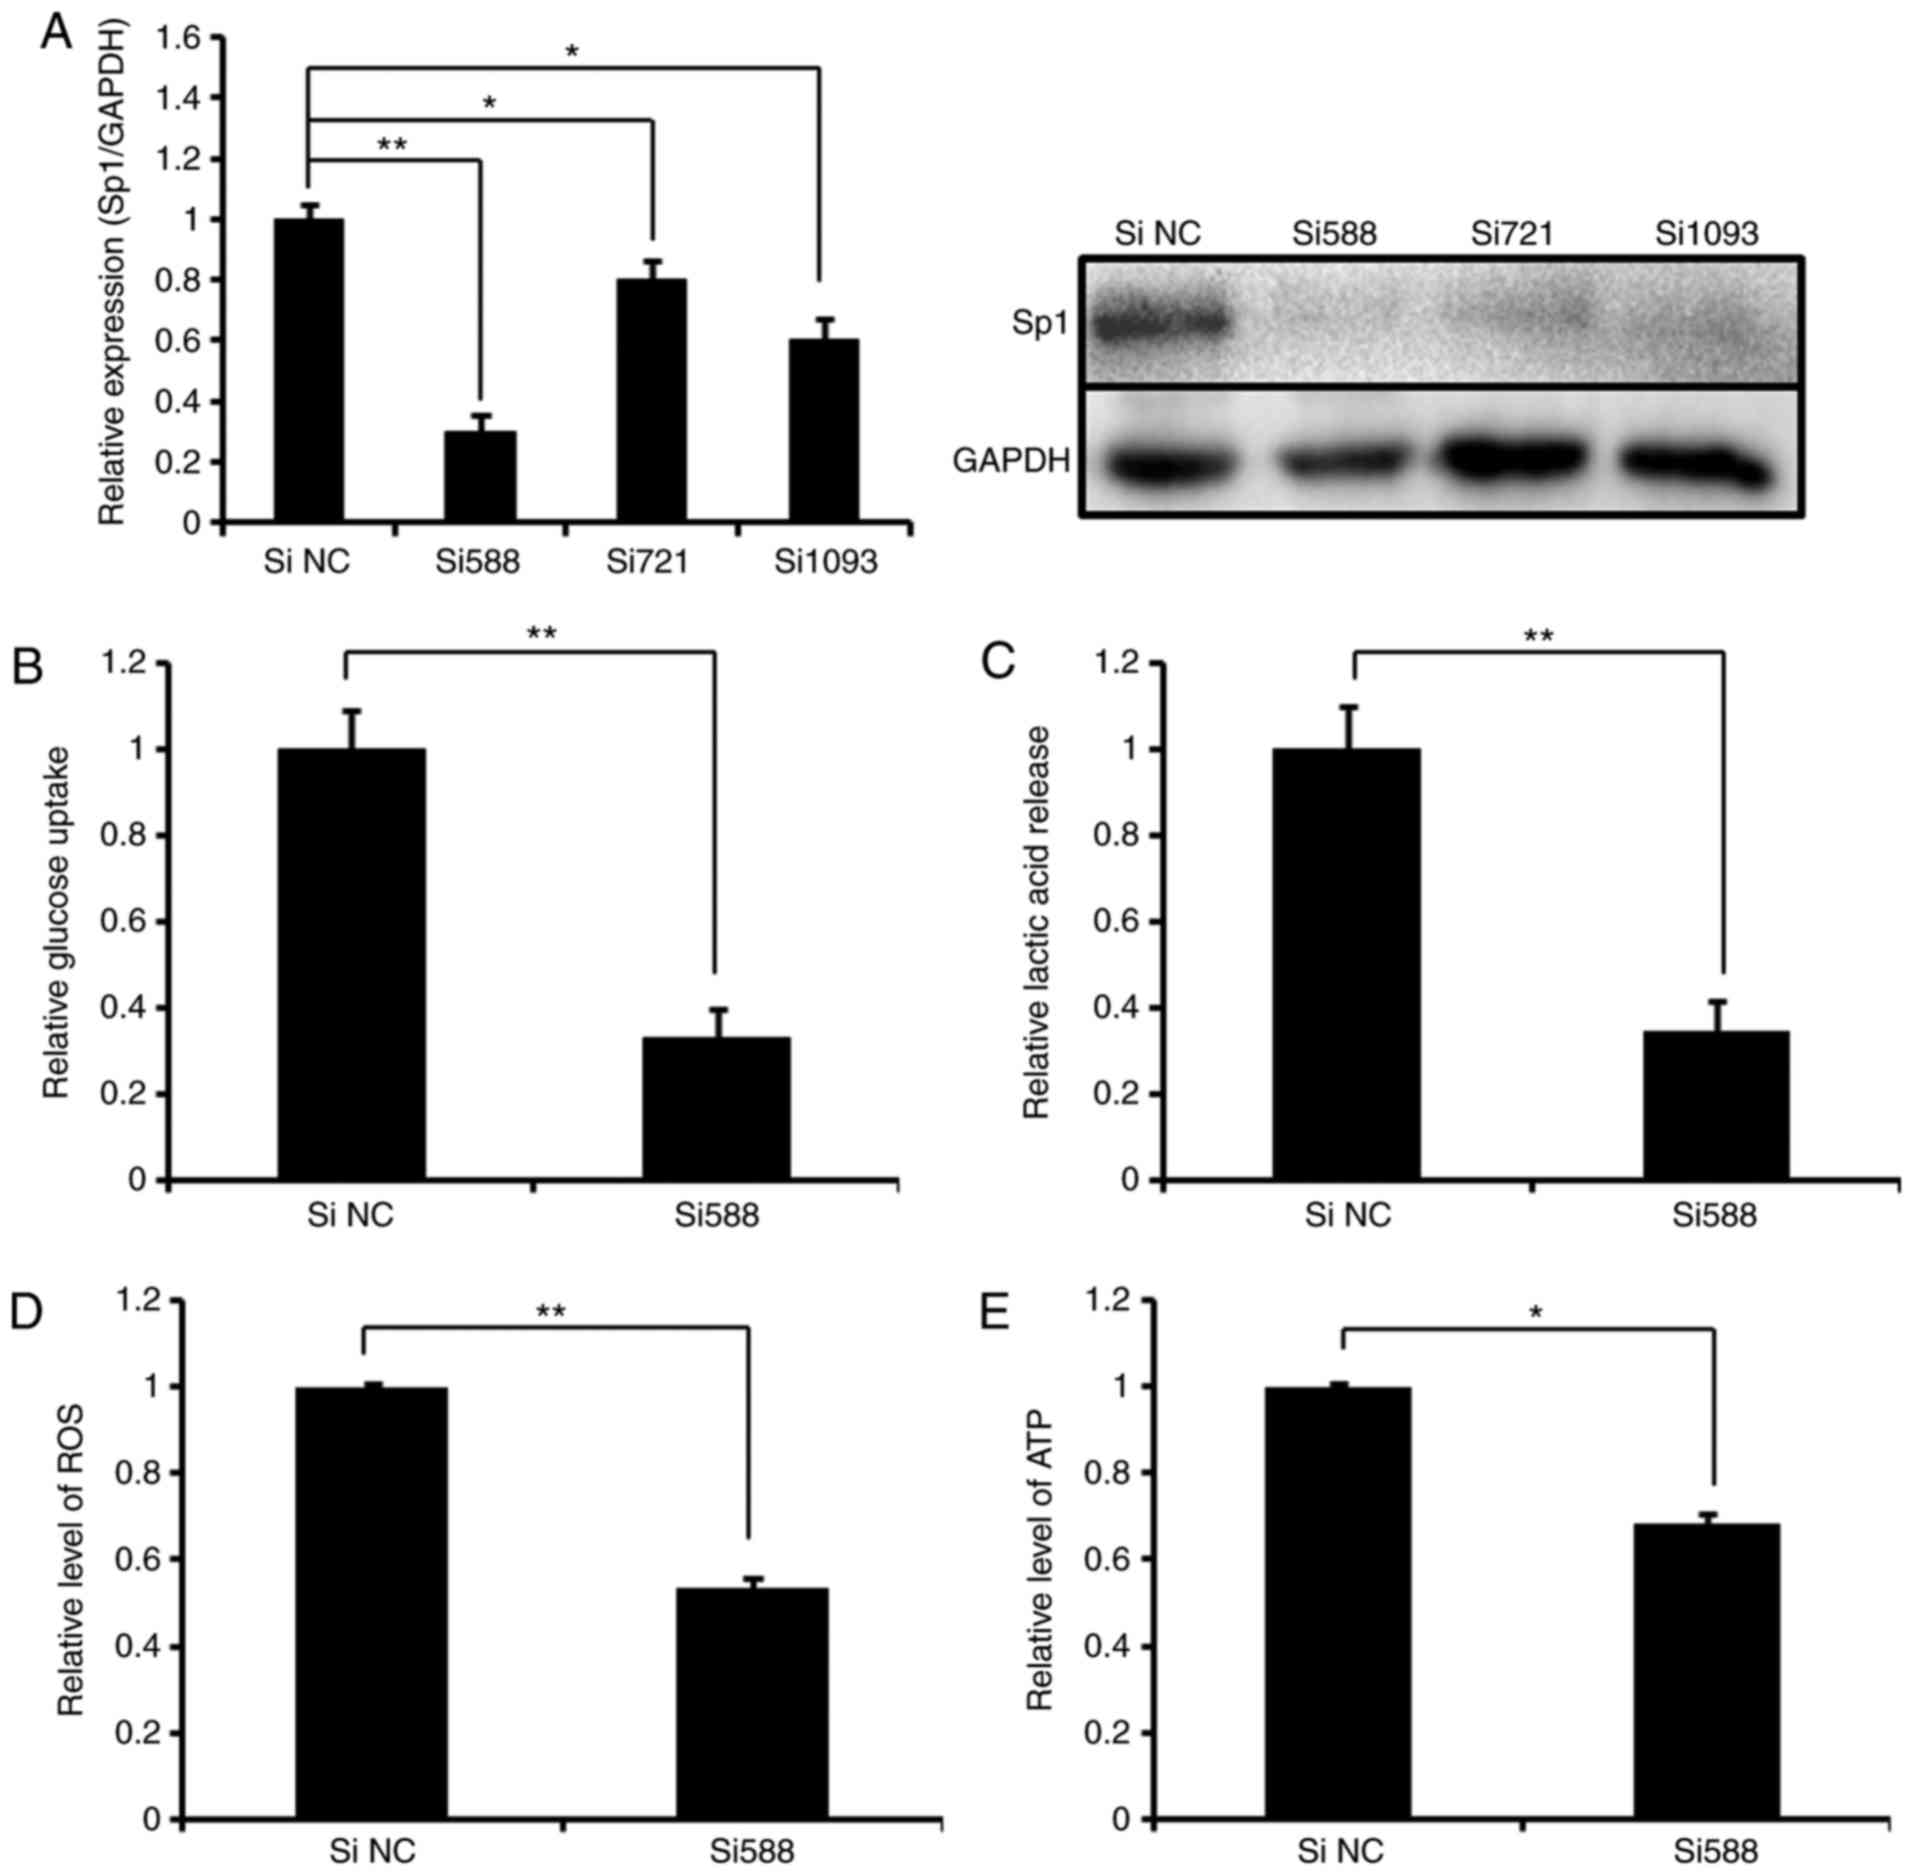
RNAi-mediated silence of Sp1 phenocopies
the effect of miR-199a-3p on glucose metabolism in Ntera-2
cells
To understand the functional association of Sp1 and
miR-199a-3p in the regulation of glucose metabolism, knockdown of
Sp1 by RNAi was performed to detect the effect on glycolysis in
Ntera-2 cells. As indicated in Fig.
3A, high endogenous Sp1 expression was silenced by all 3 siRNA
oligonucleotides, and Si588 was selected for subsequent analyses.
It was identified that the knockdown of Sp1 by Si588 markedly
decreased glucose uptake, lactic acid production, and ROS and ATP
levels in Ntera-2 cells (Fig.
3B–E), which were similar with the data obtained from the cells
treated with miR-199a-3p mimics (Fig.
1). The results suggest that in the process of Ntera-2
metabolism, Sp1 and miR-199a-3p have a reciprocal functional
association, indicating that RNAi-mediated silence of Sp1
phenocopies the effect of miR-199a-3p on glycolysis.
Overexpression of Sp1 rescues the effects
of miR-199a-3p on glucose metabolism in Ntera-2 cells
A pcDNA3.1-Sp1 plasmid, which lacked the Sp1 3′UTR,
was constructed to induce ectopic expression of Sp1. Then, four
co-transfection groups (miRNA NC mimics+pcDNA3.1, miRNA NC
mimics+pcDNA3.1-Sp1, miR-199a-3p mimics+pcDNA3.1 and miR-199a-3p
mimics+pcDNA3.1-Sp1) were used to detect and confirm whether
miR-199a-3p exerts its effects on glycolysis by targeting Sp1. As
demonstrated in Fig. 4, with the
exception of ATP level, pcDNA3.1-Sp1 was able to abate the
inhibition of miR-199a-3p on glucose consumption, lactate
production and ROS level in cultured cells. These results suggested
that the restoration of Sp1 may, to a large extent, rescue the
effects of miR-199a-3p on the metabolic phenotypes of Ntera-2
cells.
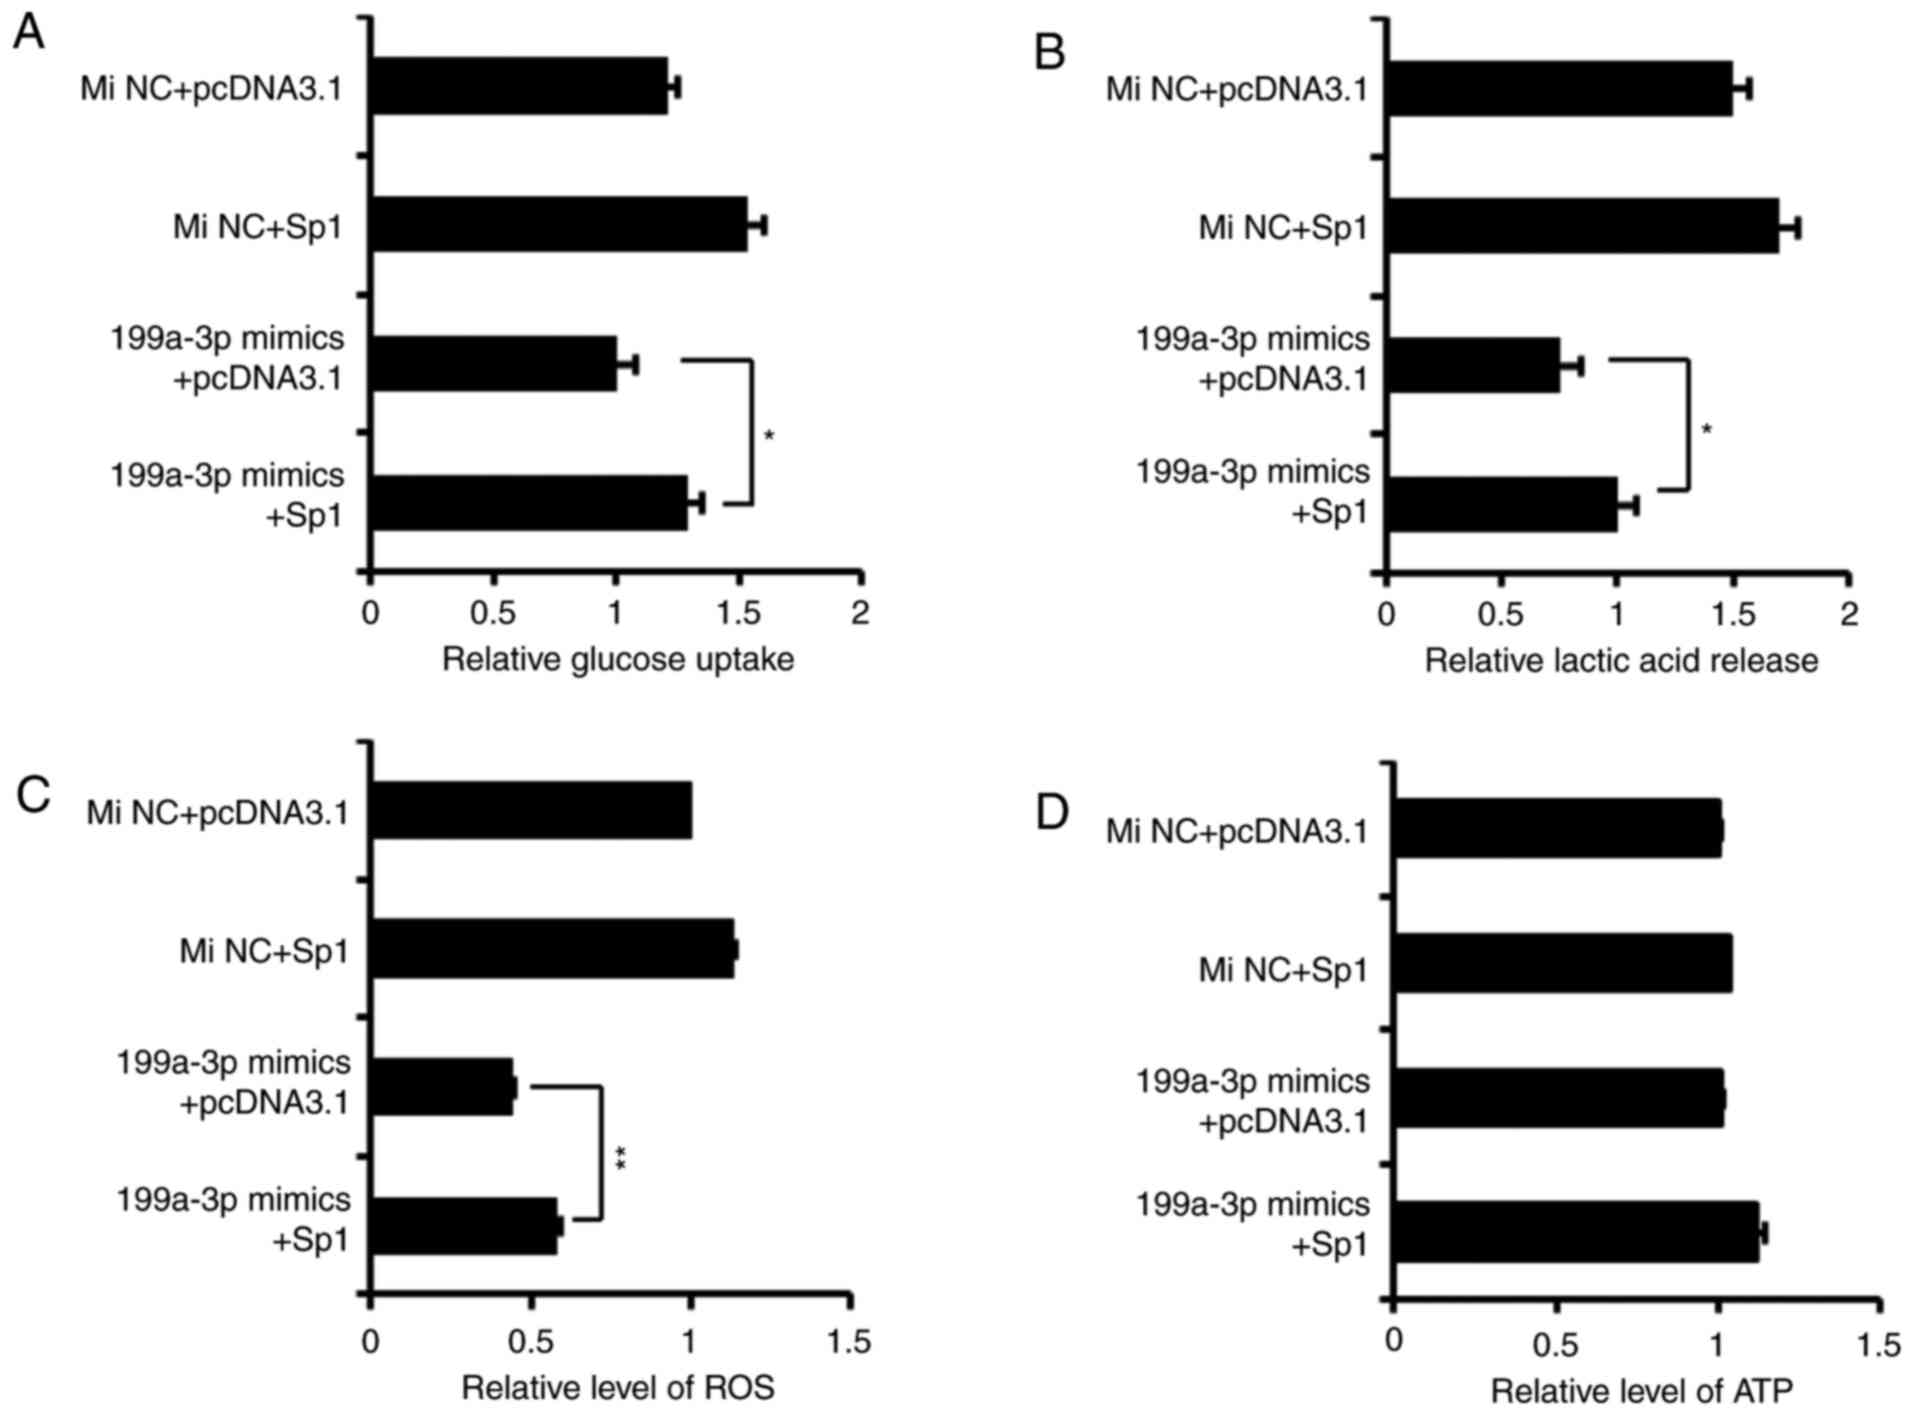 | Figure 4Overexpression of Sp1 rescues the
effects of miR-199a-3p on glucose metabolism in Ntera-2 cells. The
(A) uptake of glucose, (B) production of lactate, (C) ROS level and
(D) ATP level were detected in Ntera-2 cells which were
respectively treated by four different groups (MiNC+pcDNA3.1,
MiNC+pcDNA3.1-Sp1, miR-199a-3p mimics+pcDNA3.1, miR-199a-3p
mimics+pcDNA3.1-Sp1). *P≤0.05 and **P≤0.01
vs. pcDNA3.1 group. miRNA, microRNA; MiNC, miRNA negative control
mimics; Sp1, specificity protein 1; ROS, reactive oxygen species;
ATP, adenosine 5′-triphosphate. |
LDHA is identified as the downstream
target of miR-199a-3p/Sp1 signaling pathway in controlling aerobic
glycolysis
In order to determine how miR-199a-3p/Sp1 affected
glucose metabolism, using data from our previous study (13), the expression levels of LDHA,
MCT1, PGK1 and TIGAR in Ntera-2 cells following transfection of Sp1
siRNA or miR-199a-3p mimics were detected. The results indicated
that the mRNA level of LDHA and MCT1 were significantly decreased
following Sp1 knockdown or miR-199a-3p treatment, whereas PGK1
expression was downregulated only by Sp1 si588 and there was no
significant difference in the expression of TIGAR (Fig. 5A). At the protein level, the
results of western blot analysis confirmed the suppression of LDHA,
MCT1 and PGK1, but not TIGAR, by miR-199a-3p mimics (Fig. 5B). Concurrently, only LDHA and
PGK1 expression were visibly downregulated following Sp1 si588
transfection. These data indicated that either the overexpression
of miR-199a-3p or knockdown of Sp1 may decrease LDHA protein level,
and that the suppression of LDHA was the most marked among the 4
genes. Therefore, we hypothesized that LDHA was the most important
downstream target of miR-199a-3p/Sp1.
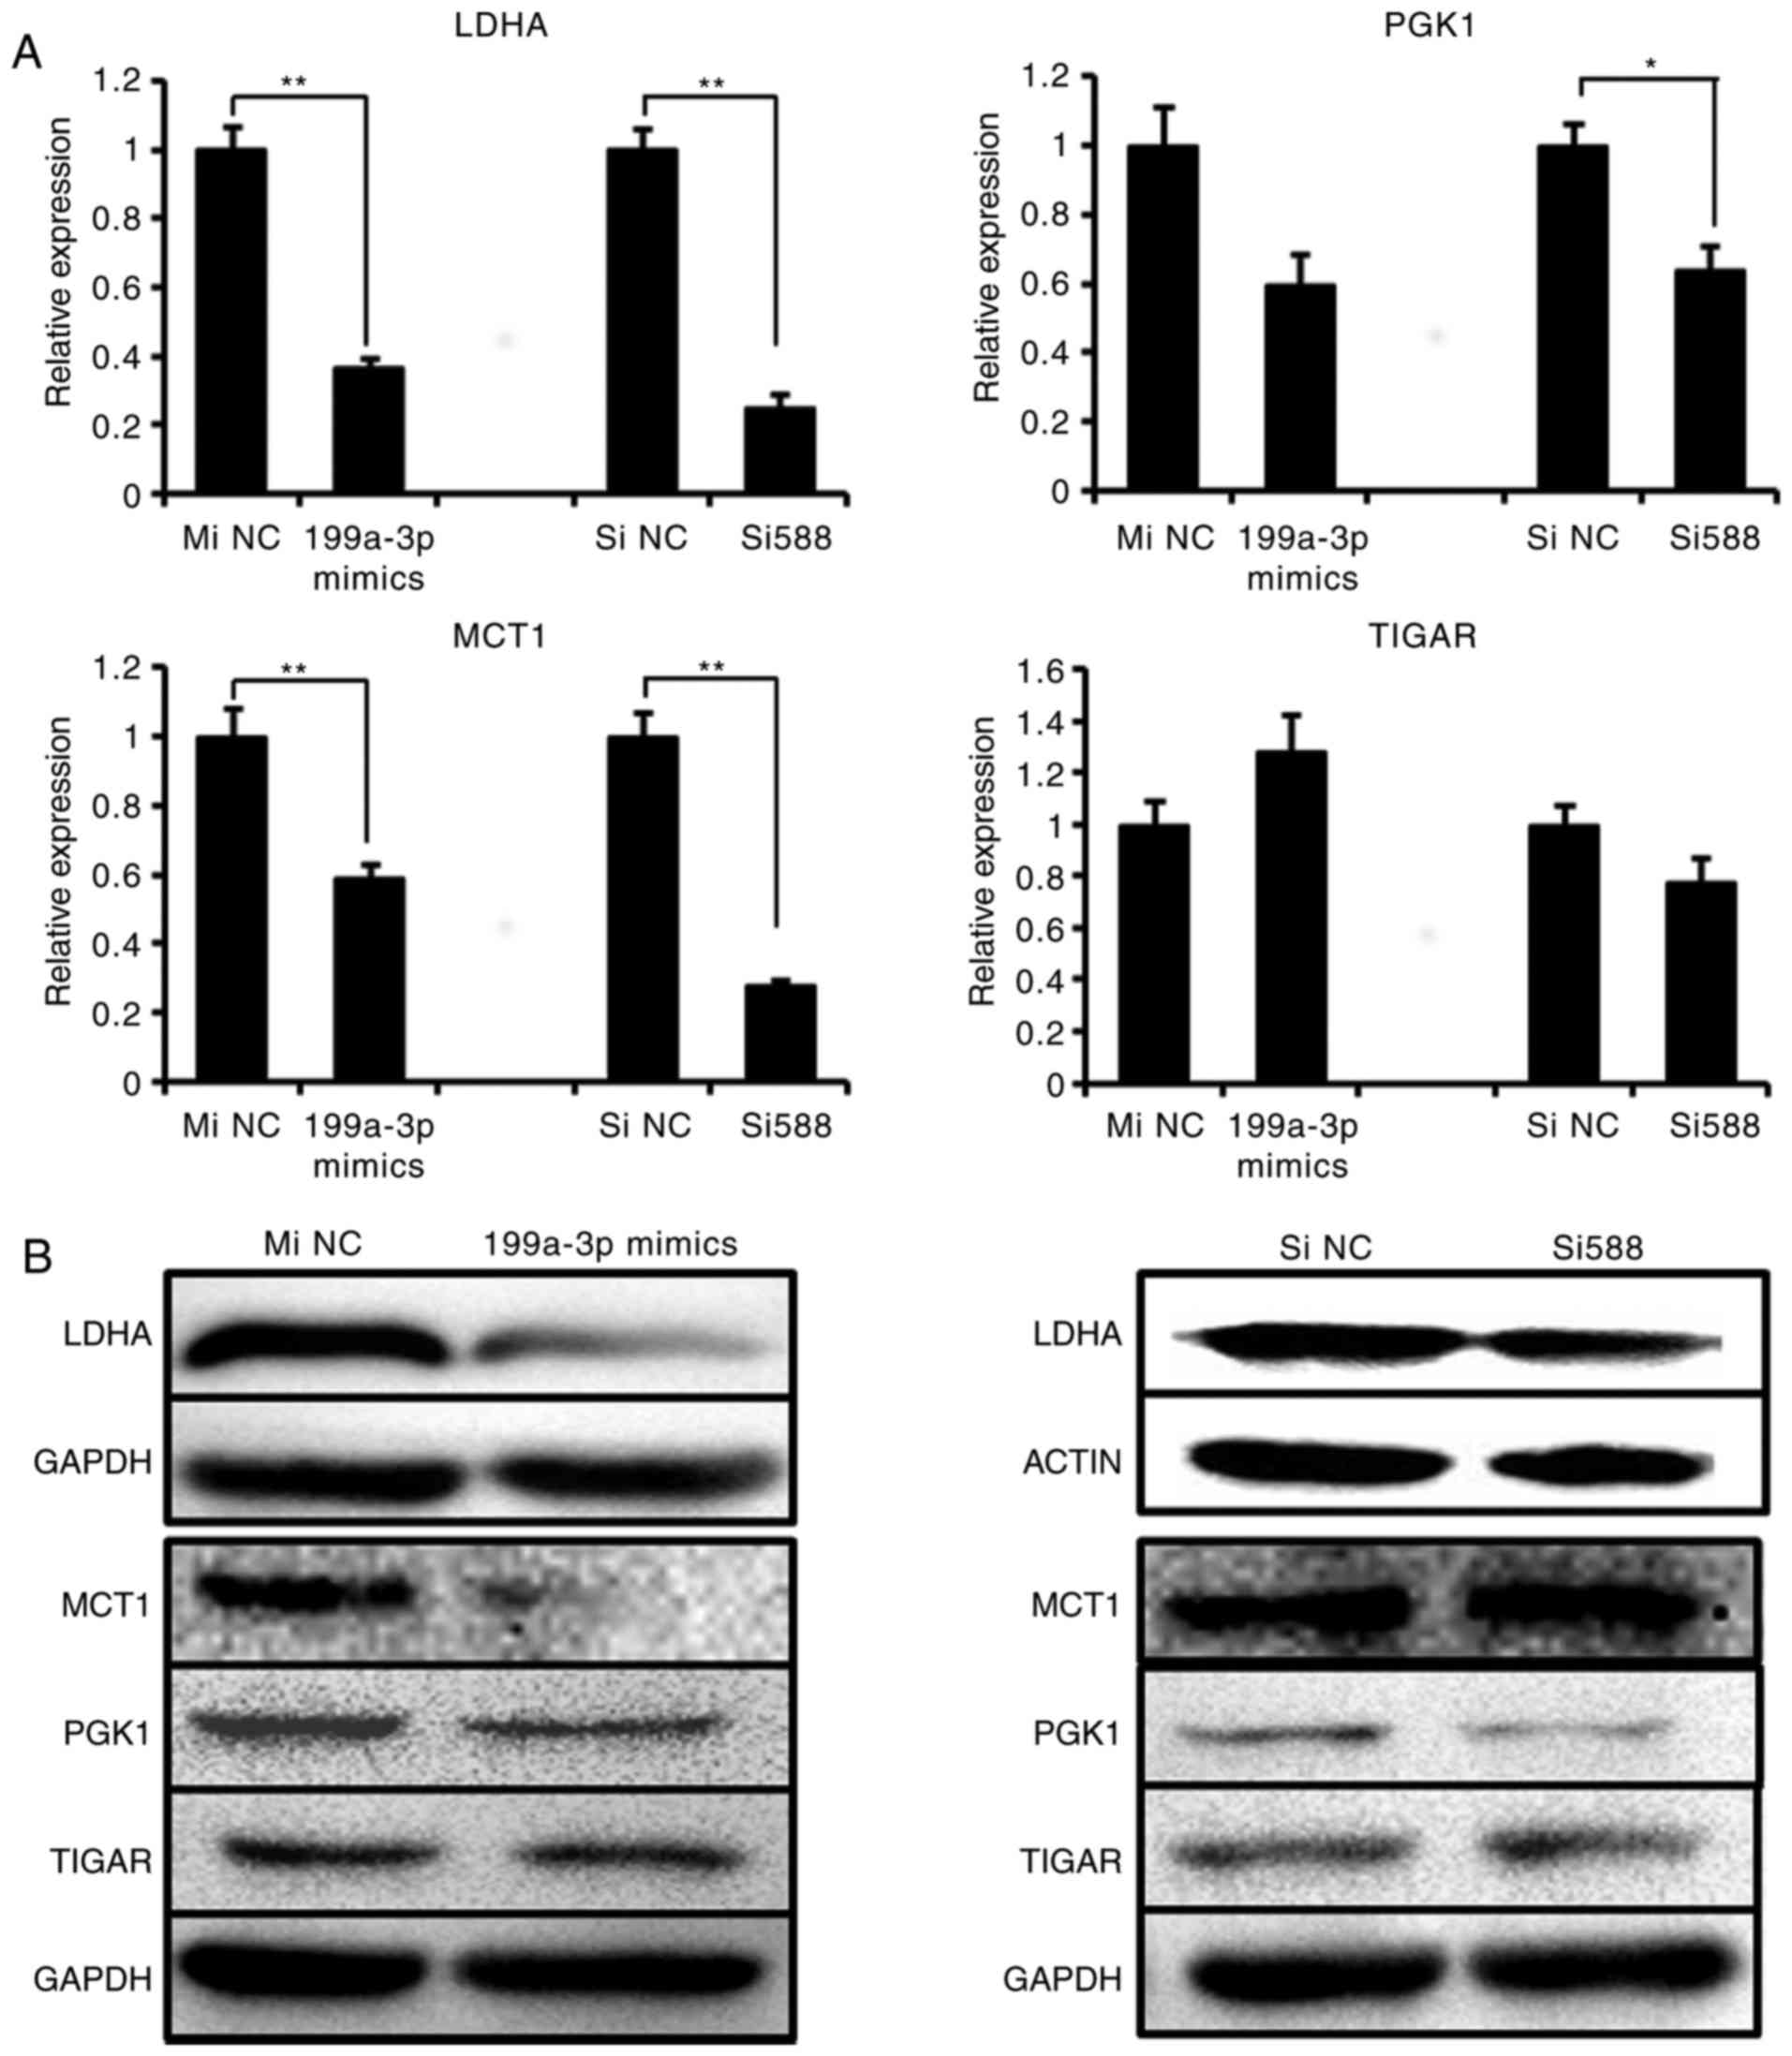 | Figure 5Sp1 Si588 and miR-199a-3p suppress
the LDHA expression. (A) The mRNA expression and (B) protein
expression of 4 metabolic genes (LDHA, PGK1, MCT1 and TIGAR) were
detected in Ntera-2 cells following treatment with miR-199a-3p
mimics or Sp1 Si588, respectively. *P≤0.05 and
**P≤0.01 vs. NC group. miRNA, microRNA; MiNC, miRNA
negative control mimics; SiNC, siRNA negative control; Sp1,
specificity protein 1; siRNA, small interfering RNA; LDHA, lactate
dehydrogenase A; TIGAR, tumor protein 53 induced glycolysis
regulatory phosphatase; PGK1, phosphoglycerate kinase 1; MCT1,
solute carrier family 16 member 1. |
To additionally verify the regulation of LDHA
expression by miR-199a-3p/Sp1, a LDHA promoter reporter plasmid
(pLDHA 1257) that included 3 potential Sp1 binding sites was
generated (Fig. 6A) and
characterized by sequencing analysis (data not shown) and enzyme
digestion (Fig. 6B). Compared
with the pGL3-basic plasmid, the activation of luciferase activity
driven by pLDHA1257 was significantly increased in Ntera-2 cells
(Fig. 6C), indicating the
presence of promoter activity. Additionally, co-transfection of
Ntera-2 cells with pLDHA and pcDNA3.1-Sp1 markedly increased the
LDHA promoter activity (Fig. 6D),
whereas knockdown of Sp1 expression with Si588 decreased this
activity in the cells (Fig. 6E).
These data suggested that the Sp1 binding sites, as positive
regulatory elements in the LDHA promoter, were involved in
upregulating LDHA gene transcription of Ntera-2 cells.
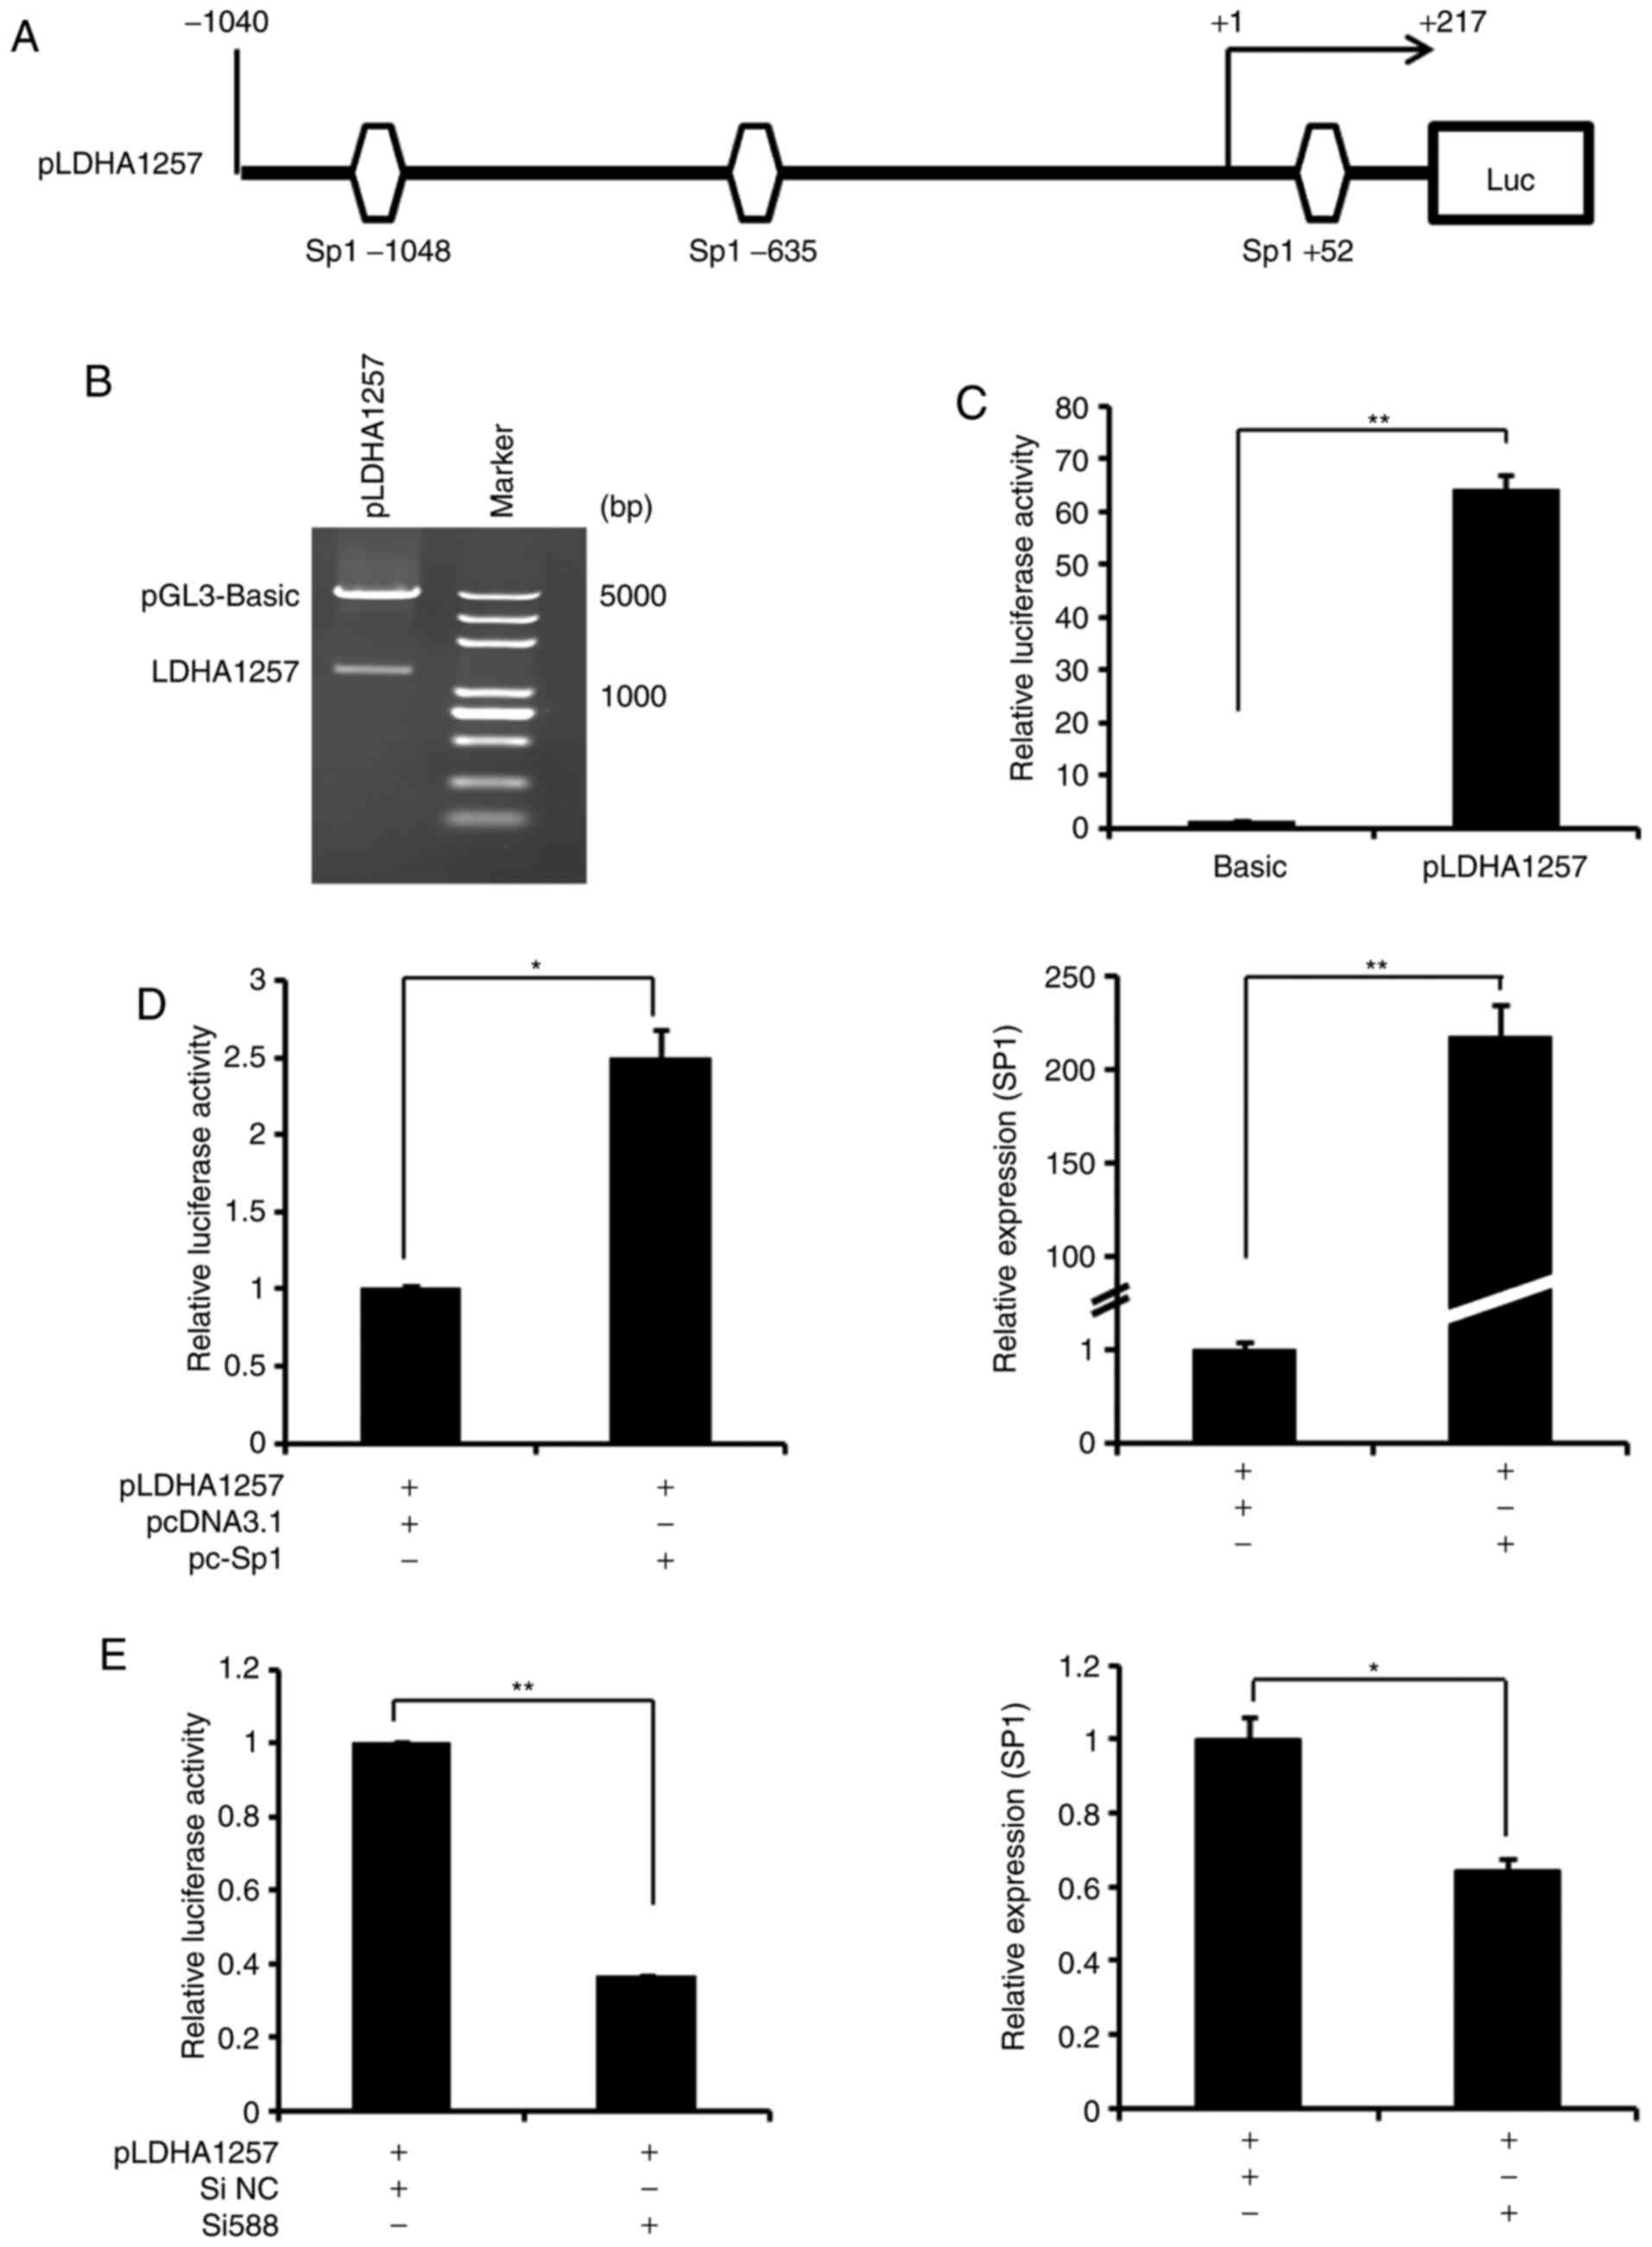 | Figure 6Transcriptional action of LDHA
expression by Sp1 in Ntera-2 cells. (A) A schematic representation
of the LDHA promoter, which contains 3 potential Sp1 binding sites.
(B) Enzyme digestion analysis of the recombinant LDHA promoter
(pLDHA1257). (C) Analysis of transcriptional activity of pLDHA1257
promoter in Ntera-2 cells using a reporter system.
**P≤0.01 vs. pGL3-basic group. (D) Analysis of
transcriptional activity of pLDHA1257 promoter in Ntera-2 cells
following with pcDNA3.1-Sp1 overexpression using a reporter system
(left). Concurrently, Sp1 mRNA expression was detected following
transfection (right). (E) Analysis of transcriptional activity of
pLDHA1257 promoter in Ntera-2 cells following transfection with Sp1
siRNA (Si588) using a reporter system (left). Concurrently, Sp1
mRNA expression was detected subsequent to transfection (right). In
each reporter system experiment, Renilla was used as an
internal control. *P≤0.05 and **P≤0.01 vs.
control group. pc-Sp1, pcDNA3.1-Sp1. Sp1, specificity protein 1;
LDHA, lactate dehydrogenase A; Luc, luciferase; si, small
interfering; NC, negative control. |
Discussion
Testicular cancer is a relatively rare tumor type,
accounting for ~1% of all types of cancer in men (19). However, testicular cancer is the
most commonly diagnosed malignancy for young males aged 15–40 years
(20). Furthermore, ~95% of all
malignant tumors of the testis are germ cell tumors (TGCTs)
(21). TGCTs are classified as
seminoma or non-seminoma, according to their origin, clinical
behavior and chromosomal constitution (21). Non-seminoma tumors include several
subtypes of cancers, including embryonal cell carcinoma,
choriocarcinoma, yolk sac tumors and teratoma (teratocarcinoma)
(22–24). The Ntera-2 cell line examined in
the present study was derived from non-seminomatous tumors. For the
clinical management of TGCTs, lactate dehydrogenase (LDH) has been
regarded as one of critical serum tumor markers, suggesting the
existence of aerobic glycolysis and metabolic reprogramming in
TGCTs.
The high glycolytic flux in tumor cells is induced
by a number of enzymes including LDH, glucose transporter types
1/3, hexokinases and pyruvate kinase type M (25,26). LDHA, which catalyzes the final
step of glycolysis, is a major subunit of LDH and abnormally
upregulated in cancer (27).
Experimental knockdown or downregulation of LDHA in diverse
malignant cell types has been demonstrated to decrease glycolytic
activity and attenuate lactate, thereby controlling cell
proliferation, migration and invasion (28,29). In addition, a number of studies
have suggested that LDHA mRNA may be degraded at an epigenetic
regulation level by miRNAs: miR-34a, -34c, -369-3p, -374a and
-4524a/b (30,31). In testicular tumor cells, certain
miRNAs, including miR-372, -373, -449, -383 and -199a have been
identified to be dysregulated and indicated to contribute to the
development of TGCTs (22). In
the present study, miR-199a-3p as a suppressor in TGCTs, was
demonstrated to repress LDHA expression and glucose metabolism by
inhibiting lactic acid production, glucose intake, and ROS and ATP
levels. As LDHA lacks the recognition site for miR-199a-3p, future
studies will aim to identify the bridge molecule in this metabolic
pathway.
Sp1 was the focus of the present study as it is
bound directly to the promoter regions of not only the LDHA gene,
but also the TIGAR, PGK1 and MCT1 genes (32). Among these 4 selected metabolic
genes from our previous study (13), Sp1 demonstrated the most marked
effect on LDHA gene transcription and translation, suggesting that
LDHA is the key component of miR-199a-3p/Sp1 pathway in glycolytic
metabolism of Ntera-2 cells. Using a dual luciferase reporter
system, the present study identified that the overexpression of Sp1
led to increased activity of the LDHA promoter, whereas knockdown
of Sp1 had the opposite effect, which verified the positive
regulation of Sp1 on LDHA transcription. On the other hand, it was
also confirmed that miR-199a-3p directly targets the 3′-UTR of Sp1
mRNA. Sp1 is one of the most well characterized transcription
factor that serves an important role in controlling the
transcription of numerous genes that contain GC boxes (consensus
sequence: 5′-(G/T) GGGCGG (G/A) (G/A) (C/T)-3′) in their promoters,
particularly of those genes associated with the metabolism of
nucleic acids and biosynthesis (33). Abnormal activation of Sp1 occurs
in a wide variety of human tumor types and high levels of Sp1
protein are considered to be a negative prognostic factor (34–36). The data of the present study
suggested that the silencing of Sp1 by RNAi may decrease aerobic
glycolysis in testicular cancer cells. More importantly, in
miR-199a-3p mimics-treated cells, the restoration of Sp1 expression
markedly promoted glucose intake, lactate concentrations and ROS
levels, implying that the overexpression of Sp1 rescues the effects
of miR-199a-3p on glucose metabolism in Ntera-2 cells. Therefore,
the data supported the hypothesis that Sp1 may serve as bridge
molecule between miR-199a-3p and LDHA to regulate abnormal
metabolism of testicular cancer cells.
In conclusion, the present study demonstrated that
miR-199a-3p downregulated LDHA and consequently inhibited the
Warburg effect through targeting Sp1, and suggested that the
miR-199a-3p/Sp1/LDHA metabolic pathway is an underlying pathway in
the pathogenesis of TGCTs.
Acknowledgments
Not applicable.
Funding
The present study was supported by the National
Natural Science Foundation of China (grant no. 81571494).
Availability of data and materials
The datasets used during the present study are
available from the corresponding author upon reasonable
request.
Authors’ contributions
DL designed the research and wrote the manuscript.
SZ and ZM performed the research and wrote the manuscript. KS, SQ,
JZ, HD, HL, XL and ZG performed the research. All authors analyzed
the data and were involved in writing the manuscript. All authors
read and approved the manuscript.
Ethics approval and consent to
participate
Not applicable.
Patient consent for publication
Not applicable.
Competing interests
The authors declare that they have no competing
interests.
References
|
1
|
Pavlova NN and Thompson CB: The emerging
hallmarks of cancer metabolism. Cell Metab. 23:27–47. 2016.
View Article : Google Scholar : PubMed/NCBI
|
|
2
|
Lu J, Tan M and Cai Q: The Warburg effect
in tumor progression: Mitochondrial oxidative metabolism as an
anti-metastasis mechanism. Cancer Lett. 356:156–164. 2015.
View Article : Google Scholar
|
|
3
|
Han T, Kang D, Ji D, Wang X, Zhan W, Fu M,
Xin HB and Wang JB: How does cancer cell metabolism affect tumor
migration and invasion? Cell Adh Migr. 7:395–403. 2013. View Article : Google Scholar : PubMed/NCBI
|
|
4
|
Bartel DP: MicroRNAs: Genomics,
biogenesis, mechanism, and function. Cell. 116:281–297. 2004.
View Article : Google Scholar : PubMed/NCBI
|
|
5
|
Lin HM, Nikolic I, Yang J, Castillo L,
Deng N, Chan CL, Yeung NK, Dodson E, Elsworth B, Spielman C, et al:
MicroRNAs as potential therapeutics to enhance chemosensitivity in
advanced prostate cancer. Sci Rep. 8:78202018. View Article : Google Scholar : PubMed/NCBI
|
|
6
|
Sakurai K, Furukawa C, Haraguchi T, Inada
K, Shiogama K, Tagawa T, Fujita S, Ueno Y, Ogata A, Ito M, et al:
Micrornas miR-199a-5p and -3p target the brm subunit of swi/snf to
generate a double-negative feedback loop in a variety of human
cancers. Cancer Res. 71:1680–1689. 2011. View Article : Google Scholar
|
|
7
|
Gu S and Chan WY: Flexible and versatile
as a chameleon-sophisticated functions of microRNA-199a. Int J Mol
Sci. 13:8449–8466. 2012. View Article : Google Scholar : PubMed/NCBI
|
|
8
|
Hou J, Lin L, Zhou W, Wang Z, Ding G, Dong
Q, Qin L, Wu X, Zheng Y, Yang Y, et al: Identification of miRNomes
in human liver and hepatocellular carcinoma reveals miR-199a/b-3p
as therapeutic target for hepatocellular carcinoma. Cancer Cell.
19:232–243. 2011. View Article : Google Scholar : PubMed/NCBI
|
|
9
|
Tsukigi M, Bilim V, Yuuki K, Ugolkov A,
Naito S, Nagaoka A, Kato T, Motoyama T and Tomita Y: Re-expression
of miR-199a suppresses renal cancer cell proliferation and survival
by targeting GSK-3b. Cancer Lett. 315:189–197. 2012. View Article : Google Scholar
|
|
10
|
Minna E, Romeo P, De Cecco L, Dugo M,
Cassinelli G, Pilotti S, Degl’Innocenti D, Lanzi C, Casalini P,
Pierotti MA, et al: miR-199a-3p displays tumor suppressor functions
in papillary thyroid carcinoma. Oncotarget. 5:2513–2528. 2014.
View Article : Google Scholar : PubMed/NCBI
|
|
11
|
Qu F, Zheng J, Gan W, Lian H, He H, Li W,
Yuan T, Yang Y, Li X, Ji C, et al: MiR-199a-3p suppresses
proliferation and invasion of prostate cancer cells by targeting
Smad1. Oncotarget. 8:52465–52473. 2017. View Article : Google Scholar : PubMed/NCBI
|
|
12
|
Zeng B, Shi W and Tan G: MiR-199a/b-3p
inhibits gastric cancer cell proliferation via down-regulating
PAK4/MEK/ERK signaling pathway. BMC Cancer. 18:342018. View Article : Google Scholar : PubMed/NCBI
|
|
13
|
Liu X, Duan H, Zhou S, Liu Z, Wu D, Zhao
T, Xu S, Yang L and Li D: microRNA-199a-3p functions as tumor
suppressor by regulating glucose metabolism in testicular germ cell
tumors. Mol Med Rep. 14:2311–2320. 2016. View Article : Google Scholar : PubMed/NCBI
|
|
14
|
Chen BF, Gu S, Suen YK, Li L and Chan WY:
microRNA-199a-3p, DNMT3A, and aberrant DNA methylation in
testicular cancer. Epigenetics. 9:119–128. 2014. View Article : Google Scholar :
|
|
15
|
Deng Y, Zhao F, Hui L, Li X, Zhang D, Lin
W, Chen Z and Ning Y: Suppressing miR-199a-3p by promoter
methylation contributes to tumor aggressiveness and cisplatin
resistance of ovarian cancer through promoting DDR1 expression. J
Ovarian Res. 10:502017. View Article : Google Scholar : PubMed/NCBI
|
|
16
|
Li Q, Xia X, Ji J, Ma J, Tao L, Mo L and
Chen W: MiR-199a-3p enhances cisplatin sensitivity of
cholangiocarcinoma cells by inhibiting mTOR signaling pathway and
expression of MDR1. Oncotarget. 8:33621–33630. 2017.PubMed/NCBI
|
|
17
|
Fan X, Zhou S, Zheng M, Deng X, Yi Y and
Huang T: MiR-199a-3p enhances breast cancer cell sensitivity to
cisplatin by downregulating TFAM (TFAM). Biomed Pharmacother.
88:507–514. 2017. View Article : Google Scholar : PubMed/NCBI
|
|
18
|
Agarwal V, Bell GW, Nam JW and Bartel DP:
Predicting effective microRNA target sites in mammalian mRNAs.
Elife. 4:2015. View Article : Google Scholar
|
|
19
|
Gori S, Porrozzi S, Roila F, Gatta G, De
Giorgi U and Marangolo M: Germ cell tumours of the testis. Crit Rev
Oncol Hematol. 53:141–164. 2005. View Article : Google Scholar : PubMed/NCBI
|
|
20
|
Winter C and Albers P: Testicular germ
cell tumors: Pathogenesis, diagnosis and treatment. Nat Rev
Endocrinol. 7:43–53. 2011. View Article : Google Scholar
|
|
21
|
von Eyben FE: Chromosomes, genes, and
development of testicular germ cell tumors. Cancer Genet Cytogenet.
151:93–138. 2004. View Article : Google Scholar : PubMed/NCBI
|
|
22
|
Bezan A, Gerger A and Pichler M: MicroRNAs
in testicular cancer: Implications for pathogenesis, diagnosis,
prognosis and therapy. Anticancer Res. 34:2709–2713.
2014.PubMed/NCBI
|
|
23
|
Chieffi P and Chieffi S: Molecular
biomarkers as potential targets for therapeutic strategies in human
testicular germ cell tumors: An overview. J Cell Physiol.
228:1641–1646. 2013. View Article : Google Scholar : PubMed/NCBI
|
|
24
|
Viatori M: Testicular cancer. Semio Oncol
Nurs. 28:180–189. 2012. View Article : Google Scholar
|
|
25
|
Ferreira LM, Hebrant A and Dumont JE:
Metabolic reprogramming of the tumor. Oncogene. 31:3999–4011. 2012.
View Article : Google Scholar : PubMed/NCBI
|
|
26
|
Porporato PE, Dhup S, Dadhich RK, Copetti
T and Sonveaux P: Anticancer targets in the glycolytic metabolism
of tumors: A comprehensive review. Front Pharmacol. 2:492011.
View Article : Google Scholar : PubMed/NCBI
|
|
27
|
Xiao X, Huang X, Ye F, Chen B, Song C, Wen
J, Zhang Z, Zheng G, Tang H and Xie X: The miR-34a-LDHA axis
regulates glucose metabolism and tumor growth in breast cancer. Sci
Rep. 6:217352016. View Article : Google Scholar : PubMed/NCBI
|
|
28
|
Rizwan A, Serganova I, Khanin R, Karabeber
H, Ni X, Thakur S, Zakian KL, Blasberg R and Koutcher JA:
Relationships between LDH-A, lactate, and metastases in 4T1 breast
tumors. Clin Cancer Res. 19:5158–5169. 2013. View Article : Google Scholar : PubMed/NCBI
|
|
29
|
Qiu H, Jackson AL, Kilgore JE, Zhong Y,
Chan LL, Gehrig PA, Zhou C and Bae-Jump VL: JQ1 suppresses tumor
growth through downregulating LDHA in ovarian cancer. Oncotarget.
6:6915–6930. 2015. View Article : Google Scholar : PubMed/NCBI
|
|
30
|
Wang J, Wang H, Liu A, Fang C, Hao J and
Wang Z: Lactate dehydrogenase A negatively regulated by miRNAs
promotes aerobic glycolysis and is increased in colorectal cancer.
Oncotarget. 6:19456–19468. 2015.PubMed/NCBI
|
|
31
|
Otero-Albiol D and Felipe-Abrio B:
MicroRNA regulating metabolic reprogramming in tumor cells: New
tumor markers. Cancer Transl Med. 2:175–81. 2016. View Article : Google Scholar
|
|
32
|
Zou S, Gu Z, Ni P, Liu X, Wang J and Fan
Q: SP1 plays a pivotal role for basal activity of TIGAR promoter in
liver cancer cell lines. Mol Cell Biochem. 359:17–23. 2012.
View Article : Google Scholar
|
|
33
|
Archer MC: Role of sp transcription
factors in the regulation of cancer cell metabolism. Genes Cancer.
2:712–719. 2011. View Article : Google Scholar : PubMed/NCBI
|
|
34
|
Hedrick E, Cheng Y, Jin UH, Kim K and Safe
S: Specificity protein (Sp) transcription factors Sp1, Sp3 and Sp4
are non-oncogene addiction genes in cancer cells. Oncotarget.
7:22245–22256. 2016. View Article : Google Scholar : PubMed/NCBI
|
|
35
|
Beishline K and Azizkhan-Clifford J: Sp1
and the ‘hallmarks of cancer’. FEBS J. 282:224–258. 2015.
View Article : Google Scholar
|
|
36
|
Vizcaíno C, Mansilla S and Portugal J: Sp1
transcription factor: A long-standing target in cancer
chemotherapy. Pharmacol Ther. 152:111–124. 2015. View Article : Google Scholar : PubMed/NCBI
|