Introduction
Cholestasis is characterized by a reduction in bile
flow and bile acid accumulation (1), and a higher incidence of this
condition is observed in hepatopathy. A previous study in Shanghai
revealed that the total incidence of cholestasis was 10.26% among
chronic liver disease patients (2). Cholestasis is classified as
intrahepatic or extrahepatic (3),
and mechanisms associated with the former type can be broadly
classified as hepatocellular or obstructive. Plugging of
interlobular bile ducts, portal expansion and bile duct
proliferation, along with centrilobular cholate injury, are
observed in the obstructive subtype (3,4).
Cholestasis can be caused by pre-existing medical conditions
including infections, drug treatments, and metabolic or genetic
disorders (5); therefore, it is
considered as a secondary disease (6). Without appropriate treatment, liver
cells (such as portal myofibroblasts and hepatic stellate cells)
are hyperactivated, leading to biliary fibrosis or even cirrhosis
(7,8). To date, there are few therapeutic
options available for the treatment of cholestasis (9).
Ursodeoxycholic acid (UDCA) is currently the only
drug approved by the U.S. Food and Drug Administration for
cholestasis treatment, which acts by relieving disease symptoms and
restoring liver enzyme levels (10). However, approximately one-third of
patients present little or no response to UDCA therapy (11,12). Melatonin (MT) is a methoxyindole
synthesized and secreted at night by the pineal gland under normal
light/dark conditions (13,14). It is widely distributed in human
tissues (13) and serves an
important role in a number of physiological processes (15,16). For instance, MT exerts an
anti-inflammatory effect by scavenging reactive oxygen species and
inhibiting lipid peroxidation (13,17-19). In addition, oral administration of
MT was reported to abolish the increase in the total cholesterol
concentration in the serum of rats with α-naphthyl isothiocyanate
(ANIT)-induced acute liver injury and cholestasis by restoring
cholesterol metabolism and transport in the liver (20). However, few studies have
investigated the effects of orally administered MT on serum
metabolome profiles in rats with cholestasis.
Metabolomics analysis has been widely used to
evaluate the therapeutic effects of herbal medicines (21), as it provides a global view of low
molecular weight metabolites in biological samples, reflecting
physiological changes in biochemical networks and signaling
pathways. It has been suggested that the development of cholestasis
may be associated with alterations in endogenous metabolite
profiles (22). Metabolomics has
previously been applied to investigate the therapeutic effects of
Paeonia lactiflora Pall (23), yinchenhao (24) and rhubarb (25) as treatment approaches for
cholestasis.
ANIT is a well-known hepatotoxicant that causes bile
duct epithelial cells to release factors that attract neutrophils,
leading to hepatic injury (26-30). ANIT-induced intrahepatic
cholestasis shares similarities with drug-induced cholangiolitic
hepatitis in humans. Transient intrahepatic cholestasis can be
induced in animal models with a single dose of ANIT, which has been
demonstrated in rats (30-34)
as well as mice and guinea pigs (31).
The present study investigated the anticholestatic
effect of MT in rats. Gas chromatography-mass spectrometry (GC-MS)
analysis was conducted to evaluate the metabolite profiles, while
multivariate data analysis was performed in order to identify
biomarkers and biochemical signaling pathways associated with
cholestasis.
Materials and methods
Materials and reagents
Carboxymethyl cellulose sodium salt (CMC) was
obtained from Yuanye Biological Technology Co., Ltd. (Shanghai,
China). ANIT and MT were purchased from Sigma-Aldrich (Merck KGaA;
Darmstadt, Germany). ANIT was dissolved in olive oil and
administered at a dose of 75 mg/kg body weight [1 ml ANIT solution
in olive oil (75 mg/ml) per 100 g body weight] to induce liver
injury with cholestasis (35). MT
(100 mg/kg body weight) was resuspended in 1 ml of 0.25% CMC
(20). Colorimetric assay kits
were purchased to determine serum alkaline phosphatase (ALP; cat.
no. A059-1), aspartate aminotransferase (AST; cat. no. C010-2),
alanine aminotransferase (ALT; cat. no. C0009-2) and γ-glutamyl
transpeptidase (GGT; cat. no. C017-1) levels. total bilirubin
(TBIL; cat. no. C019-1), direct bilirubin (DBIL; cat. no. C019-2)
and were detected by chemical oxidation assays. All assay kits were
purchased from Nanjing Jiancheng Bioengineering Institute (Nanjing,
China). Methanol, acetonitrile, methoxylamine hydrochloride,
n-hexane, pyridine and N,O-bis(trimethylsilyl)
trifluoroacetamide (BSTFA) with 1% trimethylchlorosilane (TMCS)
were purchased from CNW Technologies GmbH (Düsseldorf, Germany). In
addition, 2-chloro-l-phenylalanine was obtained from Shanghai
Hengchuang Biotech Co., Ltd. (Shanghai, China). All other chemicals
were of analytical grade and were purchased from commercial
sources.
Animals and treatments
A total of 30 male Sprague-Dawley rats (7-8 weeks
old; weighing 260±20 g) were obtained from SPF-JD-SPF Biotech Co.,
Ltd. (Beijing, China; certification no. SCXK-JING 2016-0002). All
animals were allowed to acclimate for 1 week prior to experiments,
were maintained at a constant temperature (25±2°C) and 50% humidity
with a 12:12-h light/dark cycle, and had free access to water and
food. The study protocol was in strict accordance with the
recommendations of the Guidelines for the Care and Use of
Laboratory Animals of the Ministry of Science and Technology of
China, and was approved by Beijing University of Chinese Medicine
Medical and Experimental Animal Ethics Committee (Beijing,
China).
Table I presents
the experimental design employed for the animal studies. The
animals were randomly divided into three groups of 10 rats each,
including the control, model and MT groups. The rats were fasted
for 12 h prior to injections. Rats in the control group were
injected with the vehicle (olive oil), while the other two groups
received an intraperitoneal injection of ANIT at a dose of 75 mg/kg
body weight. The rats were injected with the same volume of vehicle
or ANIT. Rats in the MT group were orally administered MT (100
mg/kg body weight) 12 h after the initial ANIT injection. The model
and control groups received the same volume of 0.25% CMC at 12 h
after the initial injection. Each rat was weighed prior to
treatment with intraperitoneal injections and oral
administration.
 | Table IDetails of the animal experimental
design. |
Table I
Details of the animal experimental
design.
| Group | Treatment at each
time point |
|---|
| 0 h | 12 h | 24 h | 36 h | 48 h |
|---|
| Control | Fasting | Olive oil | 0.25% CMC | Fasting | Sacrifice |
| Model | Fasting | 75 mg/kg ANIT | 0.25% CMC | Fasting | Sacrifice |
| MT | Fasting | 75 mg/kg ANIT | 100 mg/kg MT | Fasting | Sacrifice |
Sample collection and liver function
assays
The rats were provided with standard chow and water
following the completion of the treatments. Rats were then fasted
for 12 h prior to being sacrificed at 36 h after the initial ANIT
or vehicle injection. Blood samples were collected from the
inferior vena cava, and the liver was removed from each rat
immediately after sacrifice. The blood samples were collected and
centrifuged at 3,500 x g and 4°C for 15 min to obtain the serum.
Sterile, hemolysis-free serum samples were stored at −80°C prior to
determination of biochemical parameters and metabolomics analysis.
All serum samples were used within 1 month. Serum ALT, AST, TBIL,
DBIL, GGT and ALP levels were measured with commercial test kits
according to the manufacturer's protocol.
Histological analysis of liver
damage
Liver tissues were excised and fixed in 10%
phosphate-buffered formalin. Fixed issues were cut into 1×1×0.3 cm
sections. Sections were dehydrated in a gradient alcohol series,
and embedded in paraffin wax blocks. The embedded wax blocks were
fixed to the slicer and were cut into 4-5 μm thick slices.
Following dewaxing slides in xylene, The slides were dipped into
hematoxylin and agitated for 30 sec, rinsed in H2O for 1
min, followed by staining with 1% eosin Y solution for 30 sec with
agitation, all at room temperature (20-25°C). Slides were examined
under a BX53 microscope (Olympus Corporation, Tokyo, Japan).
Sample preparation for metabolome
profiling
Serum samples stored at −80°C were thawed at room
temperature, and then 50 μl of each serum sample was added
to a 1.5-ml Eppendorf tube with 10 μl of
2-chloro-L-phenylalanine (0.3 mg/ml) dissolved in methanol as an
internal standard. The tube was vortexed for 10 sec, and 150
μl of an ice-cold mixture of methanol and acetonitrile (2:1,
v/v) was added, followed by vortexing for 1 min and ultrasonication
at an ambient temperature (25-28°C) for 5 min before storage at
−20°C for 10 min. The samples were then centrifuged at 12,000 x g
and 4°C for 10 min. The quality control (QC) sample was prepared by
mixing aliquots of all samples to obtain a pooled sample. A
150-μl volume of supernatant was then transferred to a glass
sampling vial and vacuum-dried at room temperature. Following the
addition of 80 μl of 15 mg/ml methoxylamine hydrochloride in
pyridine, the sample was vortexed for 2 min and incubated at 37°C
for 90 min. An 80-μl volume of BSTFA (with 1% TMCS) and 20
μl n-hexane were added to the mixture, followed by vortexing
for 2 min and derivatization at 70°C for 60 min. The samples were
allowed to stand at ambient temperature for 30 min prior to GC-MS
analysis.
GC-MS analysis
Derivatized samples were analyzed on a 7890B gas
chromatograph paired with a 5977A mass-selective detector system
(Agilent Technologies, Inc., Santa Clara, CA, USA). A DB-5MS
fused-silica capillary column (30 m 0.25 mm × 0.25 μm;
Agilent Technologies, Inc.) was used to separate the derivatives.
Helium (>99.999%) was used as the carrier gas at a constant flow
rate of 1 ml/min through the column. The injector temperature was
maintained at 260°C, the injection volume was 1 μl in the
splitless mode, and the solvent delay time was set to 5 min. The
oven temperature was initially set at 60°C, and was then increased
to 125°C at a rate of 8°C/min, 210°C at a rate of 5°C/min, 270°C at
a rate of 10°C/min and 305°C at a rate of 20°C/min, and was finally
held at 305°C for 5 min. The temperature of the MS quadrupole and
electron impact ion source were set to 150°C and 230°C,
respectively. The collision energy was 70 eV. MS data were acquired
in full-scan mode (m/z 50-500). The QC was injected at regular
intervals (every 10 samples) throughout the analytical run to
obtain a set of data for assessing reproducibility.
Data pre-processing and statistical
analysis
Chem Station version E.02.02.1431 software (Agilent
Technologies, Inc.) was used to convert the file format (D) of raw
data to a common data format. ChromaTOF version 4.34 software (LECO
Corporation, St. Joseph, MI, USA) was used to analyze the data.
Metabolites were identified using Fiehn databases (http://fiehnlab.ucdavis.edu/projects/fiehnlib) in
ChromaTOF. After alignment with the Statistic Compare component in
ChromaTOF, a raw data array (cvs) was obtained from
three-dimensional datasets, including sample information, peak
names, retention time, m/z and peak intensities. A total of 952
peaks were detected in all the samples and the QC. Internal
standards and any known pseudo-positive peaks (attributed to
background noise, column bleeding or caused by the BSTFA
derivatization procedure) were removed from the data array. The
data were normalized to the total peak area of each sample and
multiplied by 10,000, and peaks from the same metabolite were
combined. The total number of detected metabolites was 366.
The data were log2-transformed using
Excel 2007 software (Microsoft Corporation, Redmond, WA, USA), with
0 peak area replaced with 0.000001 prior to transformation. The
transformed data were imported into the SIMCA version 14.0 software
package (Umetrics, Umeå, Sweden). Principle component analysis
(PCA) and orthogonal partial least-squares discriminant analysis
(OPLS-DA) were conducted to visualize the differences in the levels
of metabolites between groups after mean centering and unit
variance scaling. The Hotelling's T2 region (seen as an
ellipse in score plots of the models) defined the 95% confidence
interval of the modelled variation. Variable influence on
projection (VIP) was used to rank the overall contribution of each
variable to the OPLS-DA model, and variables with a VIP value of
>1 were considered relevant to group discrimination. Default
seven-round cross-validation and 200 response permutation test were
applied, with one-seventh of the samples excluded from the
mathematical model in each round in order to avoid overfitting.
Identification of differentially
expressed metabolites
Differentially expressed metabolites were selected
based on the combination of a statistically significant threshold
of VIP values obtained from the OPLS-DA model and P-values from
one-way analysis of variance (followed by Tukey's test) of
normalized peak areas by SIMCA version 14.0 (Umetrics, Umeå,
Sweden). Metabolites with VIP>1 and P<0.05 were considered to
be significantly differentially expressed.
Identification of pathways
Pathways were identified with the Kyoto Encyclopedia
of Genes and Genomes (https://www.kegg.
jp/kegg/) and MBRole (http://csbg.cnb.csic.es/mbrole2/). The candidate
biomarkers were mapped to KEGG by MBRole ID number shifting
function. Pathways containing the candidate biomarkers were
considered by KEGG pathway enrichment result.
Results
Therapeutic effect of MT on cholestasis
in rats
ANIT administration resulted in significantly
increased ALT and AST serum levels in rats compared with those in
the control group (Fig. 1).
However, treatment with 100 mg/kg MT was observed to reverse this
effect (Fig. 1). Similarly, TBIL,
DBIL, ALP and GGT levels were markedly increased in the ANIT group
when compared with the control group. The high serum levels of
these molecules indicated that ANIT successfully induced
cholestasis. However, this effect was significantly reduced by MT
treatment (Fig. 1).
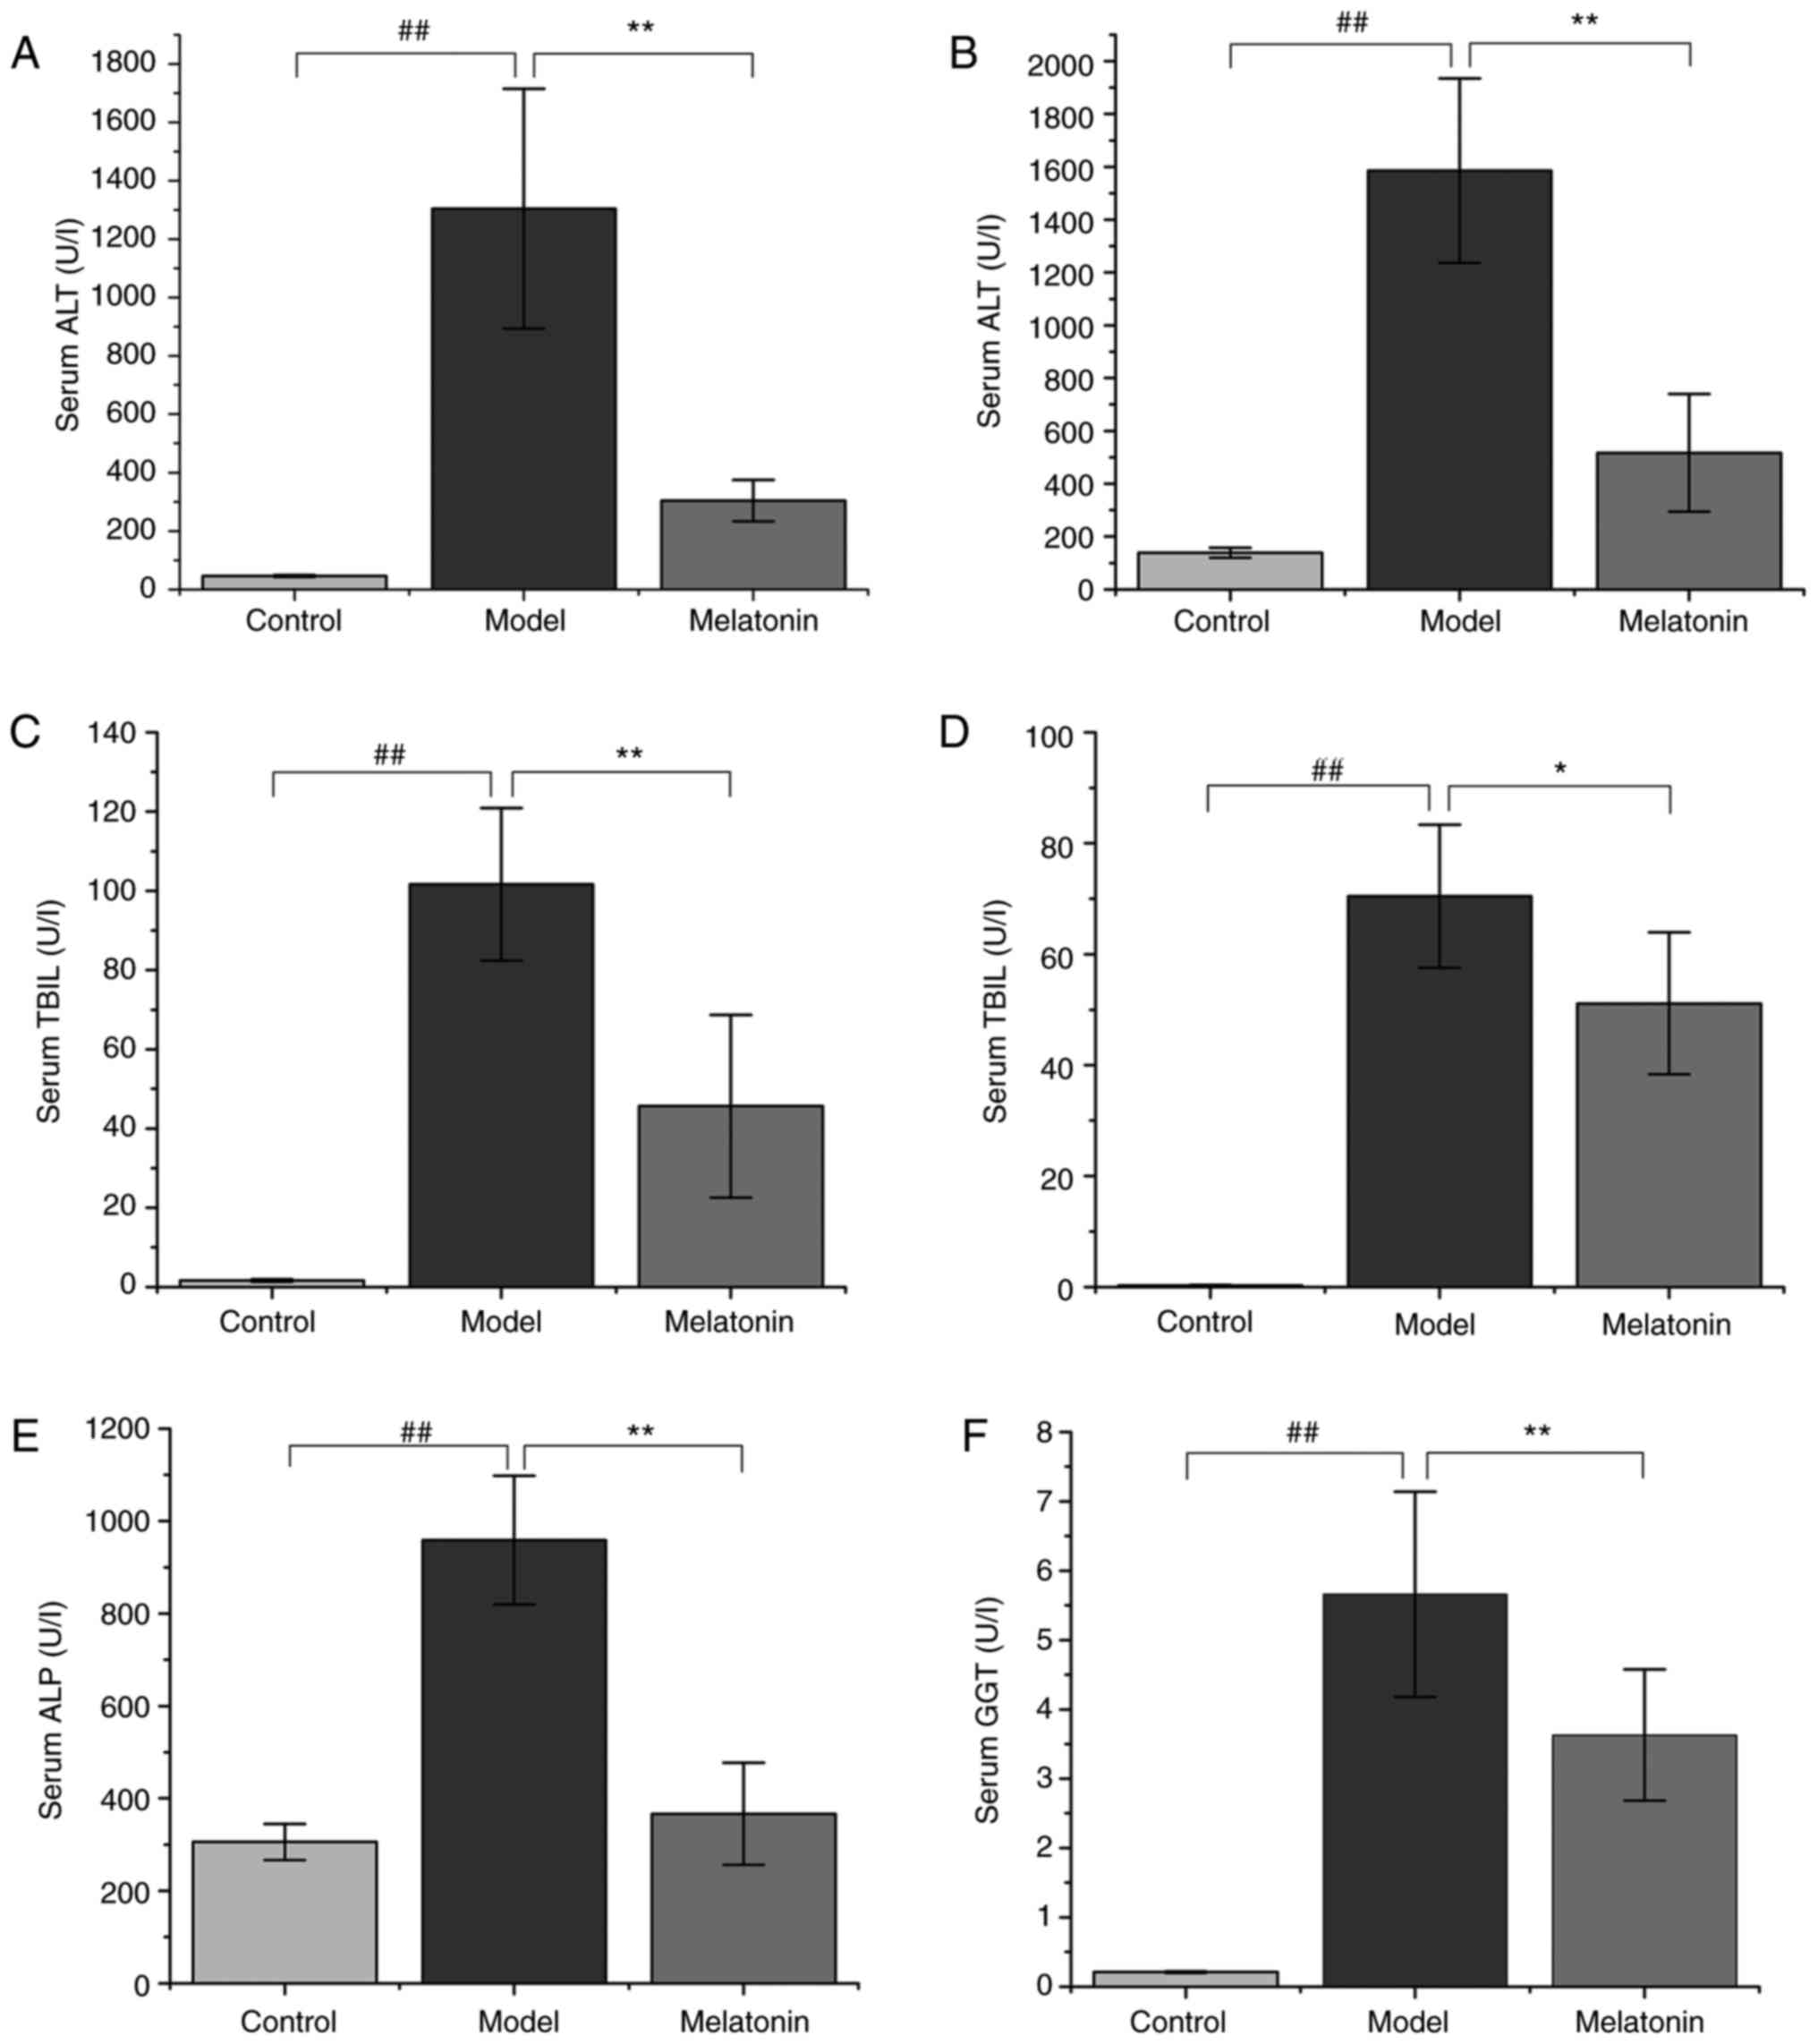 | Figure 1Effects of MT on serum biochemical
parameters. Rats were treated with α-naphthyl isothiocyanate (75
mg/kg) with or without MT, and liver function was assessed by
measuring (A) ALT, (B) AST, (C) TBIL, (D) DBIL, (E) ALP, and (F)
GGT levels. Data are expressed as the mean ± standard error of the
mean (n=10 per group). ##P<0.01;
*P<0.05 and **P<0.01. MT, melatonin;
ALT, alanine aminotransferase; AST, aspartate aminotransferase;
TBIL, total bilirubin; DBIL, direct bilirubin; ALP, alkaline
phosphatase; GGT, γ-glutamyl transpeptidase. |
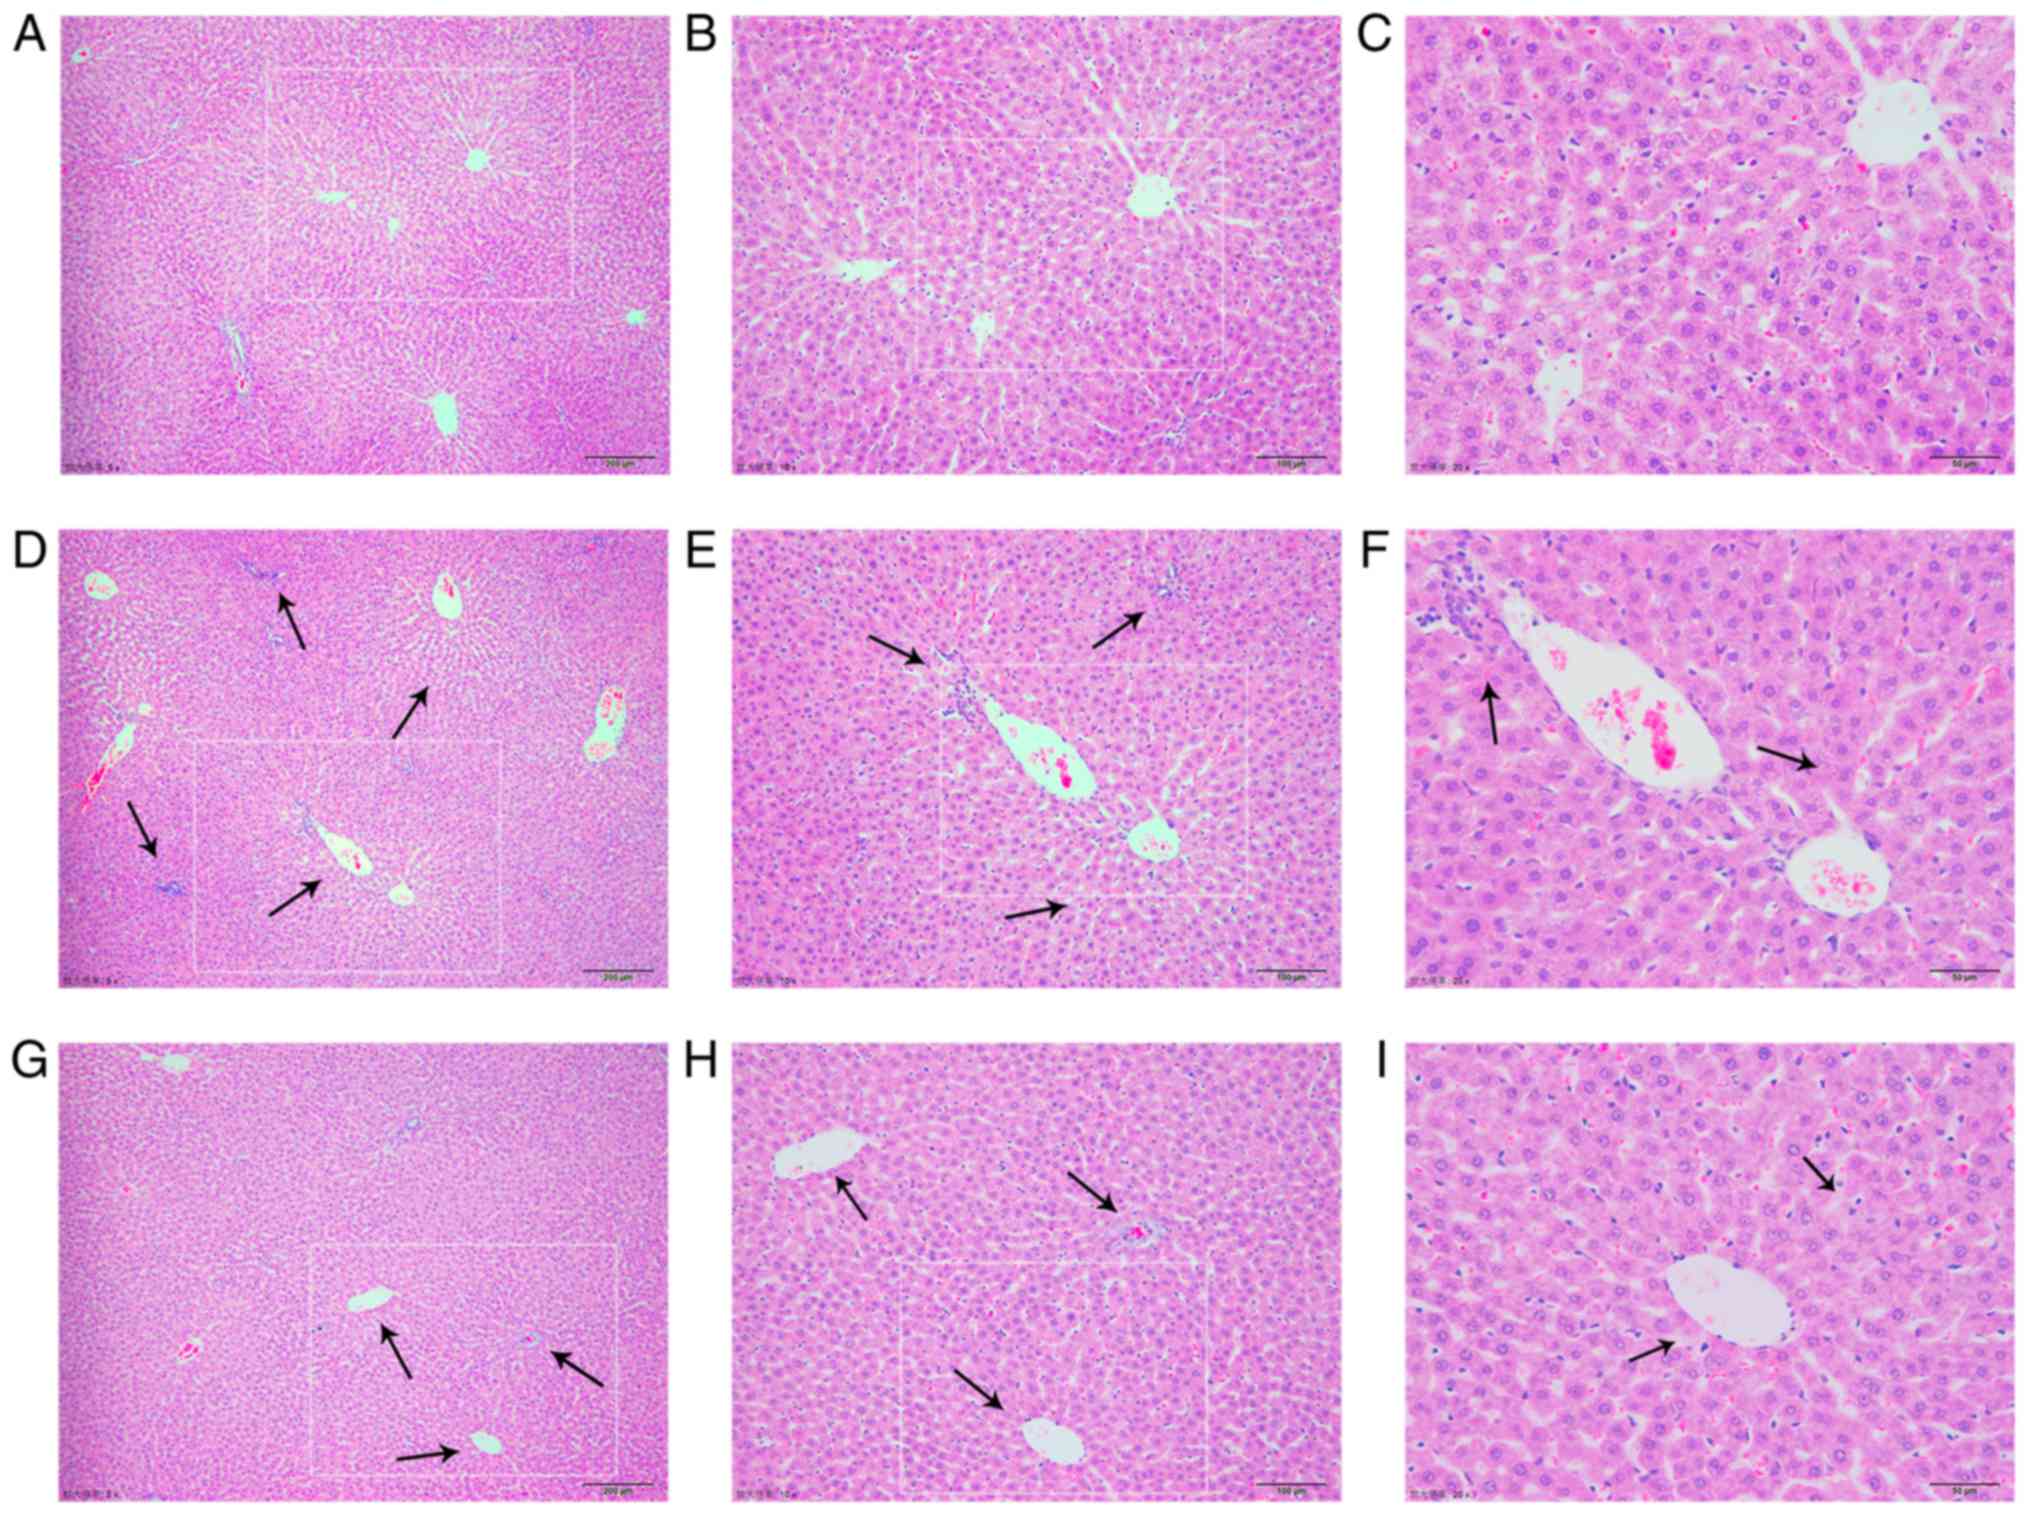
Histological observations
Representative photomicrographs of HE-stained liver
tissue from control rats and the cholestasis rats with or without
MT (100 mg/kg) treatment are presented in Fig. 2. The liver in the control group
had a normal lobular architecture with central veins and radiating
hepatic cords (Fig. 2A-C). By
contrast, rats with cholestasis exhibited marked changes in liver
morphology, including acute infiltration of polymorphonuclear
neutrophils, fatty metamorphosis, sinusoid congestion and necrotic
inflammation (Fig. 2D-F). Rats
treated with MT exhibited mild bile duct epithelial damage and
hydropic degeneration of hepatocytes with fewer invading
neutrophils (Fig. 2G-I).
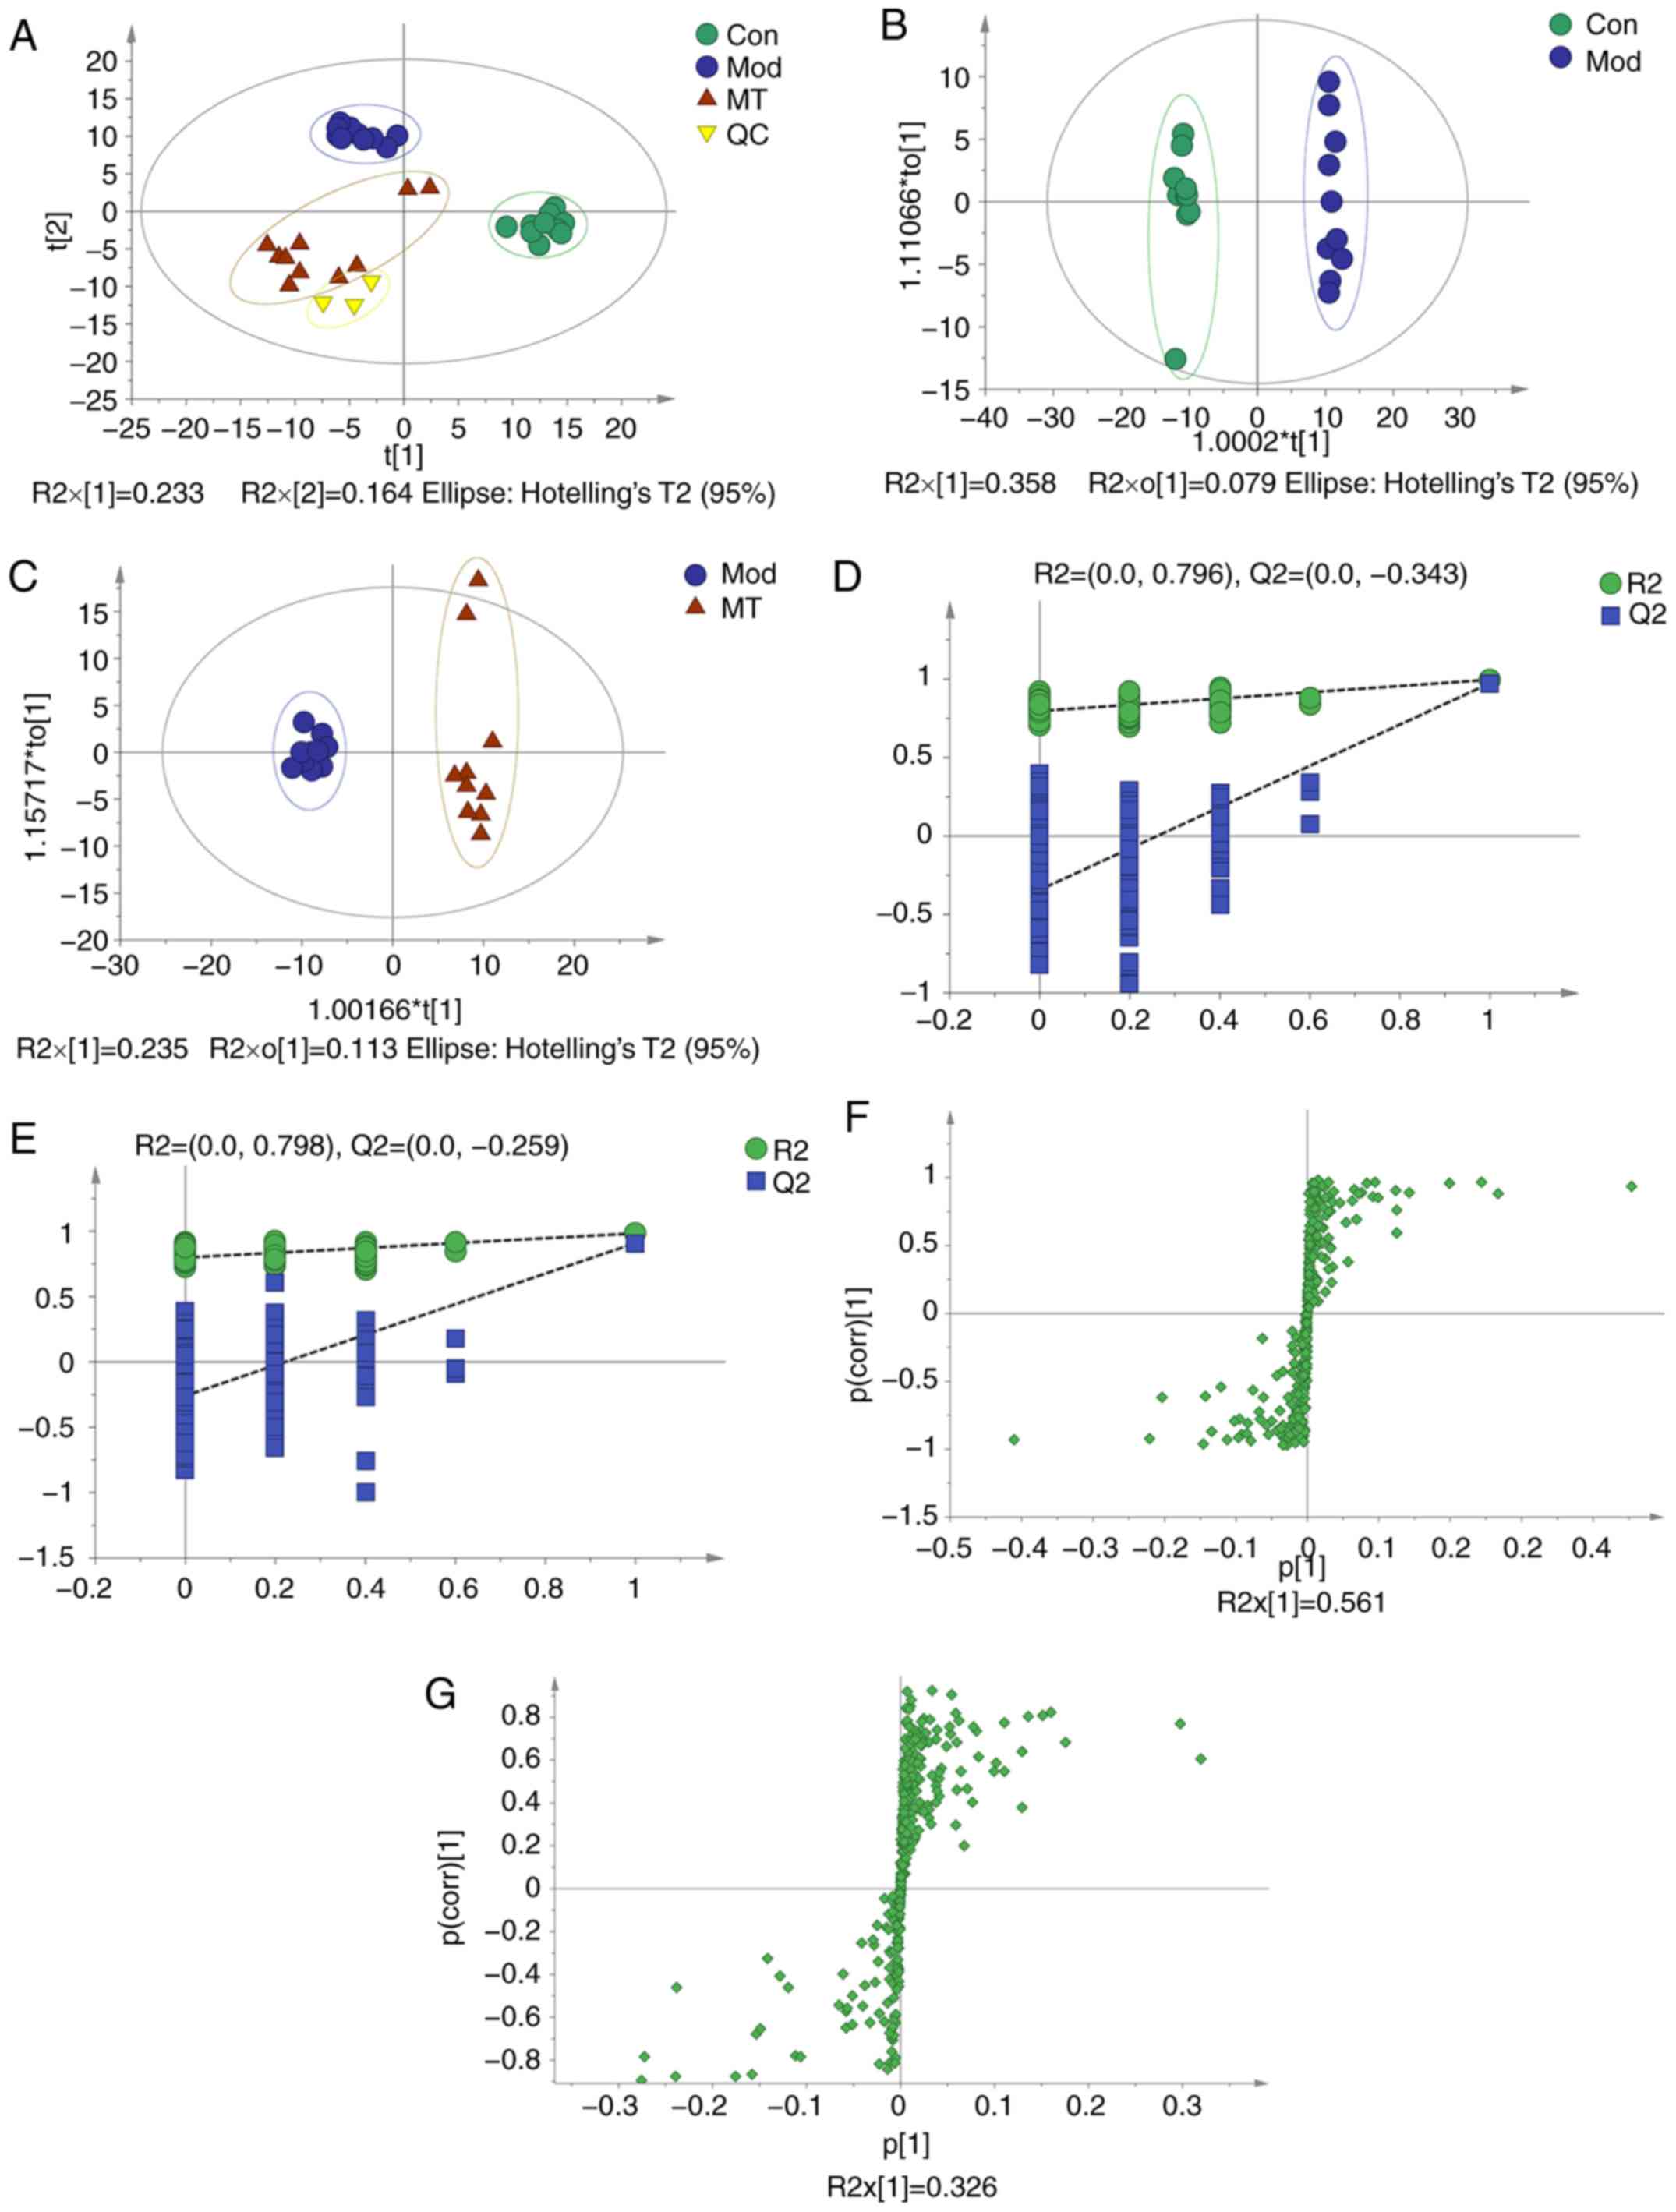
Multivariate statistical analysis
PCA was conducted to assess the differences in the
metabolome profiles of the three groups. A score plot allowed for
visualization of observational clusters, which differed
significantly between the control, ANIT, MT and QC groups (Fig. 3A). The results of PCA indicated
that multivariate statistical analysis was necessary to clarify the
differences among the groups.
OPLS-DA was applied to eliminate and classify
uncorrelated noise and identify potential biomarkers based on
differences in metabolome profiles. The ANIT, MT (100 mg/kg) and
control groups were distinguished in the models (Fig. 3B and C). The R2X,
R2Y and Q2(cum) of the ANIT and control
groups were 0.437, 0.996 and 0.974 respectively, as compared with
the values of 0.349, 0.983 and 0.909 respectively which from ANIT
group and MT group. These results indicated that the model was of
good quality and provided reliable confidence predictions.
Permutation tests with 200 iterations and validation plots
indicated that the original models were valid (Fig. 3D and E). An analysis of OPLS-DA
loading and score plots revealed several critical variables that
were far removed from the center of the coordinate of the loading
plot (Fig. 3F and G), suggesting
that they were important for clustering.
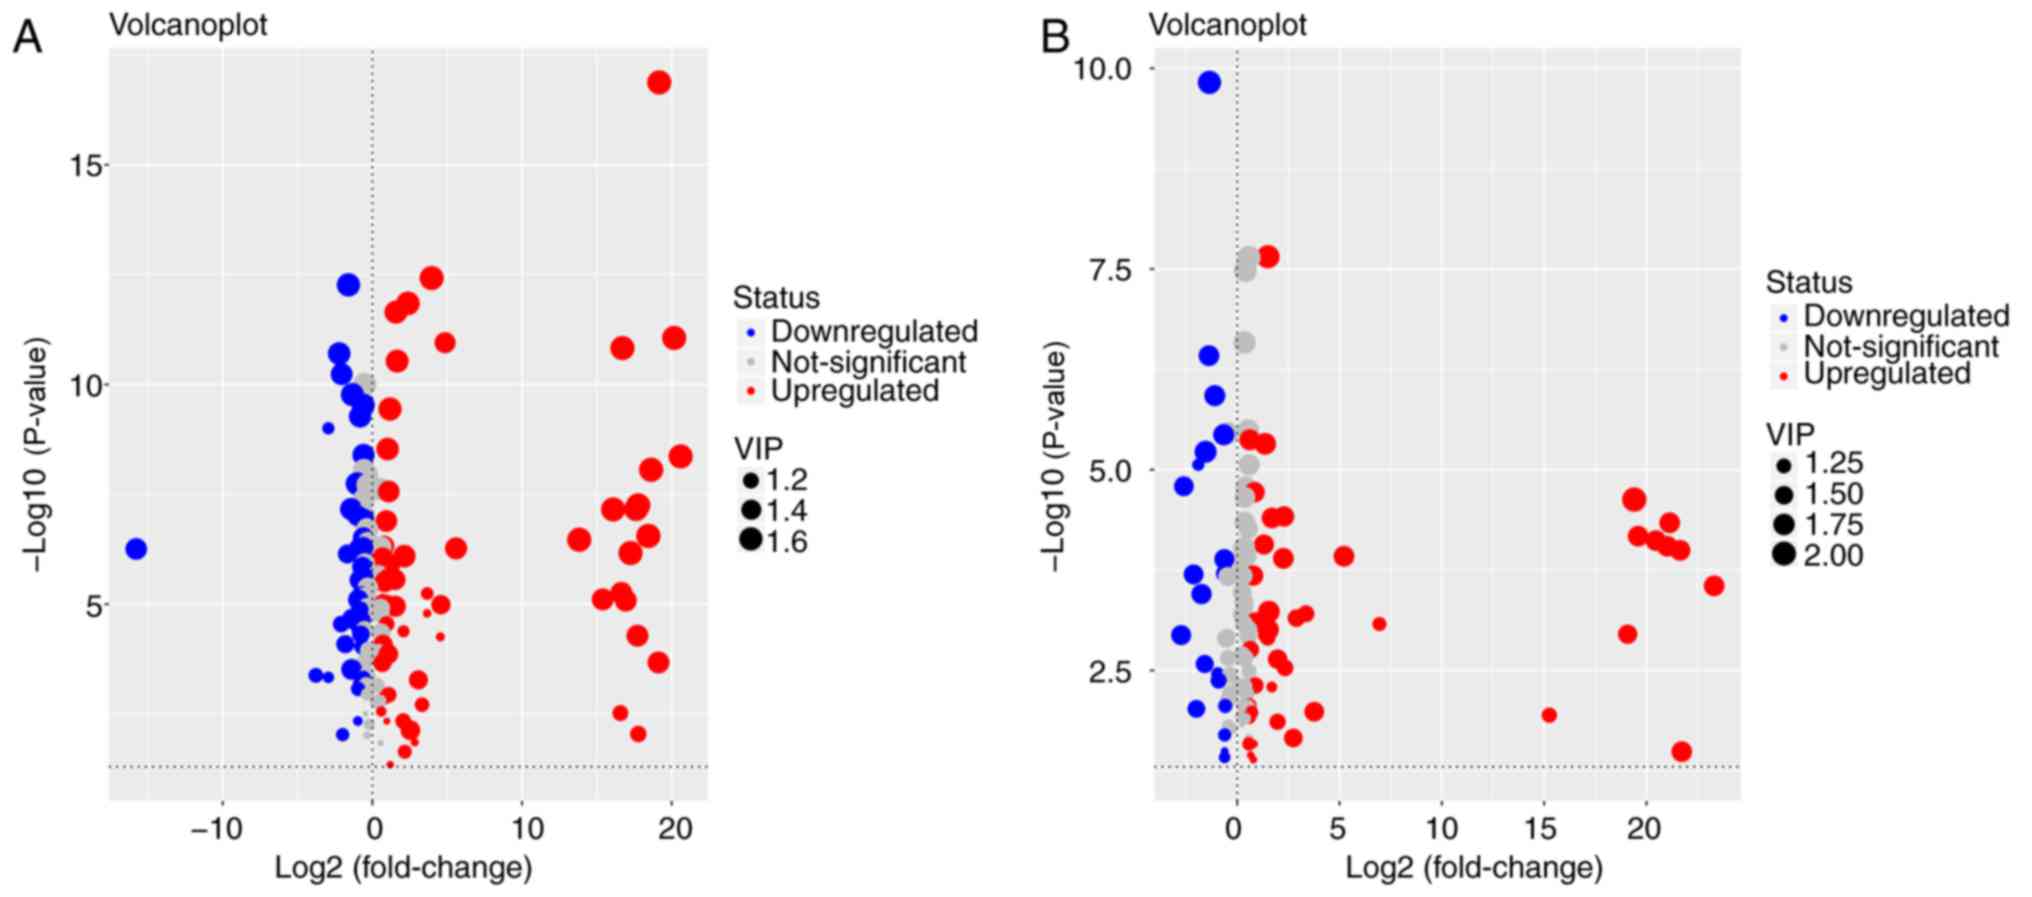
Metabolite identification in MT-treated
rats with cholestasis
Metabolites whose concentration varied among groups
were selected based on the combination of a statistically
significant threshold of VIP values obtained from the OPLS-DA model
and P-values from a two-tailed Student's t-test of normalized peak
areas. Metabolites with values of VIP>1 and P<0.05 were
included. The number and trend of metabolites in different groups
were presented in Fig. 4.
Candidates that significantly differed among the groups with
P<0.05 and log |fold change|>2 were identified as candidate
biomarkers for cholestasis and MT treatment (Table II). Variations in the trends of
seven biomarkers, which included 5-aminopentanoate,
5-methoxytryptamine, L-tryptophan, threonine, glutathione (GSH),
L-methionine and indolelactate, were presented in Fig. 5. Cholestasis model rats had
markedly elevated serum L-tryptophan, L-methionine and threonine
levels, as well as significantly lower levels of the other four
metabolites, when compared with the control group. By contrast, the
MT group exhibited markedly elevated serum 5-methoxytryptamine,
indolelactate, GSH and 5-aminopentanoate levels, and reduced levels
of the other three metabolites when compared with the model
group.
| Table IIIdentified metabolites in the serum
of the different groups. |
Table II
Identified metabolites in the serum
of the different groups.
| RT (min) | Mass (Da) | Metabolite | ANOVA analysis
| VIP | Model and control
| VIP | MT and model
|
|---|
| F-value | P-value | Fold change | P-value of Tukey's
test | Fold change | P-value of Tukey's
test |
|---|
| 13.11 | 174 |
5-Aminopentanoate | 24.711 | <0.001 | 1.52 | 0.78 | 0.002 | 1.71 | 1.50 | <0.001 |
| 7.41 | 174 |
5-Methoxytryptamine | 29.066 | <0.001 | 1.51 | 0.79 | <0.001 | 1.21 | 1.10 | 0.029 |
| 28.57 | 202 | Tryptophan | 24.329 | <0.001 | 1.44 | 1.75 | <0.001 | 1.62 | 0.65 | <0.001 |
| 12.60 | 218 | Threonine | 31.933 | <0.001 | 1.43 | 1.72 | <0.001 | 1.72 | 0.64 | <0.001 |
| 5.87 | 107 | Glutathione | 14.065 | <0.001 | 1.40 | 0.79 | <0.001 | 1.45 | 1.20 | 0.002 |
| 15.42 | 176 | Methionine | 12.485 | <0.001 | 1.32 | 1.44 | <0.001 | 1.35 | 0.78 | 0.005 |
| 17.04 | 202 | Indolelactate | 11.250 | <0.001 | 1.10 | 0.55 | 0.130 | 1.46 | 2.92 | <0.001 |
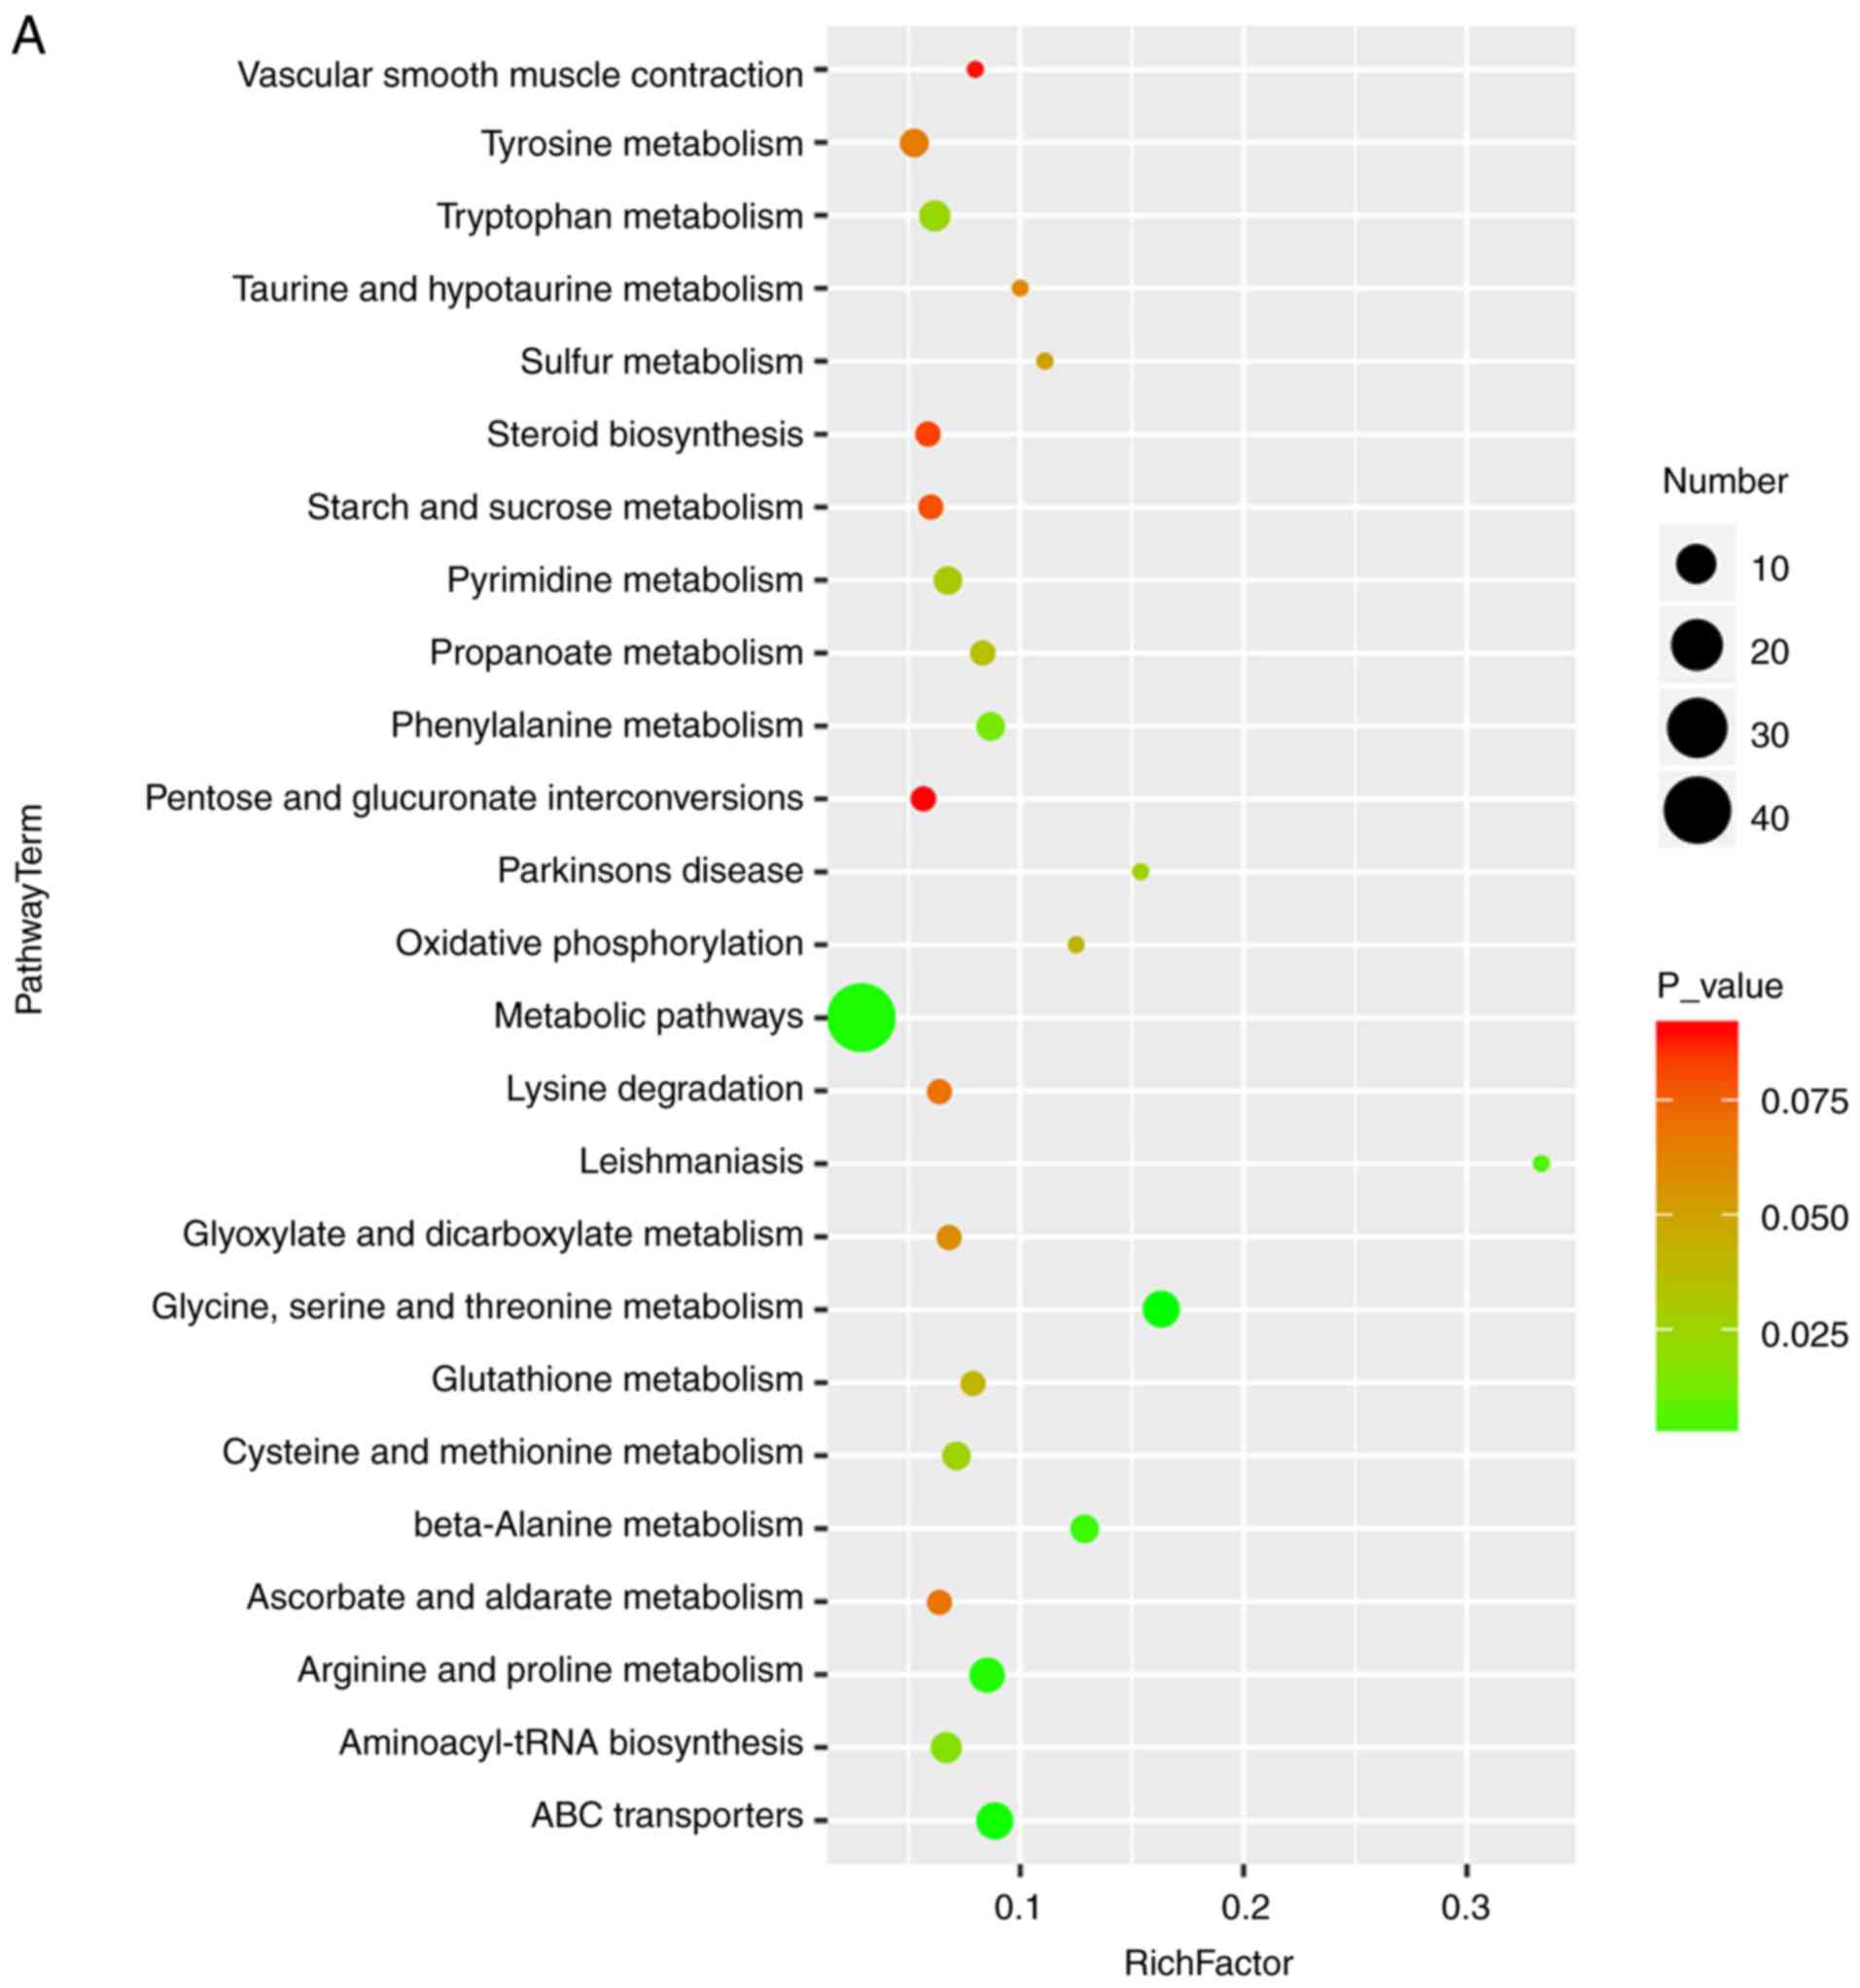
Pathway analysis in MT-treated rats with
cholestasis
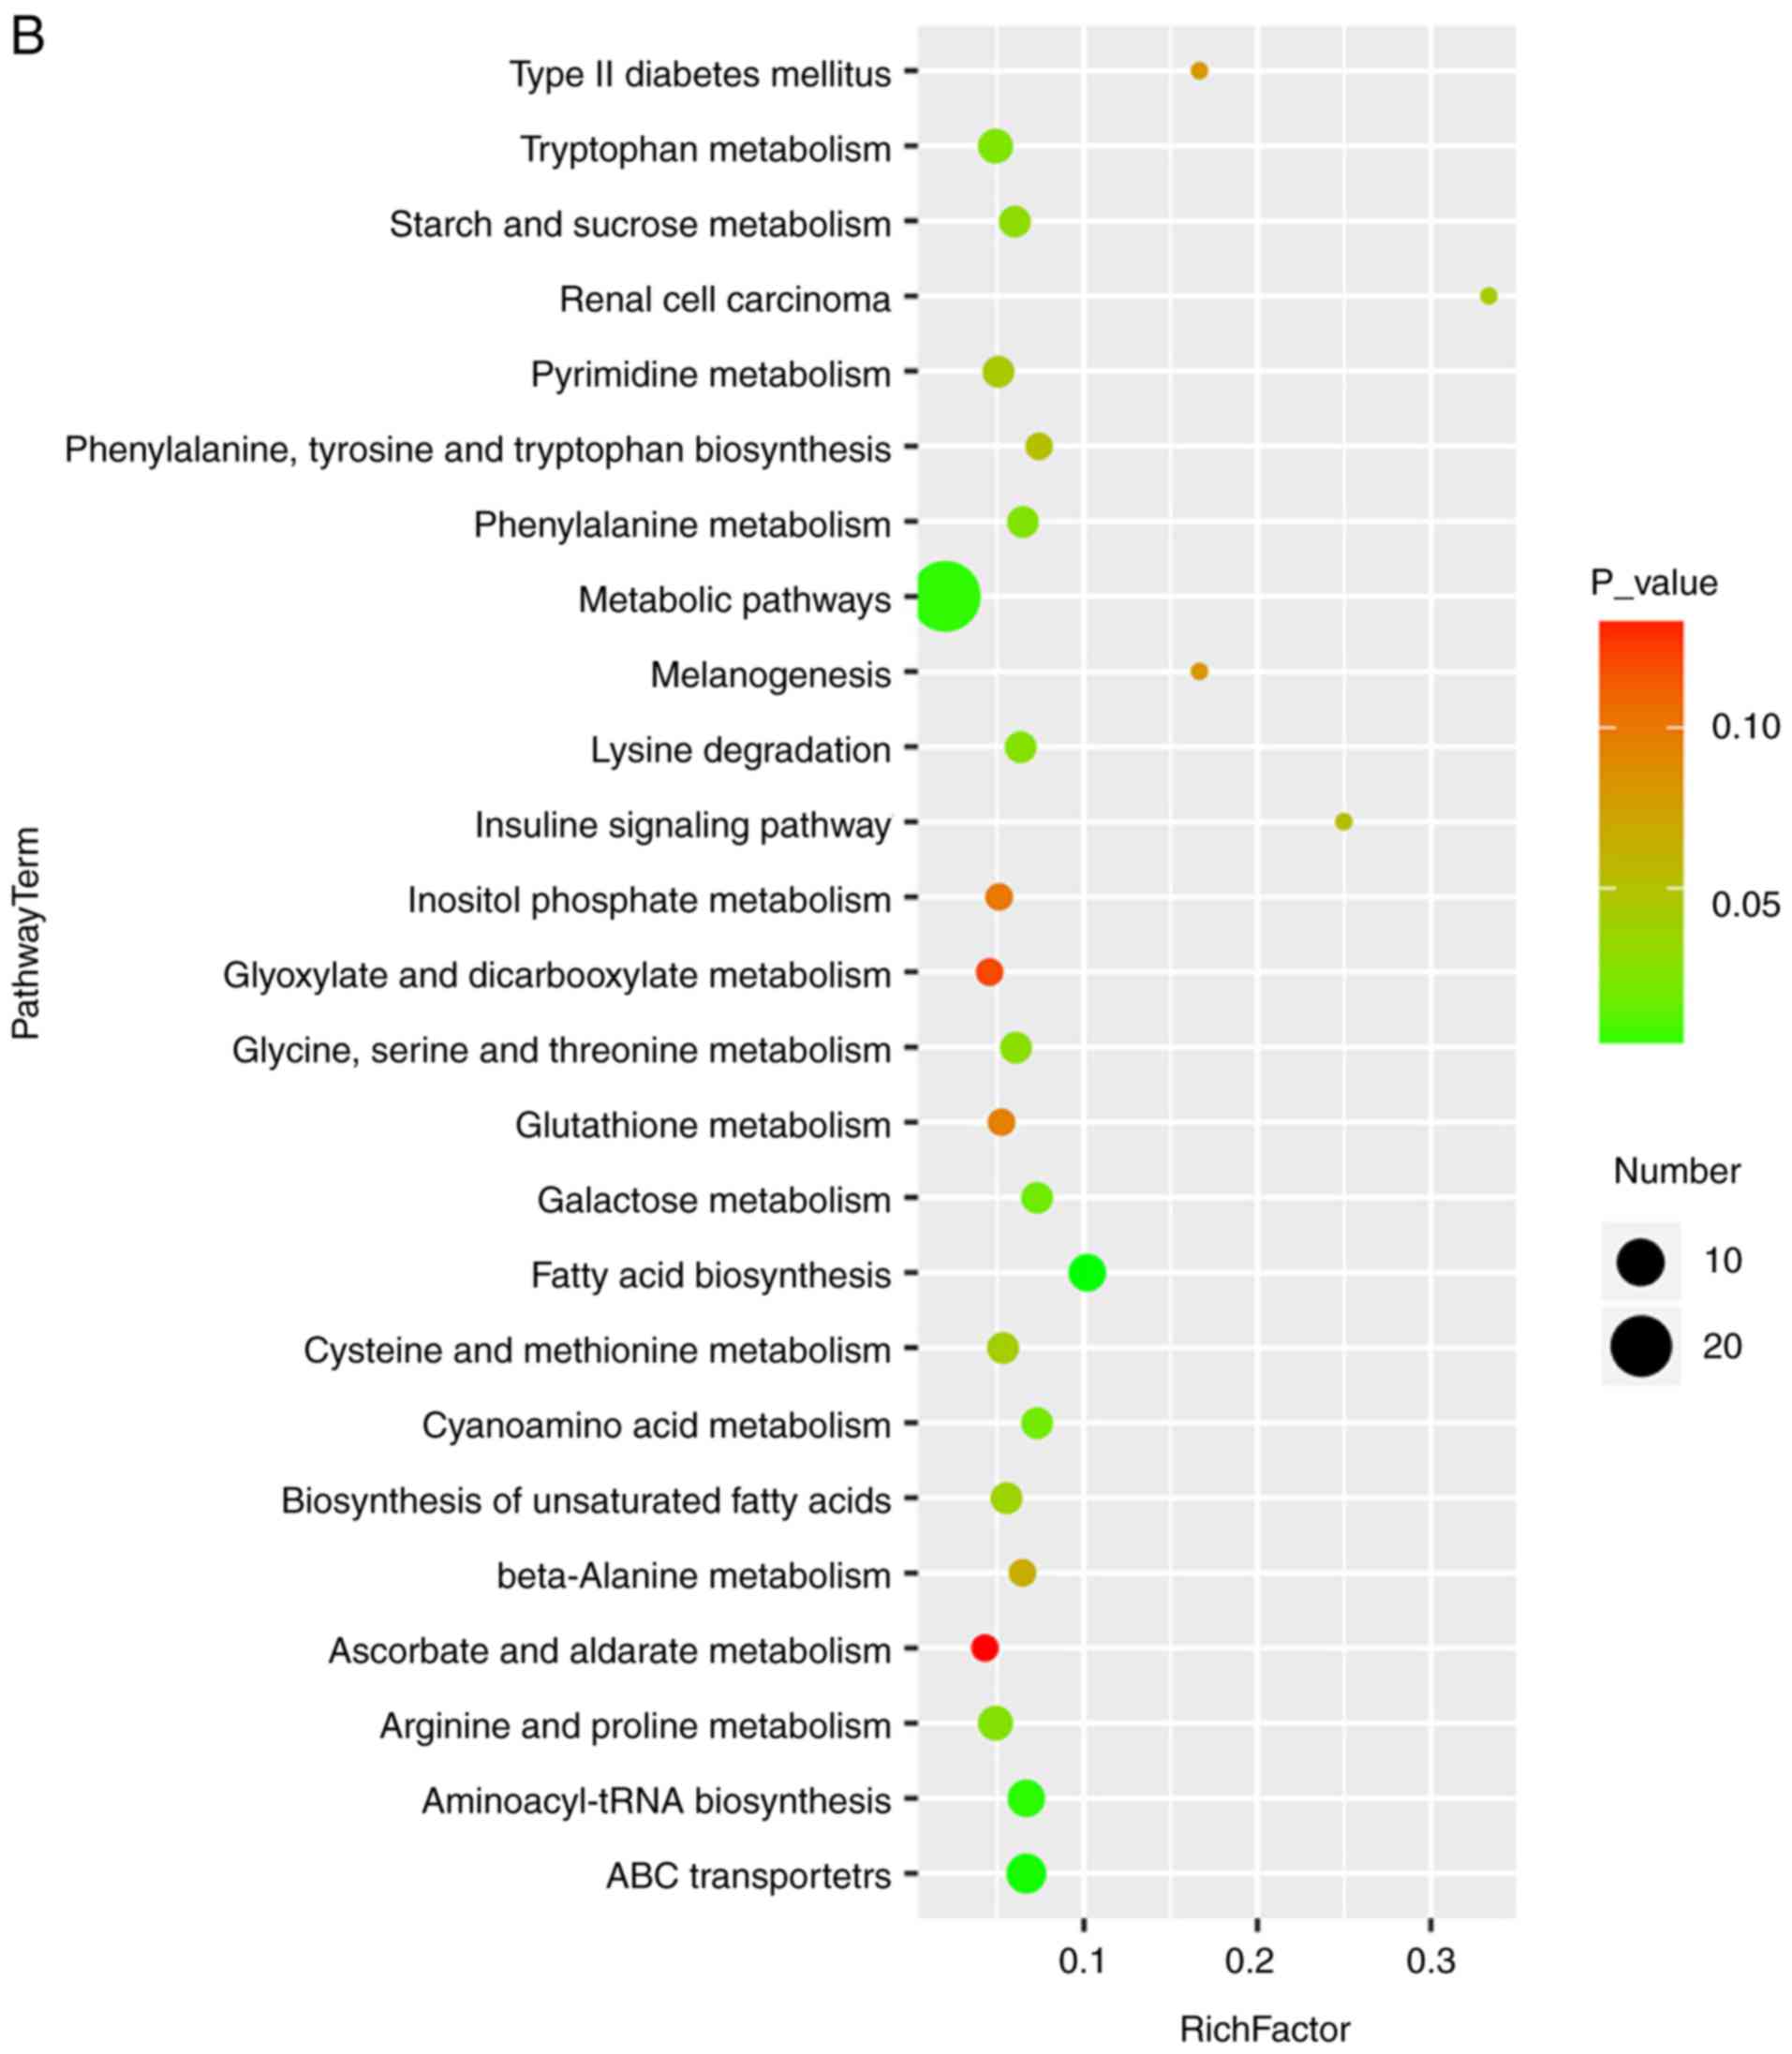
Bubble diagrams of the control, ANIT and MT groups
are presented in Fig. 6, where
the x-axis shows the Rich factor, which is the ratio of the
differential metabolite number to the total number of metabolites
in model organisms in each pathway. The color and size of each
circle reflect the P-value and the variation in the metabolite
number in each pathway, respectively. The results revealed that the
seven metabolites with a significantly different expression among
the groups appeared in the following four KEGG pathways: i)
Glycine, serine and threonine metabolism; ii) cysteine and
methionine metabolism; iii) tryptophan metabolism; and iv) arginine
and proline metabolism. Specifically, those associated with amino
acids were focused on.
Discussion
Cholestasis is characterized by intrahepatic
accumulation of potentially toxic bile acids resulting from
hepatocellular dysfunction or bile duct obstruction (2). However, the detailed mechanism
underlying this condition has not been fully elucidated.
Identifying sensitive and specific biomarkers is important for the
early detection of hepatic fibrosis. In the present study, the
GC-MS-based serum metabolomics analysis revealed significant
changes in pathways associated with the metabolism of the amino
acids arginine/proline, glycine/serine/threonine, tryptophan and
cysteine/methionine. Significant differences were also observed in
the levels of 5-aminopentanoate, 5-methoxytryptamine, L-tryptophan,
threonine, glutathione (GSH), L-methionine and indolelactate among
the control rats and the cholestasis model rats with or without MT
treatment.
Based on the KEGG database results, L-tryptophan,
5-methoxytryptamine and indolelactate in the serum are by-products
of tryptophan metabolism, while GSH and L-methionine are
by-products of the cysteine and methionine metabolism. In addition,
threonine is a by-product of the glycine, serine and threonine
metabolism, and 5-aminopentanoate is a by-product of the arginine
and proline metabolism. Levels of these metabolites were also
demonstrated to be altered in serum. These results suggested that
the metabolism of arginine, proline, glycine, serine, threonine,
tryptophan, cysteine and methionine may be disrupted in cholestasis
(Fig. 7).
GSH is a thiol compound that is associated with
catabolism and intracellular transport. Alterations in plasma GSH
levels are associated with Parkinson's and Alzheimer's diseases,
diabetes, macular degeneration and human immunodeficiency virus
infection (36). GSH participates
in a number of cellular functions, including protection from free
radicals during oxidative stress (37). It has been reported that, for
partial hepatectomy in rats, hepatic GSH levels have increased
after 24 h (38,39). however, due to the short half-life
of GSH, liver GSH levels return to baseline despite this elevation
within 48 h (40).
5-Methoxytryptamine is the main metabolite produced in the
transformation of MT by MT deacetylase, which is subsequently
metabolized to 5-methoxyindoleacetaldehyde, 5-methoxyindole acetic
acid or 5-methoxytryptophol (41). A previous study reported that only
a small fraction (approximately 0.3-0.8%) of the concentration of
the MT present in the incubation medium was converted to 5-MT
(42). This indicates that
deacetylation of MT is one possible pathway for the biosynthesis of
5-MT. Indolepropionic acid is a product of the microbial
degradation of L-tryptophan (43). MT and indolepropionic acid
function as endogenous electron donors, primarily detoxifying
reactive radicals; however, they do not undergo autooxidation in
the presence of transition metals (44). Furthermore, previous results have
indicated that indolepropionic acid is effective in protecting rat
hepatic microsomal membranes against rigidity and against lipid
peroxidation caused by iron (45). Additionally, 5-aminopentanoate has
been reported to serve an important role in proline metabolism and
may participate in lysine degradation in Phaeobacter
inhibens DSM 17395 (46). Lee
et al (47) also found
that lysine degradation is specifically associated with stroke
occurrence, and that low expression of 5-aminopentanoate may
increase the risk of thrombotic stroke. In the present study, serum
GSH, 5-methoxytryptamine, indolepropionic and 5-aminopen-tanoate
levels were decreased in cholestasis model rats when compared with
the control rats; however, these level were increased by MT
treatment. Thus, these four metabolites may be useful biomarkers
for diagnosing cholestasis and evaluating responses to MT
treatment.
L-Tryptophan, a precursor of serotonin and MT,
serves a role in depression, schizophrenia and somatization
(48). Lower levels of plasma
tryptophan are associated with enhanced pain, autonomic nervous
system responses, gut motility, peripheral nerve function, and
ventilation and cardiac dysfunction (49,50). Threonine is an essential amino
acid that is incorporated into intestinal mucosal proteins and is
required for the synthesis of secretory glycoproteins (51). Threonine and alanine share the
same amino acid transporter, which is responsible for threonine
uptake into different cell types, including hepatocytes (52). This is the rate-limiting step for
threonine utilization by the liver (53,54). Methionine is a metabolite that is
important for GSH synthesis in the liver (55). Oral administration of methionine
at high doses was reported to markedly elevate the level of
homocysteine in rat plasma, while long-term MT administration
significantly reduced homocysteine levels (56). Based on this observation, the
close association between methionine and GSH is confirmed.
Furthermore, homocysteine may be the intermediate metabolite
between MT and methionine. In the present study, serum L-tryptophan
levels were increased in the cholestasis model rats; however, this
was abolished by MT treatment, suggesting that L-tryptophan may be
associated with MT secretion and, thus, may serve as a biomarker in
cholestasis.
In conclusion, the results of the present study
demonstrated that MT has a significant anti-cholestatic effect.
Seven metabolites, including 5-aminopentanoate,
5-methoxytryptamine, L-tryptophan, threonine, GSH, L-methionine and
indolelactate, were identified as potential biomarkers of
cholestasis, which may be useful for disease diagnosis and for
assessing the therapeutic efficacy of MT treatment.
Funding
Not applicable.
Availability of data and materials
All data generated or analyzed during this study are
included in this published article.
Authors' contributions
HY, YL and ZX contributed equally to the present
study. XZ and XD conceived and designed the study. HY, YL and ZX
acquired, analyzed and interpreted the data. DW and SS were
responsible for handling the animals and obtaining tissue
specimens. HD and BZ performed histopathological analyses. ZZ and
LS performed statistical analyses. All authors approved the final
manuscript.
Ethics approval and consent to
participate
The study protocol was in strict accordance with the
recommendations of the Guidelines for the Care and Use of
Laboratory Animals of the Ministry of Science and Technology of
China, and was approved by Beijing University of Chinese Medicine
Medical and Experimental Animal Ethics Committee (Beijing,
China).
Patient consent for publication
Not applicable.
Competing interests
The authors declare that they have no competing
interests.
Acknowledgments
The authors would like to thank the staff of the
Science Center Department of Beijing University of Chinese Medicine
(Beijing, China), the Pathology Department of China-Japan
Friendship Hospital (Beijing, China), Shanghai OE Biotech, Inc.
(Shanghai, China) and Professor Jian Li and Mrs. Shujing Zhang for
their technical support.
Glossary
Abbreviations
Abbreviations:
|
ALP
|
alkaline phosphatase
|
|
ALT
|
alanine aminotransferase
|
|
ANIT
|
α-naphthyl isothiocyanate
|
|
AST
|
aspartate aminotransferase
|
|
BSTFA
|
N,O-bis(trimethylsilyl)trifluoroacetamide
|
|
CMC
|
carboxymethyl cellulose sodium
salt
|
|
DBIL
|
direct bilirubin
|
|
GC-MS
|
gas chromatography-mass
spectrometry
|
|
GGT
|
γ-glutamyl transpeptidase
|
|
HE
|
hematoxylineosin
|
|
KEGG
|
Kyoto Encyclopedia of Genes and
Genomes
|
|
MT
|
melatonin
|
|
OPLS-DA
|
orthogonal partial least-squares
discriminant analysis
|
|
PCA
|
principle component analysis
|
|
QC
|
quality control
|
|
TBIL
|
total bilirubin
|
|
TMCS
|
trimethylchlorosilane
|
|
UDCA
|
ursodeoxycholic acid
|
|
VIP
|
variable influence on projection
|
References
|
1
|
Cao X, Gao Y, Zhang W, Xu P, Fu Q, Chen C,
Li C, Yang C, Ma G, Qu Y, et al: Cholestasis morbidity rate in
first-hospitalized patients with chronic liver disease in Shanghai.
Zhonghua Gan Zang Bing Za Zhi. 23:569–573. 2015.In Chinese.
PubMed/NCBI
|
|
2
|
Yang K, Köck K, Sedykh A, Tropsha A and
Brouwer KL: An updated review on drug-induced cholestasis:
Mechanisms and investigation of physicochemical properties and
pharmacokinetic parameters. J Pharm Sci. 102:3037–3057. 2013.
View Article : Google Scholar : PubMed/NCBI
|
|
3
|
European Association for the Study of the
Liver: EASL clinical practice guidelines: Management of cholestatic
liver diseases. J Hepatol. 51:237–267. 2009. View Article : Google Scholar : PubMed/NCBI
|
|
4
|
Park HW, Lee NM, Kim JH, Kim KS and Kim
SN: Parenteral fish oil-containing lipid emulsions may reverse
parenteral nutrition-associated cholestasis in neonates: A
systematic review and meta-analysis. J Nutr. 145:277–283. 2015.
View Article : Google Scholar : PubMed/NCBI
|
|
5
|
Boyer JL: New perspectives for the
treatment of cholestasis: Lessons from basic science applied
clinically. J Hepatol. 46:365–371. 2007. View Article : Google Scholar : PubMed/NCBI
|
|
6
|
Pollock G and Minuk GY: Diagnostic
considerations for chole-static liver disease. J Gastroenterol
Hepatol. 32:1303–1309. 2017. View Article : Google Scholar : PubMed/NCBI
|
|
7
|
Allen K, Jaeschke H and Copple BL: Bile
acids induce inflammatory genes in hepatocytes: A novel mechanism
of inflammation during obstructive cholestasis. Am J Pathol.
178:175–186. 2011. View Article : Google Scholar : PubMed/NCBI
|
|
8
|
Weerachayaphorn J, Luo Y, Mennone A,
Soroka CJ, Harry K and Boyer JL: Deleterious effect of oltipraz on
extrahepatic cholestasis in bile duct-ligated mice. J Hepatol.
60:160–166. 2014. View Article : Google Scholar :
|
|
9
|
Beuers U, Rauner M, Jansen P and Poupon R:
New paradigms in the treatment of hepatic cholestasis: From UDCA to
FXR, PXR and beyond. J Hepatol. 62(Suppl 1): S25–S37. 2015.
View Article : Google Scholar : PubMed/NCBI
|
|
10
|
Kaplan MM and Gershwin ME: Primary biliary
cirrhosis. N Engl J Med. 353:1261–1273. 2005. View Article : Google Scholar : PubMed/NCBI
|
|
11
|
McKiernan PJ: Neonatal cholestasis. Semin
Neonatol. 7:153–165. 2002. View Article : Google Scholar : PubMed/NCBI
|
|
12
|
Ghonem NS, Assis DN and Boyer JL: Fibrates
and cholestasis. Hepatology. 62:635–643. 2015. View Article : Google Scholar : PubMed/NCBI
|
|
13
|
Acuña-Castroviejo D, Escames G, Venegas C,
Díaz-Casado ME, Lima-Cabello E, López LC, Rosales-Corral S, Tan DX
and Reiter RJ: Extrapineal melatonin: Sources, regulation, and
potential functions. Cell Mol Life Sci. 71:2997–3025. 2014.
View Article : Google Scholar : PubMed/NCBI
|
|
14
|
Pääkkönen T, Mäkinen TM, Leppäluoto J,
Vakkuri O, Rintamäki H, Palinkas LA and Hassi J: Urinary melatonin:
A noninvasive method to follow human pineal function as studied in
three experimental conditions. J Pineal Res. 40:110–115. 2006.
View Article : Google Scholar : PubMed/NCBI
|
|
15
|
Claustrat B and Leston J: Melatonin:
Physiological effects in humans. Neurochirurgie. 61:77–84. 2015.
View Article : Google Scholar : PubMed/NCBI
|
|
16
|
Calvo JR, González-Yanes C and Maldonado
MD: The role of melatonin in the cells of the innate immunity: A
review. J Pineal Res. 55:103–120. 2013. View Article : Google Scholar : PubMed/NCBI
|
|
17
|
Lotufo CM, Lopes C, Dubocovich ML, Farsky
SH and Markus RP: Melatonin and N-acetylserotonin inhibit leukocyte
rolling and adhesion to rat microcirculation. Eur J Pharmacol.
430:351–357. 2001. View Article : Google Scholar : PubMed/NCBI
|
|
18
|
Allegra M, Reiter RJ, Tan DX, Gentile C,
Tesoriere L and Livrea MA: The chemistry of melatonin's interaction
with reactive species. J Pineal Res. 34:1–10. 2003. View Article : Google Scholar
|
|
19
|
Jaworek J, Leja-Szpak A, Kot M, Jaworek A,
Nawrot-Porbka K, Bonior J and Szklarczyk J: The role of melatonin
in pancreatic protection: Could melatonin be used in the treatment
of acute pancreatitis? Curr Pharm Des. 20:4834–4840. 2014.
View Article : Google Scholar
|
|
20
|
Ohta Y, Kongo-Nishimura M, Imai Y and
Kitagawa A: Melatonin attenuates disruption of serum cholesterol
status in rats with a single alpha-naphthylisothiocyanate
treatment. J Pineal Res. 42:159–165. 2007. View Article : Google Scholar : PubMed/NCBI
|
|
21
|
Wang JB, Zhao HP, Zhao YL, Jin C, Liu DJ,
Kong WJ, Fang F, Zhang L, Wang HJ and Xiao XH: Hepatotoxicity or
hepatoprotection? Pattern recognition for the paradoxical effect of
the Chinese herb Rheum palmatum L. in treating rat liver injury.
PLoS One. 6:e244982011. View Article : Google Scholar : PubMed/NCBI
|
|
22
|
Wang X, Zhang A, Han Y, Wang P, Sun H,
Song G, Dong T, Yuan Y, Yuan X, Zhang M, et al: Urine metabolomics
analysis for biomarker discovery and detection of jaundice syndrome
in patients with liver disease. Mol Cell Proteomics. 11:370–380.
2012. View Article : Google Scholar : PubMed/NCBI
|
|
23
|
Ma X, Chi YH, Niu M, Zhu Y, Zhao YL, Chen
Z, Wang JB, Zhang CE, Li JY, Wang LF, et al: Metabolomics coupled
with multivariate data and pathway analysis on potential biomarkers
in cholestasis and intervention effect of Paeonia lactiflora Pall.
Front Pharmacol. 7:142016. View Article : Google Scholar : PubMed/NCBI
|
|
24
|
Sun H, Zhang AH, Zou DX, Sun WJ, Wu XH and
Wang XJ: Metabolomics coupled with pattern recognition and pathway
analysis on potential biomarkers in liver injury and
hepatoprotective effects of yinchenhao. Appl Biochem Biotechnol.
173:857–869. 2014. View Article : Google Scholar : PubMed/NCBI
|
|
25
|
Zhang CE, Niu M, Li RY, Feng WW, Ma X,
Dong Q, Ma ZJ, Li GQ, Meng YK, Wang Y, et al: Untargeted
metabolomics reveals dose-response characteristics for effect of
rhubarb in a rat model of cholestasis. Front Pharmacol. 7:852016.
View Article : Google Scholar : PubMed/NCBI
|
|
26
|
Hill DA and Roth RA:
Alpha-naphthylisothiocyanate causes neutrophils to release factors
that are cytotoxic to hepatocytes. Toxicol Appl Pharmacol.
148:169–175. 1998. View Article : Google Scholar : PubMed/NCBI
|
|
27
|
Hill DA, Jean PA and Roth RA: Bile duct
epithelial cells exposed to alpha-naphthylisothiocyanate produces a
factor that causes neutrophil-dependent hepatocellular injury in
vitro. Toxicol Sci. 47:118–125. 1999. View Article : Google Scholar : PubMed/NCBI
|
|
28
|
Cullen JM, Faiola B, Melich DH, Peterson
RA, Jordan HL, Kimbrough CL and Miller RT: Acute
alpha-naphthylisothiocyanate-induced liver toxicity in germfree and
conventional male rats. Toxicol Pathol. 44:987–997. 2016.
View Article : Google Scholar : PubMed/NCBI
|
|
29
|
Li X, Liu R, Yu L, Yuan Z, Sun R, Yang H,
Zhang L and Jiang Z: Alpha-naphthylisothiocyanate impairs bile acid
homeostasis through AMPK-FXR pathways in rat primary hepatocytes.
Toxicology. 370:106–115. 2016. View Article : Google Scholar : PubMed/NCBI
|
|
30
|
Golbar HM, Izawa T, Wijesundera KK, Bondoc
A, Tennakoon AH, Kuwamura M and Yamate J: Depletion of hepatic
macrophages aggravates liver lesion induced in rats by
thioacetamide (TAA). Toxicol Pathol. 44:246–258. 2016. View Article : Google Scholar : PubMed/NCBI
|
|
31
|
Capizzo F and Roberts RJ:
α-Naphthylisothiocyanate (ANIT)-induced hepatotoxicity and
disposition in various species. Toxicol Appl Pharmacol. 19:176–187.
1971. View Article : Google Scholar : PubMed/NCBI
|
|
32
|
Plaa GL and Priestly BG: Intrahepatic
cholestasis induced by drugs and chemicals. Pharmacol Rev.
28:207–273. 1976.PubMed/NCBI
|
|
33
|
Cruz A, Padillo FJ, Torres E, Navarrete
CM, Muñoz-Castañeda JR, Caballero FJ, Briceño J, Marchal T, Túnez
I, Montilla P, et al: Melatonin prevents experimental liver
cirrhosis induced by thio-acetamide in rats. J Pineal Res.
39:143–150. 2005. View Article : Google Scholar : PubMed/NCBI
|
|
34
|
Bothe MK, Meyer C, Mueller U, Queudot JC,
Roger V, Harleman J and Westphal M: Characterization of a rat model
of moderate liver dysfunction based on
alpha-naphthylisothiocyanate-induced cholestasis. J Toxicol Sci.
42:715–721. 2017. View Article : Google Scholar : PubMed/NCBI
|
|
35
|
Zhou HQ, Liu W, Wang J, Huang YQ, Li PY,
Zhu Y, Wang JB, Ma X, Li RS, Wei SZ, et al: Paeoniflorin attenuates
ANIT-induced cholestasis by inhibiting apoptosis in vivo via
mitochondria-dependent pathway. Biomed Pharmacother. 89:696–704.
2017. View Article : Google Scholar : PubMed/NCBI
|
|
36
|
Yuan B, Xu C, Liu L, Zhang Q, Ji S, Pi L,
Zhang D and Huo Q: Cu2O/NiOx/graphene oxide
modified glassy carbon electrode for the enhanced electrochemical
oxidation of reduced glutathione and nonenzyme glucose sensor.
Electrochimica Acta. 104:78–83. 2013. View Article : Google Scholar
|
|
37
|
Jaeschke H: The role of reactive oxygen
species in hepatic ischaemia-reperfusion injury and
preconditioning. J Inv Surg. 16:127–140. 2003. View Article : Google Scholar
|
|
38
|
Carbonell LF, Nadal JA, Llanos MC,
Hernández I, Nava E and Díaz J: Depletion of liver glutathione
potentiates the oxidative stress and decreases nitric oxide
synthesis in a rat endotoxin shock model. Crit Care Med.
28:2002–2006. 2000. View Article : Google Scholar : PubMed/NCBI
|
|
39
|
Lee SJ and Boyer TD: The effect of hepatic
regeneration on the expression of the glutathione S-transferases.
Biochem J. 293:137–142. 1993. View Article : Google Scholar : PubMed/NCBI
|
|
40
|
Huang ZZ, Li H, Cai J, Kuhlenkamp J,
Kaplowitz N and Lu SC: Changes in glutathione homeostasis during
liver regeneration in the rat. Hepatology. 27:147–153. 1998.
View Article : Google Scholar : PubMed/NCBI
|
|
41
|
Grace MS, Cahill GM and Besharse JC:
Melatonin deacetylation: Retinal vertebrate class distribution and
Xenopus laevis tissue distribution. Brain Res. 559:56–63. 1991.
View Article : Google Scholar : PubMed/NCBI
|
|
42
|
Rogawski MA, Roth RH and Aghajanian GK:
Melatonin: Deacetylation to 5-methoxytryptamine by liver but not
brain aryl acylamidase. J Neurorhem. 32:1219–1226. 1979. View Article : Google Scholar
|
|
43
|
Jean M and DeMoss RD: Indolelactate
dehydrogenase from Clostridium sporogenes. Can J Microbiol.
14:429–435. 1968. View Article : Google Scholar : PubMed/NCBI
|
|
44
|
Tan DX, Manchester LC, Reiter RJ, Qi W,
Karbownik M and Calvo JR: Significance of melatonin in
antioxidative defense: Reactions and products. Biol Signals Recept.
9:137–159. 2000. View Article : Google Scholar : PubMed/NCBI
|
|
45
|
Karbownik M, Reiter RJ, Garcia JJ, Cabrera
J, Burkhardt S, Osuna C and Lewiński A: Indole-3-propionic acid, a
melatonin-related molecule, protects hepatic microsomal membranes
from ironinduced oxidative damage: Relevance to cancer reduction. J
Cell Biochem. 81:507–513. 2001. View Article : Google Scholar
|
|
46
|
Drüppel K, Hensler M, Trautwein K,
Kozzmehl S, Wöhlbrand L, Schmidt-Hohagen K, Ulbrich M, Bergen N,
Meier-Kolthoff JP, Göker M, et al: Pathways and substrate-specific
regulation of amino acid degradation in Phaeobacter inhibens DSM
17395 (archetype of the marine Roseobacter clade). Environ
Microbiol. 16:218–238. 2014. View Article : Google Scholar
|
|
47
|
Lee Y, Khan A, Hong S, Jee SH and Park YH:
A metabolomic study on high-risk stroke patients determines low
levels of serum lysine metabolites: A retrospective cohort study.
Mol Biosyst. 1109–1120. 2017. View Article : Google Scholar : PubMed/NCBI
|
|
48
|
Young SN: The effect of raising and
lowering tryptophan levels on human mood and social behaviour.
Philos Trans R Soc Lond B Biol Sci. 368:201103752013. View Article : Google Scholar : PubMed/NCBI
|
|
49
|
Anderson G, Maes M and Berk M:
Schizophrenia is primed for an increased expression of depression
through activation of immuno-inflammatory, oxidative and
nitrosative stress, and tryptophan catabolite pathways. Prog
Neuropsychopharmacol Biol Psychiatry. 42:101–114. 2013. View Article : Google Scholar
|
|
50
|
Anderson G, Maes M and Berk M:
Inflammation-related disorders in the tryptophan catabolite pathway
in depression and somatization. Adv Protein Chem Struct Biol.
88:27–48. 2012. View Article : Google Scholar : PubMed/NCBI
|
|
51
|
Hogewind-Schoonenboom JE, Huang L, de
Groof F, Zhu L, Voortman GJ, Schierbeek H, Vermes A, Chen C, Huang
Y and van Goudoever JB: Threonine requirement of the enterally fed
term infant in the first month of life. J Pediatr Gastroenterol
Nutr. 61:373–379. 2015. View Article : Google Scholar : PubMed/NCBI
|
|
52
|
Kilberg MS, Handlogten ME and Christensen
HN: Characteristics of system ASC for transport of neutral amino
acids in the isolated rat hepatocyte. J Biol Chem. 256:3304–3312.
1981.PubMed/NCBI
|
|
53
|
Floc'h NL, Obled C and Sève B: In vivo
threonine oxidation in growing pigs fed on diets with graded levels
of threonine. Br J Nutr. 75:825–837. 1996. View Article : Google Scholar : PubMed/NCBI
|
|
54
|
Le Floc'h N, Thibault JN and Sève B:
Tissue localization of threonine oxidation in pigs. Br J Nutr.
77:593–603. 1997. View Article : Google Scholar
|
|
55
|
Lu SC, Mato JM, Espinosa-Diez C and Lamas
S: MicroRNA-mediated regulation of glutathione and methionine
metabolism and its relevance for liver disease. Free Radic Biol
Med. 100:66–72. 2016. View Article : Google Scholar : PubMed/NCBI
|
|
56
|
Bouzouf M, Martinez-Cruz F, Molinero P,
Guerrero JM and Osuna C: Melatonin prevents hyperhomocysteinemia
and neural lipid peroxidation induced by methionine intake. Curr
Neurovasc Res. 2:175–178. 2005. View Article : Google Scholar : PubMed/NCBI
|