Introduction
Inflammatory bowel disease (IBD) is a chronic
inflammatory disorder of the gastrointestinal tract; its incidence
is higher in western countries but is rapidly increasing in Asian
populations (1). Epidemiological
and clinical evidence has shown an association between IBD and
several environmental factors, antibiotic use, modern lifestyle and
diet (2,3). One specific risk factor is the
consumption of fructose; fructose intake is reported to cause gut
symptoms, and lead not only to the exacerbation of IBD symptoms but
also to those of irritable bowel syndrome (4). Previous reports have revealed a link
between fructose and the exacerbation of gut symptoms in patients
with IBD, and a diet low in fermentable oligo-, di- and
mono-saccharides, and polyols may be an effective dietary therapy
for patients with IBD and coexisting functional gut symptoms
(5,6).
Fructose is an inverted sugar that is used in
popular carbonated beverages (7-9).
It is absorbed from the intestinal lumen by diffusion, a process
that is facilitated by the mucosal GLUT5 transporter protein, a
type of glucose-dependent transporter (10). Previous studies demonstrated that
increased fructose consumption resulted in the accumulation of
lipids in the liver, leading to elevated plasma triglyceride levels
and oxidative stress (11-13).
Therefore, the excessive intake of fructose is considered a risk
factor for lifestyle-related diseases, including obesity, type 2
diabetes mellitus and non-alcoholic fatty liver disease (14-17). It was reported that chronic
fructose intake in mice was associated with the loss of occludin in
the small intestine, and that gut bacterial overgrowth was
associated with the translocation of bacterial endotoxins from the
intestine to the liver (18,19).
However, the effects of fructose on the large
intestinal tract remain to be fully elucidated, particularly with
regard to intestinal inflammation, intestinal barrier function and
gut microbiota in the colon. In the present study, a mouse model of
colitis was used to analyze the impact of fructose on each of these
regions.
Materials and methods
Animals and diets
Six-week-old male C57BL/6J mice (weight is ~20 g;
Kyudo Co., Ltd., Kumamoto, Japan) were randomly allocated into four
experimental groups: Group C (n=7), the control group, was fed
standard chow (SC) and normal water; Group D (n=10) was fed SC and
water containing 1% dextran sulfate sodium (DSS; MW 5,000; Wako
Pure Chemical Industries, Ltd., Osaka, Japan); Group F (n=7) was
fed a high-fructose diet (HFD; Oriental Yeast Co., Ltd., Tokyo,
Japan) and normal water; and Group FD (n=10) was fed an HFD and
water containing 1% DSS. The mixture containing 1% DSS and HFD was
supplied for 2 weeks, without normal drinking water. The
composition of HFD was 60% fructose, 20.7% casein, 0.3% methionine,
5.0% lard, 9.249% cellulose, 4.5% vitamins and minerals, 0.25%
choline bitartrate, and 0.001% tertiary butylhydroquinone. Each
day, the mice were visually assessed to investigate the presence of
loose stools, blood in the feces or decreased mobility, the latter
considered the disease activity index (DAI) score, to evaluate the
clinical activity. The DAI scores were determined based on the
following criteria: Changes in body weight, stool consistency and
fecal occult blood or visible bleeding. These parameters were
assessed on a scale of 0-4 (20-22). The colon tissues were fixed in 10%
formalin, embedded in paraffin, and stained with hematoxylin and
eosin to evaluate the pathological activity. The pathological score
was used to evaluate the histological activity (23). In addition, a section of the colon
tissue was stored at -80°C in order to analyze the gene expression.
All animals were housed under standard conditions (in a
24°C-controlled environment with a 12-h light/dark cycle) and
received humane care in compliance with the institutional
guidelines. The present study was approved by the institutional
Animal Care and Use Committees of Kagoshima University (Kagoshima,
Japan) and was performed in accordance with the Committees'
guidelines for animal experiments.
ELISA for fecal fructose
The feces of the mice that were fed SC (Group C) and
those fed with the HFD (Group F) were collected; 10 µg of
feces from each group was diluted in 400 µl of distilled
water and the level of fructose in the feces was measured using an
EnzyChrom Fructose Assay kit (cat. no. EFRU-100; BioAssay Systems
LLC, Hayward, CA, USA), a Bio-Rad iMark Microplate Reader and the
Microplate Manager software program v6 (Bio-Rad Laboratories, Inc.,
Hercules, CA, USA).
RNA isolation and the gene expression
assay
Total RNA (0.5 µg) was reverse transcribed
using a PrimeScript RT Reagent kit (Takara Bio Inc., Otsu, Japan)
at 37°C for 15 min and 85°C for 5 sec. Each reaction mixture for RT
(total volume 20 µl) consisted of total RNA (adjusted to 500
ng, 2.5 µl), oligo dT PCR primer (50 µM, 1
µl), 5X PrimeScript buffer (4 µl), PrimeScript RT
enzyme mix (1 µl), random 6 mers (100 µM, 1
µl) and RNase free distilled H2O (10.5
µl). The synthesized cDNA was amplified by RT-qPCR using
SYBR® Premix Ex Taq™ II (Takara Bio Inc.). Each reaction
mixture for PCR (total volume 20 µl) consisted of cDNA
(adjusted to 500 ng, 2 µl), forward and reverse PCR primer
(10 µM, 0.8 µl each), SYBR Premix Ex Taq II (10X, 10
µl), ROX reference dye (50X, 0.4 µl) and distilled
H2O (6 µl). The cycling conditions were as
follows: One cycle at 95°C for 30 sec followed by 35 cycles each at
95°C for 5 sec and 60°C for 34 sec. Data were collected and
analyzed using the ABI Prism software program v2.3 (Applied
Biosystems; Thermo Fisher Scientific, Inc., Waltham, MA, USA). The
following primers were used: Mouse interleukin
(IL)-1β, IL-10, IL-6, transforming
growth factor-β (TGF-β), tumor necrosis factor-α
(TNF-α), GAPDH, occludin, claudin-1 and zonula
occludens-1 (ZO-1) from Takara Bio Inc., and Sigma-Aldrich;
Merck KGaA (Darmstadt, Germany), listed in Table I, and human occludin, claudin-1
and ZO-1 (Table II).
 | Table IPrimers for reverse transcription
polymerase chain reaction analysis for mice. |
Table I
Primers for reverse transcription
polymerase chain reaction analysis for mice.
| Gene | Forward (5′-
3′) | Reverse (5′-
3′) |
|---|
| IL-1β |
TCCAGGATGAGGACATGAGCAC |
GAACGTCACACACCAGCAGGTTA |
| IL-10 |
GCCAGAGCCACATGCTCCTA |
GATAAGGCTTGGCAACCCAAGTAA |
| IL-6 |
CCACTTCACAAGTCGGAGGCTTA CC |
AGTTTGGTAGCATCCATCATTTC |
| TGF-β |
GTGTGGAGCAACATGTGGAACTCTA |
TTGGTTCAGCCACTGCCGTA |
| TNF-α |
TATGGCCCAGACCCTCACA |
GGAGTAGACAAGGTACAACCCAT |
| Occludin |
GAGTTAACGTCGTGGACCGGTATC |
CTGCCTTAGCAGTTTCAGTTTGGAG |
| ZO-1 |
CGGTTCATGGCCTCTGAATCTATAA C |
ATTTCTGAAACCATCAAGTCCACA |
| Claudin-1 C |
TTAATTAGTGAGCTTGGGCAAAGG |
CTCATGCAACATAGGCAGGACA |
| GAPDH |
TGTGTCCGTCGTGGATCTGA |
TTGCTGTTGAAGTCGCAGGAG |
| Table IIPrimers for reverse
transcription-polymerase chain reaction analysis for human
cells. |
Table II
Primers for reverse
transcription-polymerase chain reaction analysis for human
cells.
| Gene | Forward 5′-3′ | Reverse 5′-3′ |
|---|
| Occludin |
TCCAATGGCAAAGTGAATGA |
GCAGGTGCTCTTTTTGAAGG |
| ZO-1 |
TGAGGCAGCTCACATAATGC |
GGTCTCTGCTGGCTTGTTTC |
| Claudin-1 CC |
GTTGGCATGAAGTGTATG |
CCAGTGAAGAGAGCCTGACC |
| GAPDH |
GAGTCAACGGATTTGGTCGT |
TTGATTTTGGAGGGATCTCG |
Western blot analysis
The HT-29 cells were exposed to fructose (0, 0.01,
0.1, 1 or 10 mM), and total protein was extracted from the cells
using RIPA buffer (Sigma-Aldrich; Merck KGaA). The cell lysates
were analyzed for protein content using a Lowry Assay (Bio-Rad
Laboratories, Inc.). Cell lysates containing equal quantities of
protein (10 µg) from each group were separated on 10% SDS
polyacrylamide gels (Wako Pure Chemical Industries, Ltd.) and
electroblotted onto polyvinylidene fluoride membranes. (Bio-Rad
Laboratories, Inc.). Following blocking overnight at 4°C with 5%
non-fat milk, the blots were probed with primary antibodies for 1 h
at room temperature. The membranes were then incubated with the
following primary antibodies: Anti-occludin antibody (1:1,000; cat.
no. 71-1500; Invitrogen; Thermo Fisher Scientific, Inc.),
anti-claudin 1 antibody (1:1,000; cat. no. ab15098; Abcam,
Cambridge, MA, USA), anti-ZO-1 antibody (1:1,000; cat. no.
40-2200; Thermo Fisher Scientific, Inc.), and β-actin antibody
(1:1,000; cat. no. 4970; Cell signaling Technology, Inc., Danvers,
MA, USA). The membranes were washed with Tris buffered saline
(Bio-Rad Laboratories, Inc.) with 0.1% Tween-20 (Wako Pure Chemical
Industries, Ltd.) three times. Following incubation with
horseradish peroxidase-conjugated secondary antibodies (1:1,000;
cat. no. 7074; Cell Signaling Technology, Inc.) for 1 h at room
temperature, the membrane was visualized for the reaction using
electrogenerated chemiluminescence western blotting detection
reagents (GE Healthcare Life Sciences, Shanghai, China). Expression
level quantification was performed using Image J v1.48 (National
Institutes of Health, Bethesda, MD, USA), and β-actin was used as
an internal control.
Extraction of DNA from fecal samples and
the determination of the intestinal bacteria composition
DNA was extracted from fecal samples and standard
strains using ISOFECAL for Beads Beating (Nippon Gene Co., Ltd.,
Tokyo, Japan) for quantification by RT-qPCR analysis. First, 20
µg of feces was diluted in 200 µl of distilled water.
The standard strains were used for each group: Bifidobacterium
longum JCM 1217 for the Bifidobacterium group, 06TCa19
for the Lactobacillus group, Clostridium coccoides
JCM 1395 for the C. coccoides group, and Bacteroides
fragilis JCM 11019 for the Bacteroides-Prevotella group.
The Bifidobacterium subspecies and the C. coccoides,
Bacteroides-Prevotella and Lactobacillus groups were
detected using SYBR-Green RT-qPCR analysis. The following primers
were used (Sigma-Aldrich; Merck KGaA): Bifidobacterium
longum, Lactobacillus, C. coccoides,
Bacteroides fragilis (Table
III). Gene quantification was performed using an ABI Prism 7700
sequence detection system (Applied Biosystems; Thermo Fisher
Scientific, Inc.). To determine the total bacteria count, fecal
samples were stained with 4′,6-diamidino-2-phenylindole solution
(Dojindo Molecular Technologies, Inc., Kumamoto, Japan), and the
bacteria were counted using a hemocytometer for bacteria (AS ONE
Corporation, Osaka, Japan) under a fluorescence microscope (Carl
Zeiss AG, Oberkochen, Germany).
| Table IIIPrimers for reverse transcription
polymerase chain reaction analysis for bacteria. |
Table III
Primers for reverse transcription
polymerase chain reaction analysis for bacteria.
| Gene | Forward 5′-3′ | Reverse 5′-3′ |
|---|
|
Lactobacillus group |
AGCAGTAGGGAATCTTCCA |
CACCGCTACACATGGAG |
|
Bifidobacterium group |
TCGCGTCYGGTGTGAAAG |
CCACATCCAGCRTCCAC |
| C.
coccoides |
AAATGACGGTACCTGACTAA C |
TTTGAGTTTCATTCTTGCGAA |
|
Bacteroides-Prevotella group |
GAAGGTCCCCCACATTG |
CAATCGGAGTTCTTCGTG |
Cell culture
The human HT-29 colon cancer cell line (European
Collection of Cell Cultures, no. EC910722201) was obtained from
Dainippon Sumitomo Pharma Biomedical (Osaka, Japan) and maintained
at 37°C in 5% CO2 and McCoy's 5A medium supplemented
with 10% heat-inactivated fetal bovine serum (Gibco; Thermo Fisher
Scientific, Inc.), streptomycin, and penicillin.
Paracellular permeability assay
The epithelial permeability to macromolecules was
determined using fluorescein isothiocyanate (FITC)-dextran. The
1.5×10⁵ cells/well of HT-29 cells were seeded on the
upper chamber with 8-µm pores and cultured until they
reached full confluence in monolayers. The cells in the upper
chamber were exposed to fructose (0.001, 0.01, 0.1, 1 or 10 mM) and
then incubated with FITC-dextran (5 mg/ml) for 24 h at 37°C in a
CO2 incubator. The fluorescence of FITC-dextran in the
lower chambers was sequentially measured following exposure to
fructose (0, 0.5 and 1 h) 24 h at 37°C in a CO2
incubator. The data were calculated as follows: Apparent
permeability (cm/s) = (rate of change in cumulative mass of FITC
transferred to lower chamber)/[(surface area of cell culture
insert) × (initial concentrations of radio-labeled substances)]
(24). This assay was conducted
five times.
LDH assay
An LDH Cytotoxicity Detection kit was used (Takara
Bio, Inc.) to examine the cytotoxicity of fructose towards HT-29
cells that were exposed to various concentrations of fructose (0,
0.001, 0.01, 0.1, 1 or 10 mM) for 0.5, 1 or 2 h. An ELISA was
performed using a Bio-Rad iMark Microplate Reader and the
Microplate Manager software program (Bio-Rad Laboratories, Inc.).
This LDH assay was conducted five times.
Statistical analysis
All data are expressed as the mean ± standard error
of the mean. Differences between two groups were analyzed using the
Mann-Whitney U test. Differences among multiple groups were
compared using the Kruskal-Wallis test and one-way analysis of
variance (IBM SPSS v23.0; IBM Corp., Armonk, NY, USA). P<0.05
was considered to indicate a statistically significant
difference.
Results
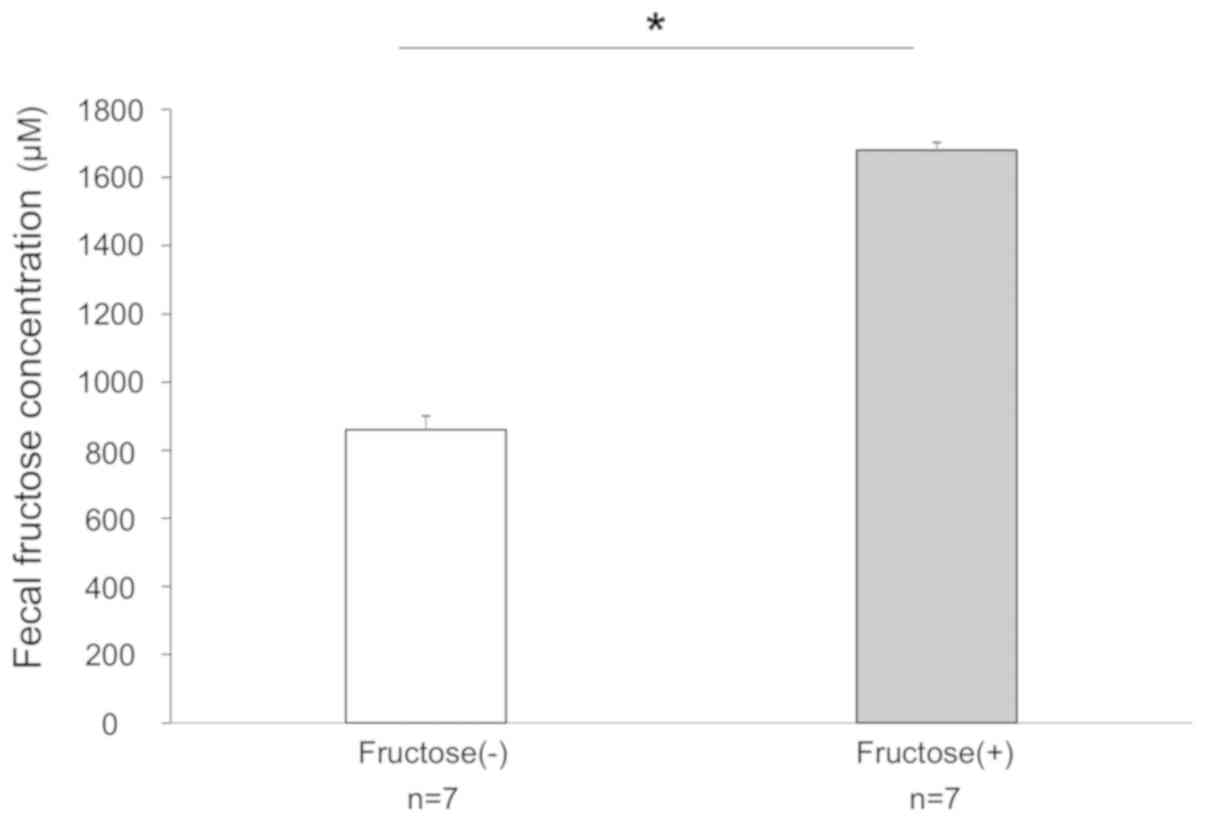
Fecal concentrations of fructose in
mice
First, the fecal concentrations of fructose were
measured and the results of Groups C and F were compared using an
ELISA following 14 days of feeding with normal chow and an HFD,
respectively. The median concentrations of fructose in Groups C and
F were 864 and 1,679 µM, respectively. The level of fructose
in the stools of Group F was significantly higher than that in
Group C (Fig. 1).
HFD affects body weight and aggravates
DSS-induced colitis
No significant difference in the rates of body
weight change were found among Groups C, D and F; however, the rate
of body weight change in Group F tended to be lower compared with
those in Groups C and D. The rate of body weight change in Group FD
was significantly decreased compared with that in the other groups
on day 14 (Fig. 2A). The colon
length in Group FD was significantly shorter than in the other
groups (Fig. 2B). In addition,
the pathological and DAI scores of Group FD were significantly
increased compared with those of Groups C, D and F; furthermore,
the scores of Group F were significantly increased compared with
those of Group C (Fig. 2C and D).
On pathological examination of the colon, mild inflammatory cell
infiltration was observed in the mucosal layer, whereas the
epithelial cells were normal in Group F. In Group FD, the mucosa
was broken by erosion or ulcers, and infiltration of inflammatory
cells into the submucosal layer was observed (Fig. 2E).
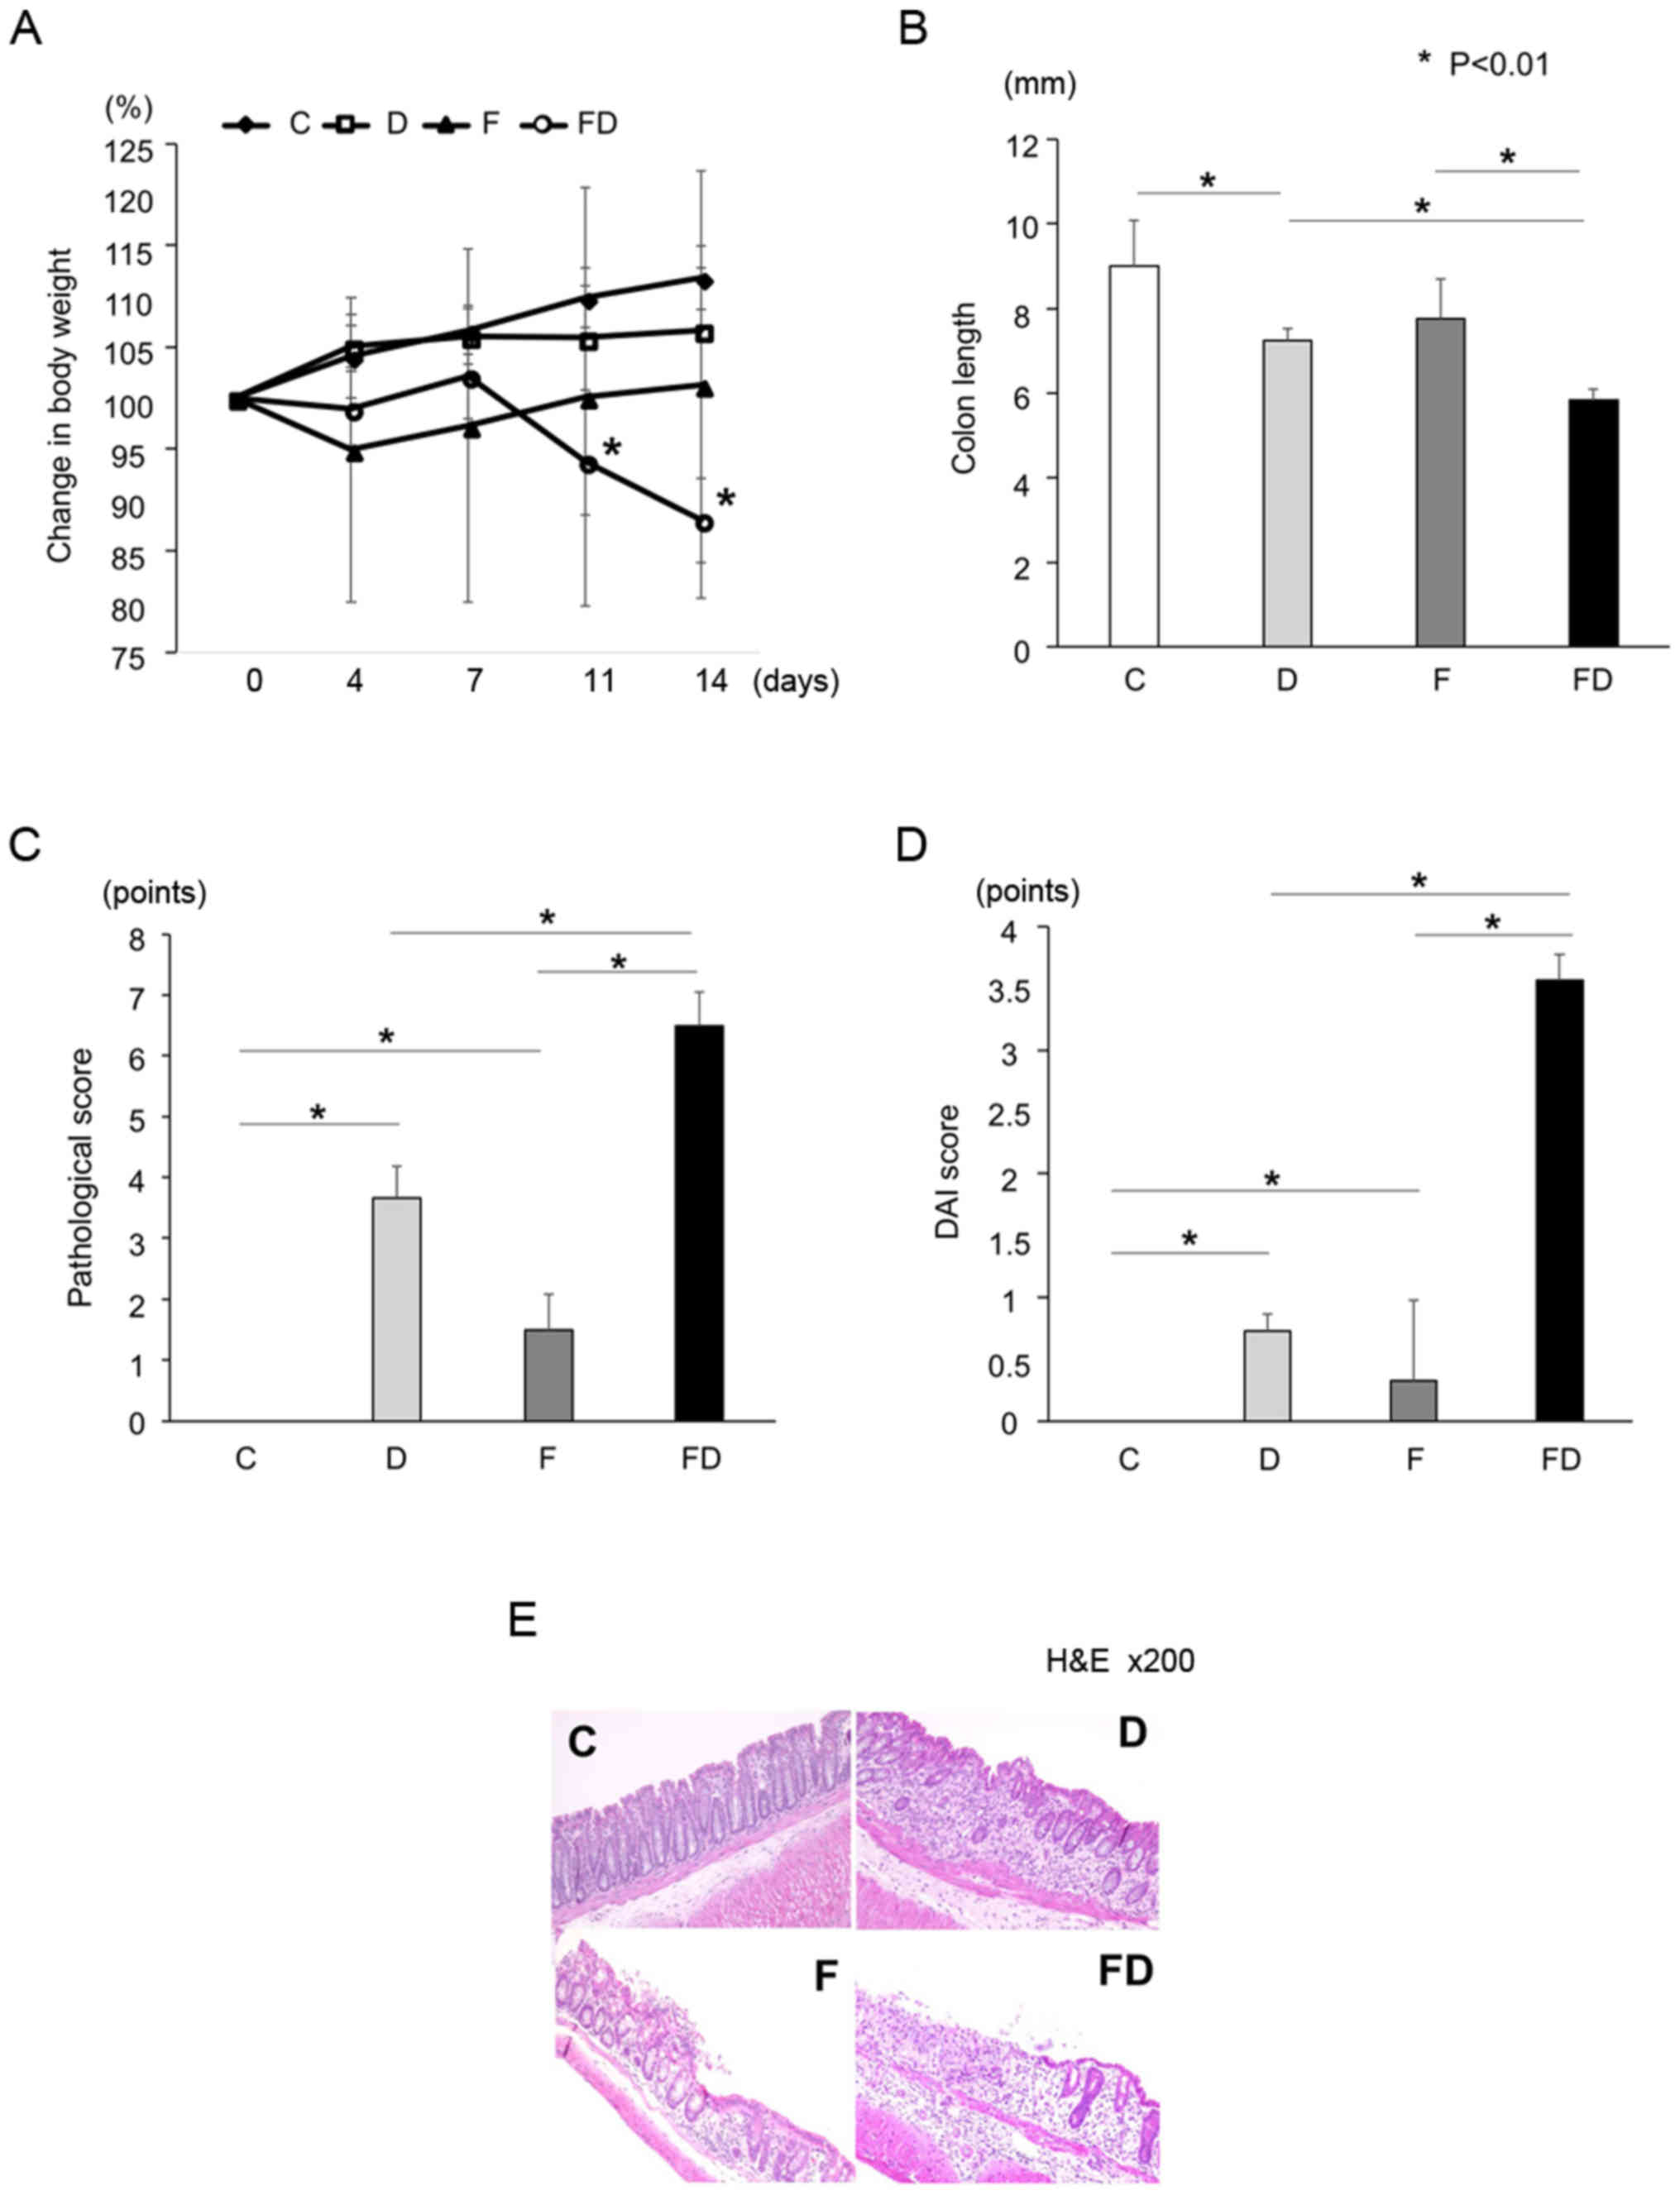 | Figure 2Mice were allocated into four groups:
Standard chow and normal water (Group C, n=7); standard chow and
water containing DSS (Group D, n=10); a high fructose diet + normal
water (Group F, n=7); and a high fructose diet + water containing
DSS (Group FD, n=10). *P<0.01. (A) Rate of body
weight change. The body weight of Group FD was significantly
decreased compared with that of Group D (*P<0.01).
(B) Colon length of each group. The colon of Group FD was
significantly shorter compared with the other groups. (C)
Pathological scores of each group. The scores of Groups F and FD
were significantly increased compared with that of Group C. (D) DAI
scores of each group. The scores of Groups F and FD were
significantly increased compared with that of Group C. (E)
Pathological examinations of the colon in each group. In Group F,
mild inflammatory cell infiltration was observed in the mucosal
layer, although the epithelial cell was normal. Erosion or ulcers,
and infiltration of inflammatory cells into the submucosal layer
was observed in Groups D and FD. In particular, severe intestinal
inflammation was observed in Group FD. Kruskal-Wallis and one-way
analysis of variance was used for statistical analysis. DAI,
disease activity index; H&E, hematoxylin and eosin. |
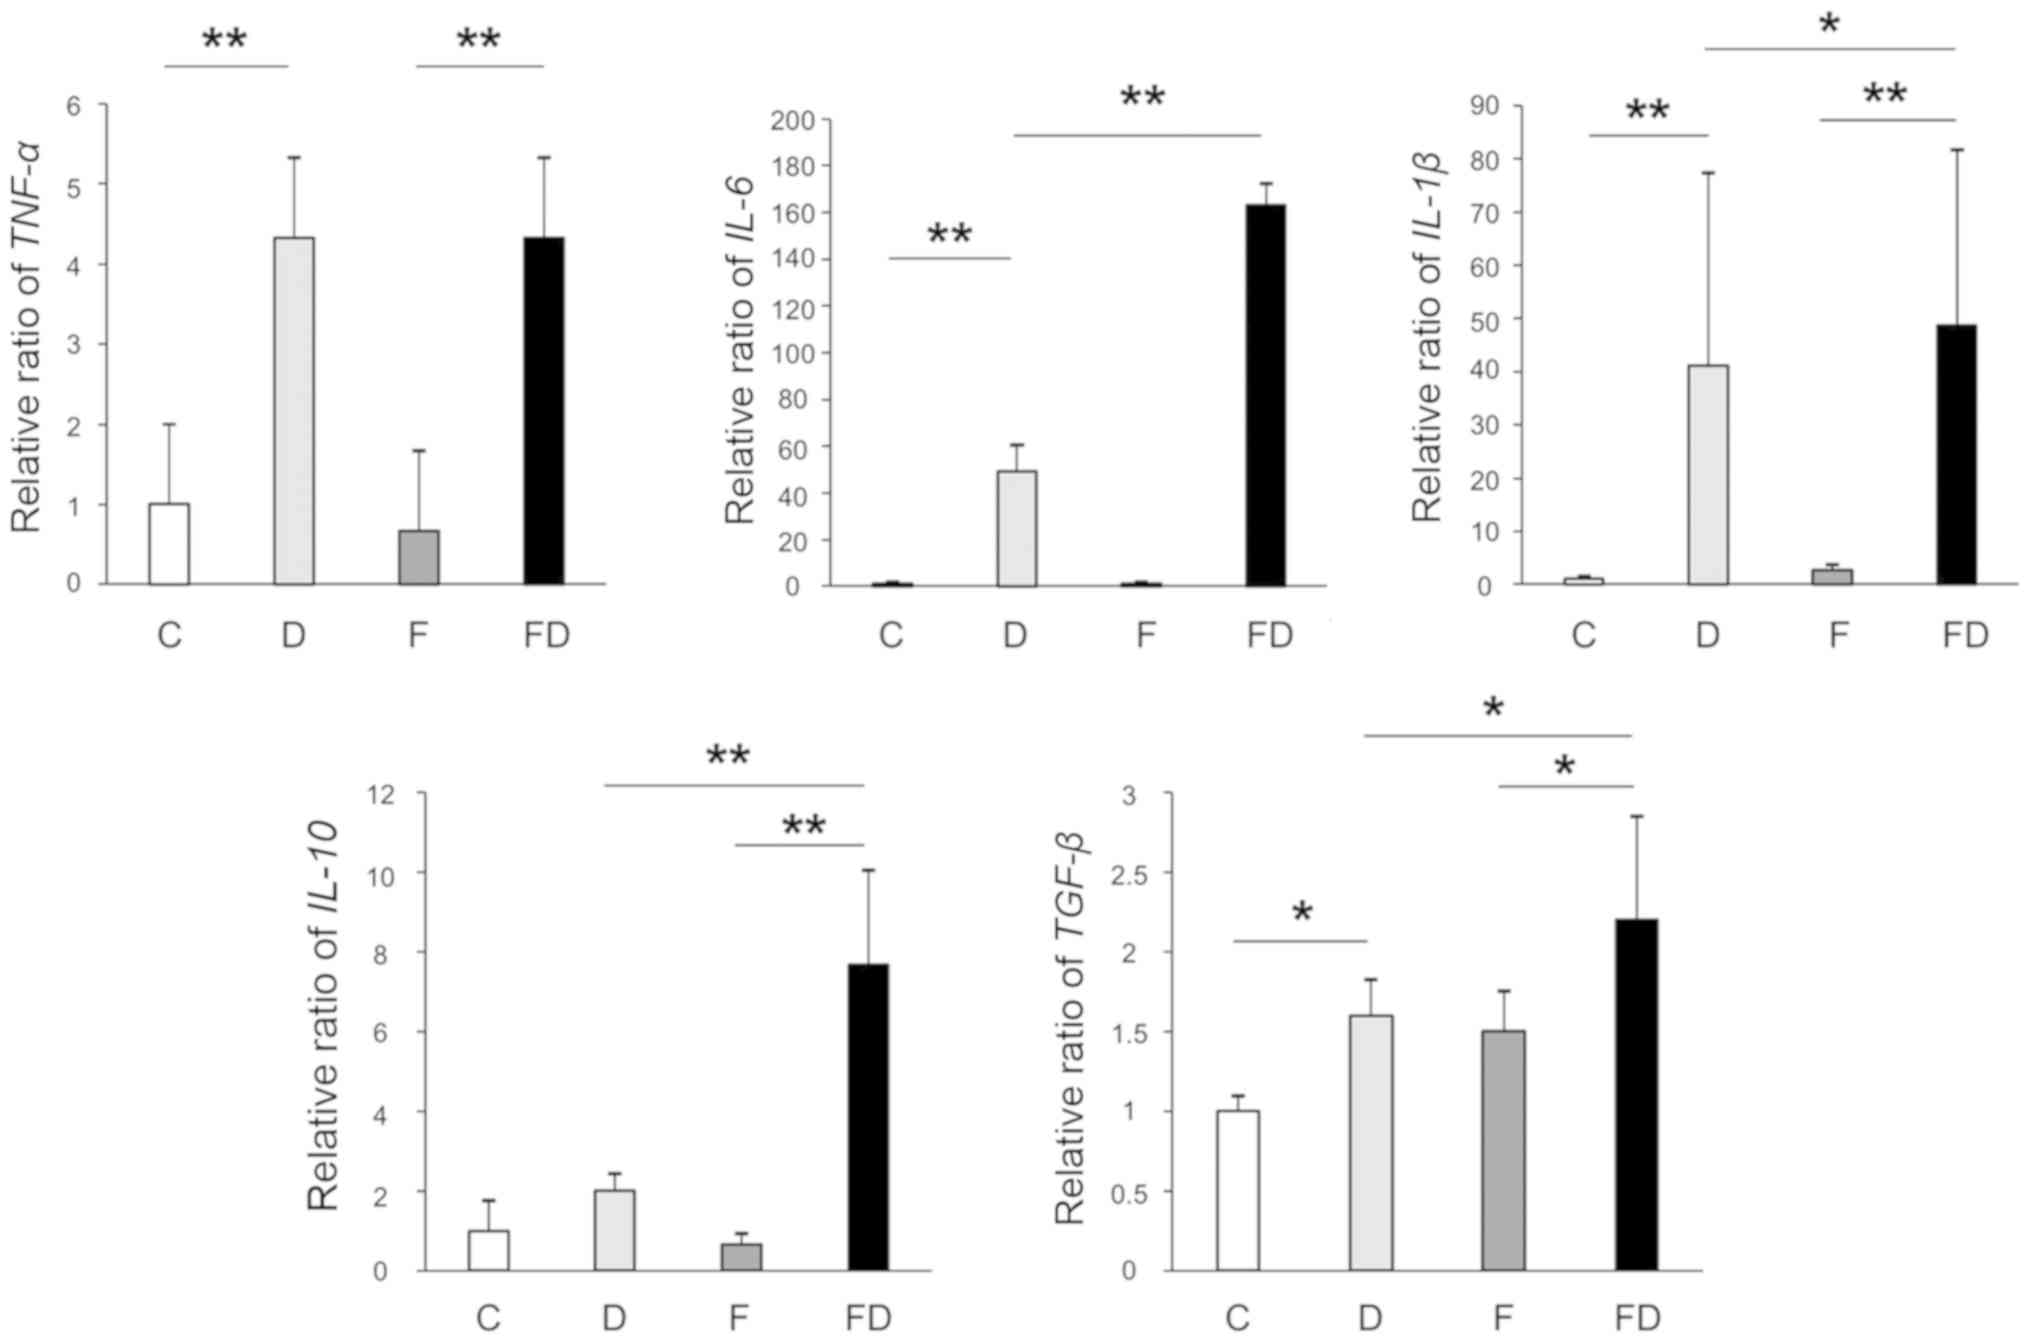
Excessive intake of fructose induces the
expression of inflammatory cytokines in mice
The gene expression levels of TNF-α,
IL-6 and IL-1β in Groups D and FD were significantly
increased compared with those in Group C. The gene expression
levels of IL-6 and IL-1β in Group FD were
significantly increased compared with those in Group D; however,
the expression of TNF-α in Groups D and FD did not differ to
a statistically significant extent. The gene expression levels of
IL-10 and TGF-β in Group FD were significantly
increased compared with those in Group D (Fig. 3).
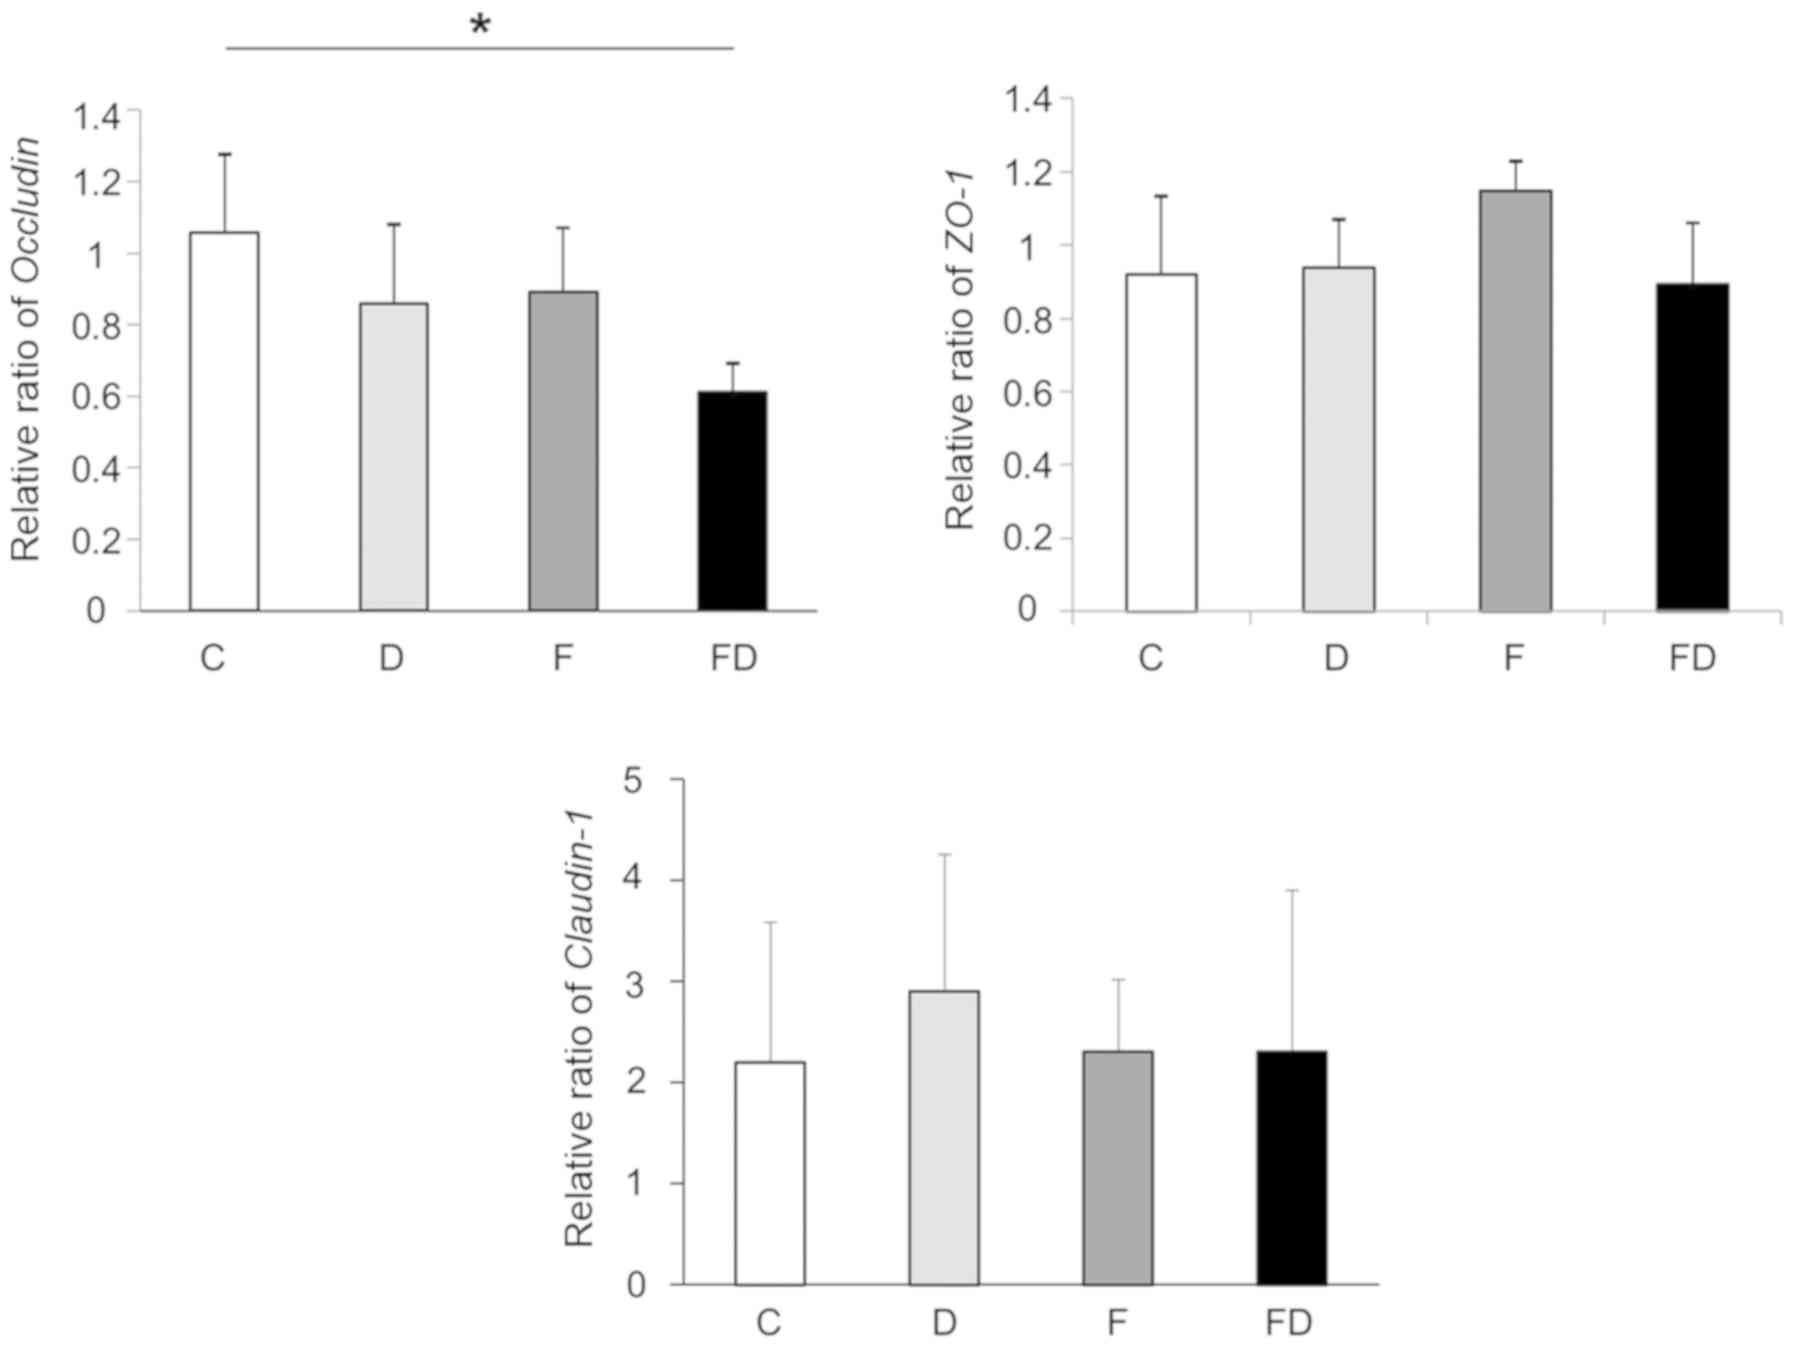
Impact of an excessive fructose intake on
the tight-junctions of the mouse intestine
The expression of occludin in Group F was decreased
compared with that in Group C. The expression of occludin in Group
FD was significantly decreased compared with that in Group C.
Otherwise, the expression levels of ZO-1 and claudin-1 in
the large intestine of these groups did not differ to a
statistically significant extent (Fig. 4).
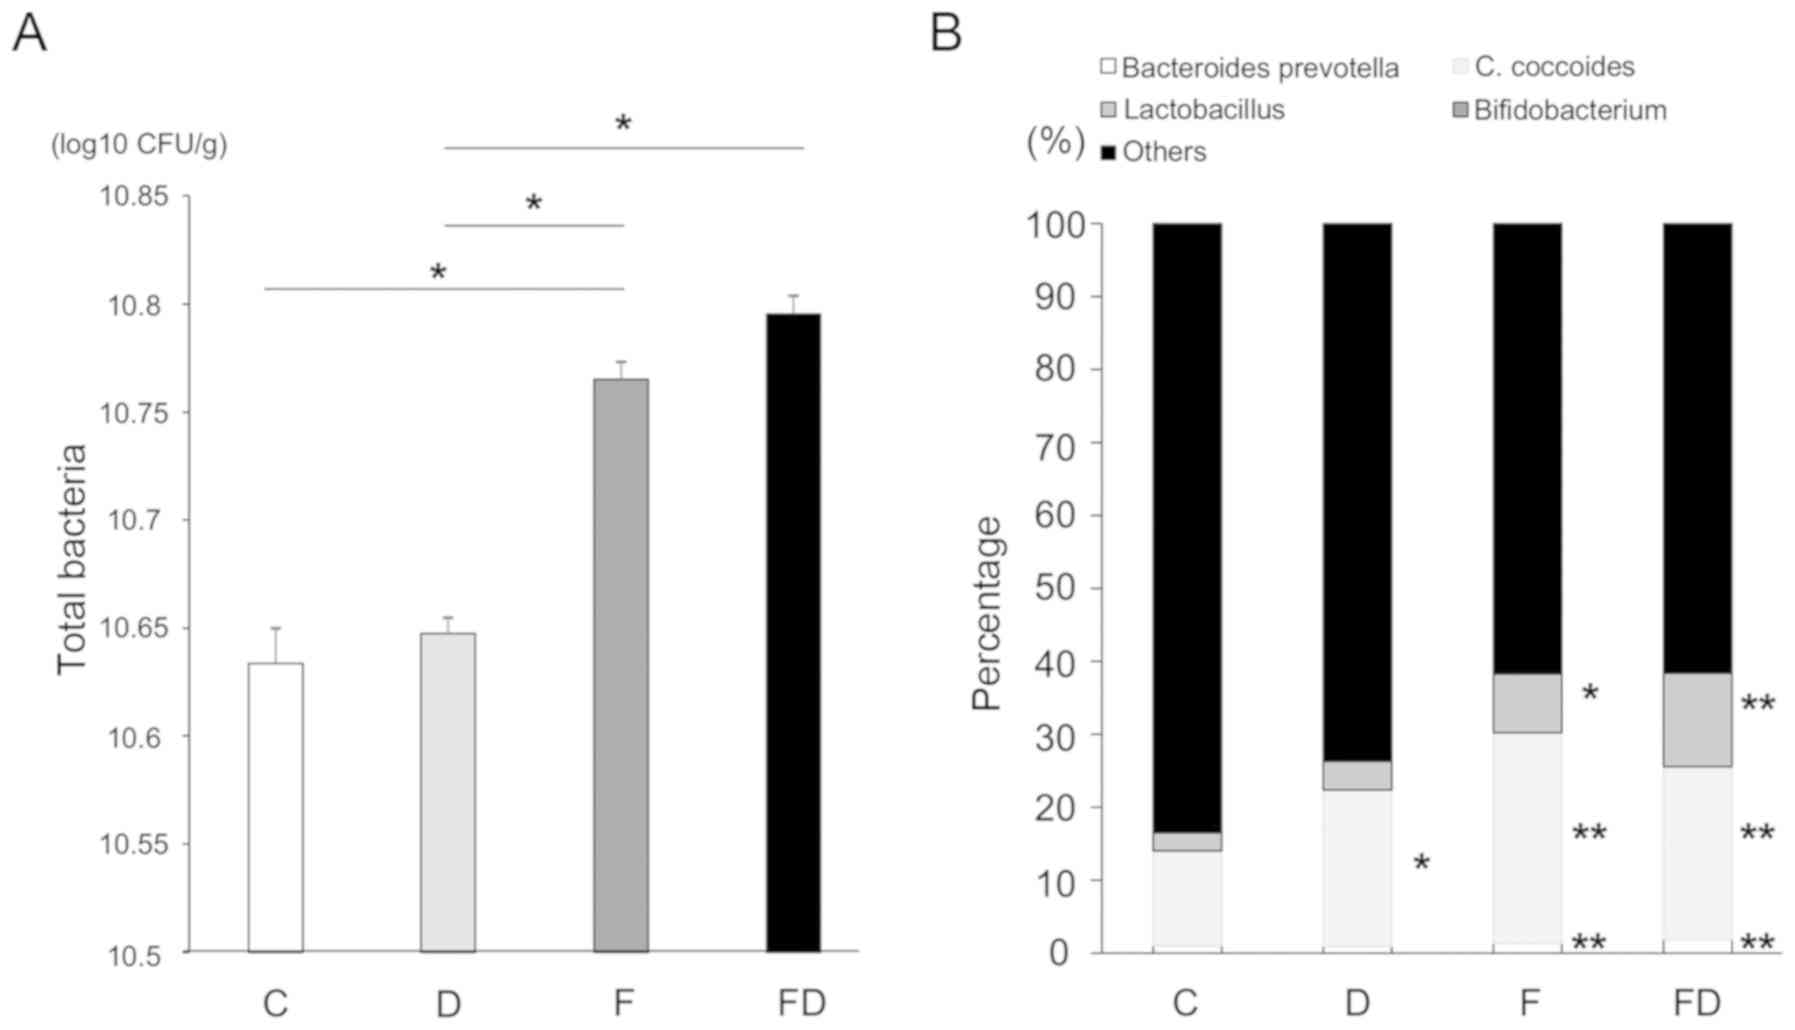
Excessive fructose intake alters the
numbers and proportions of intestinal bacteria
The numbers of intestinal bacteria, including the
Lactobacillus group, Bifidobacterium group, C.
coccoides group and Bacteroides-Prevotella in each of
the groups were measured. The total numbers of bacteria in the
colon of Group F and FD were increased compared with those of
Groups C and D. The total counts in each group were as follows:
Group C, 4.3×10¹⁰ CFU/ml; Group D, 4.4×10¹⁰
CFU/ml; Group F, 5.8×10¹⁰ CFU/ml; and Group FD,
6.2×10¹⁰ CFU/ml (Fig.
5A). The counts (and percentages) of
Bacteroides-Prevotella in the four groups were as follows:
Group C, 2.3×10⁸ CFU/ml (1.02%); Group D,
2.2×10⁸ CFU/ml (0.93%); Group F, 6.1×10⁸
CFU/ml (1.59%); and Group FD, 6.2×10⁸ CFU/ml (1.90%).
The counts of C. coccoides were as follows: Group C,
3.0×10⁹ CFU/ml (13.0%); Group D, 5.2×10⁹
CFU/ml (21.48%); Group F, 1.1×10¹⁰ CFU/ml (28.9%); and
Group FD, 7.7×10⁹ CFU/ml (23.72%). The counts of the
Lactobacillus group were as follows: Group C,
5.7×10⁸ CFU/ml (2.5%); Group D, 9.6×10⁸
CFU/ml (3.9%); Group F, 3.0×10⁹ CFU/ml (7.9%); and Group
FD, 4.1×10⁹ CFU/ml (12.7%). Finally, the counts of the
Bifidobacterium group were as follows: Group C,
2.0×10⁷ (0.08%); Group D, 1.0×10⁷ (0.04%);
Group F, 4.1×10⁷ (0.1%); and Group FD,
4.9×10⁷ (0.15%). Excessive fructose intake affected the
numbers and percentages of the Bacteroides-Prevotella group,
C. coccoides, the Lactobacillus group and the
Bifidobacterium group (Fig.
5B).
Fructose decreases the expression of
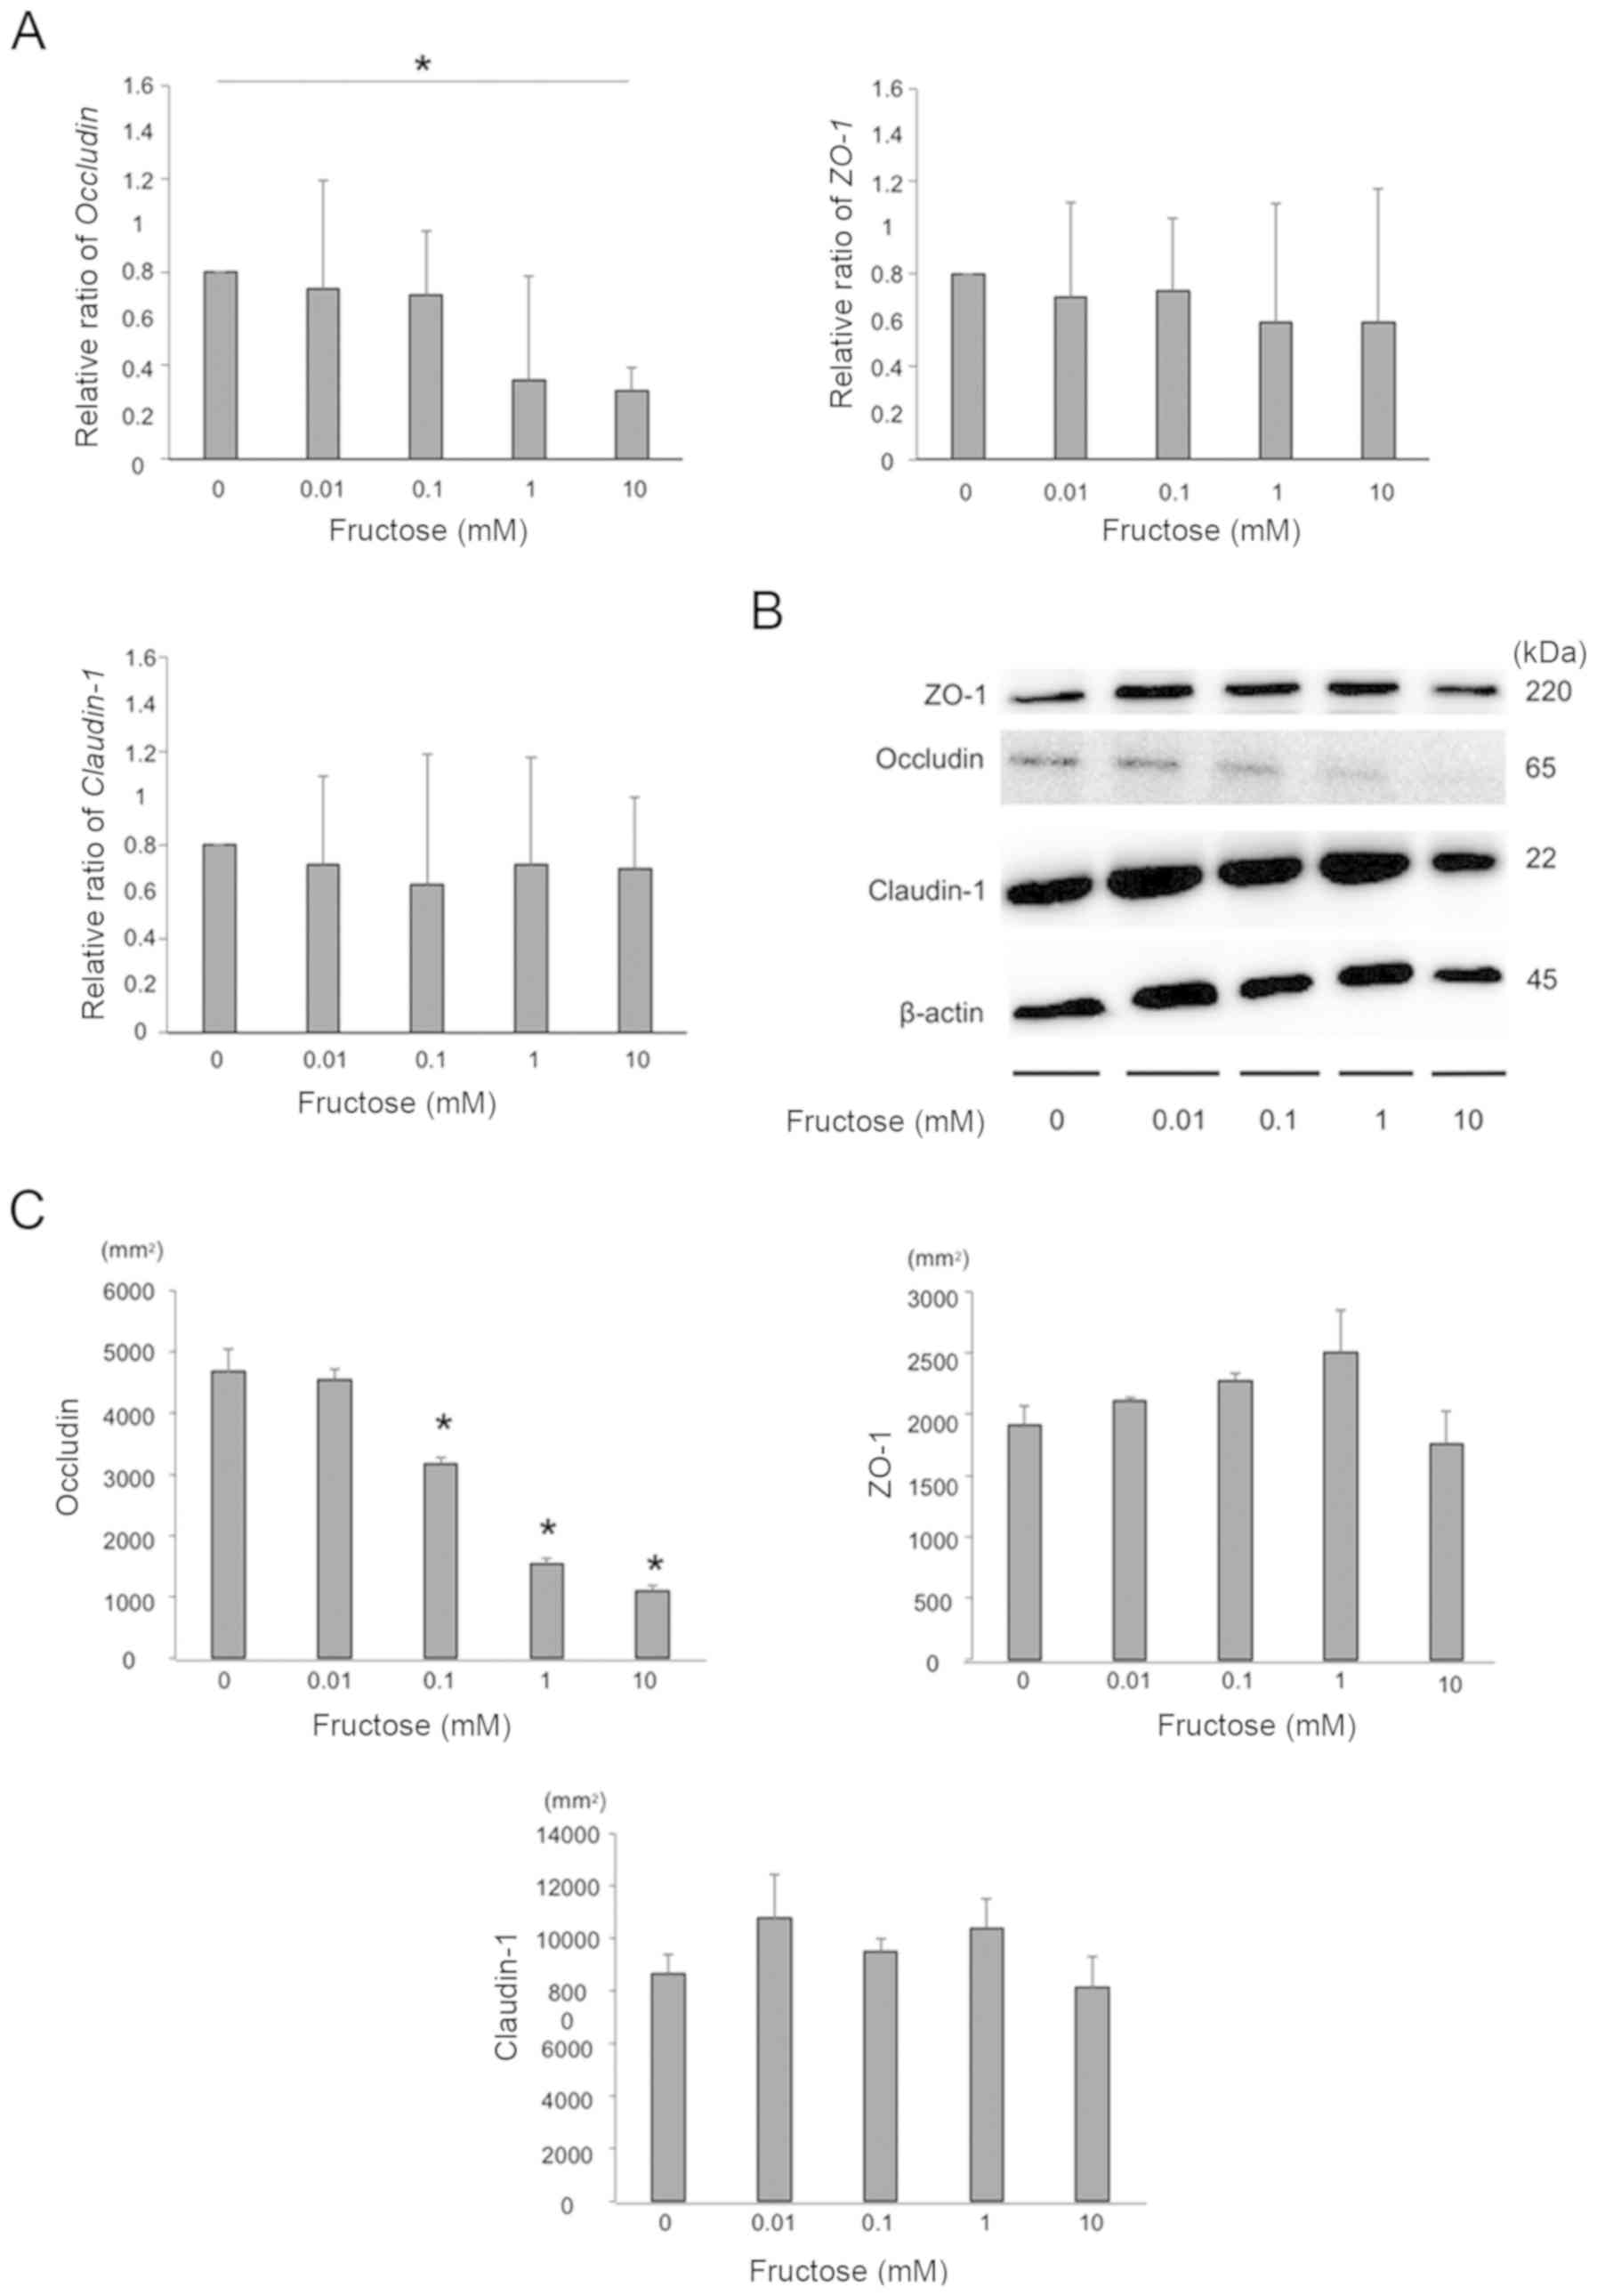
occludin in the HT-29 colon cell line
The gene expression levels of occludin, ZO-1
and claudin-1 of HT-29 cells following exposure to several
concentrations of fructose were measured using RT-qPCR analysis,
and the gene expression of occludin was significantly decreased by
fructose exposure in a dose-dependent manner. The gene expression
of ZO-1 and claudin-1 did not differ in vitro
(Fig. 6A). The expression of
tight junction proteins was also examined by western blotting. The
expression of occludin in HT-29 cells was significantly decreased
by fructose exposure in a dose-dependent manner, whereas no
differences in the expression ZO-1 or claudin-1 were
observed (Fig. 6B and C).
Fructose enhances paracellular
permeability and cytotoxicity in the HT-29 colon cell line
The effect of fructose on paracellular permeability
to macromolecules was examined. The HT-29 cells were exposed to
various concentrations of fructose (0, 0.001, 0.01, 0.1, 1 or 10
mM) for several sequential periods (0, 0.5 or 1 h). Fructose
enhanced the paracellular permeability of the cells in a
concentration- and time-dependent manner (Fig. 7A). Furthermore, the cytotoxicity
of fructose to cells was examined. The HT-29 cells were exposed to
various concentrations of fructose (0, 0.001, 0.01, 0.1, 1 or 10
mM) for several periods (0.5, 1 or 2 h). Fructose injured
epithelial cells in a concentration- and time-dependent manner
(Fig. 7B).
Discussion
The present study showed that excess fructose intake
was cytotoxic in epithelial cells; it reduced the expression of
occludin, a tight junction protein, and impaired intestinal barrier
function, thereby inducing a leaky gut. Furthermore, the
overconsumption of fructose induced the overgrowth of intestinal
bacteria, which was considered to eventually exacerbate colitis in
the mouse model. The present study is the first, to the best of our
knowledge, to reveal the mechanism underlying the impact of
fructose on intestinal inflammation and intestinal barrier function
in the colon.
It was found that fructose increased sensitivity to
DSS, thereby aggravating intestinal inflammation. In order to
investigate the influence of fructose on epithelial cell function
and DSS susceptibility, a colitis model was used in which mice were
administered low concentrations of DSS, which causes relatively
minimal damage to the epithelium. It was shown that, under
conditions of excessive fructose consumption, fructose reached the
colon and affected the intestinal barrier function of epithelial
cells, resulting in increased paracellular permeability. In the
in vivo assays, the pathology and DAI scores in the fructose
intake group (Group F) were significantly increased compared with
those in the control group. Group F demonstrated mild inflammatory
cell infiltration but no increased secretion of TNF-α,
IL-6 or IL-1β in the colon tissue. These results
suggested that the number of infiltrating inflammatory cells was
relatively small, and as whole colon tissue was used for gene
expression analysis, the difference in cytokine expression was not
significant between Groups C and F. The in vitro assays
revealed that fructose exposure increased epithelial permeability
in a time- and concentration-dependent manner. Therefore, the
intake of fructose was associated with the development of a leaky
gut, which resulted in the movement of bacterial antigens (e.g.,
lipopolysaccharides) into the submucosa, leading to the development
of intestinal inflammation. Furthermore, it has been reported that
fructose increases the activation of intestinal macrophages, which
secrete cytokines (25).
Therefore, the excessive intake of fructose may affect intestinal
macrophages, although further investigations are required.
The present study revealed the impact of fructose on
epithelial barrier function in the large intestine. Fructose
decreased the expression of the gene coding for the tight junction
protein occludin and the protein itself, whereas the expression
levels of ZO-1 and claudin-1 were unchanged. A previous
report demonstrated that bacterial products, including ethanol and
acetaldehyde, may cause the loss of occludin and increase
permeability of the intestine in a mouse model of fructose-induced
hepatic steatosis (26). Another
report noted that the intake of fructose was associated with a
marked loss of the tight junction proteins occludin and ZO-1
in the duodenum (27,28). However, the reason why fructose
exposure decreased only small and large intestinal occludin
expression remains to be elucidated. Further investigations are
required to address this question.
Although there was a marginal increase in the fecal
concentration of fructose in the normal diet group (Group C;
Fig. 1), there was no effect on
the colonic epithelium. The main ingredient in the chow fed to the
normal diet group was corn; therefore, following consumption, it
was metabolized to fructose. However, the fecal fructose
concentration in Group C was within normal levels and not be
expected to induce intestinal inflammation.
A previous study demonstrated that fructose had an
impact on bacterial overgrowth (29). The present study confirmed that
excessive fructose intake increased the numbers of certain
intestinal bacteria in the colon. In particular, the ratio of the
Bacteroides-Prevotella group was elevated in the mice that
were fed the HFD (Fig. 5A and B).
Bacteroides is the leading cause of anaerobic bacteremia and
sepsis, and the toxin of this genus contributes to the development
of colitis and intestinal malignancy (30). In addition, a previous study
showed that the Bacteroides group was demonstrated to cause
intestinal inflammation and promoted intestinal permeability in
patients with IBD (31). For
these reasons, the present study focused on the Bacteroides
group. A previous study demonstrated a lower proportion of
Bacteroides species in mice fed an HFD (32), whereas others demonstrated a
marked increase in Bacteroides species in mice fed a
standard diet plus high-fructose syrup (33). It is possible that the composition
of Bacteroides species is affected by the method of fructose
administration, for example, liquid vs. solid formulations.
However, further investigation is required to fully understand the
reasons for alterations in Bacteroides species.
The present study had several limitations. First,
the microbiota were analyzed using RT-qPCR, which was able to
detect the numbers of only four intestinal bacterial species. To
examine the actual influence of fructose on intestinal bacteria, a
metagenomic analysis is required. Second, human subjects with IBD
who consume large quantities of fructose were not analyzed. Future
investigations aim to analyze colon epithelial tight junctions,
inflammatory cytokines and microbiota in this population.
In conclusion, the present study demonstrated that
fructose increased paracellular permeability and was involved in
the overgrowth of intestinal bacteria, thereby inducing intestinal
inflammation. The excessive intake of fructose caused leaky gut
syndrome, exacerbated enteric inflammation, and was considered to
result in the symptoms of IBD.
Funding
The present study was supported by Grants-in-Aid for
Scientific Research from the Ministry of Education, Culture,
Sports, Science and Technology of Japan; and by Grants-in-Aid from
the Ministry of Health, Labour and Welfare of Japan (grant no.
26870459).
Availability of data and materials
All data generated or analyzed during the present
study are included in this published article.
Authors' contributions
Performed the experiments: KK, SK, YM, AT, TM, TF,
SA, ST and SH. Analyzed the data: KK, SK and AI. Contributed
reagents/materials/analysis tools: KK, SK, FS and YN. Wrote the
manuscript: KK, SK, AI. Conceived and designed the experiments: SK
and AI.
Ethics approval and consent to
participate
The present study was approved by the institutional
Animal Care and Use Committees of Kagoshima University, and was
performed in accordance with the Committees' guidelines for animal
experiments.
Patient consent for publication
Not applicable.
Competing interests
The authors declare no conflicts of interest in
association with the present study.
Acknowledgments
Not applicable.
References
|
1
|
Asakura K, Nishiwaki Y, Inoue N, Hibi T,
Watanabe M and Takebayashi T: Prevalence of ulcerative colitis and
Crohn's disease in Japan. J Gastroenterol. 44:659–665. 2009.
View Article : Google Scholar : PubMed/NCBI
|
|
2
|
Podolsky DK: Inflammatory bowel disease
(1). N Engl J Med. 325:928–937. 1991. View Article : Google Scholar : PubMed/NCBI
|
|
3
|
Goldsmith JR and Sartor RB: The role of
diet on intestinal microbiota metabolism: Downstream impacts on
host immune function and health, and therapeutic implications. J
Gastroenterol. 49:785–798. 2014. View Article : Google Scholar : PubMed/NCBI
|
|
4
|
Simrén M and Stotzer PO: Use and abuse of
hydrogen breath tests. Gut. 55:297–303. 2006. View Article : Google Scholar : PubMed/NCBI
|
|
5
|
Gearry RB, Irving PM, Barrett JS, Nathan
DM, Shepherd SJ and Gibson PR: Reduction of dietary poorly absorbed
short-chain carbohydrates (FODMAPs) improves abdominal symptoms in
patients with inflammatory bowel disease-a pilot study. J Crohn's
Colitis. 3:8–14. 2009. View Article : Google Scholar
|
|
6
|
Li YC and Hsieh CC: Lactoferrin dampens
high-fructose corn syrup-induced hepatic manifestations of the
metabolic syndrome in a murine model. PLoS One. 9:e973412014.
View Article : Google Scholar : PubMed/NCBI
|
|
7
|
Assy N, Nasser G, Kamayse I, Nseir W,
Beniashvili Z, Djibre A and Grosovski M: Soft drink consumption
linked with fatty liver in the absence of traditional risk factors.
Can J Gastroenterol. 22:811–816. 2008. View Article : Google Scholar : PubMed/NCBI
|
|
8
|
Walker RW, Dumke KA and Goran MI: Fructose
content in popular beverages made with and without high-fructose
corn syrup. Nutrition. 30:928–935. 2014. View Article : Google Scholar : PubMed/NCBI
|
|
9
|
Jones HF, Butler RN and Brooks DA:
Intestinal fructose transport and malabsorption in humans. Am J
Physiol Gastrointest Liver Physiol. 300:G202–G206. 2011. View Article : Google Scholar
|
|
10
|
Arkan MC, Hevener AL, Greten FR, Maeda S,
Li ZW, Long JM, Wynshaw-Boris A, Poli G, Olefsky J and Karin M:
IKK-beta links inflammation to obesity-induced insulin resistance.
Nat Med. 11:191–198. 2005. View
Article : Google Scholar : PubMed/NCBI
|
|
11
|
Diehl AM, Li ZP, Lin HZ and Yang SQ:
Cytokines and the pathogenesis of non-alcoholic steatohepatitis.
Gut. 54:303–306. 2005. View Article : Google Scholar : PubMed/NCBI
|
|
12
|
Shi H, Kokoeva MV, Inouye K, Tzameli I,
Yin H and Flier JS: TLR4 links innate immunity and fatty
acid-induced insulin resistance. J Clin Invest. 116:3015–3025.
2006. View
Article : Google Scholar : PubMed/NCBI
|
|
13
|
Gäbele E, Dostert K, Hofmann C, Wiest R,
Schölmerich J, Hellerbrand C and Obermeier F: DSS induced colitis
increases portal LPS levels and enhances hepatic inflammation and
fibro-genesis in experimental NASH. J Hepatol. 55:1391–1399. 2011.
View Article : Google Scholar
|
|
14
|
Lírio LM, Forechi L, Zanardo TC, Batista
HM, Meira EF, Nogueira BV, Mill JG and Baldo MP: Chronic fructose
intake accelerates non-alcoholic fatty liver disease in the
presence of essential hypertension. J Diabetes Complications.
30:85–92. 2016. View Article : Google Scholar
|
|
15
|
Mohammed A, Koorbanally NA and Islam MS:
Ethyl acetate fraction of Aframomum melegueta fruit ameliorates
pancreatic β-cell dysfunction and major diabetes-related parameters
in a type 2 diabetes model of rats. J Ethnopharmacol. 175:518–527.
2015. View Article : Google Scholar : PubMed/NCBI
|
|
16
|
Malik VS and Hu FB: Fructose and
cardiometabolic health: What the evidence from sugar-sweetened
beverages tells us. J Am Coll Cardiol. 66:1615–1624. 2015.
View Article : Google Scholar : PubMed/NCBI
|
|
17
|
Tanoue S, Uto H, Kumamoto R, Arima S,
Hashimoto S, Nasu Y, Takami Y, Moriuchi A, Sakiyama T, Oketani M,
et al: Liver regeneration after partial hepatectomy in rat is more
impaired in a steatotic liver induced by dietary fructose compared
to dietary fat. Biochem Biophys Res Commun. 407:163–168. 2011.
View Article : Google Scholar : PubMed/NCBI
|
|
18
|
Wigg AJ, Roberts-Thomson IC, Dymock RB,
McCarthy PJ, Grose RH and Cummins AG: The role of small intestinal
bacterial overgrowth, intestinal permeability, endotoxaemia, and
tumour necrosis factor alpha in the pathogenesis of non-alcoholic
steatohepatitis. Gut. 48:206–211. 2001. View Article : Google Scholar : PubMed/NCBI
|
|
19
|
Brun P, Castagliuolo I, Floreani AR, Buda
A, Blasone L, Palù G and Martines D: Increased risk of NASH in
patients carrying the C(-159)T polymorphism in the CD14 gene
promoter region. Gut. 55:12122006. View Article : Google Scholar : PubMed/NCBI
|
|
20
|
Jin Y, Lin Y, Lin L, Sun Y and Zheng C:
Carcinoembryonic antigen related cellular adhesion molecule 1
alleviates dextran sulfate sodium-induced ulcerative colitis in
mice. Life Sci. 149:120–128. 2016. View Article : Google Scholar : PubMed/NCBI
|
|
21
|
Barnett MP, Dommels YE, Butts CA, Zhu S,
McNabb WC and Roy NC: Inoculation with enterococci does not affect
colon inflammation in the multi-drug resistance 1a-deficient mouse
model of IBD. BMC Gastroenterol. 16:312016. View Article : Google Scholar : PubMed/NCBI
|
|
22
|
Raup-Konsavage WM, Cooper TK and Yochum
GS: A role for MYC in lithium-stimulated repair of the colonic
epithelium after DSS-induced damage in mice. Dig Dis Sci.
61:410–422. 2016. View Article : Google Scholar
|
|
23
|
Park JS, Yi TG, Park JM, Han YM, Kim JH,
Shin DH, Tak SJ, Lee K, Lee YS, Jeon MS, et al: Therapeutic effects
of mouse bone marrow-derived clonal mesenchymal stem cells in a
mouse model of inflammatory bowel disease. J Clin Biochem Nutr.
57:192–203. 2015. View Article : Google Scholar : PubMed/NCBI
|
|
24
|
Eirheim HU, Bundgaard C and Nielsen HM:
Evaluation of different toxicity assays applied to proliferating
cells and to stratified epithelium in relation to permeability
enhancement with glycocholate. Toxicol In Vitro. 18:649–657. 2004.
View Article : Google Scholar : PubMed/NCBI
|
|
25
|
Spruss A, Kanuri G, Stahl C, Bischoff SC
and Bergheim I: Metformin protects against the development of
fructose-induced steatosis in mice: Role of the intestinal barrier
function. Lab Invest. 92:1020–1032. 2012. View Article : Google Scholar : PubMed/NCBI
|
|
26
|
Haub S, Kanuri G, Volynets V, Brune T,
Bischoff SC and Bergheim I: Serotonin reuptake transporter (SERT)
plays a critical role in the onset of fructose-induced hepatic
steatosis in mice. Am J Physiol Gastrointest Liver Physiol.
298:G335–G344. 2010. View Article : Google Scholar
|
|
27
|
Sellmann C, Priebs J, Landmann M, Degen C,
Engstler AJ, Jin CJ, Gärttner S, Spruss A, Huber O and Bergheim I:
Diets rich in fructose, fat or fructose and fat alter intestinal
barrier function and lead to the development of nonalcoholic fatty
liver disease over time. J Nutr Biochem. 26:1183–1192. 2015.
View Article : Google Scholar : PubMed/NCBI
|
|
28
|
Jourdan T, Godlewski G, Cinar R, Bertola
A, Szanda G, Liu J, Tam J, Han T, Mukhopadhyay B, Skarulis MC, et
al: Activation of the Nlrp3 inflammasome in infiltrating
macrophages by endocannabinoids mediates beta cell loss in type 2
diabetes. Nat Med. 19:1132–1140. 2013. View Article : Google Scholar : PubMed/NCBI
|
|
29
|
Bergheim I, Weber S, Vos M, Krämer S,
Volynets V, Kaserouni S, McClain CJ and Bischoff SC: Antibiotics
protect against fructose-induced hepatic lipid accumulation in
mice: Role of endotoxin. J Hepatol. 48:983–992. 2008. View Article : Google Scholar : PubMed/NCBI
|
|
30
|
Choi VM, Herrou J, Hecht AL, Teoh WP,
Turner JR, Crosson S and Bubeck Wardenburg J: Activation of
Bacteroides fragilis toxin by a novel bacterial protease
contributes to anaerobic sepsis in mice. Nat Med. 22:563–567. 2016.
View Article : Google Scholar : PubMed/NCBI
|
|
31
|
Wexler HM: Bacteroides: The good, the bad,
and the nitty-gritty. Clin Microbiol Rev. 20:593–621. 2007.
View Article : Google Scholar : PubMed/NCBI
|
|
32
|
Do MH, Lee E, Oh MJ, Kim Y and Park HY:
High-glucose or -fructose diet cause changes of the gut microbiota
and metabolic disorders in mice without body weight change.
Nutrients. 10:E7612018. View Article : Google Scholar : PubMed/NCBI
|
|
33
|
Mastrocola R, Ferrocino I, Liberto E,
Chiazza F, Cento AS, Collotta D, Querio G, Nigro D, Bitonto V,
Cutrin JC, et al: Fructose liquid and solid formulations
differently affect gut integrity, microbiota composition and
related liver toxicity: A comparative in vivo study. J Nutr
Biochem. 55:185–199. 2018. View Article : Google Scholar : PubMed/NCBI
|