Introduction
The ErbB family of proteins consists of four
receptor tyrosine kinases: ErbB1/human epidermal growth factor
receptor (HER)1/epidermal growth factor receptor (EGFR),
ErbB2/HER2, ErbB3/HER3 and ErbB4/HER4 (1). The overexpression or overactivity of
EGFR has been linked to a number of types of cancer, including lung
cancer, colon cancer, glioblastoma, and head and neck squamous cell
carcinoma (2–5).
A previous study demonstrated that a series of
analogues of emodin, which is an anthraquinone derivative,
exhibited potent antiproliferative activity in three
HER2-overexpressing cell lines, FaDu, HSC3 and OECM1 (6). Following molecular docking
simulation, the results revealed that not all of these compounds
were able to dock into the binding site of the HER2 protein.
However, a number of anthraquinone derivatives, including the
emodin analogues of the previous study, docked into the binding
site of the EGFR protein during a docking simulation, and the
majority of these compounds exhibited similar docking poses within
the EGFR kinase domain. EGFR and HER2 are members of the ErbB
protein family, with the FaDu and OECM1 cell lines being
EGFR+/HER2+ cell lines, and HSC3 being an
EGFR+/EGR2− cell line. It has been indicated
that emodin preferentially suppresses the phosphorylation
activities of HER-2/neu, compared with EGFR, but also that emodin
is also able to suppress the EGF-induced tyrosine phosphorylation
of EGFR at high concentrations (7). In addition, chrysophanic acid, which
is a natural anthraquinone, has been demonstrated to exhibit
antiproliferative activity by inhibiting the EGF-induced
phosphorylation of EGFR and suppressing the activation of
downstream signalling molecules (8). As the 38 compounds in the previous
study had superior antiproliferative activity in the FaDu cell line
than the other two cell lines, the present study aimed to determine
whether these anthraquinone derivatives exhibit potent
antiproliferative activity in EGFR-overexpressing cell lines rather
than HER2-overexpressing cell lines by assessing the
antiproliferative activity of the FaDu cell line.
In the present study, a number of quantitative
structure-activity relationship (QSAR) models were applied in order
to identify the association between the functional groups of
anthraquinone derivatives and their antitumour functions. The
docking simulation indicated the possible docking poses of
anthraquinone derivatives in the EGFR kinase domain.
Materials and methods
Data collection
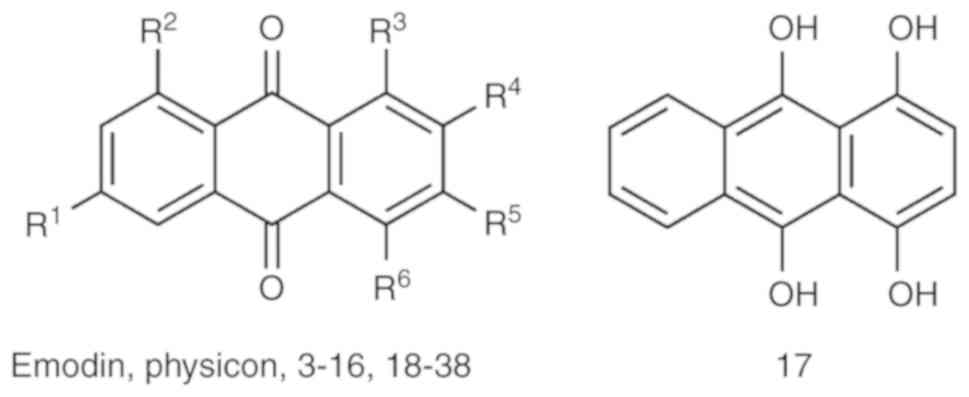
A total of 38 anthraquinone derivatives were
collected as described previously (Fig. 1; Table I) (6). All 38 compounds were drawn using
ChemBioOffice 2010 v12.0 (http://www.cambridgesoft.com/services/), and each
compound was prepared using the Prepare Ligand protocol in
Discovery Studio v2.5 (DS2.5) (Accelrys Software, Inc., San Diego,
CA, USA.) to modify its ionization to the physiological state.
 | Table IpIC50 values of
anthraquinone derivatives in the FaDu cell line. |
Table I
pIC50 values of
anthraquinone derivatives in the FaDu cell line.
| Compound | R1 | R2 | R3 | R4 | R5 | R6 |
pIC50 |
|---|
| Emodin | −OH | −OH | −OH | −H |
−CH3 | −H | 4.33 |
| Physicona | −OMe | −OH | −OH | −H |
−CH3 | −H | 3.46 |
| 3 | −OCOMe | −OCOMe | −OCOMe | −H | −COOH | −H | 3.93 |
| 4 | −OH | −OH | −OH | −H | −COOH | −H | 3.96 |
| 5 | −OCOMe | −OCOMe | −OCOMe | −H |
−CH3 | −H | 4.48 |
| 6 | −OCOEt | −OCOEt | −OCOEt | −H |
−CH3 | −H | 4.45 |
| 7a | −OCOPr | −OCOPr | −OCOPr | −H |
−CH3 | −H | 4.34 |
| 8 | −OCOBu | −OCOBu | −OCOBu | −H |
−CH3 | −H | 4.37 |
| 9 | −OMe | −OMe | −OMe | −H |
−CH3 | −H | 4.41 |
| 10 | −H | −H |
−NH2 |
−NH2 | −H | −H | 3.63 |
| 11 | −H | −H | −H | −COOH | −H | −H | 3.79 |
| 12a | −H | −H | −H |
−CH3 | −H | −H | 4.06 |
| 13a | −H | −H | −H |
−SO3Na | −H | −H | 3.51 |
| 14 | −H | −H |
−SO3Na | −H | −H | −H | 2.64 |
| 15 | −H | −H | −OH | −H | −H | −OH | 4.83 |
| 16a | −H | −H | −OH | −OH | −H | −OH | 4.39 |
| 17a | – | – | – | – | – | – | 5.14 |
| 18 | −H | −H | −NHMe | −H | −H | −NHMe | 3.04 |
| 19 | −H |
−SO3K |
−SO3K | −H | −H | −H | 3.74 |
| 20a | −H | −OH | −OH | −H | −H | −H | 4.83 |
| 21 | −H | −OH | −H | −H | −H | −OH | 4.42 |
| 22 | −OH | −H | −H | −OH− | −H | −H | 3.91 |
| 23 | −H | −H | −OH | −OH | −H | −H | 3.77 |
| 24a |
−NH2 | −H | −H |
−NH2 | −H | −H | 4.38 |
| 25 | −H | −H | −H | −OH |
−NH2 | −H | 4.49 |
| 26 | −H | −H | −H |
−NH2 | −H | −H | 4.44 |
| 27 | −H | −H | −H | −Et | −H | −H | 4.01 |
| 28a | −H | −H |
−NH2 | −H | −H |
−NH2 | 3.81 |
| 29 | −H |
−NH2 | −H | −H | −H |
−NH2 | 4.95 |
| 30 | −H | −H | −NHMe | −H | −H | −H | 4.23 |
| 31 | −H | −H |
−NH2 |
−CH3 | −H | −H | 4.25 |
| 32 | −H | −H |
−NH2 | −H | −H | −H | 4.40 |
| 33 | −H | −H | −OH | −H | −H | −H | 4.40 |
| 34 | −H | −H | −H | −OH | −H | −H | 3.16 |
| 35 | −H | −OCOMe | −OCOMe | −H | −H | −H | 4.65 |
| 36 | −H | −OCOEt | −OCOEt | −H | −H | −H | 4.17 |
| 37a | −H | −OCOPr | −OCOPr | −H | −H | −H | 4.48 |
| 38 | −H | −OCOBu | −OCOBu | −H | −H | −H | 4.40 |
As described previously (6), the efficacy of antitumour activity
was determined using a modified MTT method, and the half maximal
inhibitory concentration (IC50) value was calculated by
linear regression analysis (9).
The FaDu cells (3,000 cells/well) were seeded into 96-well plates
with a vehicle (dimethyl sulfoxide) or various concentrations of 38
test compounds using the dose range of 0–100 µM for 72 h at
37°C (5% CO2). The MTT (5 µg/ml) was added after
70 h of incubation. Subsequently, 40% dimethylformamide and 20%
sodium dodecyl sulphate in H2O was treated as a
solubilisation buffer and added into the wells to dissolve the
violet formazan precipitation overnight at 37°C. A microplate
reader (Molecular Devices, LLC, Sunnyvale, CA, USA) was used to
detect the absorbance at 570 nm, and the linear regression analysis
was performed to calculate the IC50 value. The
IC50 value of the 38 test compounds for FaDu cells was
found to lie between 7.3 µM (compound 17) and 2,285
µM (compound 14).
The X-ray crystal structures of the wild-type and
T790M/L858R (TMLR) mutant EGFR kinase domains were obtained from
the Research Collaboratory for Structural Bioinformatics Protein
Data Bank (PDB ID, 5CAV and 5CAS, respectively; http://www.rcsb.org) (10) for use in the molecular docking
simulation. The protein preparation of each EGFR kinase domain was
performed using the Prepare Protein protocol in DS2.5 to remove
water atoms from the crystals, insert missing atoms in incomplete
residues, protonate the structure of EGFR kinase domain using the
Chemistry at HARvard Macromolecular Mechanics (CHARMM) force field
(11), and optimise the
side-chain conformation of residues with inserted atoms. The
binding site of each EGFR kinase domain was defined as the volume
of co-crystallised inhibitor present in the initial crystal
structure.
2D-QSAR modeling
Multiple linear regression (MLR) and a support
vector machine (SVM) were employed to construct the 2D-QSAR models
using MATLAB R2010b (https://www.mathworks.com/products/matlab.html) and
LibSVM v.2.91 (https://www.csie.ntu.edu.tw/~cjlin/libsvm/) (12), respectively. All 38 compounds were
divided randomly into training and test sets (28 and 10 compounds,
respectively), and their IC50 values were determined as
pIC50 values (−logIC50). The genetic
function approximation (13)
protocol in DS2.5 was employed to identify the suitable molecular
descriptors for the prediction models.
Docking simulation
The docking poses for each compound were calculated
using the LigandFit protocol (14) in DS2.5 using a shape filter and
Monte-Carlo ligand conformation generation, followed by optional
minimisation with the CHARMM force field (11). Similar docking poses of each
compound were filtered using the leader algorithm (15). The optimal docking pose of each
compound was determined according to its interactions with the EGFR
kinase domains and three scoring functions, -PLP1, -PLP2 and -PMF
(16–18), which were evaluated by summing two
types of pairwise interaction, hydrogen bonding (H-bonding) and
steric interactions.
Comparative force field analysis (CoMFA)
and comparative similarity indices analysis (CoMSIA)
CoMFA (19) and
CoMSIA (20) were used on the 28
compounds in the training set to construct 3D-QSAR models using
SYBYL-X v1.1 (http://www.tripos.com). CoMFA, with
the distance-dependent dielectric method, was performed to evaluate
the steric and electrostatic field descriptors using Lennard-Jones
and Coulombic potential energies, respectively. CoMSIA may produce
more stable models than CoMFA, as it was performed with a Gaussian
function based on distance in order to evaluate five
physicochemical parameters (steric, electrostatic and hydrophobic
properties, and H-bond donor and acceptor). The partial
least-squares regression method was used to analyse the 3D-QSAR
models.
Results
2D-QSAR modelling
The chemical scaffolds of the anthraquinone
derivatives are shown in Fig. 1,
and their pIC50 values are listed in Table I. The seven representative
descriptors for building 2D-QSAR models, identified using genetic
function approximation, were 'ES_Count_ssO', 'Num_H_Donors',
'Jurs_FPSA_3′, 'Jurs_RNCS', 'Jurs_RPCS', 'Shadow_XYfrac' and
'Shadow_XZ'.
The 'ES_Count_ssO' descriptor is an
electrotopological state key (21,22) and represents the count of oxygen
atoms with two single bonds. For the 'Num_H_Donors' descriptor,
H-bond donors are defined as heteroatoms (O, N, S and P) with ≥1
attached H atom. The 'Jurs' descriptors (23) combine shape and electronic
information to characterise molecules, by mapping atomic partial
charges on the solvent-accessible surface areas of individual
atoms. The 'Jurs_FPSA_3′ descriptor covers the fractional charged
partial surface areas, which are obtained by dividing the total
charge-weighted positive surface area by the total molecular
solvent-accessible surface area. The 'Jurs_RNCS' and 'Jurs_RPCS'
descriptors report the relative negatively and positively charged
surface areas, respectively. The 'Shadow_XYfrac' and 'Shadow_XZ'
descriptors are shadow indices (24), which calculate the area of the
molecular shadow in the xy- and xz-plane, respectively.
An MLR model was established with the training set
of 28 compounds, using the aforementioned seven descriptors
selected by genetic function approximation, and the test set of 10
compounds was used to evaluate the final MLR model. The equation of
the MLR model was as follows: pIC50 =−5.513 −
0.235 × 'ES_Count_ssO' − 0.895 × 'Num_H_ Donors' + 100.724 ×
'Jurs_FPSA_3′ − 0.078 × 'Jurs_ RNCS' − 0.124 × 'Jurs_RPCS' + 6.406
× 'Shadow_ XYfrac' + 0.058 × 'Shadow_XZ'.
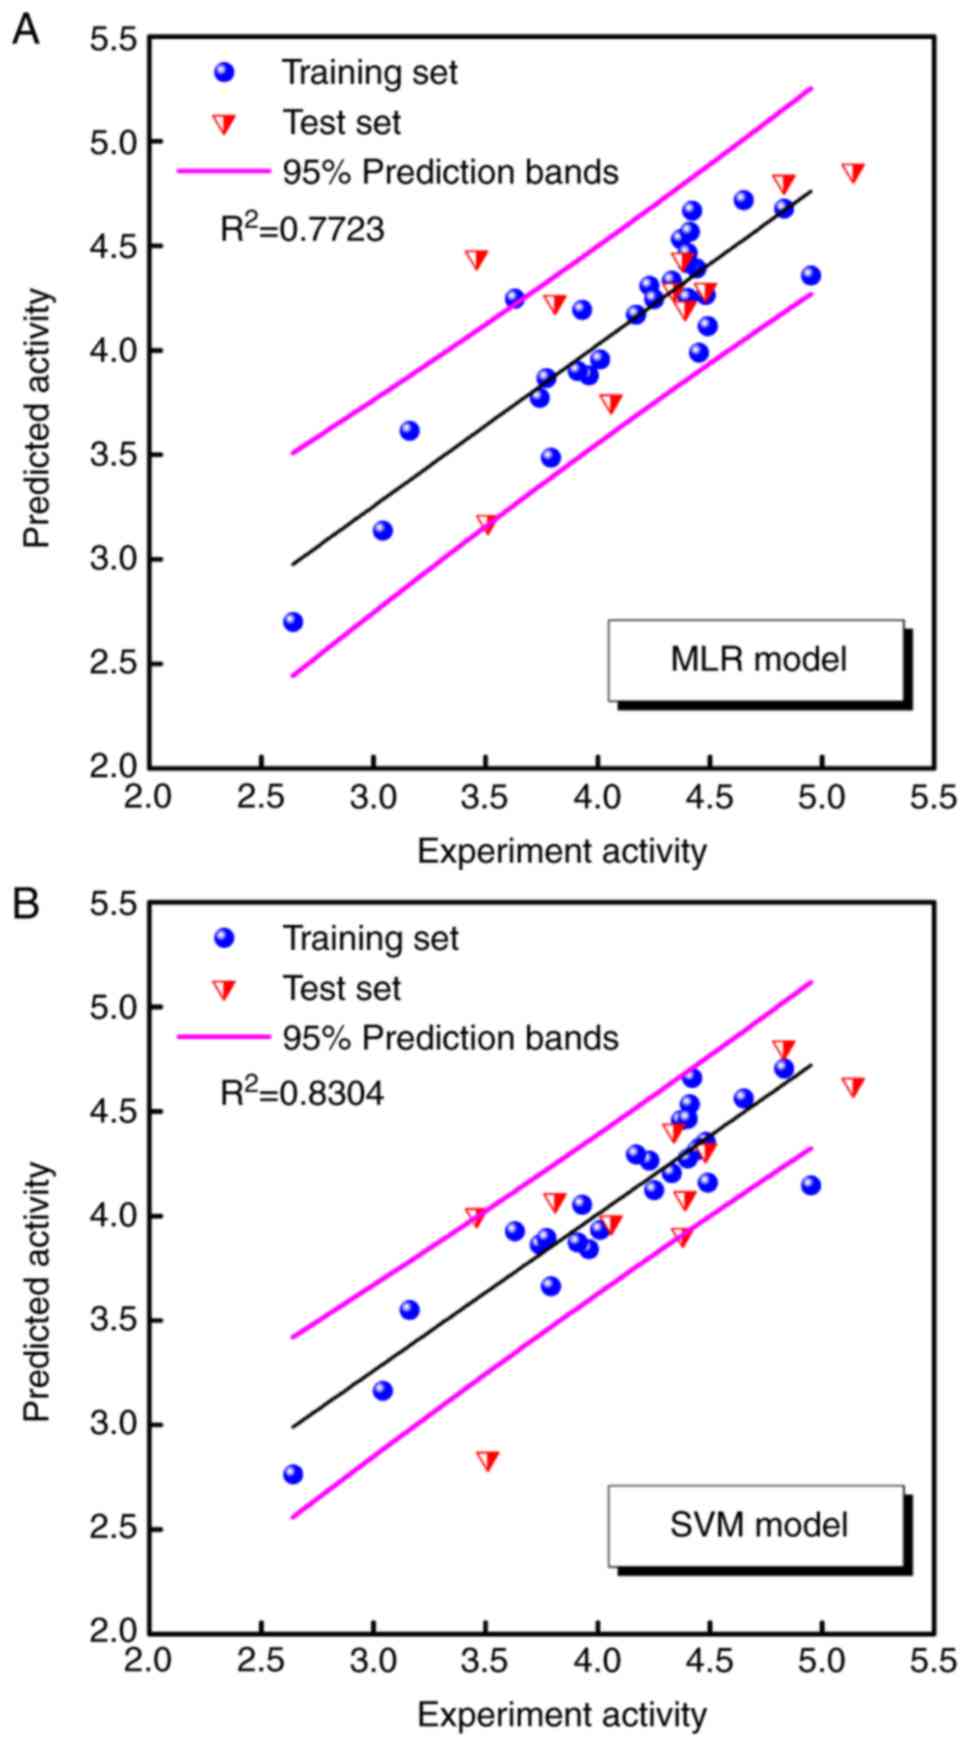
A non-linear SVM model was established with the same
training set and descriptors as the MLR model. The predicted
pIC50 values obtained by the MLR and SVM models
are listed in Table II, and the
correlation between the predicted and experimental
pIC50 values for the two models are shown in
Fig. 2A and B.
| Table IIExperimental and predicted
pIC50 values obtained by the MLR and SVM
models. |
Table II
Experimental and predicted
pIC50 values obtained by the MLR and SVM
models.
| Compound | Experimental
pIC50 | MLR
| SVM
|
|---|
|
pIC50 | Error |
pIC50 | Error |
|---|
| Emodin | 4.33 | 4.33 | 0.00 | 4.21 | −0.12 |
| Physicona | 3.46 | 4.45 | 0.99 | 4.00 | 0.54 |
| 3 | 3.93 | 4.19 | 0.26 | 4.05 | 0.12 |
| 4 | 3.96 | 3.88 | −0.08 | 3.84 | −0.12 |
| 5 | 4.48 | 4.27 | −0.21 | 4.35 | −0.13 |
| 6 | 4.45 | 3.99 | −0.46 | 4.33 | −0.12 |
| 7a | 4.34 | 4.29 | −0.05 | 4.41 | 0.07 |
| 8 | 4.37 | 4.53 | 0.16 | 4.46 | 0.09 |
| 9 | 4.41 | 4.57 | 0.16 | 4.54 | 0.13 |
| 10 | 3.63 | 4.25 | 0.62 | 3.93 | 0.30 |
| 11 | 3.79 | 3.49 | −0.30 | 3.66 | −0.13 |
| 12a | 4.06 | 3.76 | −0.30 | 3.97 | −0.09 |
| 13a | 3.51 | 3.18 | −0.33 | 2.84 | −0.67 |
| 14 | 2.64 | 2.70 | 0.06 | 2.77 | 0.13 |
| 15 | 4.83 | 4.68 | −0.15 | 4.71 | −0.12 |
| 16a | 4.39 | 4.20 | −0.19 | 4.09 | −0.30 |
| 17a | 5.14 | 4.86 | −0.28 | 4.63 | −0.51 |
| 18 | 3.04 | 3.14 | 0.10 | 3.16 | 0.12 |
| 19 | 3.74 | 3.77 | 0.03 | 3.87 | 0.13 |
| 20a | 4.83 | 4.81 | −0.02 | 4.81 | −0.02 |
| 21 | 4.42 | 4.67 | 0.25 | 4.66 | 0.24 |
| 22 | 3.91 | 3.90 | −0.01 | 3.87 | −0.04 |
| 23 | 3.77 | 3.87 | 0.10 | 3.90 | 0.13 |
| 24a | 4.38 | 4.43 | 0.05 | 3.91 | −0.47 |
| 25 | 4.49 | 4.12 | −0.37 | 4.16 | −0.33 |
| 26 | 4.44 | 4.39 | −0.05 | 4.31 | −0.13 |
| 27 | 4.01 | 3.96 | −0.05 | 3.93 | −0.08 |
| 28a | 3.81 | 4.23 | 0.42 | 4.07 | 0.26 |
| 29 | 4.95 | 4.36 | −0.59 | 4.15 | −0.80 |
| 30 | 4.23 | 4.31 | 0.08 | 4.27 | 0.04 |
| 31 | 4.25 | 4.25 | 0.00 | 4.12 | −0.13 |
| 32 | 4.40 | 4.42 | 0.02 | 4.46 | 0.06 |
| 33 | 4.40 | 4.25 | −0.15 | 4.28 | −0.12 |
| 34 | 3.16 | 3.62 | 0.46 | 3.55 | 0.39 |
| 35 | 4.65 | 4.72 | 0.07 | 4.56 | −0.09 |
| 36 | 4.17 | 4.17 | 0.00 | 4.30 | 0.13 |
| 37a | 4.48 | 4.29 | −0.19 | 4.31 | −0.17 |
| 38 | 4.40 | 4.47 | 0.07 | 4.28 | −0.12 |
Docking simulation
The binding sites of the wild-type (PDB ID, 5CAV)
and TMLR mutant (PDB ID, 5CAS) EGFR kinase domains were defined as
the volume of co-crystallised inhibitors present in the initial
crystal structures. A docking simulation was performed to validate
the accuracy of the LigandFit protocol by redocking the
co-crystallised EGFR inhibitor into the binding site of each EGFR
kinase domain. The values of the root-mean-square deviation between
the crystallised structure and the docking pose of the inhibitor
were 0.4706 and 0.4322 for the wild-type and TMLR mutant,
respectively.
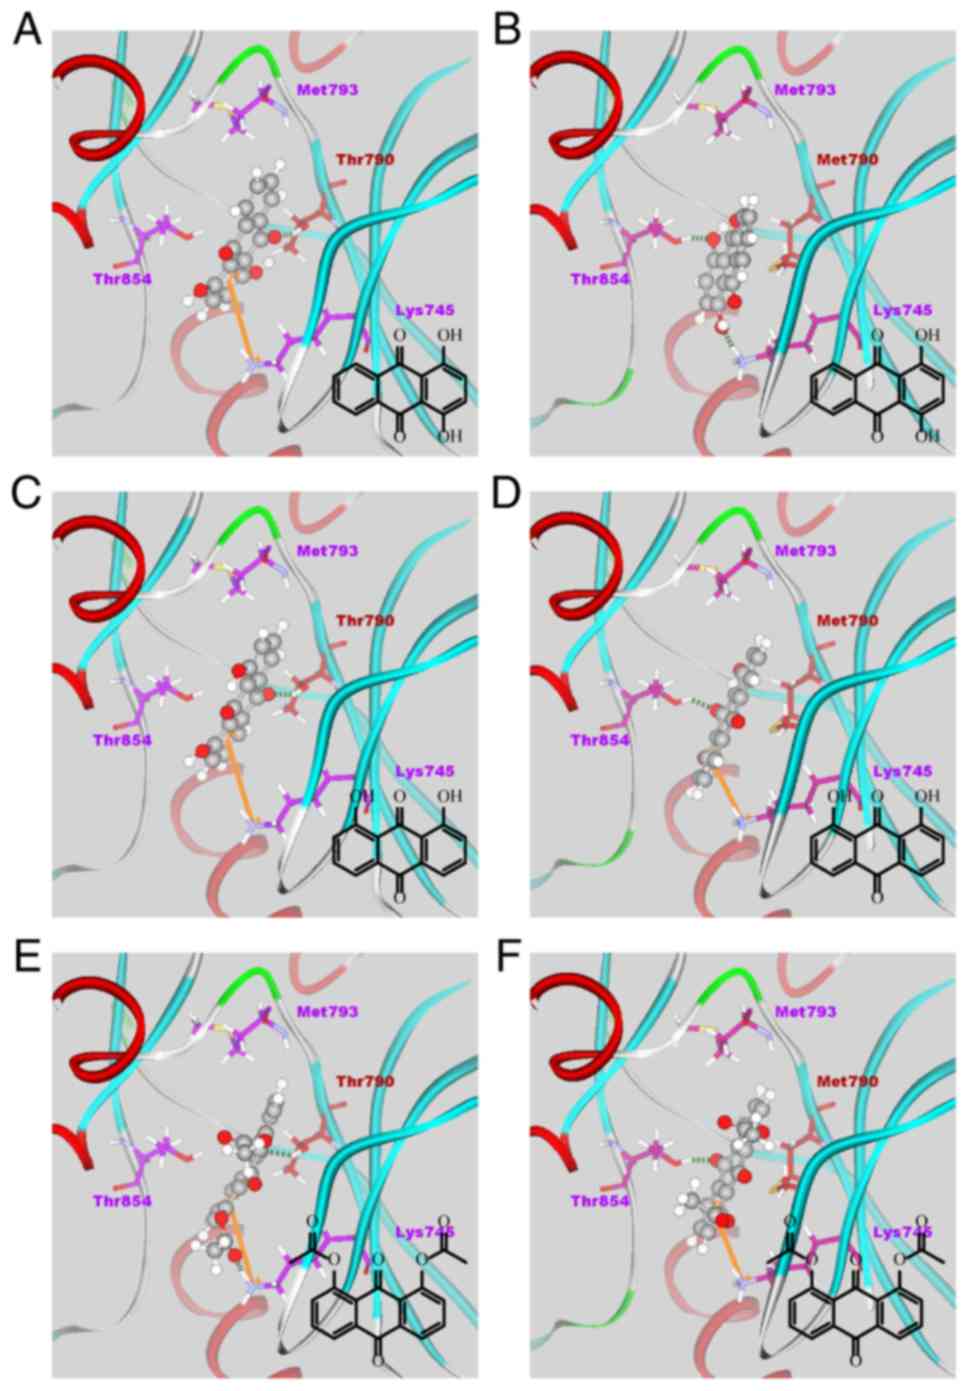
The results of the docking simulations for all 38
anthraquinone derivatives in the binding site of each EGFR kinase
domain are listed in Table III.
The docking poses of three high-affinity compounds, 15, 20 and 35,
in each EGFR kinase domain, are shown in Fig. 3A–F.
| Table IIIScoring functions of each complex
obtained by docking simulation. |
Table III
Scoring functions of each complex
obtained by docking simulation.
| Compound |
pIC50 | 5CAV
| 5CAS
|
|---|
| −PLP1 | −PLP2 | −PMF | −PLP1 | −PLP2 | −PMF |
|---|
| Emodin | 4.33 | 64.62 | 71.20 | 91.21 | 73.07 | 76.99 | 93.72 |
| Physicona | 3.46 | 44.51 | 43.67 | 96.99 | 43.12 | 41.73 | 62.42 |
| 3 | 3.93 | 65.20 | 59.92 | 111.74 | 83.79 | 76.72 | 81.25 |
| 4 | 3.96 | 79.81 | 86.22 | 88.59 | 87.77 | 89.76 | 88.21 |
| 5 | 4.48 | 62.67 | 55.15 | 122.56 | 79.83 | 71.08 | 126.61 |
| 6 | 4.45 | 72.30 | 61.25 | 99.36 | 61.80 | 53.20 | 127.27 |
| 7a | 4.34 | 102.78 | 101.73 | 86.88 | 75.07 | 70.05 | 150.17 |
| 8 | 4.37 | 103.66 | 94.66 | 101.74 | 95.34 | 90.63 | 109.19 |
| 9 | 4.41 | 56.21 | 51.77 | 104.36 | 55.03 | 54.33 | 105.17 |
| 10 | 3.63 | 53.83 | 52.39 | 76.19 | 60.32 | 63.13 | 76.37 |
| 11 | 3.79 | 64.02 | 65.84 | 51.38 | 61.56 | 54.57 | 79.38 |
| 12a | 4.06 | 53.95 | 54.22 | 57.21 | 57.18 | 57.87 | 80.13 |
| 13a | 3.51 | 67.65 | 72.88 | 42.90 | 54.8 | 49.32 | 76.73 |
| 14 | 2.64 | 59.11 | 56.33 | 68.86 | 58.39 | 60.44 | 83.99 |
| 15 | 4.83 | 47.60 | 48.20 | 89.25 | 50.42 | 53.99 | 101.97 |
| 16a | 4.39 | 49.73 | 53.42 | 103.26 | 62.46 | 69.88 | 102.27 |
| 17a | 5.14 | 45.57 | 48.18 | 87.04 | 55.28 | 58.20 | 95.57 |
| 18 | 3.04 | 64.69 | 64.20 | 58.02 | 65.39 | 63.78 | 86.34 |
| 19 | 3.74 | 54.02 | 55.81 | 91.70 | 60.02 | 63.80 | 84.75 |
| 20a | 4.83 | 49.31 | 49.87 | 83.80 | 61.24 | 62.95 | 90.19 |
| 21 | 4.42 | 47.57 | 49.08 | 89.96 | 59.00 | 60.92 | 87.61 |
| 22 | 3.91 | 55.02 | 57.83 | 94.92 | 56.47 | 56.86 | 84.56 |
| 23 | 3.77 | 50.46 | 54.35 | 99.94 | 60.46 | 67.85 | 97.32 |
| 24a | 4.38 | 56.09 | 54.18 | 89.29 | 55.40 | 47.37 | 75.34 |
| 25 | 4.49 | 58.32 | 56.39 | 68.49 | 58.22 | 62.31 | 92.49 |
| 26 | 4.44 | 54.69 | 54.25 | 46.94 | 56.09 | 55.54 | 76.29 |
| 27 | 4.01 | 58.49 | 58.55 | 62.80 | 61.69 | 58.24 | 50.50 |
| 28a | 3.81 | 53.69 | 53.67 | 81.66 | 62.51 | 64.48 | 79.19 |
| 29 | 4.95 | 55.19 | 55.90 | 82.85 | 62.27 | 63.53 | 85.81 |
| 30 | 4.23 | 55.05 | 55.05 | 62.42 | 56.17 | 56.77 | 79.84 |
| 31 | 4.25 | 55.41 | 55.12 | 56.78 | 60.56 | 57.02 | 44.52 |
| 32 | 4.40 | 51.96 | 52.18 | 83.14 | 59.91 | 61.83 | 77.87 |
| 33 | 4.40 | 47.67 | 46.35 | 69.79 | 53.19 | 54.67 | 79.28 |
| 34 | 3.16 | 48.39 | 50.31 | 95.00 | 55.33 | 58.62 | 82.15 |
| 35 | 4.65 | 58.96 | 56.96 | 110.18 | 65.63 | 66.48 | 101.84 |
| 36 | 4.17 | 65.34 | 62.50 | 118.53 | 74.46 | 72.09 | 108.60 |
| 37a | 4.48 | 63.10 | 60.99 | 130.19 | 80.10 | 77.80 | 122.05 |
| 38 | 4.40 | 68.72 | 68.51 | 129.06 | 81.43 | 79.45 | 127.00 |
CoMFA and CoMSIA
In order to identify the association between the
functional groups of the compounds and their bioactivities, the
CoMFA and CoMSIA models were established using the wild-type EGFR
kinase domain (PDB ID, 5CAV). Therefore, the associations between
the bioactivities and five physicochemical parameters (steric,
electrostatic and hydrophobic properties, and H-bond donor and
acceptor) were analysed.
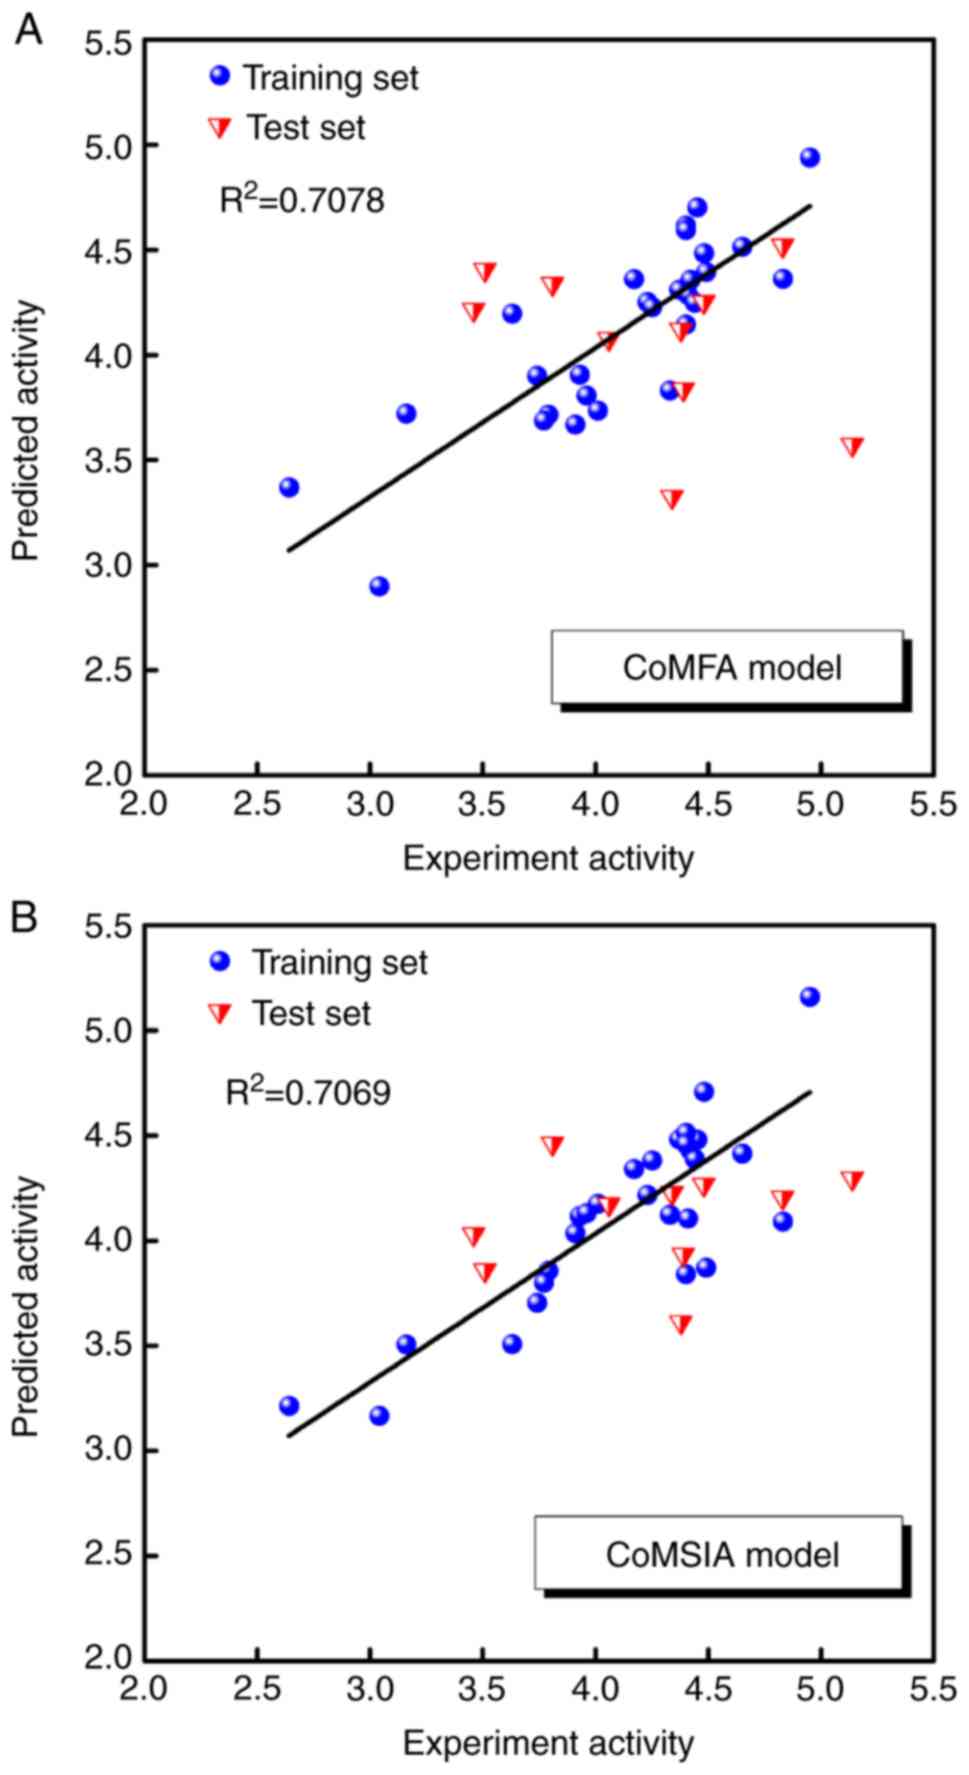
For alignment of the 38 compounds, all were
superimposed according to their docking poses. The predicted
pIC50 values obtained by the CoMFA model using
three components and the CoMSIA model using two components are
listed in Table IV, and the
correlations between the predicted and experimental
pIC50 values of the CoMFA and CoMSIA models are
shown in Fig. 4A and B. The
squared correlation coefficients (R2) values of the
training set were 0.7078 and 0.7069 for the CoMFA and CoMSIA
models, respectively. The results of the CoMFA and CoMSIA models
with high-affinity compound 20 are graphically represented by field
contribution maps in Fig. 5.
| Table IVExperimental and predicted
pIC50 values obtained by the CoMFA and CoMSIA
models for 28 compounds in the training set and 10 compounds in the
test set. |
Table IV
Experimental and predicted
pIC50 values obtained by the CoMFA and CoMSIA
models for 28 compounds in the training set and 10 compounds in the
test set.
| Compound | Experimental
pIC50 | CoMFA
| CoMSIA
|
|---|
|
pIC50 | Error |
pIC50 | Error |
|---|
| Emodin | 4.33 | 3.83 | −0.50 | 3.83 | −0.21 |
| Physicona | 3.46 | 4.22 | 0.76 | 4.22 | 0.57 |
| 3 | 3.93 | 3.91 | −0.02 | 3.91 | 0.19 |
| 4 | 3.96 | 3.81 | −0.15 | 3.81 | 0.17 |
| 5 | 4.48 | 4.49 | 0.01 | 4.49 | 0.23 |
| 6 | 4.45 | 4.70 | 0.25 | 4.70 | 0.03 |
| 7a | 4.34 | 3.33 | −1.01 | 3.33 | −0.11 |
| 8 | 4.37 | 4.31 | −0.06 | 4.31 | 0.11 |
| 9 | 4.41 | 4.29 | −0.12 | 4.29 | −0.30 |
| 10 | 3.63 | 4.20 | 0.57 | 4.20 | −0.12 |
| 11 | 3.79 | 3.72 | −0.07 | 3.72 | 0.07 |
| 12a | 4.06 | 4.08 | 0.02 | 4.08 | 0.11 |
| 13a | 3.51 | 4.41 | 0.90 | 4.41 | 0.35 |
| 14 | 2.64 | 3.37 | 0.73 | 3.37 | 0.58 |
| 15 | 4.83 | 4.36 | −0.47 | 4.36 | −0.74 |
| 16a | 4.39 | 3.84 | −0.55 | 3.84 | −0.46 |
| 17a | 5.14 | 3.57 | −1.57 | 3.57 | −0.84 |
| 18 | 3.04 | 2.90 | −0.14 | 2.90 | 0.13 |
| 19 | 3.74 | 3.90 | 0.16 | 3.90 | −0.03 |
| 20a | 4.83 | 4.52 | −0.31 | 4.52 | −0.62 |
| 21 | 4.42 | 4.36 | −0.06 | 4.36 | 0.01 |
| 22 | 3.91 | 3.67 | −0.24 | 3.67 | 0.13 |
| 23 | 3.77 | 3.69 | −0.08 | 3.69 | 0.03 |
| 24a | 4.38 | 4.12 | −0.26 | 4.12 | −0.77 |
| 25 | 4.49 | 4.40 | −0.09 | 4.40 | −0.62 |
| 26 | 4.44 | 4.25 | −0.19 | 4.25 | −0.05 |
| 27 | 4.01 | 3.74 | −0.27 | 3.74 | 0.17 |
| 28a | 3.81 | 4.34 | 0.53 | 4.34 | 0.65 |
| 29 | 4.95 | 4.94 | −0.01 | 4.94 | 0.21 |
| 30 | 4.23 | 4.25 | 0.02 | 4.25 | −0.01 |
| 31 | 4.25 | 4.23 | −0.02 | 4.23 | 0.13 |
| 32 | 4.40 | 4.62 | 0.22 | 4.62 | 0.11 |
| 33 | 4.40 | 4.15 | −0.25 | 4.15 | −0.56 |
| 34 | 3.16 | 3.72 | 0.56 | 3.72 | 0.35 |
| 35 | 4.65 | 4.52 | −0.13 | 4.52 | −0.23 |
| 36 | 4.17 | 4.36 | 0.19 | 4.36 | 0.17 |
| 37a | 4.48 | 4.25 | −0.23 | 4.25 | −0.21 |
| 38 | 4.40 | 4.60 | 0.20 | 4.60 | 0.06 |
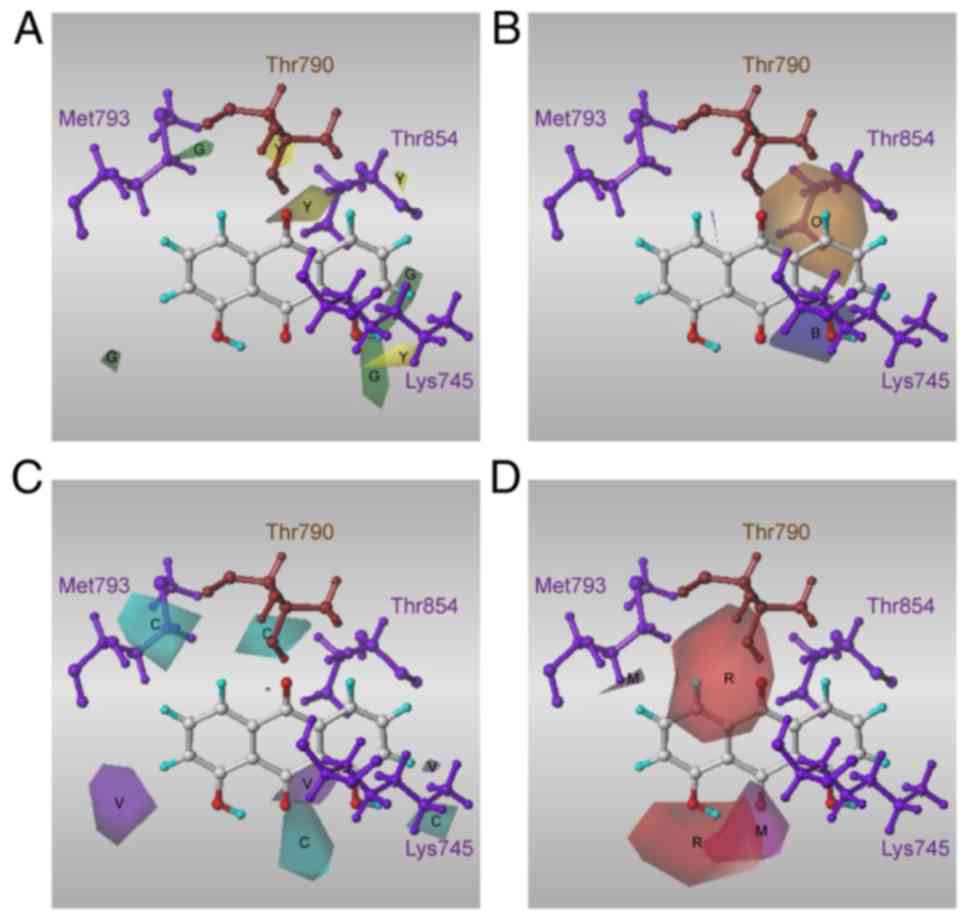
In the CoMFA model (Fig. 5A), the proportions of steric and
electrostatic fields were 100 and 0%, respectively. The favoured
and disfavoured cut-off energies were set at 80 and 20%,
respectively, for the steric field contributions.
In the CoMSIA model (Fig. 5B), the fractions of the
hydrophobicity, H-bond donor and H-bond acceptor fields were 36.0,
43.5 and 20.5%, respectively. The favoured and disfavoured cut-off
energies were set at 80 and 20%, respectively, for the hydrophobic
contributions. For the field contributions of the H-bond donor
properties (Fig. 5C), the
favoured and disfavoured cut-off energies were set at 80 and 20%,
respectively. For the field contributions of the H-bond acceptor
properties (Fig. 5D), the
favoured and disfavoured cut-off energies were set at 85 and 15%,
respectively.
Discussion
2D-QSAR modelling
The majority of the predicted
pIC50 values are within the 95% prediction bands,
and the R2 values for the training set were >0.7, at
0.7723 and 0.8304 in the MLR and SVM models, respectively. The two
models predicted reasonable bioactivities for the anthraquinone
derivatives. The results indicate that the seven representative
descriptors of anthraquinone derivatives are associated with their
antitumour function.
Docking simulation
As shown in Fig.
3, the compounds formed π-cation interactions with the Lys745
residue and an H-bond with Thr790. As the mutation of T790M reduces
the activity of EFGR inhibitors through inhibition of part of their
interaction, in the resistant T790M mutant EGFR, π-cation
interactions or H-bonds with residue Lys745 were present, but the
H-bond between the compounds and Met790 was not. Instead, all three
of the high-affinity compounds formed an H-bond with Thr854.
CoMFA and CoMSIA
As shown in Fig.
5A, part of the favoured steric field was observed close to the
R3 and R4 moieties and some disfavoured
steric field for the R6 moiety was observed towards
Thr790 and Thr854. As shown in Fig.
5B, a favoured hydrophobic field for the R6 moiety
was observed towards Thr854, with some disfavoured hydrophobic
field close to the R3 moieties. As shown in Fig. 5C and 5D, the introduction of an H-bond donor
and acceptor in the region may improve the activity.
In the present study, the MLR and SVM models
indicated seven representative molecular descriptors of
anthraquinone derivatives associated with their antitumour
activities. The docking simulation indicated the possible docking
poses of anthraquinone derivatives binding in the wild-type and
resistant T790M mutant EGFR kinase domain. These compounds formed
π-cation interactions with Lys745 and H-bonds with Thr790, and in
the mutant EGFR kinase domain, H-bonds were formed with Thr854
instead of Met790. The CoMFA and CoMSIA models indicated the
favoured and disfavoured fields for four physicochemical properties
(steric, hydrophobic, H-bond donor, and H-bond acceptor), which may
further improve the antitumour functions. The favoured steric
fields and disfavoured hydrophobic fields were revealed close to
the R3 moieties. The disfavoured steric fields and
favoured hydrophobic fields for the R6 moiety were
observed towards Thr854. As the compounds of the training set used
in QSAR models have similar main scaffolds, those compounds with
different main scaffolds may not fit these models. In addition, the
results of a docking simulation can indicate that these compounds
have suitable docking poses in the EGFR kinase domain, but they
cannot be used to evaluate the antiproliferative activity of
compounds. However, the results suggested the benefit of further
investigations being performed to develop lead compounds with
improved anticancer bioactivity. In future experiments, a series of
analogues may be synthesised by adding larger hydrophilic
substitutes in the R3 or R4 moieties and
small hydrophobic substitutes in the R6 moiety in order
to determine suitable anthraquinone derivatives with superior
anticancer bioactivity against EGFR-overexpressing cell lines.
Funding
The present study was supported by the Ministry of
Science and Technology of Taiwan (grant nos. MOST
105-2320-B-039-032, MOST 106-2320-B-039-011 and MOST
107-2320-B-039-058), China Medical University (grant no.
CMU107-S-33) and the China Medical University Hospital (grant nos.
DMR-107-135, DMR-107-136, DMR-108-108 and DMR-108-142).
Availability of data and materials
All data generated or analysed during this study are
included in this published article.
Authors' contributions
KCC and JCL conceived of and designed the
experiments, performed the experiments, analysed the data and wrote
the manuscript. SHJ performed the MTT assay to determine the
efficacy of the antitumour activity and calculated the
IC50 values. All authors read and approved the final
manuscript.
Ethics approval and consent to
participate
Not applicable.
Patient consent for publication
Not applicable.
Competing interest
The authors declare that they have no competing
interests.
Abbreviations:
|
EFGR
|
epidermal growth factor receptor
|
|
QSAR
|
quantitative structure-activity
relationship
|
|
DS2.5
|
Discovery Studio 2.5
|
|
TMLR
|
T790M/L858R
|
|
CHARMM
|
Chemistry at HARvard Macromolecular
Mechanics
|
|
MLR
|
multiple linear regression
|
|
SVM
|
support vector machine
|
|
H-bond
|
hydrogen bond
|
|
CoMFA
|
comparative force field analysis
|
|
CoMSIA
|
comparative similarity indices
analysis
|
Acknowledgments
Not applicable.
References
|
1
|
Herbst RS: Review of epidermal growth
factor receptor biology. Int J Radiat Oncol Bio Phys. 59:21–26.
2004. View Article : Google Scholar
|
|
2
|
Zhang H, Berezov A, Wang Q, Zhang G,
Drebin J, Murali R and Greene MI: ErbB receptors: From oncogenes to
targeted cancer therapies. J Clin Invest. 117:2051–2058. 2007.
View Article : Google Scholar : PubMed/NCBI
|
|
3
|
Walker F, Abramowitz L, Benabderrahmane D,
Duval X, Descatoire V, Henin D, Lehy T and Aparicio T: Growth
factor receptor expression in anal squamous lesions: Modifications
associated with oncogenic human papillomavirus and human
immunodeficiency virus. Hum Pathol. 40:1517–1527. 2009. View Article : Google Scholar : PubMed/NCBI
|
|
4
|
Lynch TJ, Bell DW, Sordella R,
Gurubhagavatula S, Okimoto RA, Brannigan BW, Harris PL, Haserlat
SM, Supko JG, Haluska FG, et al: Activating mutations in the
epidermal growth factor receptor underlying responsiveness of
non-small-cell lung cancer to gefitinib. N Engl J Med.
350:2129–2139. 2004. View Article : Google Scholar : PubMed/NCBI
|
|
5
|
Kuan CT, Wikstrand CJ and Bigner DD: EGF
mutant receptor vIII as a molecular target in cancer therapy.
Endocr-Relat Cancer. 8:83–96. 2001. View Article : Google Scholar : PubMed/NCBI
|
|
6
|
Liang FP, Lien JC, Wu YH, Chen CS and
Juang SH: Em08red, a dual functional antiproliferative emodin
analogue, is a downregulator of ErbB2 expression and inducer of
intracellular oxidative stress. Drug Des Devel Ther. 9:1499–1510.
2015.PubMed/NCBI
|
|
7
|
Shia CS, Suresh G, Hou YC, Lin YC, Chao PD
and Juang SH: Suppression on metastasis by rhubarb through
modulation on MMP-2 and uPA in human A549 lung adenocarcinoma: An
ex vivo approach. J Ethnopharmacol. 133:426–433. 2011. View Article : Google Scholar
|
|
8
|
Huang Q, Lu G, Shen HM, Chung MC and Ong
CN: Anti-cancer properties of anthraquinones from rhubarb. Med Res
Rev. 27:609–630. 2007. View Article : Google Scholar
|
|
9
|
Lee MS, Cha EY, Sul JY, Song IS and Kim
JY: Chrysophanic acid blocks proliferation of colon cancer cells by
inhibiting EGFR/mTOR pathway. Phytother Res. 25:833–837. 2011.
View Article : Google Scholar
|
|
10
|
Heald R, Bowman KK, Bryan MC, Burdick D,
Chan B, Chan E, Chen Y, Clausen S, Dominguez-Fernandez B, Eigenbrot
C, et al: Noncovalent mutant selective epidermal growth factor
receptor inhibitors: A lead optimization case study. J Med Chem.
58:8877–8895. 2015. View Article : Google Scholar : PubMed/NCBI
|
|
11
|
Brooks BR, Bruccoleri RE, Olafson BD,
States DJ, Swaminathan S and Karplus M: CHARMM: A program for
macromolecular energy minimization and dynamics calculations. J
Comput Chem. 4:187–217. 1983. View Article : Google Scholar
|
|
12
|
Fan R-E, Chen P-H and Lin C-J: Working set
selection using second order information for training support
vector machines. J Mach Learn Res. 6:1889–1918. 2005.
|
|
13
|
Rogers D and Hopfinger AJ: Application of
genetic function approximation to quantitative structure-activity
relationships and quantitative structure-property relationships. J
Chem Inf Comput Sci. 34:854–866. 1994. View Article : Google Scholar
|
|
14
|
Venkatachalam CM, Jiang X, Oldfield T and
Waldman M: LigandFit: A novel method for the shape-directed rapid
docking of ligands to protein active sites. J Mol Graphics
Modelling. 21:289–307. 2003. View Article : Google Scholar
|
|
15
|
Hartigan JA: Clustering Algorithms. John
Wiley & Sons Inc;
|
|
16
|
Gehlhaar DK, Verkhivker GM, Rejto PA,
Sherman CJ, Fogel DB, Fogel LJ and Freer ST: Molecular recognition
of the inhibitor Ag-1343 by Hiv-1 protease-conformationally
flexible docking by evolutionary programmin g. Chem Biol.
2:317–324. 1995. View Article : Google Scholar : PubMed/NCBI
|
|
17
|
Gehlhaar Daniel K, Bouzida D and Rejto
Paul A: Reduced dimensionality in ligand - Protein structure
prediction: Covalent inhibitors of serine proteases and design of
site-directed combinatorial libraries. Ration Drug Des Am Chem Soc.
719:292–311. 1999. View Article : Google Scholar
|
|
18
|
Muegge I and Martin YC: A general and fast
scoring function for protein-ligand interactions: A simplified
potential approach. J Med Chem. 42:791–804. 1999. View Article : Google Scholar : PubMed/NCBI
|
|
19
|
Cramer RD, Patterson DE and Bunce JD:
Comparative molecular field analysis (CoMFA). 1. Effect of shape on
binding of steroids to carrier proteins. J Am Chem Soc.
110:5959–5967. 1988. View Article : Google Scholar : PubMed/NCBI
|
|
20
|
Klebe G, Abraham U and Mietzner T:
Molecular similarity indices in a comparative analysis (CoMSIA) of
drug molecules to correlate and predict their biological activity.
J Med Chem. 37:4130–4146. 1994. View Article : Google Scholar : PubMed/NCBI
|
|
21
|
Hall LH, Mohney B and Kier LB: The
electrotopological state: Structure information at the atomic level
for molecular graphs. J Chem Inf Comput Sci. 31:76–82. 1991.
View Article : Google Scholar
|
|
22
|
Hall LH and Kier LB: The E-state as the
basis for molecular structure space definition and structure
similarity. J Chem Inf Comput Sci. 40:784–791. 2000. View Article : Google Scholar : PubMed/NCBI
|
|
23
|
Stanton DT and Jurs PC: Development and
use of charged partial surface area structural descriptors in
computer-assisted quantitative structure-property relationship
studies. Anal Chem. 62:2323–2329. 1990. View Article : Google Scholar
|
|
24
|
Rohrbaugh RH and Jurs PC: Descriptions of
molecular shape applied in studies of structure/activity and
structure/property relationships. Analytica Chimica Acta.
199:99–109. 1987. View Article : Google Scholar
|