Introduction
Glioblastoma multiforme (GBM) is an aggressive
carcinoma that was first described in 1800 (1). According to the World Health
Organisation classification of tumours of the central nervous
system (CNS), GBM is classified as a grade IV malignant glial
neoplasm with astrocytic differentiation (2). As one of the most commonly diagnosed
malignant CNS tumours, it accounts for 45.6% of primary malignant
brain tumours, with an annual incidence of 3.1 cases per 100,000
individuals in the United States (3). GBM is considered to be one of the
most malignant primary intracranial tumours and has a dismal
prognosis, <5% of patients surviving 5 years after diagnosis
(3). Even after microsurgery and
adjuvant temozolomide-based radiochemotherapy or radiotherapy
alone, the prognosis of patients remains poor, with a median
survival of 14 months (4). In
recent years, clinical trials of angiogenesis inhibitor therapies
have been performed on patients with recurrent GBM; however, no
survival benefit was achieved (5). Furthermore, a randomised phase III
clinical trial of epidermal growth factor receptor (EGFR) variant
III-targeted drugs failed to confirm any survival benefit compared
with the control group (6).
Therefore, searching for novel candidate genes and studying the
underlying mechanisms driving tumourigenesis are important to
generate new therapeutic targets.
The development of microarray and high-throughput
sequencing technology has provided new methods for investigating
the molecular mechanisms underlying tumour behaviour and for
screening drug targets. In 2012, the Chinese Glioma Genome Atlas
(CGGA) was built, which provides genomic and clinical data for
hundreds of samples that have been examined by whole-genome
sequencing, whole-exome sequencing, DNA methylation microarray
detection, as well as microRNA (miRNA), circular RNA, long
non-coding RNA (lncRNA) and mRNA sequencing (7). This database represents a landmark
achievement in glioma research in China.
Weighted gene co-expression network analysis (WGCNA)
is a powerful method for describing the correlations among genes
using microarray or RNA sequencing data. WGCNA can be applied to
search for candidate biomarkers or therapeutic targets, as well as
phenotype-associated modules or gene clusters based on
co-expression networks (8).
Compared with other analytical methods, WGCNA has the advantage of
summarising and standardising the methods and functions in the R
software package. Currently, this systematic method is widely used
to study a number of complex diseases, particularly cancer. For
instance, Lv et al (9) observed that LINC01314 functions as
a tumour suppressor in hepatoblastoma. Furthermore, Clarke et
al (10) indicated that KCNK5
was associated with poor outcomes of the basal-like molecular
subtype in breast cancer. Using this analysis, the pathways
involved in the co-expression network of cancer models and target
genes can be identified. However, relevant research is currently
lacking in GBM.
The present study aimed to explore the underlying
molecular mechanisms, and identify novel prognostic biomarkers and
treatment targets of GBM. The expression profiles of lncRNAs and
mRNAs in GBM compared with those of normal controls were
investigated, and differentially expressed RNAs were identified
from the CGGA database. Next, the enriched pathways participating
in the tumourigenesis of GBM were determined, and protein-protein
interaction (PPI) networks were constructed. Finally, using public
databases, potential prognostic biomarkers were confirmed, and the
clinical significance and biological functions of
survival-associated lncRNAs were identified.
Materials and methods
Data collection
RNA sequencing and clinical data of GBM patients
were obtained from the CGGA database (http://www.cgga.org.cn). The gene expression levels
were measured in terms of fragments per kilobase of transcript per
million mapped reads. Various clinical data were also downloaded
from the database, which included the patient gender, age, The
Cancer Genome Atlas (TCGA) subtype, overall survival (OS),
radiotherapy and chemotherapy details, and the mutation status of
the genes isocitrate dehydrogenase (IDH), tumour protein p53
(TP53), EGFR, ATRX and enhancer of zeste homolog 2 (EZH2) (11,12). All cases with pathological
diagnosis of GBM were included in the analysis. The exclusion
criteria applied in the present study were as follows: i)
Histologic confirmation of the diagnosis of any brain tumour type
other than primary GBM; ii) history of radiotherapy or chemotherapy
prior to histologic diagnosis; iii) patients with missing follow-up
records; and iv) missing mutation information for the five
aforementioned genes. According to these criteria, a total of 88
GBM samples were selected for inclusion in the current study
(Table I). Furthermore, another
gene expression and clinical dataset of GBM patients was downloaded
from the TCGA database (https://cancergenome.nih.gov/), from which 162 GBM
cases were selected. The dataset obtained from TCGA was analysed,
and served as the validation dataset.
 | Table ISummary of patient
characteristics. |
Table I
Summary of patient
characteristics.
| Characteristic | Value |
|---|
| No. of
patients | 88 |
| Age | |
| ≥40 years | 73 |
| <40 years | 15 |
| Sex | |
| Male | 55 |
| Female | 33 |
| TCGA subtype | |
| Classical | 32 |
| Mesenchymal | 36 |
| Neural | 7 |
| Proneural | 13 |
| OS | |
| ≥12 months | 43 |
| <12 months | 45 |
| History of
radiotherapy | 59 |
| History of
chemotherapy | 52 |
| Gene mutation | |
| IDH | 12 |
| TP53 | 44 |
| EGFR | 23 |
| ATRX | 9 |
| EZH2 | 13 |
Construction of the gene co-expression
network and identification of preserved modules
First, the expression data profiles from the CGGA
were tested to confirm that they were suitable for the analysis.
The standard deviation value for all samples of each gene was
calculated, and the top 5,000 genes with the lowest standard
deviation values were selected for subsequent analysis. Next, the
co-expression network of genes was constructed using the WGCNA
package in R (8). To calculate
the scale-free topology fitting index r2 that
corresponded to different soft-thresholding parameter β values,
functional pickSoftThreshold was used, and the β value was selected
if r2 reached 0.9. The soft-thresholding power β value
was then set to 6, and the minModuleSize was set to 30.
Subsequently, the gene expression profile was transformed into an
adjacency matrix and a topological overlap matrix (TOM), which was
defined as the sum of adjacency between the gene and all other
genes for network generation. Next, the corresponding dissimilarity
of TOM (dissTOM) was calculated, and dissTOM-based hierarchical
clustering was used to produce a hierarchical clustering dendrogram
of genes. Modules of clustered genes were then generated using the
Dynamic Tree Cut algorithm. The module eigengene was calculated
using the function moduleEigengenes, and a number of modules were
merged according to a cut-off line for the module dendrogram. The
interactions (correlations) of each module were analysed and
visualised by heatmaps. To identify modules associated with patient
characteristics, the Pearson's correlation test was used to
evaluate the correlation of module eigengenes with the clinical
traits, OS and mutation status, and correlations with P-values of
<0.05 were considered to be statistically significant.
Gene ontology (GO) and pathway enrichment
analysis
The functional enrichment of the genes of the
identified module was assessed based on GO terms (13) and Kyoto Encyclopaedia of Genes and
Genomes (KEGG) pathway (14)
annotations. GO term analyses were performed using the DAVID
database (https://david.ncifcrf.gov/) and
Panther database (http://www.pantherdb.org) (15), which are essential tools for the
success of high-throughput gene function analysis. Pathway analysis
was also conducted using multiple online databases, including the
DAVID database, KEGG pathway database (http://www.genome.jp/kegg) and STRING online database
(http://string-db.org) (16). P-values of <0.05 were
considered to denote statistically significant differences in GO
term enrichment and KEGG pathway analyses, and the false discovery
rate was utilised to correct the P-values.
PPI network construction and
analysis
To identify the gene-encoded proteins and construct
the PPI network of the identified module, the genes were mapped to
the STRING database. The results obtained from this database were
then imported into Cytoscape software (version 3.6.0; https://cyto-scape.org/) to analyse the interactional
associations among the gene-encoding proteins and their degrees in
GBM (17). In addition,
significant genes from the PPI network complex were selected
according to their degree of importance. The corresponding proteins
may be the core proteins or key candidate genes that have
significant physiological regulatory functions.
Survival analysis and validation of the
genes in the TCGA dataset
To confirm the reliability of the identified genes
from the CGGA data, GBM data from TCGA were then used to perform
validation with the GEPIA database (http://gepia.cancer-pku.cn) (18). Through this database, the
expression levels of all genes of interest in GBM and other tumours
can be obtained. Furthermore, Kaplan-Meier curves were generated
based on the GEPIA database. The OS was estimated using the
log-rank test, and P<0.05 was considered to denote statistically
significant data.
KEGG analysis of lncRNA-correlated mRNAs
in GBM
In TCGA data, mRNAs having a Spearman's correlation
with lncRNA of >0.4 were considered to be lncRNA-correlated
mRNAs. These were then analysed by KEGG pathway enrichment
analysis. A P-value of <0.05 was applied to identify the
significant pathways.
Further analysis of candidate lncRNAs in
GBM
The genes nearby lncRNAs were analysed by genomic
region enrichment of annotations tool (GREAT version 3.0.0)
(19). The potential targets of
lncRNA were predicted by searching the miRDB database (http://www.mirdb.org).
Results
Gene co-expression network of GBM
To detect and explore the possible biological
function of the key survival-associated genes, WGCNA was performed
based on the mRNA and lncRNA profiles derived from the CGGA
database. According to the exclusion criteria mentioned earlier,
RNA sequencing results and the clinical data of 88 GBM samples were
downloaded from the CGGA database. For module detection, 5,000
coding and non-coding RNAs were selected for further analysis from
the original 21,000 genes according to the standard deviation
values. One outlier sample was removed from the sample network. The
TCGA subtype, gender, age, OS, radiotherapy and chemotherapy
information, and the mutation status of IDH, TP53, EGFR, ATRX and
EZH2 were defined as clinical traits (Fig. 1A). Analysis of the network
topology was first performed for various soft-thresholding power β
values to determine the relative balanced scale independence and
mean connectivity of the weighted gene co-expression network. As
shown in Fig. 1B, power 6 was the
lowest power at which the scale-free topology fitting indices
r2 reached 0.90; thus, this power was selected in order
to produce a hierarchical clustering tree (dendrogram) of the 5,000
genes. In total, 21 modules were identified by hierarchical
clustering and dynamic branch cutting, and each module was assigned
a unique colour as an identifier (Fig. 1C and D). The largest module
contained 826 genes, while the smallest contained 58 genes. The
grey module represented a gene set that was not assigned to any of
the modules.
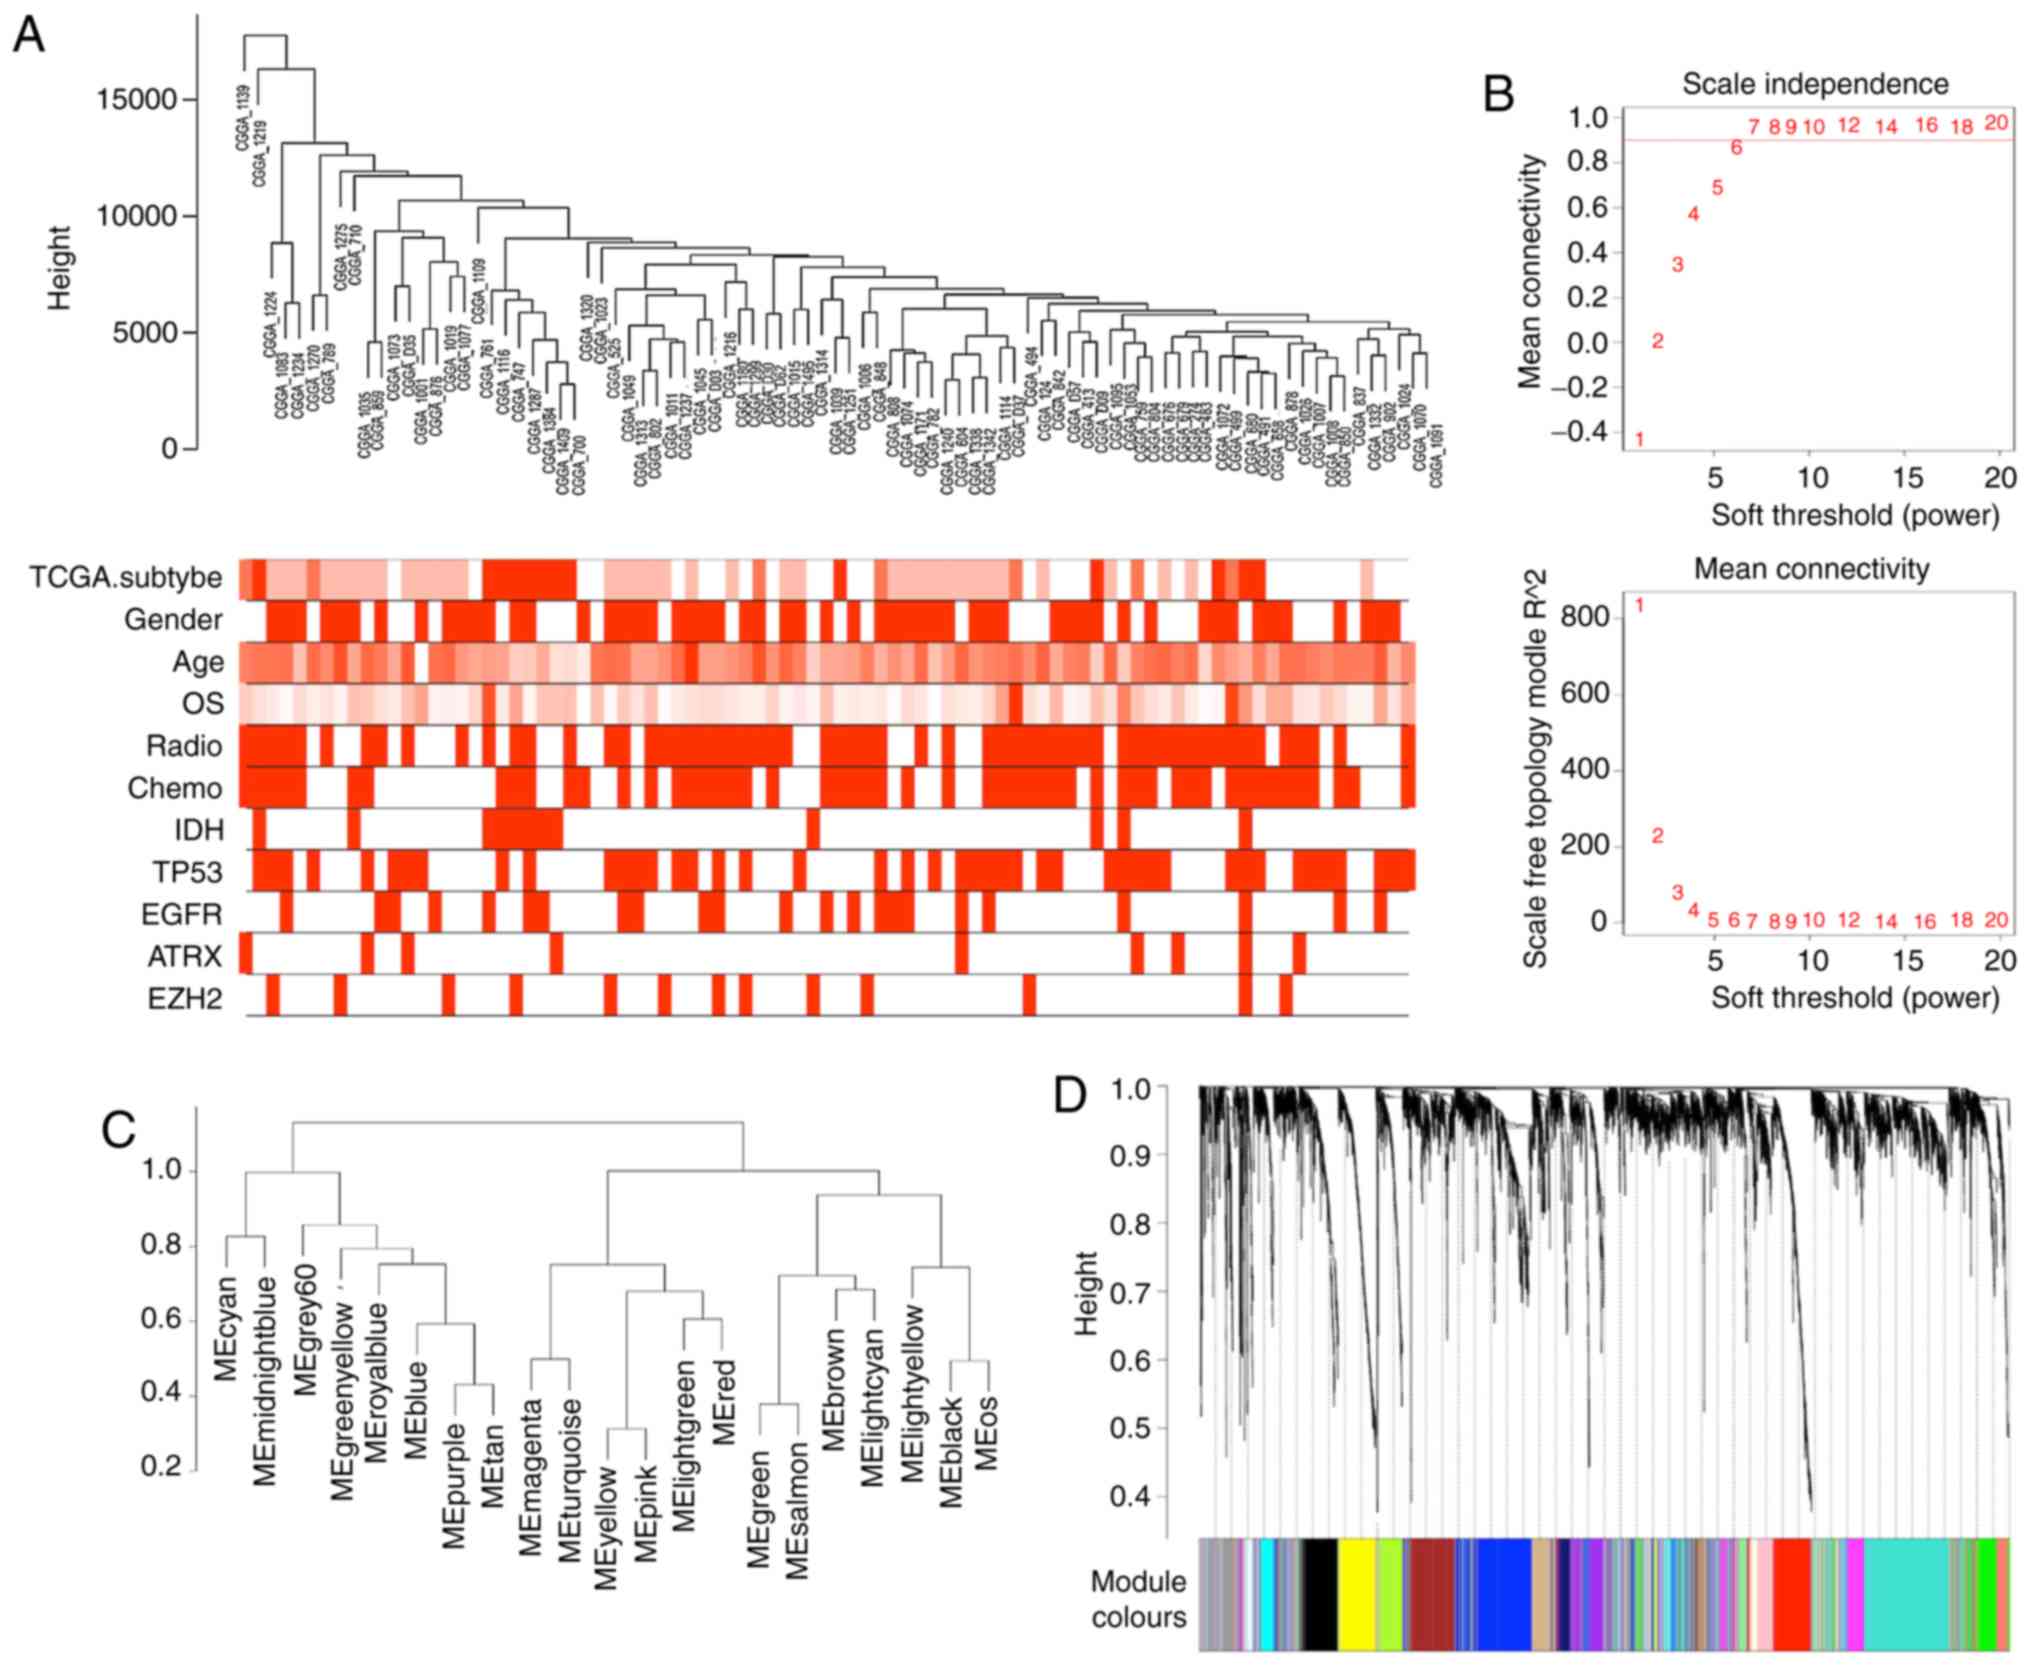 | Figure 1Network visualization plots of
weighted gene co-expression network analysis. (A) Dendrogram of
samples and heatmap of clinical and molecular traits. (B) Analysis
of network topology for different soft-thresholding powers. The
higher panel displays the influence of soft-thresholding power
(x-axis) on the scale-free fit index (y-axis). The lower panel
shows the influence of soft-thresholding power (x-axis) on the mean
connectivity (degree; y-axis). (C) Clustering of MEs. Hierarchical
clustering of module eigengenes that summarise the modules yielded
in the clustering analysis. Joint branches of the dendrogram
represent genes that are positively correlated. (D) Dendrogram of
selected genes, indicating clusters with dissimilarity based on
topological overlap, along with the assigned module colours. ME,
module eigengene; CGGA, Chinese Glioma Genome Atlas; TCGA, The
Cancer Genome Atlas; OS, overall survival; IDH, isocitrate
dehydrogenase; TP53, tumour protein p53; EGFR, epidermal growth
factor receptor; EZH2, enhancer of zeste homolog 2. |
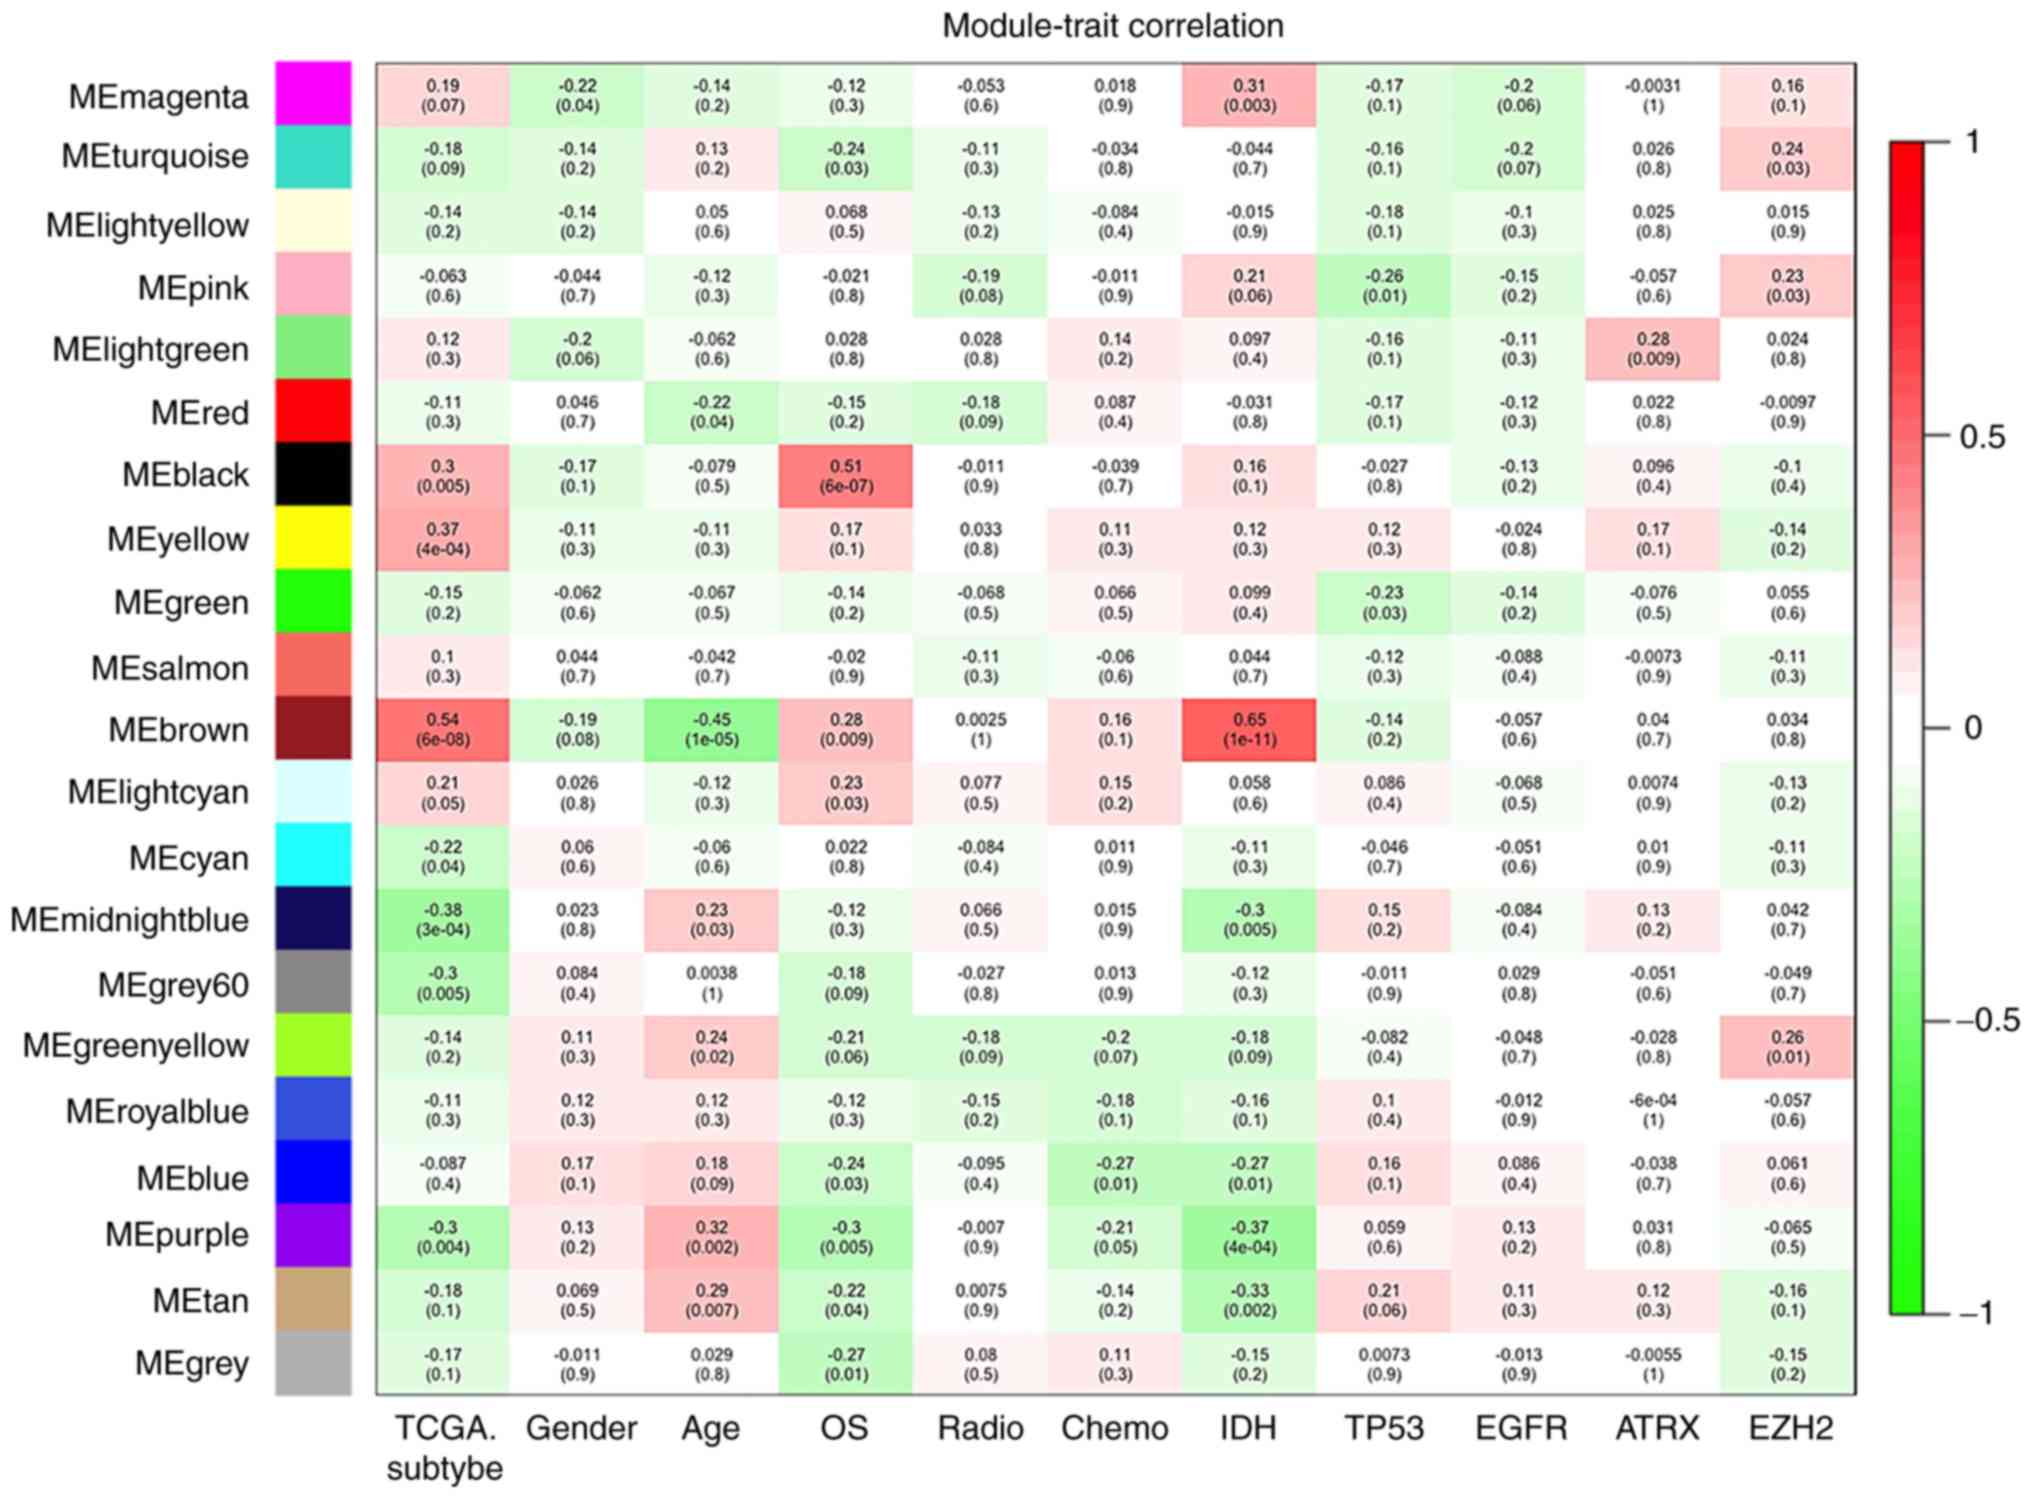
Identification of the modules
significantly associated with survival
To explore the survival significance of the selected
modules, correlations between the OS and module eigengenes were
analysed. It was observed that three modules (black, brown and
light cyan) were positively correlated with OS (P<0.05). Among
them, the black module had the lowest P-value. Another five modules
(turquoise, blue, purple, tan and grey) were negatively correlated
with OS (Fig. 2; P<0.05), with
the purple module exhibiting the lowest P-value. According to the
previous analysis of the survival significance of modules, the
black and purple modules were selected for further analysis with
OS, since they had the lowest P-values. Limited progress in
targeted therapy for GBM has been made in recent years, and the
majority of the therapeutic targets for this disease are oncogenes
(20); thus, the purple module
was further analysed in the present study, since the genes in
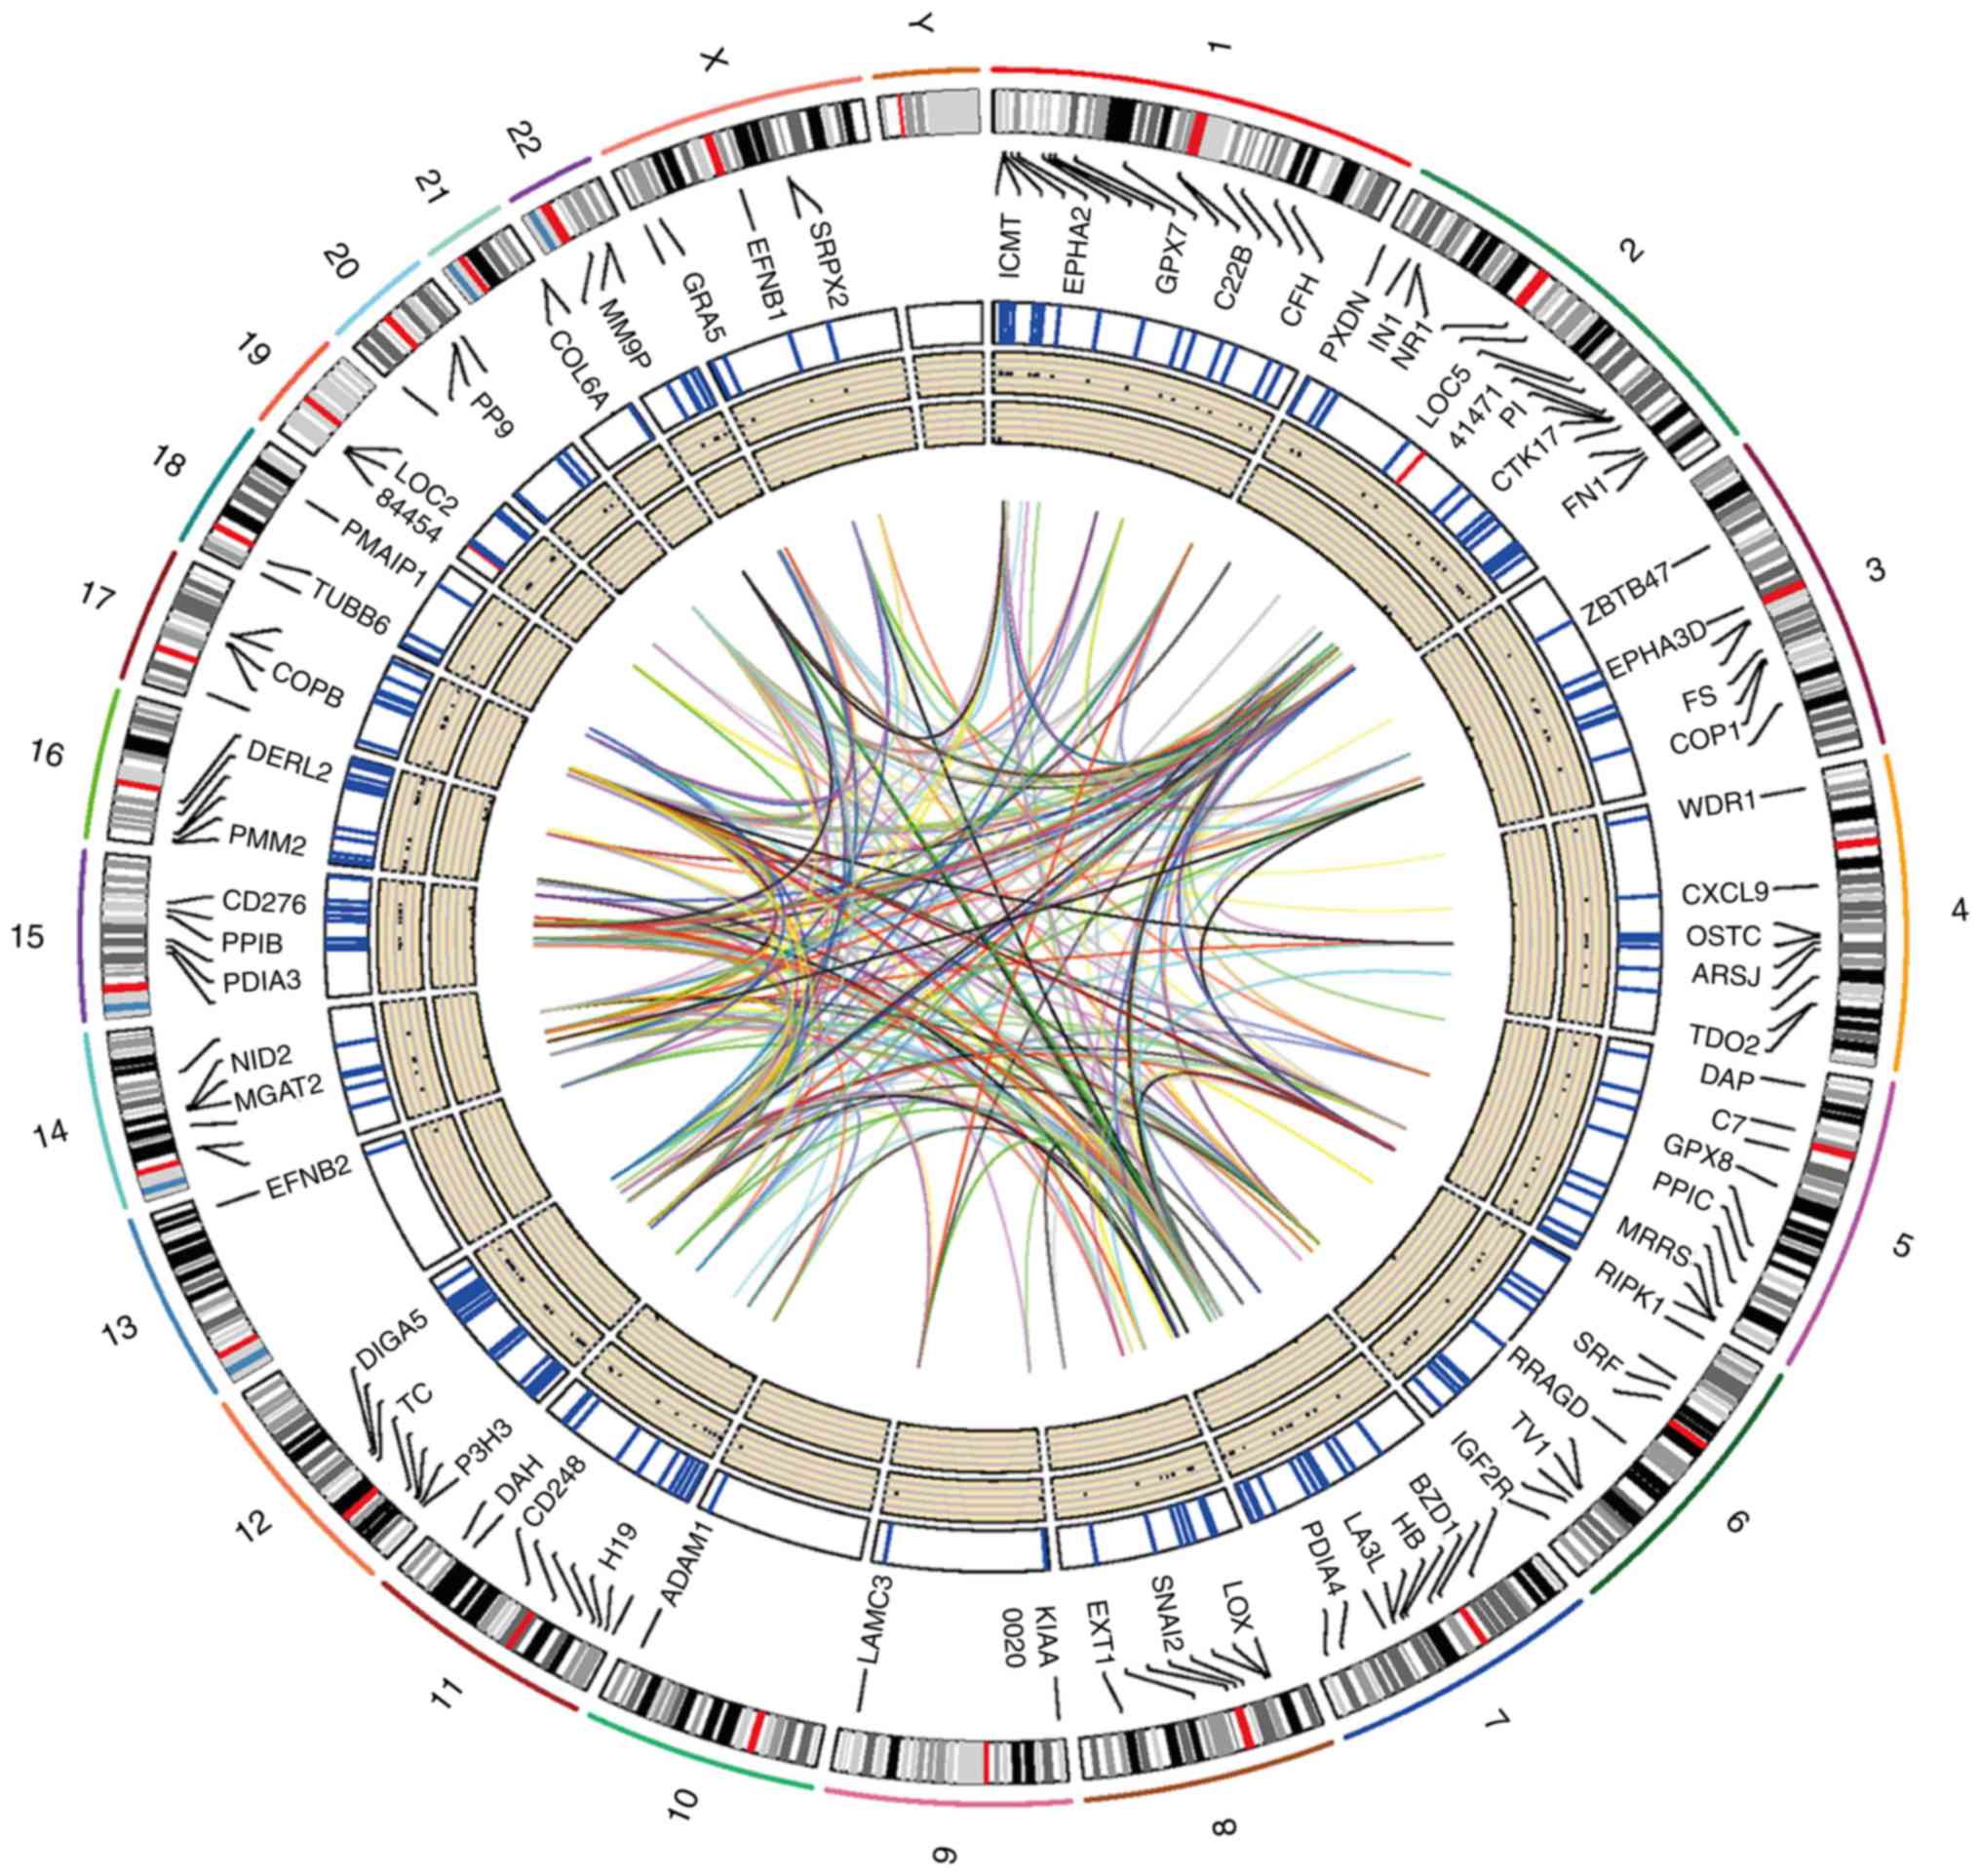
purple module are considered to be oncogenes. In total, 195 genes,
including 193 protein-coding and 2 non-coding genes, were
identified in the purple module. The locations of certain of these
identified genes on human chromosomes are displayed in the Circos
plot in Fig. 3.
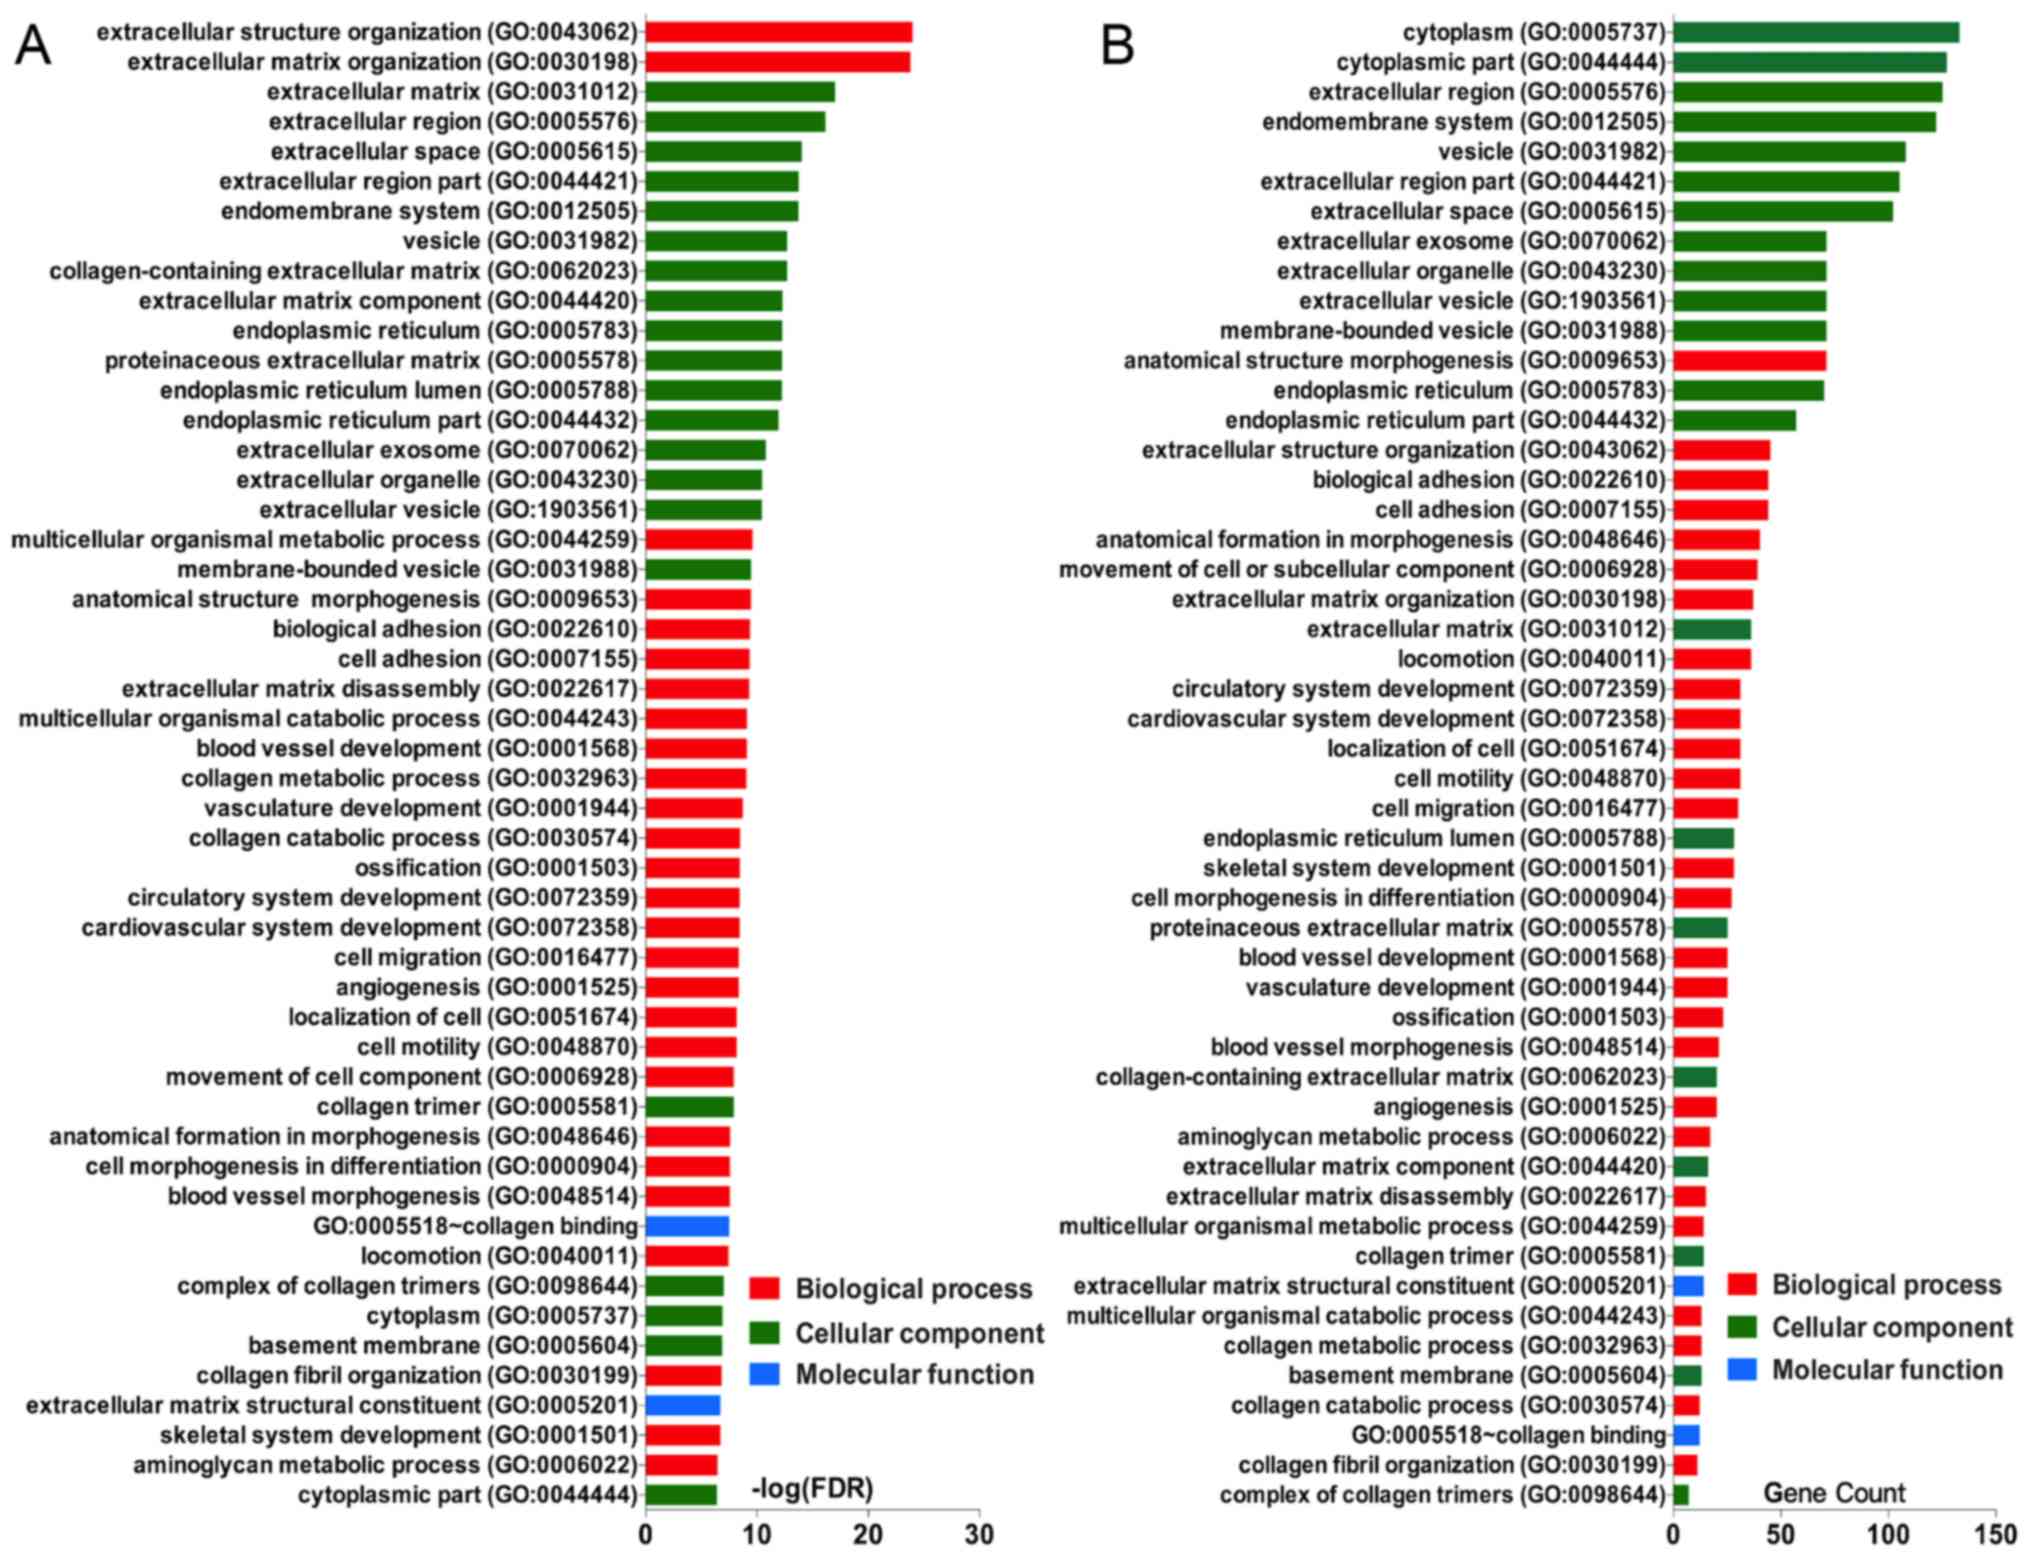
Enrichment analysis of coding genes in
the purple module
The functions and pathway enrichment of the
candidate genes in GBM identified from the purple module were
analysed using multiple online databases, including the DAVID,
Panther, KEGG pathway and STRING databases. The GO functional
enrichments of genes were determined with the DAVID and Panther
databases, with a P-value of <0.05 indicating statistical
significance of the data. The protein-coding genes in the purple
module were mapped to the GO database to determine their potential
functions. GO terms were divided into three functional groups,
including biological processes (BP), cell composition (CC) and
molecular function (MF). The enriched GO terms for the genes are
presented in Fig. 4. For the
candidate genes in the purple module, the top three enriched GO
terms in each category were as follows: Extracellular structure
organisation, extracellular matrix (ECM) organisation and
multicellular organismal macromolecule metabolic process in the BP
category; ECM, extracellular region and extracellular space in the
CC category; and collagen binding, ECM structural constituent and
growth factor binding in the MF category (Fig. 4A and B). These results revealed
that the majority of the genes were significantly enriched in
extracellular structure, binding, cell parts and cell growth.
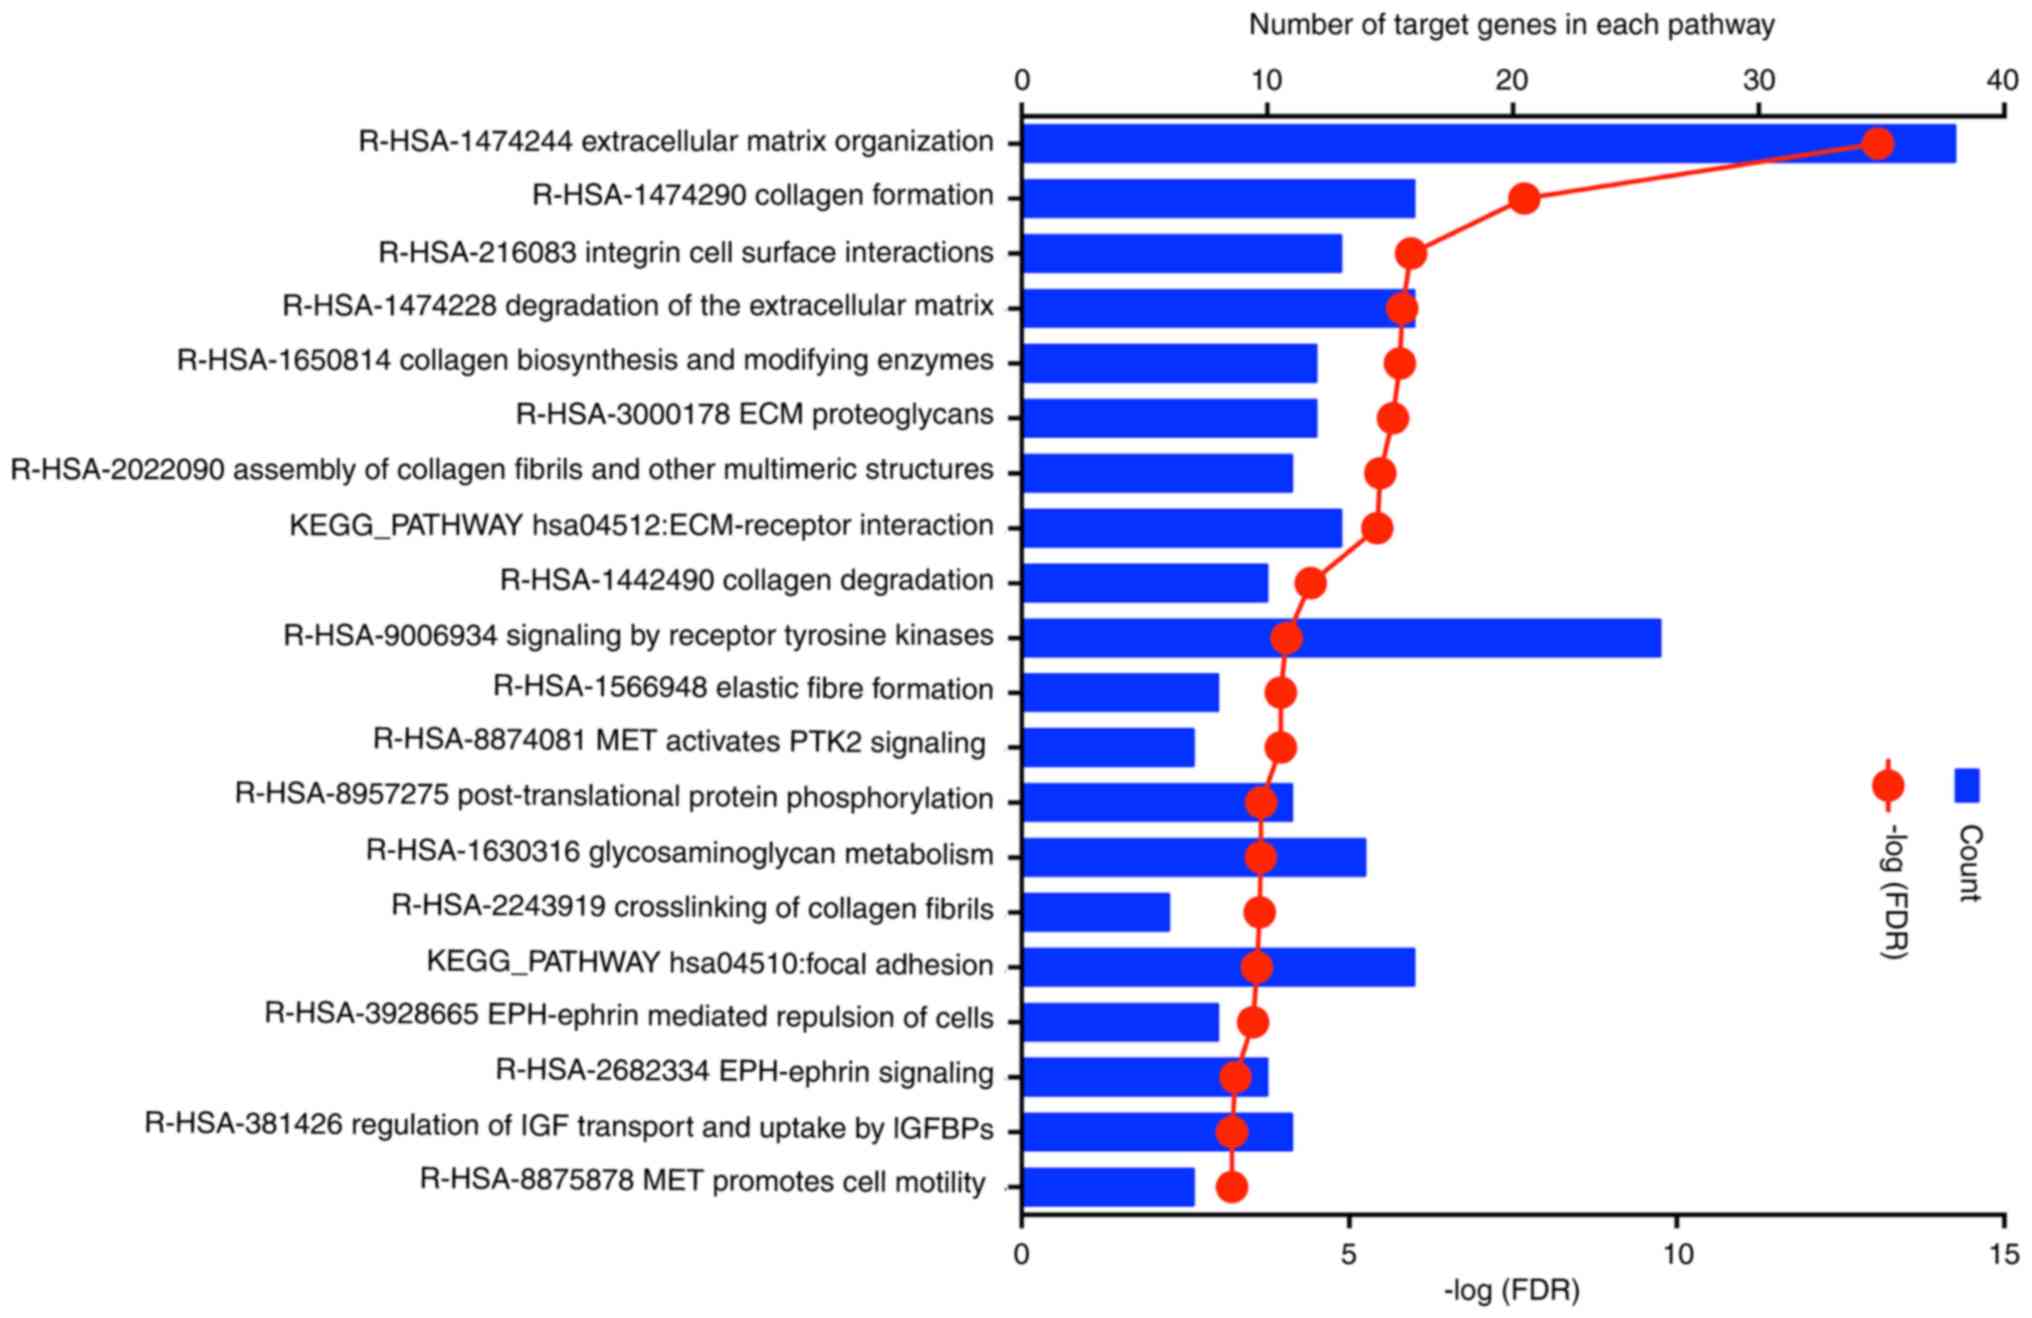
Subsequently, functional and signalling pathway
enrichment of genes in the purple module was performed using the
online databases DAVID, STRING and KEGG. The top enriched KEGG
pathways for the candidate genes included ECM organisation,
collagen formation, integrin cell surface interactions, degradation
of the ECM, collagen biosynthesis and modifying enzymes, ECM
proteoglycans, assembly of collagen fibrils and other multimeric
structures, ECM-receptor interaction, collagen degradation and
signalling by receptor tyrosine kinases (Fig. 5). The majority of the identified
pathways were cancer-associated signalling pathways.
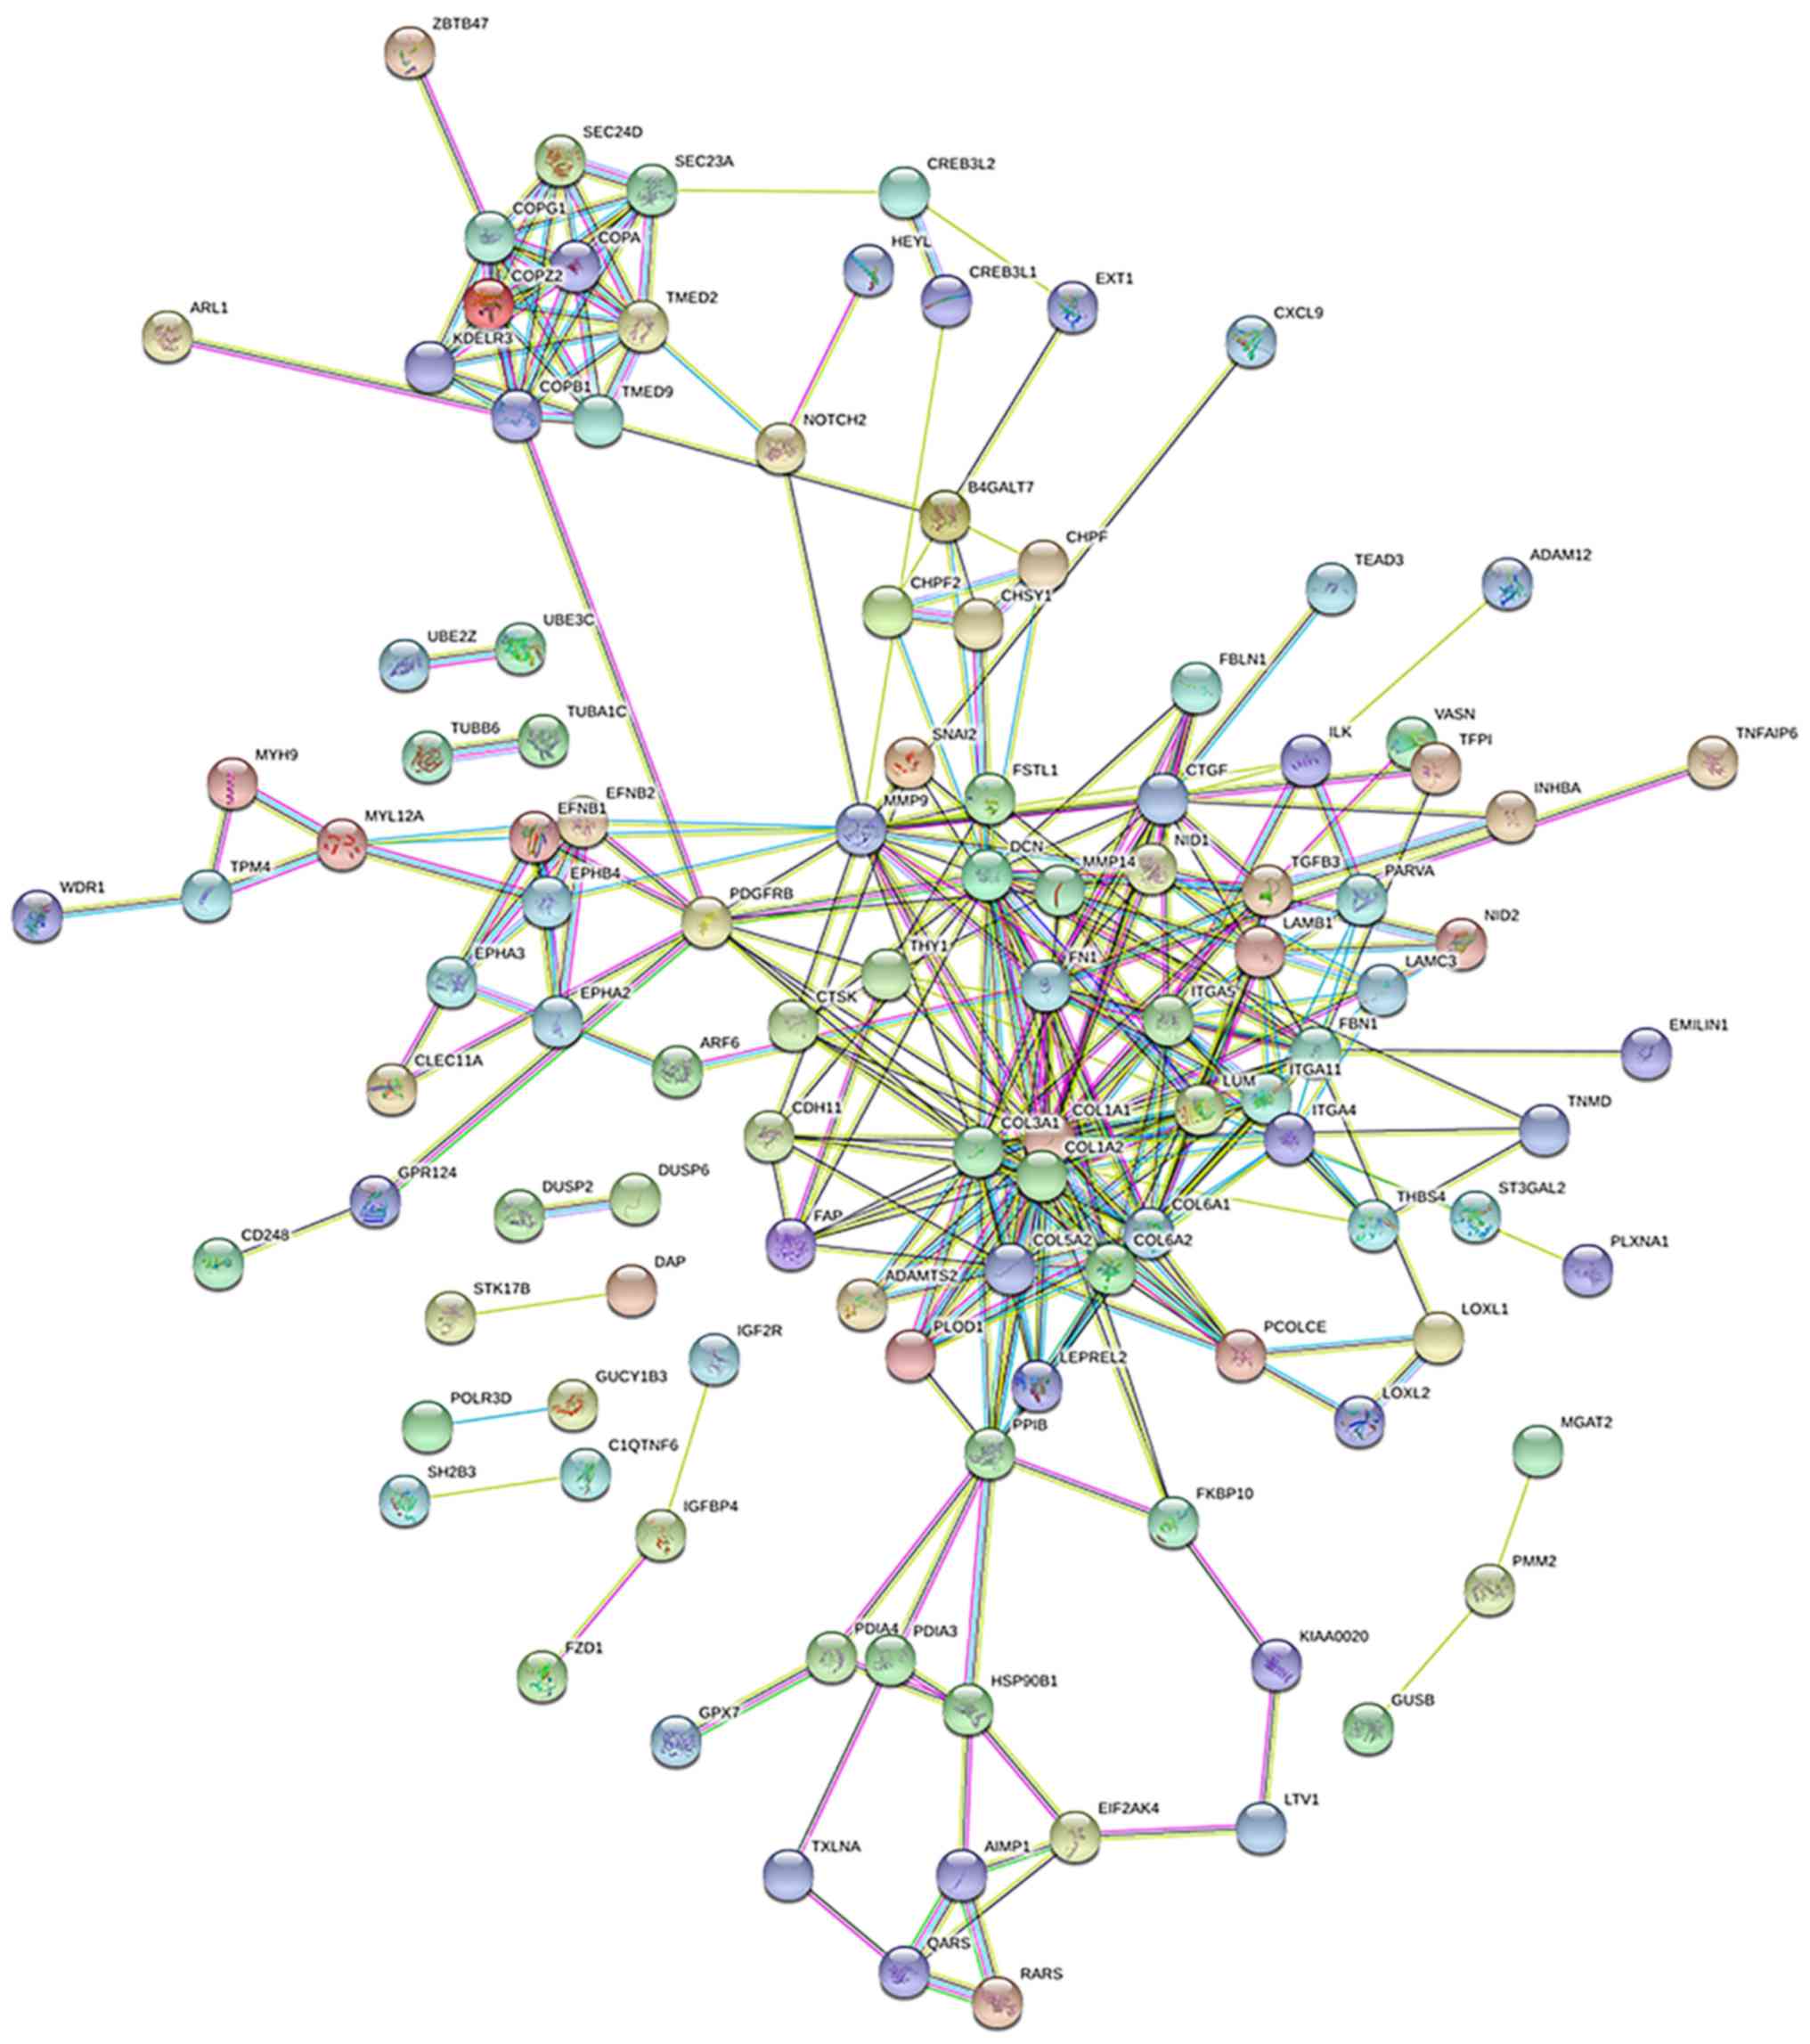
PPI network analysis of
survival-associated coding genes in GBM
Data from the STRING database revealed that several
of the genes interacted with each other. In total, 113 of the 193
candidate protein-coding genes were filtered to form the PPI
network complex (Fig. 6). The
network contained 113 nodes and 648 edges. Among the 113 nodes, the
most significant 19 hub node genes were identified using a degree
of ≥10 as the filtering criterion. These genes were COL1A1, COL1A2,
DCN, COL3A1, FN1, MMP9, COL6A1, COL5A2, COL6A2, ITGA5, FBN1, CTGF,
ITGA4, PDGFRB, LUM, PPIB, MMP14, ITGA11 and COPB1 (Table II). Among these genes, COL1A1
exhibited the highest node degree (degree =30), and FN1 shares the
highest degree with 33 validated coding genes.
| Table IIDegrees of the top 19 key genes in
the protein-protein interaction network. |
Table II
Degrees of the top 19 key genes in
the protein-protein interaction network.
| Gene symbol | Degree |
|---|
| COL1A1 | 30 |
| COL1A2 | 25 |
| DCN | 24 |
| COL3A1 | 22 |
| FN1 | 20 |
| MMP9 | 20 |
| COL6A1 | 18 |
| COL5A2 | 16 |
| COL6A2 | 16 |
| ITGA5 | 16 |
| FBN1 | 16 |
| CTGF | 14 |
| ITGA4 | 13 |
| PDGFRB | 12 |
| LUM | 11 |
| PPIB | 11 |
| MMP14 | 11 |
| ITGA11 | 11 |
| COPB1 | 10 |
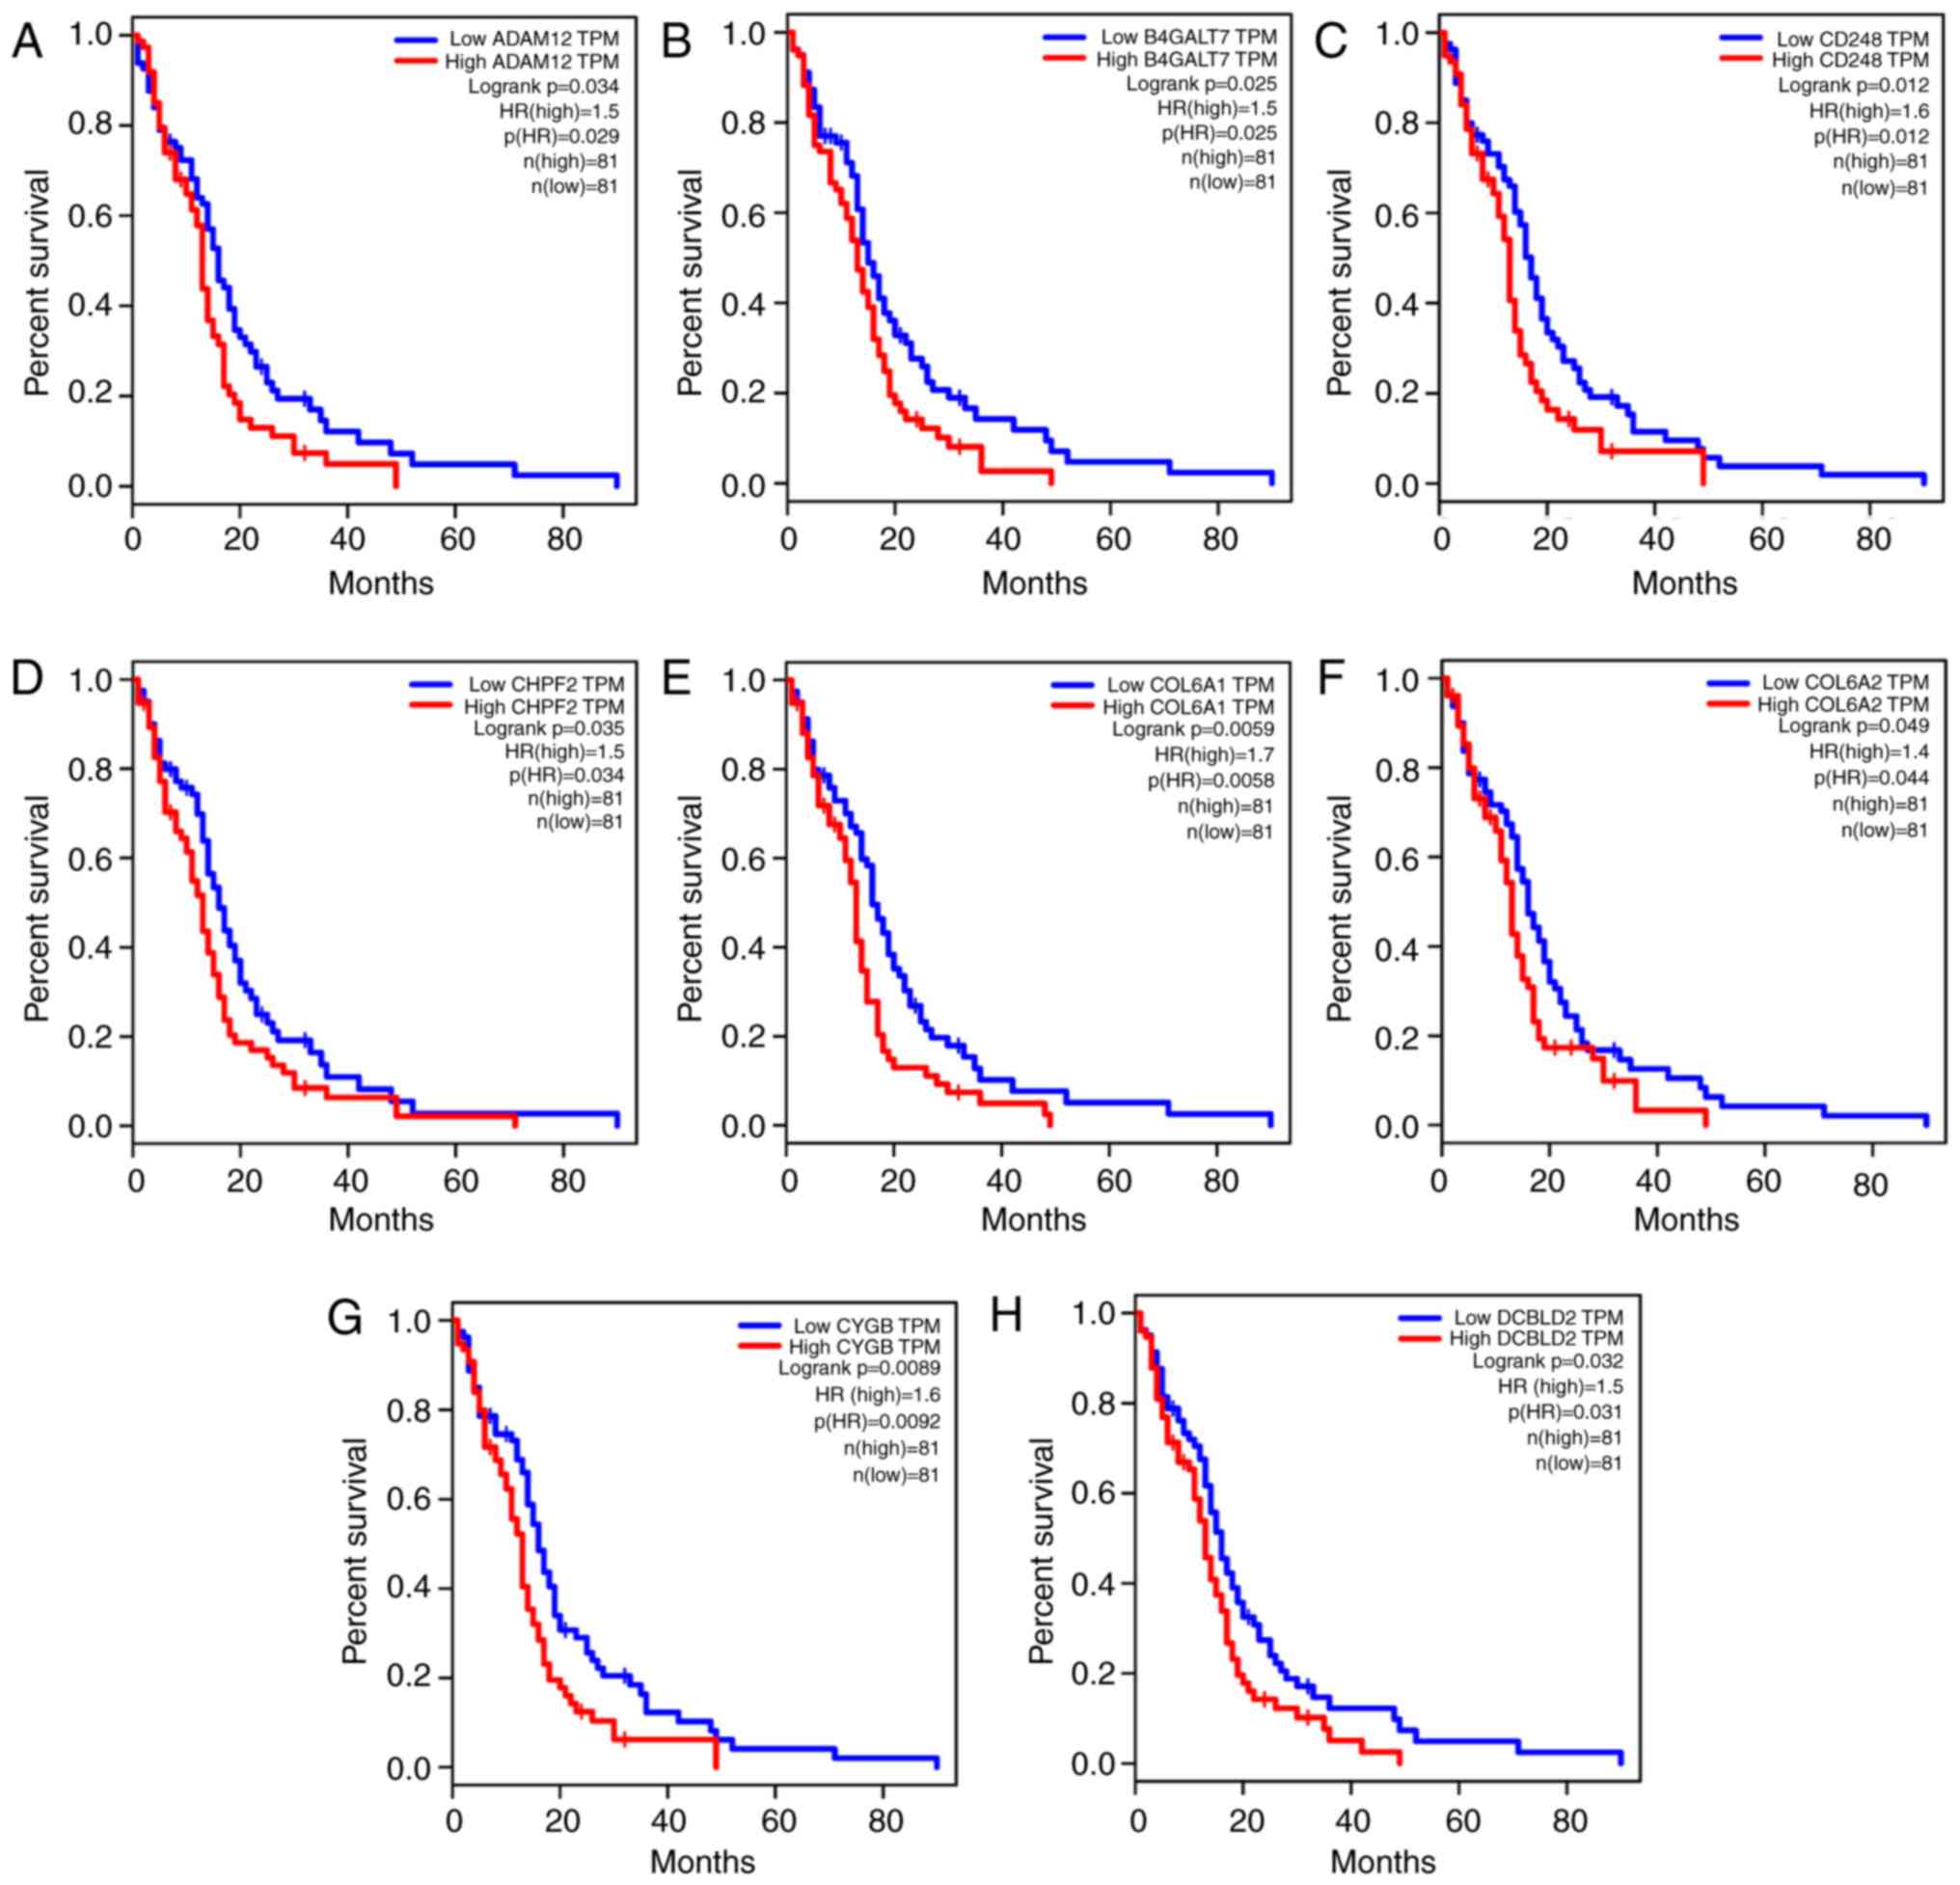
Validation of the survival-associated
genes in TCGA dataset
To confirm the reliability of the 193
survival-associated coding genes identified from the CGGA, GBM
datasets were also downloaded from TCGA database (including 162 GBM
samples), and the RNA sequencing data and survival information of
these datasets were subjected to Kaplan-Meier survival analysis.
The results revealed significantly different OS between the high
and low expression groups for 33 genes in the TCGA GBM, including
ADAM12, B4GALT7, CD248, CHPF2, COL6A1, COL6A2, CYGB, DCBLD2, DERL2,
DUSP6, EFNB2, EMILIN1, EPHA2, FAP, FBLN1, FN1, FZD1, HOXB2,
HSP90B1, IGFBP4, LAMB1, LOXL1, MMP11, NID2, P4HB, PCOLCE, PDIA3,
PLOD1, PMAIP1, PPIB, RARRES1, TBL2 and THY1 (P<0.05; Fig. 7). Therefore, the expression levels
of these 33 genes may be used as predictors of OS in GBM patients,
indicating that they may be candidate genes involved in GBM that
deserve further investigation.
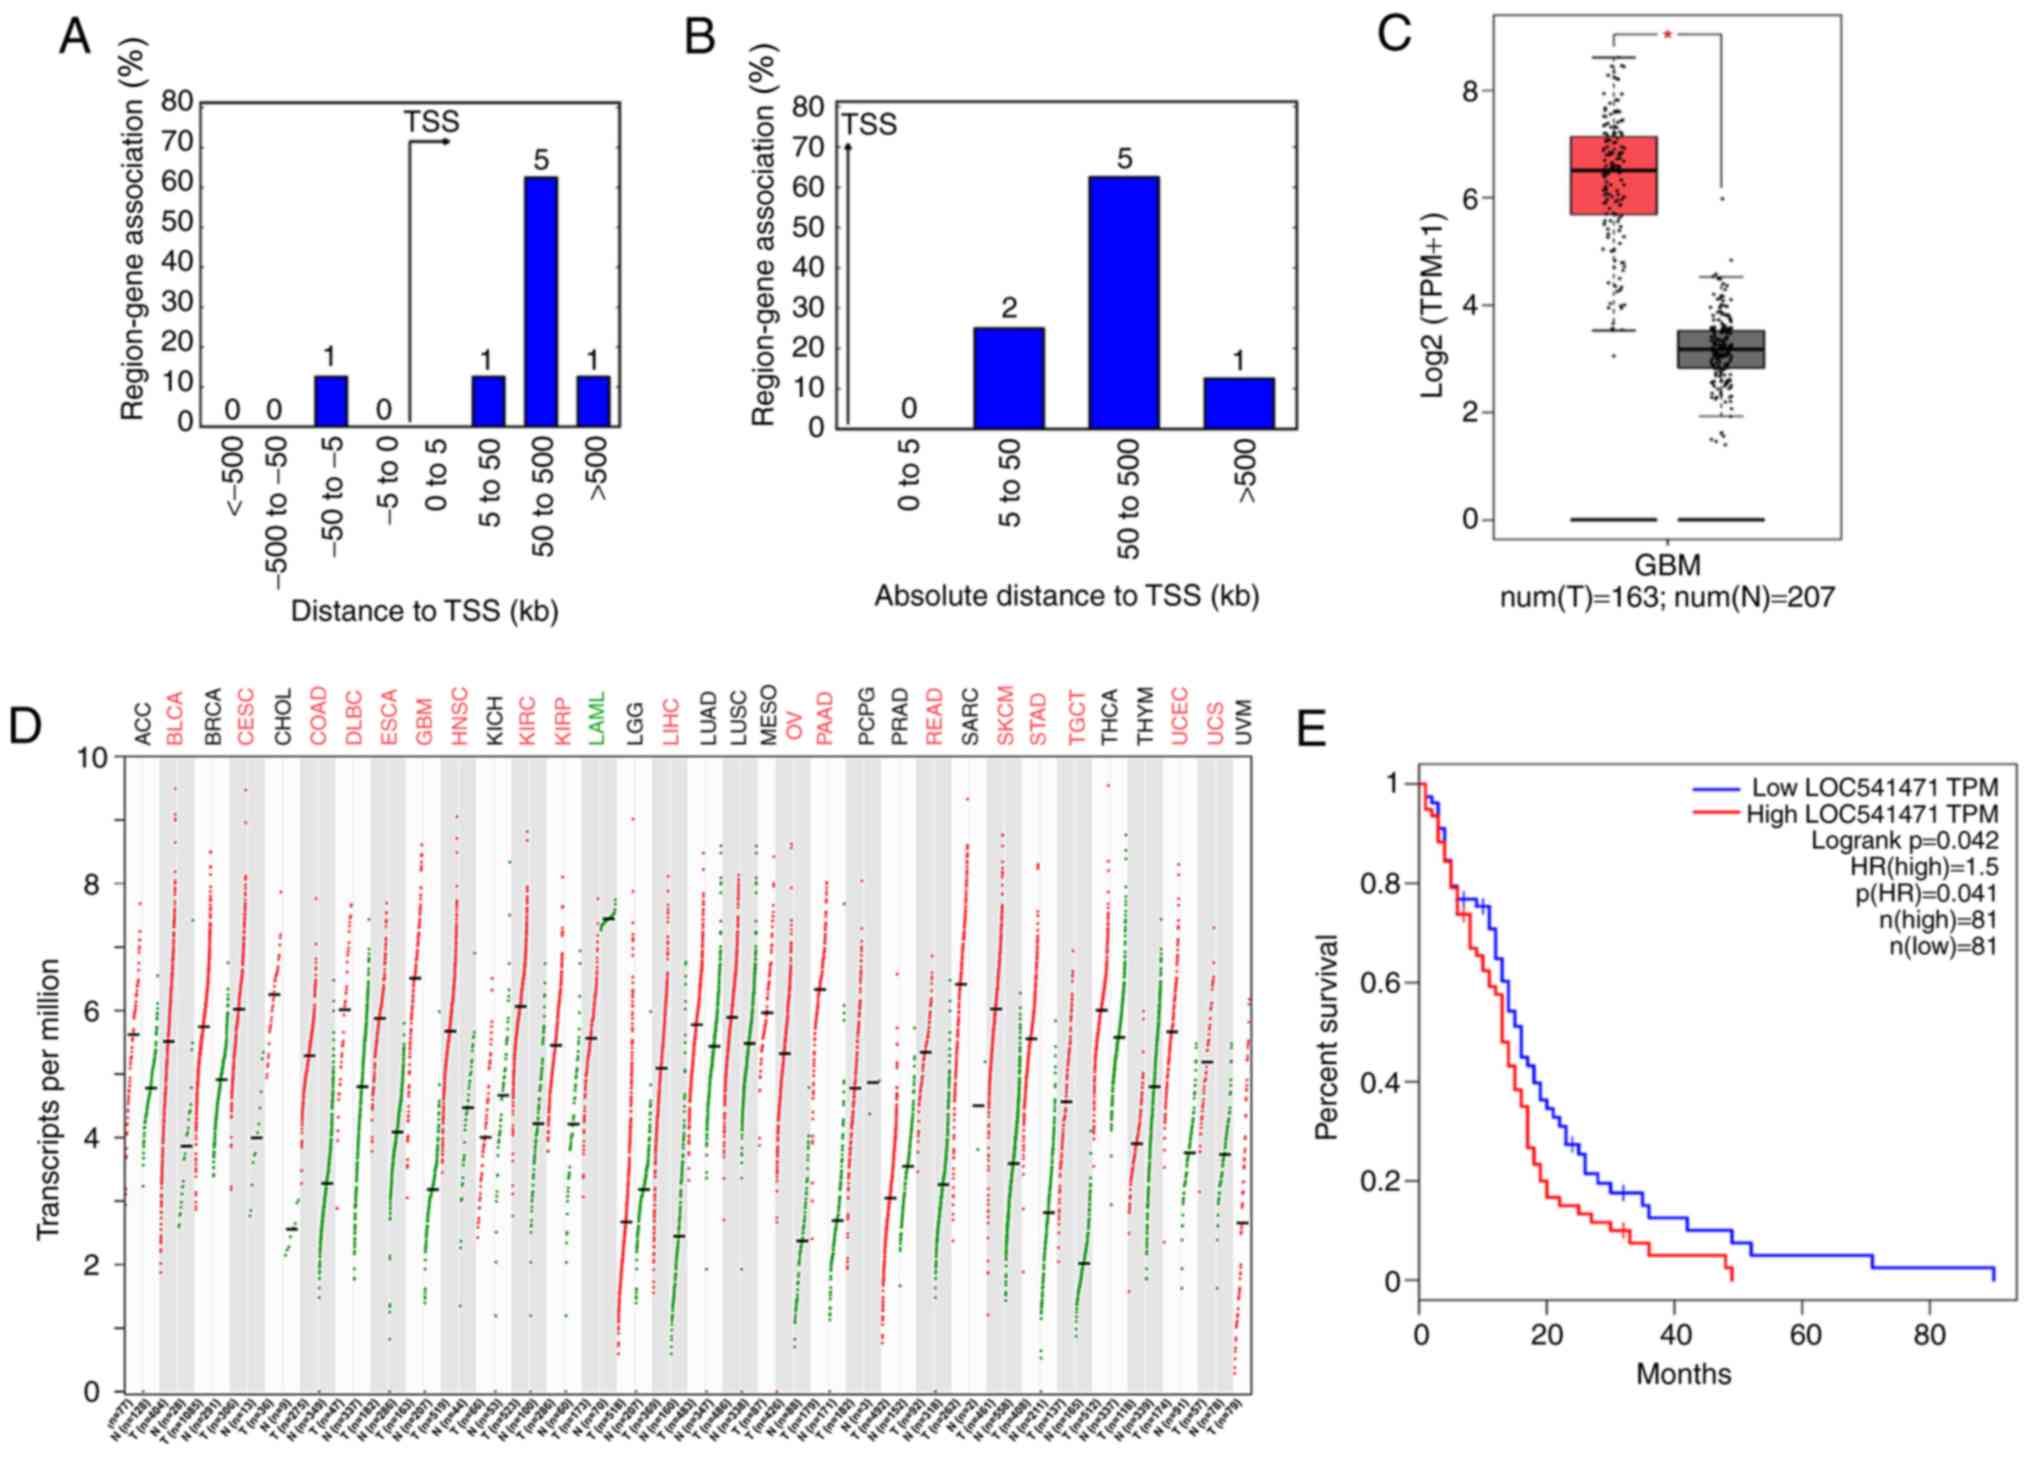
Validation and survival analysis of
candidate lncRNAs in GBM
According to the co-expression network, two lncRNAs,
namely LOC541471 and LOC284494, were identified as
survival-associated key non-coding genes in GBM. Next, the genes
nearby these two lncRNAs were analysed. The results demonstrated
that 8 genes were located near the transcription start site
(Fig. 8A and B). To confirm the
reliability of the identified lncRNAs, TCGA GBM data were
subsequently used to perform validation by GEPIA. As shown in
Fig. 8C, LOC541471 was
significantly overexpressed in the GBM data-sets obtained from
TCGA. Next, the expression levels of these two lncRNAs in other
types of cancer were explored using TCGA. It was observed that
LOC541471 was overexpressed in 17 other cancer types (Fig. 8D), while LOC284494 was
overexpressed in 3 other cancer types, as compared with their
corresponding normal tissues (data not shown). Subsequently,
survival analysis was performed in the TCGA GBM data, and a
significant association with survival was observed only for
LOC541471 (Fig. 8E). Therefore,
LOC541471 was regarded as a core lncRNA in the network and warrants
further investigation.
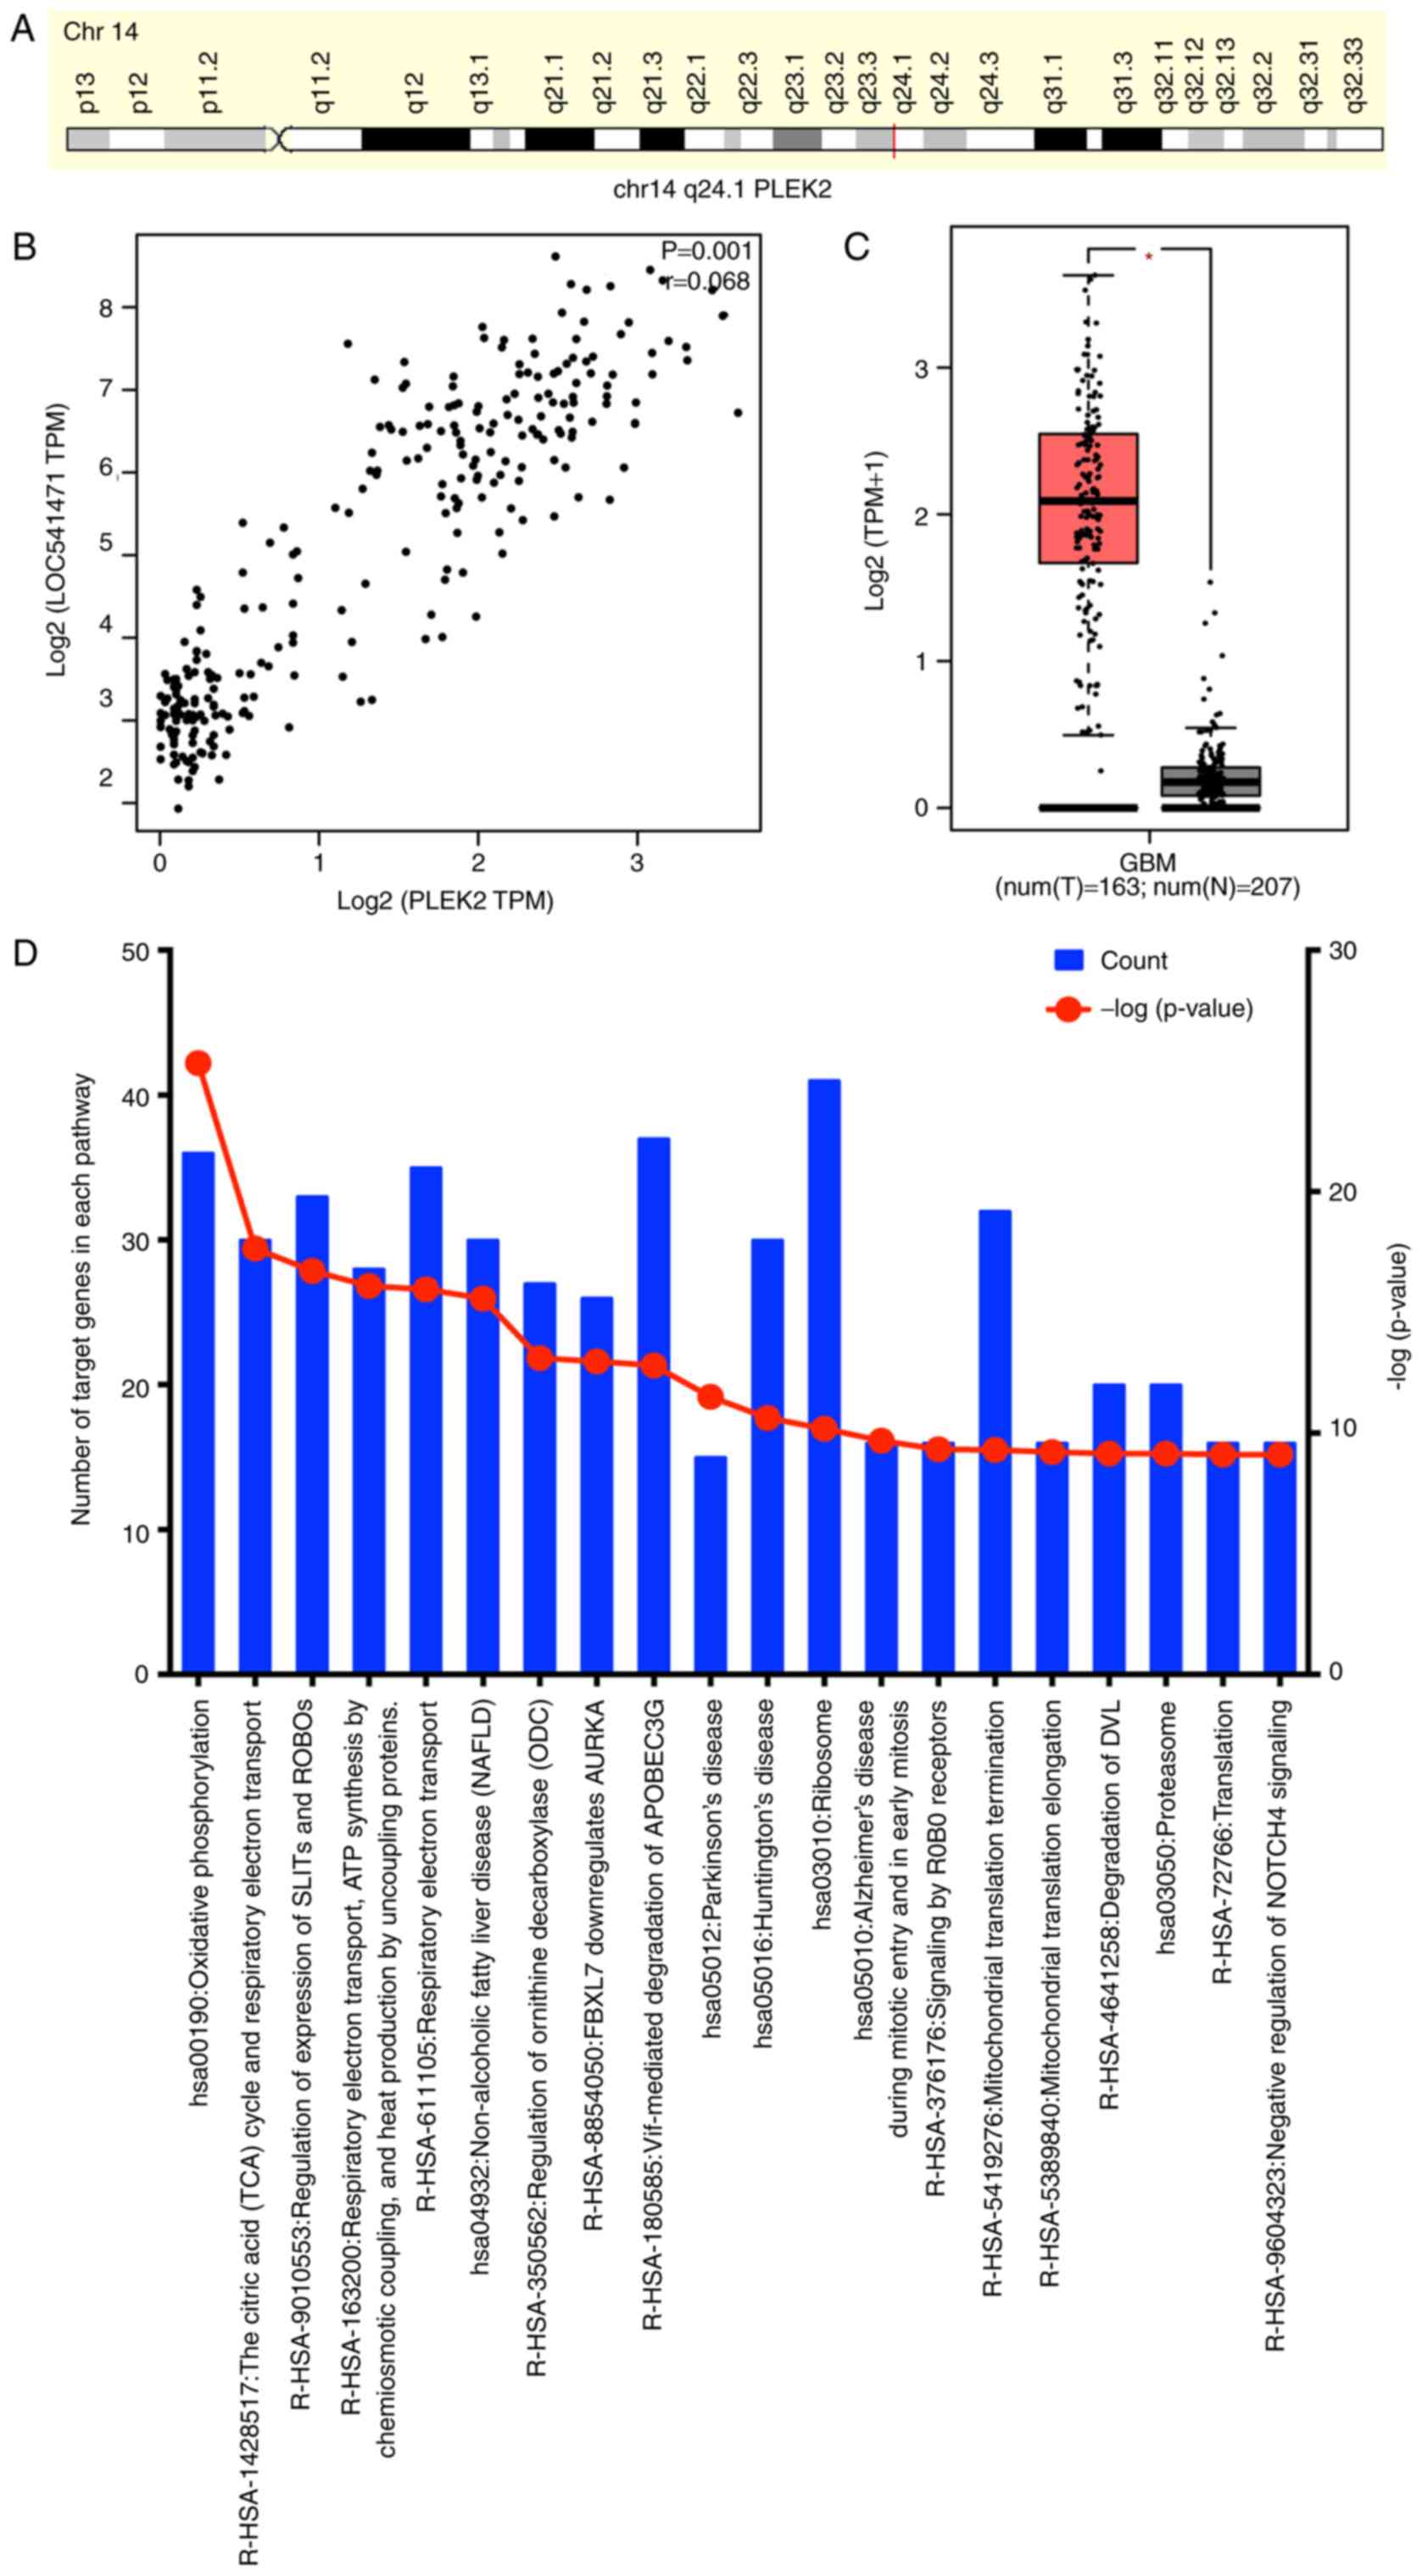
Functional analysis of lncRNA LOC541471
in GBM
As mentioned earlier, LOC541471 was found to be the
core lncRNA in the co-expression network. To understand how this
lncRNA is involved in GBM, a deeper insight into the GBM expression
data from TCGA was required. Spearman's correlation of LOC541471
was calculated with ~24,300 coding genes in 156 GBM patients. It
was observed that pleckstrin-2 (PLEK2) is the mRNA exhibiting the
highest correlation index (r=0.68) with lncRNA LOC541471, and this
gene is located on human chromosome 3p24.1 (Fig. 9A and B). According to the TCGA
data, PLEK2 is significantly overexpressed in GBM tissues as
compared with the normal tissue (Fig.
9C). Next, a total of 436 mRNAs that had a Spearman's
correlation with LOC541471 of >0.4 were further examined by KEGG
pathway analysis. Pathways were considered as enriched at a P-value
of <0.05 (Fig. 9D), and the
most enriched pathway was oxidative phosphorylation (OXPHOS).
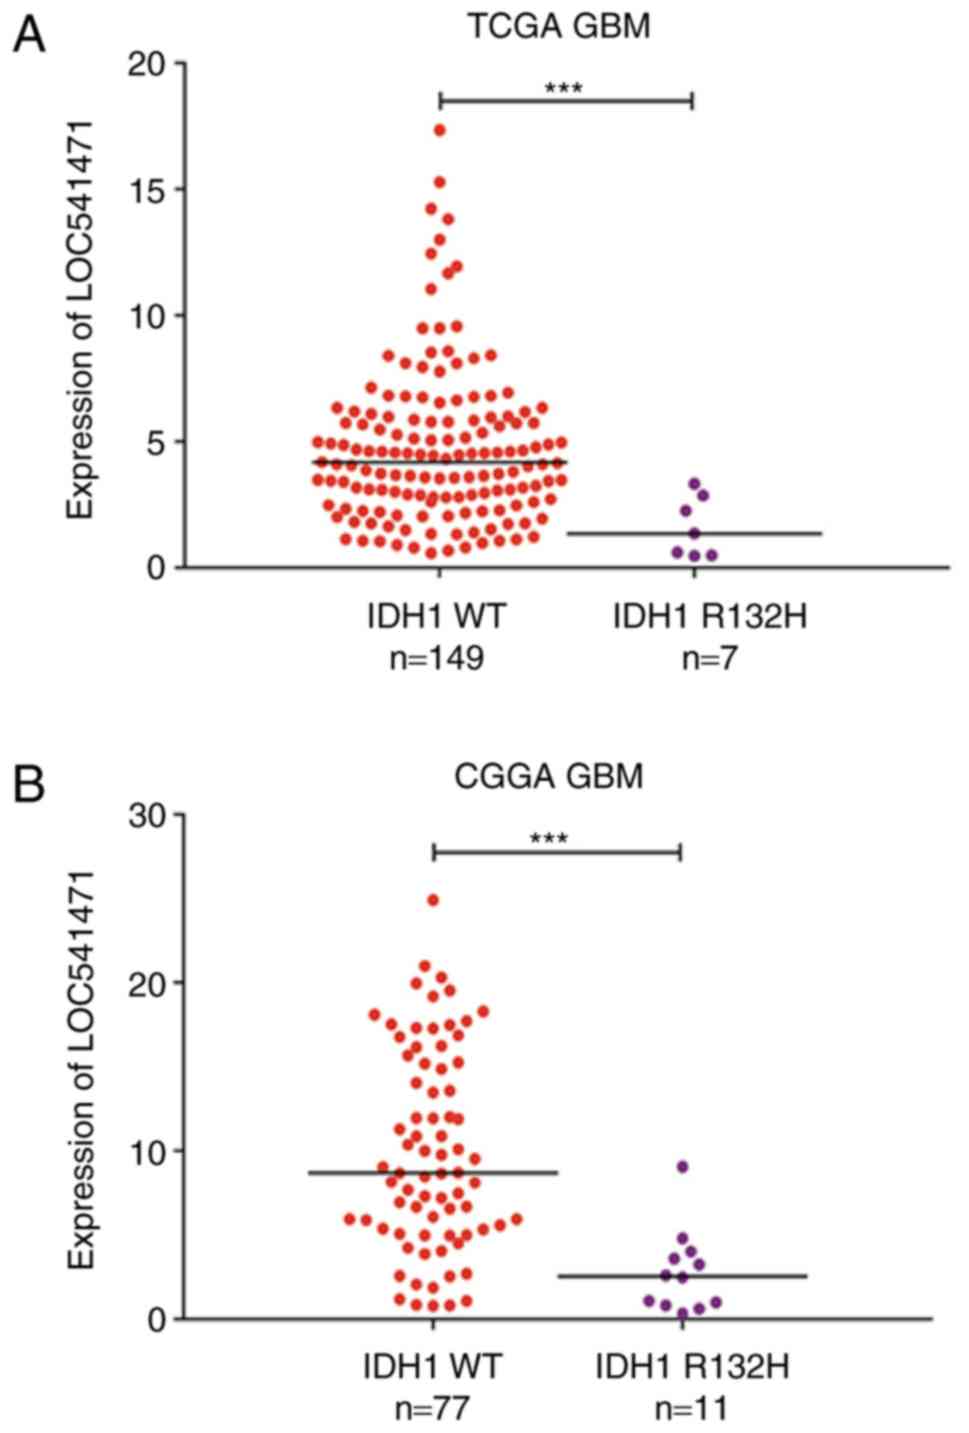
Finally, the expression data of GBM samples obtained from TCGA and
CGGA were analysed, and the expression of LOC541471 in IDH1
wild-type was observed to be much higher compared with that in the
IDH1 mutant group (Fig. 10).
Cytoplasmic lncRNAs can act as competing endogenous
RNAs to modulate the functions of miRNAs (21). By searching the miRDB database
(22), it was observed that
LOC541471 was located in the cytoplasm, and 37 possible targets
miRNAs were identified (Table
III). The top 5 target miRNAs were hsa-miR-548t-3p,
hsa-miR-548ap-3p, hsa-miR-548aa, hsa-miR-4288 and hsa-miR-3138.
Taken together, these results predicted the potential mechanism of
LOC541471; however, further studies are required to demonstrate
this additional mechanism of LOC541471 in GBM.
| Table IIIPredicted miRNAs targeted by
LOC541471. |
Table III
Predicted miRNAs targeted by
LOC541471.
| Target rank | Target score | miRNA name |
|---|
| 1 | 84 |
hsa-miR-548t-3p |
| 2 | 84 |
hsa-miR-548ap-3p |
| 3 | 84 | hsa-miR-548aa |
| 4 | 82 | hsa-miR-4288 |
| 5 | 77 | hsa-miR-3138 |
| 6 | 76 | hsa-miR-93-3p |
| 7 | 74 | hsa-miR-4508 |
| 8 | 71 | hsa-miR-939-3p |
| 9 | 69 |
hsa-miR-5585-5p |
| 10 | 68 |
hsa-miR-4668-5p |
| 11 | 66 | hsa-miR-4278 |
| 12 | 66 | hsa-miR-4492 |
| 13 | 65 | hsa-miR-2110 |
| 14 | 65 |
hsa-miR-519d-5p |
| 15 | 64 | hsa-miR-3148 |
| 16 | 63 | hsa-miR-1246 |
| 17 | 62 | hsa-miR-4456 |
| 18 | 62 |
hsa-miR-1178-3p |
| 19 | 61 | hsa-miR-3945 |
| 20 | 61 | hsa-miR-4306 |
| 21 | 60 | hsa-miR-877-3p |
| 22 | 60 | hsa-miR-1302 |
| 23 | 59 | hsa-miR-7975 |
| 24 | 59 |
hsa-miR-1252-5p |
| 25 | 59 |
hsa-miR-6853-3p |
| 26 | 58 |
hsa-miR-6794-5p |
| 27 | 58 |
hsa-miR-4716-3p |
| 28 | 58 |
hsa-miR-146b-3p |
| 29 | 57 |
hsa-miR-6754-5p |
| 30 | 57 |
hsa-miR-3622a-5p |
| 31 | 57 | hsa-miR-542-3p |
| 32 | 55 | hsa-miR-651-3p |
| 33 | 55 |
hsa-miR-1296-5p |
| 34 | 55 | hsa-miR-1231 |
| 35 | 54 | hsa-miR-136-5p |
| 36 | 54 | hsa-miR-874-3p |
| 37 | 54 | hsa-miR-4267 |
Discussion
GBM is the most common and aggressive primary brain
tumour type. The therapeutic options consist of microsurgery, and
treatment with radiotherapy plus adjuvant chemotherapy with
temozolomide and targeted drugs. Despite a large number of basic
and clinical studies that have revealed the mechanisms underlying
the formation and development of GBM in the past decades, the
prognosis for this disease remains considerably poor (23-25). Therefore, searching for new
candidate genes is an important part of studying the disease
tumourigenesis and would help identify novel therapeutic targets. A
number of previous studies have used regulatory network methods to
analyse gene expression data, and these approaches focus not only
on the differences, but also on the correlations between gene
expression datasets (26-28). Such studies have provided numerous
relevant molecular mechanisms and valuable biomarkers for GBM.
However, these methods use a hard threshold to determine the
correlation between genes and do not consider the changes in the
correlation intensity between genes under different conditions.
Therefore, more appropriate methods are required.
WGCNA is a novel statistical method analysing gene
correlations that is based on scale-free topology and construction
of a weighted network via soft thresholds. It is not only used to
construct gene networks and detect sub-networks, but also to
identify hub genes and select candidate biomarker genes (8). In general, module checking in WGCNA
requires a knowledge-independent process, and has been widely and
successfully applied in biological function analysis in various
diseases (29-31). Furthermore, it is well known that
the mutation of genes contributes to GBM tumourigenesis; however,
the role of lncRNAs has not yet been fully researched.
In the present study, a comprehensive analysis of
lncRNA and mRNA profiling data of GBM patients obtained from the
public database CGGA was performed. Subsequently, the modules
associated with the OS of GBM cases were identified, the coding
genes of the module were analysed by GO and KEGG enrichment
analyses, and the PPI network was constructed. Next, genes
associated with survival were identified by Kaplan-Meier survival
analysis. Finally, the core lncRNAs and their biological functions
were identified, and their expression was validated using the GBM
dataset obtained from TCGA. In conclusion, our work has identified
a gene set involving the survival and tumourigenesis of GBM in
which lncRNAs play a critical role.
The gene expression profile of GBM obtained from
CGGA was initially examined in the present study. A total of 5,000
genes with the lowest standard deviation values were selected,
since these were considered as more likely to provide good data
quality. Next, the purple module was identified by WGCNA, in which
genes were significantly associated with OS of GBM patients.
Subsequent GO and KEGG pathway analyses of mRNAs in
the purple module revealed that the majority of the genes were
significantly enriched in extracellular structure, binding, cell
part and cell growth. They were also involved in pathways relevant
to tumour progression and migration, such as ECM organisation,
collagen formation, integrin cell surface interactions, degradation
of the ECM, collagen biosynthesis and modifying enzymes, and
ECM-receptor interactions. These results can explain the
correlations between the purple module and the OS of GBM
patients.
According to the present study analysis, the top
enriched GO terms were associated with ECM. It is well known that
ECM is considered to be the key component in the spread of gliomas
throughout the brain (32). In
addition, the ECM micro-environmental composition (33) and its mechanical force (34) influence the migration of glioma
cells. ECM-binding proteins were considered to be indispensable
elements of GBM migration (35).
Furthermore, the degradation of ECM-components involves various
proteases and hyaluronidases, which are important not only in
promoting glioma cell migration by ECM decomposition, but also in
releasing various growth and chemotactic factors that stimulate
growth, survival and migration of GBM (36).
The current study identified 195 genes in the purple
module, which were markedly associated with OS. Additionally, there
were 33 candidate genes associated with the OS of patients with GBM
according to TCGA data, and these may serve as prognostic
biomarkers for GBM. Data from the STRING database further revealed
that 113 genes of the 193 candidate protein-coding genes were
filtered into the PPI network complex. Among these candidate genes,
COL1A1 exhibited the highest degree in the network. COL1A1 encodes
the major component of type I collagen, which is the fibrillar
collagen found in the majority of connective tissues. Previous
studies have reported that COL1A1 is upregulated in the
microvasculature of proliferating GBMs (37). In addition, COL1A1 may be
considered for use in stratifying patients with GBM into subgroups
according to the risk of recurrence at diagnosis, as well as for
prognostic and therapeutic evolution (38). These previous observations are
consistent with the current research findings, suggesting that
COL1A1 may also be a potential target for GBM therapy.
The current study also identified that FN1 shares
the highest degree with 33 validated coding genes. Fibronectin is a
high-molecular-weight (~440 kDa) glycoprotein of the ECM that binds
to membrane-spanning receptor proteins, known as integrins
(39). Researchers have proven
that FN1 is upregulated by TWIST1, which is known to promote
epithelial-mesenchymal transition and/or GBM invasion (40). Furthermore, FN1 is associated with
glioblastoma recurrence and can be regarded as a target for
antiangiogenic therapy (41). The
current study findings suggest that COL1A1 and FN1 are associated
with migration, invasion, angiogenesis, recurrence and OS in GBM
patients. Thus, these genes may serve important roles in the
tumourigenesis of GBM.
The important roles of certain lncRNAs in GBM were
clearly demonstrates in the current study. However, understanding
the functions of these lncRNAs is challenging, since numerous
lncRNAs are not included in the public databases. In the present
study, it was demonstrated that LOC541471 was highly correlated
with PLEK2 in GBM. Therefore, the biological functions of the
lncRNA LOC541471 were further examined, and it was observed that it
participates in the regulation of biological networks. KEGG pathway
enrichment analysis for all protein-coding genes exhibiting
Spearman's correlations with lncRNA LOC541471 of >0.4 revealed
that the most enriched pathway was OXPHOS. OXPHOS is the metabolic
pathway in which cells use enzymes to oxidise nutrients, thereby
releasing energy that is used to produce adenosine triphosphate
(42). This pathway serves an
important role in the energy supply of GBM. Researchers have
reported that IMP2 controls oxidative phosphorylation and is
crucial for preserving glioblastoma cancer stem cells (43). Additionally, OXPHOS complexes may
be clearly altered in GBM compared with normal brain tissue
(44). Research progress in
targeted therapies also indicates that the simultaneous targeting
of glycolysis and OXPHOS is highly effective in blocking GBM
tumourigenic phenotypes (45).
Therefore, the present study results revealed that LOC541471 may
serve a core role in the tumourigenesis of GBM, and may be a novel
oncogene worth further study.
It should be noted that the current study examined a
limited number of cases. The CGGA database only discloses a small
part of the data, and these include gliomas from Grade I to Grade
IV, as well as certain recurrent GBM cases. Therefore, only 88
cases met the requirements of the present study. It was attempted
to add more data from other databases, however, standardisation of
data from different sequencing platforms is not possible.
Therefore, these 88 cases were selected for analysis. As more data
become available in the CGGA database, more cases will be included
in future studies.
In conclusion, using GBM data from the CGGA database
and integrated WGCNA, a survival-associated gene module was
identified, and 195 candidate key genes were obtained from this
gene module. Among them, 33 key genes were proven to be correlated
with OS, and the majority of the genes were involved in pathways
associated with the ECM, ECM proteoglycans and tyrosine kinases
receptor signalling. Furthermore, the lncRNA LOC541471 was
identified as an OS-associated lncRNA, and appeared to serve a role
in the OXPHOS of GBM through the PLEK2 gene. These findings may
significantly enhance our understanding on the aetiology and
underlying molecular events of GBM, and these candidate genes and
pathways may serve as novel prognostic markers and potential
therapeutic targets for GBM.
Funding
This study was supported by the National Natural
Science Foundation of China (grant nos. 81472661 and 81872048), the
National Key Research and Development Program of China (grant no.
2016YFA0500303), the Beijing Municipal Natural Science Foundation
(grant no. 7161004) and the Beijing Municipal Administration of
Hospitals Clinical Medicine Development of Special Funding Support
(grant no. ZYLX201608).
Availability of data and materials
The analysed datasets generated during the study are
available from the corresponding author on reasonable request.
Authors' contributions
XC, YSo and LZ conceived and designed the
experiments. CP, LK and XX performed the GO and PPI analyses. CX,
YSu, YG collected and performed the WGCNA. ZZ, WZ and LH
constructed the Circos plot and other figures. XC, YSo and LZ wrote
the manuscript. All authors read and approved the final
manuscript.
Ethics approval and consent to
participate
Not applicable.
Patient consent for publication
Not applicable.
Competing interests
The authors declare that they have no competing
interests.
Abbreviations:
|
Abbreviations: WGCNA
|
weighted gene co-expression network
analysis; GBM, glioblastoma multiforme; lncRNA, long non-coding
RNA; GO, Gene Ontology; CNS, central nervous system; CGGA, Chinese
Glioma Genome Atlas; PPI, protein-protein interaction; OS, overall
survival; TCGA, The Cancer Genome Atlas; TOM, topological overlap
matrix; KEGG, Kyoto Encyclopaedia of Genes and Genomes; BP,
biological processes; CC, cell composition; MF, molecular function;
ECM, extracellular matrix; OXPHOS, oxidative phosphorylation
|
Acknowledgments
Not applicable.
References
|
1
|
Stoyanov GS and Dzhenkov DL: On the
concepts and history of glioblastoma multiforme-morphology,
genetics and epigenetics. Folia Med (Plovdiv). 60:48–66. 2018.
View Article : Google Scholar
|
|
2
|
Louis DN, Perry A, Reifenberger G, Von DA,
Figarellabranger D, Cavenee WK, Ohgaki H, Wiestler OD, Kleihues P
and Ellison DW: The 2016 World Health Organization classification
of tumors of the central nervous system: A summary. Acta
Neuropathol. 131:803–820. 2016. View Article : Google Scholar : PubMed/NCBI
|
|
3
|
Ostrom QT, Gittleman H, Liao P, Rouse C,
Chen Y, Dowling J, Wolinsky Y, Kruchko C and Barnholtz-Sloan J:
CBTRUS statistical report: Primary brain and central nervous system
tumors diagnosed in the United States in 2007–2011. Neuro Oncol.
16(Suppl 4): iv1–iv63. 2014. View Article : Google Scholar :
|
|
4
|
Stupp R, Mason WP, van den Bent MJ, Weller
M, Fisher B, Taphoorn MJ, Belanger K, Brandes AA, Marosi C, Bogdahn
U, et al: Radiotherapy plus concomitant and adjuvant temozolomide
for glioblastoma. N Engl J Med. 352:987–996. 2005. View Article : Google Scholar : PubMed/NCBI
|
|
5
|
Khasraw M, Ameratunga MS, Grant R, Wheeler
H and Pavlakis N: Antiangiogenic therapy for high-grade glioma.
Cochrane Database Syst Rev. CD0082182014.PubMed/NCBI
|
|
6
|
Weller M, Butowski N, Tran DD, Recht LD,
Lim M, Hirte H, Ashby L, Mechtler L, Goldlust SA, Iwamoto F, et al:
Rindopepimut with temozolomide for patients with newly diagnosed,
EGFRvIII-expressing glioblastoma (ACT IV): A randomised,
double-blind, international phase 3 trial. Lancet Oncol.
18:1373–1385. 2017. View Article : Google Scholar : PubMed/NCBI
|
|
7
|
Yan W, Zhang W, You G, Zhang J, Han L, Bao
Z, Wang Y, Liu Y, Jiang C, Kang C, et al: Molecular classification
of gliomas based on whole genome gene expression: A systematic
report of 225 samples from the Chinese Glioma Cooperative Group.
Neuro Oncol. 14:1432–1440. 2012. View Article : Google Scholar : PubMed/NCBI
|
|
8
|
Langfelder P and Horvath S: WGCNA: An R
package for weighted correlation network analysis. BMC
Bioinformatics. 9:5592008. View Article : Google Scholar : PubMed/NCBI
|
|
9
|
Lv B, Zhang L, Miao R, Xiang X, Dong S,
Lin T, Li K and Qu K: Comprehensive analysis and experimental
verification of LINC01314 as a tumor suppressor in hepatoblastoma.
Biomed Pharmacother. 98:783–792. 2018. View Article : Google Scholar : PubMed/NCBI
|
|
10
|
Clarke C, Madden SF, Doolan P, Aherne ST,
Joyce H, O'Driscoll L, Gallagher WM, Hennessy BT, Moriarty M, Crown
J, et al: Correlating transcriptional networks to breast cancer
survival: A large-scale coexpression analysis. Carcinogenesis.
34:2300–2308. 2013. View Article : Google Scholar : PubMed/NCBI
|
|
11
|
Liu XY, Gerges N, Korshunov A, Sabha N,
Khuong-Quang DA, Fontebasso AM, Fleming A, Hadjadj D,
Schwartzentruber J, Majewski J, et al: Frequent ATRX mutations and
loss of expression in adult diffuse astrocytic tumors carrying
IDH1/IDH2 and TP53 mutations. Acta Neuropathol. 124:615–625. 2012.
View Article : Google Scholar : PubMed/NCBI
|
|
12
|
Brennan CW, Verhaak RG, McKenna A, Campos
B, Noushmehr H, Salama SR, Zheng S, Chakravarty D, Sanborn JZ,
Berman SH, et al: The somatic genomic landscape of glioblastoma.
Cell. 155:462–477. 2013. View Article : Google Scholar : PubMed/NCBI
|
|
13
|
Ashburner M, Ball CA, Blake JA, Botstein
D, Butler H, Cherry JM, Davis AP, Dolinski K, Dwight SS, Eppig JT,
et al: Gene ontology: Tool for the unification of biology. The Gene
Ontology Consortium. Nat Genet. 25:25–29. 2000. View Article : Google Scholar : PubMed/NCBI
|
|
14
|
Kanehisa M: The KEGG database. Novartis
Found Symp. 247:91–101; discussion 101–103, 119–128, 244–152. 2002.
View Article : Google Scholar
|
|
15
|
Mi H, Dong Q, Muruganujan A, Gaudet P,
Lewis S and Thomas PD: PANTHER version 7: Improved phylogenetic
trees, orthologs and collaboration with the Gene Ontology
Consortium. Nucleic Acids Res. 38(Database Issue): D204–D210. 2010.
View Article : Google Scholar
|
|
16
|
Szklarczyk D, Franceschini A, Wyder S,
Forslund K, Heller D, Huerta-Cepas J, Simonovic M, Roth A, Santos
A, Tsafou KP, et al: STRING v10: Protein-protein interaction
networks, integrated over the tree of life. Nucleic Acids Res.
43(Database Issue): D447–D452. 2015. View Article : Google Scholar
|
|
17
|
Shannon P, Markiel A, Ozier O, Baliga NS,
Wang JT, Ramage D, Amin N, Schwikowski B and Ideker T: Cytoscape: A
software environment for integrated models of biomolecular
interaction networks. Genome Res. 13:2498–2504. 2003. View Article : Google Scholar : PubMed/NCBI
|
|
18
|
Tang Z, Li C, Kang B, Gao G, Li C and
Zhang Z: GEPIA: A web server for cancer and normal gene expression
profiling and interactive analyses. Nucleic Acids Res. 45:W98–W102.
2017. View Article : Google Scholar : PubMed/NCBI
|
|
19
|
McLean CY, Bristor D, Hiller M, Clarke SL,
Schaar BT, Lowe CB, Wenger AM and Bejerano G: GREAT improves
functional interpretation of cis-regulatory regions. Nat
Biotechnol. 28:495–501. 2010. View
Article : Google Scholar : PubMed/NCBI
|
|
20
|
Pagliarini R, Shao W and Sellers WR:
Oncogene addiction: Pathways of therapeutic response, resistance,
and road maps toward a cure. EMBO Rep. 16:280–296. 2015. View Article : Google Scholar : PubMed/NCBI
|
|
21
|
Yang F, Shen Y, Zhang W, Jin J, Huang D,
Fang H, Ji W, Shi Y, Tang L, Chen W, et al: An androgen receptor
negatively induced long non-coding RNA ARNILA binding to miR-204
promotes the invasion and metastasis of triple-negative breast
cancer. Cell Death Differ. 25:2209–2220. 2018. View Article : Google Scholar : PubMed/NCBI
|
|
22
|
Wong N and Wang X: miRDB: An online
resource for microRNA target prediction and functional annotations.
Nucleic Acids Res. 43(Database Issue): D146–D152. 2015. View Article : Google Scholar :
|
|
23
|
Mai WX, Gosa L, Daniels VW, Ta L, Tsang
JE, Higgins B, Gilmore WB, Bayley NA, Harati MD, Lee JT, et al:
Cytoplasmic p53 couples oncogene-driven glucose metabolism to
apoptosis and is a therapeutic target in glioblastoma. Nat Med.
23:1342–1351. 2017.PubMed/NCBI
|
|
24
|
Hu B, Wang Q, Wang YA, Hua S, Sauvé CG,
Ong D, Lan ZD, Chang Q, Ho YW, Monasterio MM, et al: Epigenetic
Activation of WNT5A drives glioblastoma stem cell differentiation
and invasive growth. Cell. 167:1281–1295.e18. 2016. View Article : Google Scholar : PubMed/NCBI
|
|
25
|
Furnari FB, Cloughesy TF, Cavenee WK and
Mischel PS: Heterogeneity of epidermal growth factor receptor
signalling networks in glioblastoma. Nat Rev Cancer. 15:302–310.
2015. View
Article : Google Scholar : PubMed/NCBI
|
|
26
|
Guan X, Zhang C, Zhao J, Sun G, Song Q and
Jia W: CMTM6 overexpression is associated with molecular and
clinical characteristics of malignancy and predicts poor prognosis
in gliomas. EBioMedicine. 35:233–243. 2018. View Article : Google Scholar : PubMed/NCBI
|
|
27
|
Wanibuchi M, Ohtaki S, Ookawa S,
Kataoka-Sasaki Y, Sasaki M, Oka S, Kimura Y, Akiyama Y, Mikami T,
Mikuni N, et al: Actin, alpha, cardiac muscle 1 (ACTC1) knockdown
inhibits the migration of glioblastoma cells in vitro. J Neurol
Sci. 392:117–121. 2018. View Article : Google Scholar : PubMed/NCBI
|
|
28
|
Loriguet L, Morisse MC, Dremaux J, Collet
L, Attencourt C, Coutte A, Boone M, Sevestre H, Galmiche A, Gubler
B, et al: Combining genomic analyses with tumour-derived slice
cultures for the characterization of an EGFR-activating kinase
mutation in a case of glioblastoma. BMC Cancer. 18(964): 2108
|
|
29
|
Busche S, Ge B, Vidal R, Spinella JF,
Saillour V, Richer C, Healy J, Chen SH, Droit A, Sinnett D and
Pastinen T: Integration of high-resolution methylome and
transcriptome analyses to dissect epigenomic changes in childhood
acute lymphoblastic leukemia. Cancer Res. 73:4323–4336. 2013.
View Article : Google Scholar : PubMed/NCBI
|
|
30
|
Parikshak NN, Luo R, Zhang A, Won H, Lowe
JK, Chandran V, Horvath S and Geschwind DH: Integrative functional
genomic analyses implicate specific molecular pathways and circuits
in autism. Cell. 155:1008–1021. 2013. View Article : Google Scholar : PubMed/NCBI
|
|
31
|
Cruchaga C, Karch CM, Jin SC, Benitez BA,
Cai Y, Guerreiro R, Harari O, Norton J, Budde J, Bertelsen S, et
al: Rare coding variants in the phospholipase D3 gene confer risk
for Alzheimer's disease. Nature. 505:550–554. 2014. View Article : Google Scholar
|
|
32
|
Nakada M, Nakada S, Demuth T, Tran NL,
Hoelzinger DB and Berens ME: Molecular targets of glioma invasion.
Cell Mol Life Sci. 64:458–78. 2007. View Article : Google Scholar : PubMed/NCBI
|
|
33
|
Charles NA, Holland EC, Gilbertson R,
Glass R and Kettenmann H: The brain tumor microenvironment. Glia.
60:502–514. 2012. View Article : Google Scholar : PubMed/NCBI
|
|
34
|
Vargová L, Homola A, Zámecník J, Tichý M,
Benes V and Syková E: Diffusion parameters of the extracellular
space in human gliomas. Glia. 42:77–88. 2003. View Article : Google Scholar : PubMed/NCBI
|
|
35
|
Klank RL, Decker Grunke SA, Bangasser BL,
Forster CL, Price MA, Odde TJ, SantaCruz KS, Rosenfeld SS, Canoll
P, Turley EA, et al: Biphasic dependence of glioma survival and
cell migration on CD44 expression level. Cell Rep. 18:23–31. 2017.
View Article : Google Scholar : PubMed/NCBI
|
|
36
|
Kwiatkowska A and Symons M: Signaling
determinants of glioma cell invasion. Adv Exp Med Biol.
986:121–141. 2013. View Article : Google Scholar
|
|
37
|
Liu Y, Carson-Walter EB, Cooper A, Winans
BN, Johnson MD and Walter KA: Vascular gene expression patterns are
conserved in primary and metastatic brain tumors. J Neurooncol.
99:13–24. 2010. View Article : Google Scholar : PubMed/NCBI
|
|
38
|
Mikheeva SA, Mikheev AM, Petit A, Beyer R,
Oxford RG, Khorasani L, Maxwell JP, Glackin CA, Wakimoto H,
González-Herrero I, et al: TWIST1 promotes invasion through
mesenchymal change in human glioblastoma. Mol Cancer. 9:1942010.
View Article : Google Scholar : PubMed/NCBI
|
|
39
|
Pankov R and Yamada KM: Fibronectin at a
glance. J Cell Sci. 115:3861–3863. 2002. View Article : Google Scholar : PubMed/NCBI
|
|
40
|
DeLay M, Jahangiri A, Carbonell WS, Hu YL,
Tsao S, Tom MW, Paquette J, Tokuyasu TA and Aghi MK: Microarray
analysis verifies two distinct phenotypes of glioblastomas
resistant to antiangiogenic therapy. Clin Cancer Res. 18:2930–2942.
2012. View Article : Google Scholar : PubMed/NCBI
|
|
41
|
Janiszewska M, Suvà ML, Riggi N,
Houtkooper RH, Auwerx J, Clément-Schatlo V, Radovanovic I, Rheinbay
E, Provero P and Stamenkovic I: Imp2 controls oxidative
phosphorylation and is crucial for preserving glioblastoma cancer
stem cells. Genes Dev. 26:1926–1944. 2012. View Article : Google Scholar : PubMed/NCBI
|
|
42
|
Dimroth P, Kaim G and Matthey U: Crucial
role of the membrane potential for ATP synthesis by F(1)F(o) ATP
synthases. J Exp Biol. 203:51–59. 2000.
|
|
43
|
Feichtinger RG, Weis S, Mayr JA,
Zimmermann F, Geilberger R, Sperl W and Kofler B: Alterations of
oxidative phosphorylation complexes in astrocytomas. Glia.
62:514–525. 2014. View Article : Google Scholar : PubMed/NCBI
|
|
44
|
Kennedy CR, Tilkens SB, Guan H, Garner JA,
Or PM and Chan AM: Differential sensitivities of glioblastoma cell
lines towards metabolic and signaling pathway inhibitions. Cancer
Lett. 336:299–306. 2013. View Article : Google Scholar : PubMed/NCBI
|
|
45
|
Balbous A, Cortes U, Guilloteau K,
Villalva C, Flamant S, Gaillard A, Milin S, Wager M, Sorel N,
Guilhot J, et al: A mesen-chymal glioma stem cell profile is
related to clinical outcome. Oncogenesis. 3:e912014. View Article : Google Scholar
|