Introduction
Diabetic nephropathy (DN) is a leading cause of
end-stage kidney disease (1-3).
Globally, diabetes has previously been reported to be associated
with a substantially increased risk of mortality. However, this
increased risk is predominantly identified in patients with both
diabetes and kidney disease (1).
The increasing incidence rates of diabetes and DN are a global
public health problem and bring a heavy economic burden to society
(3). Therefore, it is necessary
to elucidate the pathogenesis and identify novel therapeutic
targets of DN.
Podocytes serve a vital role in the glomerular
filtration barrier (4).
Glomerular filtration barrier injury is a hallmark of DN, and a
notable cause of glomerulosclerosis and impaired renal function
(5). Hyperglycemia can induce
podocyte oxidative stress, apoptosis and inflammation (6). Reactive oxygen species (ROS) serve a
vital role in the development of diabetes and diabetic
complications (7). According to
numerous studies, ROS are important secondary messengers for
signaling pathways associated with apoptosis, proliferation, damage
and inflammation (8-11). At the early stages of diabetes,
podocyte apoptosis induced by hyperglycemia can cause glomerular
hyperfiltration (12). High
glucose (HG) can not only cause mitochondrial structural
destruction and dysfunction by affecting mitochondrial biogenesis,
mitophagy and mitochondrial dynamics, but can also release certain
molecules that induce apoptosis. Therefore, reducing ROS production
and blocking mitochondria-mediated podocyte apoptosis have
potential significance in the treatment of diabetic nephropathy
(13). However, the precise
underlying molecular mechanism is not well understood.
The transcription factor EB (TFEB) is a member of
the microphthalmia-transcription factor E family of basic
helix-loop-helix–leucine-zipper transcription factors (14). The role of TFEB as a 'master
regulator' of the autophagy-lysosome pathway has been widely
investigated (15,16). In addition, TFEB is involved in a
variety of pathophysiological processes, including modulating
mitochondrial function through the peroxisome
proliferator-activated receptor-γ coactivator-1α (PGC-1α) and
phosphatase and tensin homolog-induced kinase pathways trigged by
ROS (17,18), responding to endoplasmic reticulum
stress through calcium signaling (19), and participating in immune
responses via macrophage cells (20). Advanced glycation end products
have been demonstrated to reduce the expression of TFEB in
glomerular mesangial cells and produce significant oxidative stress
(21). In addition, monolayer
podocytes overexpressing TFEB were able to restore selective
permeability of albumin (22).
To the best of our knowledge, there has been limited
investigation regarding the associations between TFEB and kidney
diseases, particularly DN. The role of TFEB in the pathogenesis and
progression of DN remains unknown. The present study hypothesized
that decreased TFEB in DN may promote mitochondrial damage,
excessive ROS production and subsequent podocyte apoptosis. The
current study evaluated the changes in TFEB expression in HG
cultured podocytes in vitro, and the effects of
overexpressing TFEB on ROS production, oxidative stress,
mitochondrial damage and apoptosis. Furthermore, possible molecular
mechanisms were investigated.
Materials and methods
Cell culture
Conditioned immortalized mouse podocytes (cat. no.
3111C0001CCC000230) were purchased from the Basic Medical Cell
Center of Beijing Union Medical College (http://www.cellresource.cn/). The present study was
approved by the Pathology Laboratory of Hebei Medical University
(Shijiazhuang, China) for the use of purchased mouse podocytes.
Mouse podocytes were cultured in DMEM-F12 (glucose, 1 g/l; Gibco;
Thermo Fisher Scientific, Inc.) supplemented with 10% fetal bovine
serum (Biological Industries, Kibbutz Beit-Haemek, Israel) and 10
U/ml IFN-γ. Subsequently, the differentiation of podocytes was
induced in the aforementioned medium without IFN-γ at 37°C in a
humidified atmosphere with 5% CO2. Mature podocytes were
used for subsequent experiments after ~10 days.
Stimulation at 37°C was initiated when the cells
grew to 60-70%, and the cells were divided into a normal glucose
(NG) group (5.5 mmol/l D-glucose; Sigma-Aldrich; Merck KGaA), a
mannitol-hypertonic control group (5.5 mmol/l D-glucose + 24.5
mmol/l D-mannitol; Sigma-Aldrich; Merck KGaA) and a HG group (30
mmol/l D-glucose). Fresh medium was provided daily to ensure the
stability of the glucose concentration. Preliminary experiments
demonstrated that the stability of the glucose concentration could
be maintained via providing fresh medium daily (data not shown).
Previous studies have reported that it's possible to maintain a
stable glucose concentration for 72 h (23-25). In addition, N-acetylcysteine (NAC;
5 mmol/l; MedChem Express) and Ly294002 (20 µmol/l; MedChem
Express) were directly added to the HG group at 37°C for 48 h.
Plasmids and transfection
When the cells were grown to 70-90% confluence, 2.5
µg pcDNA3.1 (+)-TFEB plasmid (Cyagen Biosciences, Inc.) or
the control pcDNA3.1 (+)-vector (Cyagen Biosciences, Inc.) were
transfected into different groups of mouse podocytes using
Lipofectamine® 3000 (Thermo Fisher Scientific Inc.),
according to the manufacturer's protocol. Each well of a six-well
plate contained 2.5 µg plasmid or control vector, 3.75
µl Lipofectamine 3000 reagent and 5 µl P3000 reagent.
The cells were cultured in an incubator at 37°C with 5%
CO2. Following 6 h, fresh medium was provided as
required. After 24 h, the aforementioned stimulations were
initiated for 48 h.
Western blotting
Protein was extracted from the treated cells using
RIPA lysate with proteinase inhibitor and phosphatase inhibitor
(Roche Diagnostics) for 30 min on ice. The fractions of nuclear
protein and cytoplasmic protein were separated using Minute™
Cytoplasmic and Nuclear Extraction kit (cat. no. SC-003; Invent
Biotechnologies, Inc.), according to the manufacturer's protocol.
The protein concentration was detected using the BCA method. Equal
amounts of protein (30 µg) were separated by 12% SDS-PAGE.
Following electrophoresis, the targeted proteins on the gel were
transferred to polyvinylidene difluoride (PVDF) membranes and
blocked with 5% skim milk overnight at 4°C. Subsequently, the
membrane was incubated with primary antibodies at room temperature
for 2 h. After three washes with TBS and 0.5% Tween-20, the
membrane was incubated with horseradish peroxidase-labeled
secondary antibody (goat anti-rabbit; cat. no. 074-1506; 1:10,000;
KPL, Inc.) for 1 h at room temperature. Subsequently, the PVDF
membrane was immersed into an electrochemiluminescence solution
(Tangen Biosciences, Inc.) for 2 min in a dark room. Finally, the
band intensities were quantified using ImageJ 1.8.0 software
(National Institutes of Health). The primary antibodies anti-Akt
(cat. no. 4691; 1:1,000), anti-phosphorylated (p)-Akt (Thr308; cat.
no. 9275; 1:1,000), anti-Bad (cat. no. 9239; 1:1,000) and
anti-p-Bad (Ser112; cat. no. 5284; 1:1,000) were purchased from
Cell Signaling Technology, Inc.. Anti-cleaved-caspase-3 (cat. no.
29034; 1:500) and anti-nephrin (cat. no. 31249; 1:1,000) were
purchased from Signalway Antibody LLC. Anti-TFEB (cat. no.
13372-1-AP; 1:1,000), anti-superoxide dismutase 2 (SOD2; cat. no.
24127-1-AP; 1:2:000), anti-heme oxygenase 1 (HO1; cat. no.
10701-1-AP; 1:2,000), anti-PGC1α (cat. no. 20658-1-AP; 1:1,000)
anti-transcription factor mitochondrial (TFAM; cat. no. 19998-1-AP;
1:1,000) and anti-cytochrome c oxidase subunit IV (COX IV; cat. no.
11242-1-AP; 1:1,000) were purchased from Protein Tech Group, Inc..
Anti-Bcl-2 (cat. no. ab59348; 1:1,000), anti-Bax (cat. no. ab32503;
1:2,000) and anti-Bcl-xl (cat. no. ab32370; 1:1,000) were purchased
from Abcam. Anti-β-actin (cat. no. AC026: 1:10,000) was purchased
from ABclonal Biotech Co., Ltd. and anti-lamin B1 (cat. no.
ARG65740; 1:2,000) was purchased from Arigo Biolaboratories
Corp.
Cell immunofluorescence
The cells (1×10⁶) cultured in six-well
plates were fixed in 4% paraformaldehyde at room temperature for 15
min and then treated with 0.2% Triton diluted in PBS for 10 min.
After washing with PBS, goat serum was used to block non-specific
binding site at 37°C for 1 h. Rabbit anti-mouse TFEB antibody
(1:100) was then added and incubated overnight at 4°C. Dylight
488-labeled secondary antibody (cat. no. 072-03-15-06; 1:150; KPL,
Inc.) was added and incubated at 37°C for 1 h. After washing with
PBS, the nuclei were stained with DAPI at room temperature for 5
min. The cells were observed with a confocal microscope
(magnification, ×630; Leica Microsystems GmbH).
Reverse transcription-quantitative
polymerase chain reaction (RT-qPCR)
RNA was extracted from the treated cell using
TRIzol® reagent (Thermo Fisher Scientific Inc.). cDNA
was synthesized using Reverse Transcription mix (Promega
Corporation), followed by qPCR. The thermocycling conditions were
as follows: 95°C for 60 sec, 40 cycles at 95°C for 5 sec, 56°C for
30 sec and extension at 72°C for 30 sec. The mRNA levels of target
genes were detected on an Agilent Mx3000P QPCR system (Agilent
Technologies, Inc.). The relative quantities of mRNA were
calculated using the 2−∆∆Cq method (26) and normalized to the housekeeping
gene β-actin. The primer sequences for qPCR are presented in
Table I.
 | Table IPrimer sequences for reverse
transcription-quantitative polymerase chain reaction. |
Table I
Primer sequences for reverse
transcription-quantitative polymerase chain reaction.
| Primer | Forward
sequence | Reverse
sequence |
|---|
| TFEB |
5′-GTCTTGGGCAAATCCCTTCT-3′ |
5′-TTCGGGCTCCCTGTAGTCG-3′ |
| PGC-1α |
5′-TGTGCTGCTCTGGTTGGT-3′ |
5′-GTTGGATATGATTTCCGATT-3′ |
| TFAM |
5′-GGAATGTGGAGCGTGCTA-3′ |
5′-CAAGACTGATAGACGAGGG-3′ |
| HO-1 |
5′-GCTGGTGATGGCTTCCTT-3′ |
5′-GGGCATAGACTGGGTTCTG-3′ |
| SOD-2 |
5′-GGGCATAGACTGGGTTCTG-3′ |
5′-TTCTCCTCGGTGGCGTTG-3′ |
| COX IV |
5′-TCACTGCGCTCGTTCTGAT-3′ |
5′-CGATCGAAAGTATGAGGGATG-3′ |
| β-actin |
5′-GGCTGTATTCCCCTCCATCG-3′ |
5′-CCAGTTGGTAACAATGCCATGT-3′ |
Intracellular ROS detection
Cells (1×10⁵) were cultured in six-well
plates and washed three times with PBS following stimulation.
Subsequently, 10 µmol/l fluorescent probe
2′,7′-dichlorodihydrofluorescein diacetate (DCFH-DA) was added to
all groups except the negative control group. The cells were then
incubated in the dark for 30 min at 37°C and washed with PBS. Cells
were collected into a flow-tube-specific tube with a filter and
then analyzed using a flow cytometer (FACS-Aria II; BD Biosciences)
within 1 h and FlowJo 7.6 (FlowJo LLC, Ashland, OR, USA) was used
for analysis.
Mitochondrial ROS detection
After washing with pre-warmed Hanks' balanced salt
solution/Ca/Mg buffer (Solarbio Science and Technology Co., Ltd.)
three times, the cells were incubated in the dark with 5
µmol/l MitoSOX reagent (Thermo Fisher Scientific, Inc.)
working solution at 37°C for 20 min. The cells were observed
immediately under a confocal microscope (magnification, ×630) after
being washed twice with Hanks' buffer.
Mitochondrial morphology detection
Following washing with pre-warmed PBS three times,
the cells were incubated in the dark with 100 nmol/l MitoTracker
Red working solution (Thermo Fisher Scientific Inc.) at 37°C for 15
min. Following incubation, the cells were washed three times and
then directly visualized by laser scanning confocal microscopy
(magnification, ×630; Leica Microsystems GmbH).
Detection of mitochondrial membrane
potential
The cells (1×10⁶) were cultured in a
60-mm dish. Following stimulation, the cells were washed three
times with PBS and 10 µg/ml JC-1 was added, according to the
manufacturer's protocol. The cells were incubated in the dark at
37°C for 20 min. After incubation, the cells were washed three
times and immediately images were captured with a confocal
microscope (magnification, ×630; Leica Microsystems GmbH). The
change in mitochondrial membrane potential is represented by the
ratio of red to green fluorescence.
Flow cytometry detection of cell
apoptosis
Treated cells (1×10⁵) were collected into
an EP tube and washed twice with pre-chilled PBS. Subsequently, 100
µl 1X binding buffer (cat. no. 51-66121E; BD Pharmingen; BD
Biosciences), 5 µl PE Annexin V (cat. no. 51-65875X′ BD
Pharmingen; BD Biosciences) and 5 µl 7-ADD (cat. no.
51-68981E; BD Pharmingen; BD Biosciences) were added according to
the protocol, and the cells were incubated in the dark for 15 min
at room temperature. Then, 400 µl 1X binding buffer was
added to each tube and transferred to a special flow tube with a
filter protected from light. Cell apoptosis was detected using a
flow cytometer (FACS-Aria II; BD Biosciences) within 1 h and FlowJo
7.6 (FlowJo LLC) was used for analysis.
Statistical analysis
SPSS 21.0 (IBM Corp.) was used to analyze all data.
Data are presented as the mean ± standard deviation. Each set of
data represents at least three independent experiments. Differences
among multiple groups were statistically analyzed using one-way
ANOVA followed by Bonferroni's post hoc test. P<0.05 was
considered to indicate a statistically significant difference.
Results
HG induces time-dependent changes in TFEB
expression and induces its nuclear translocation in podocytes
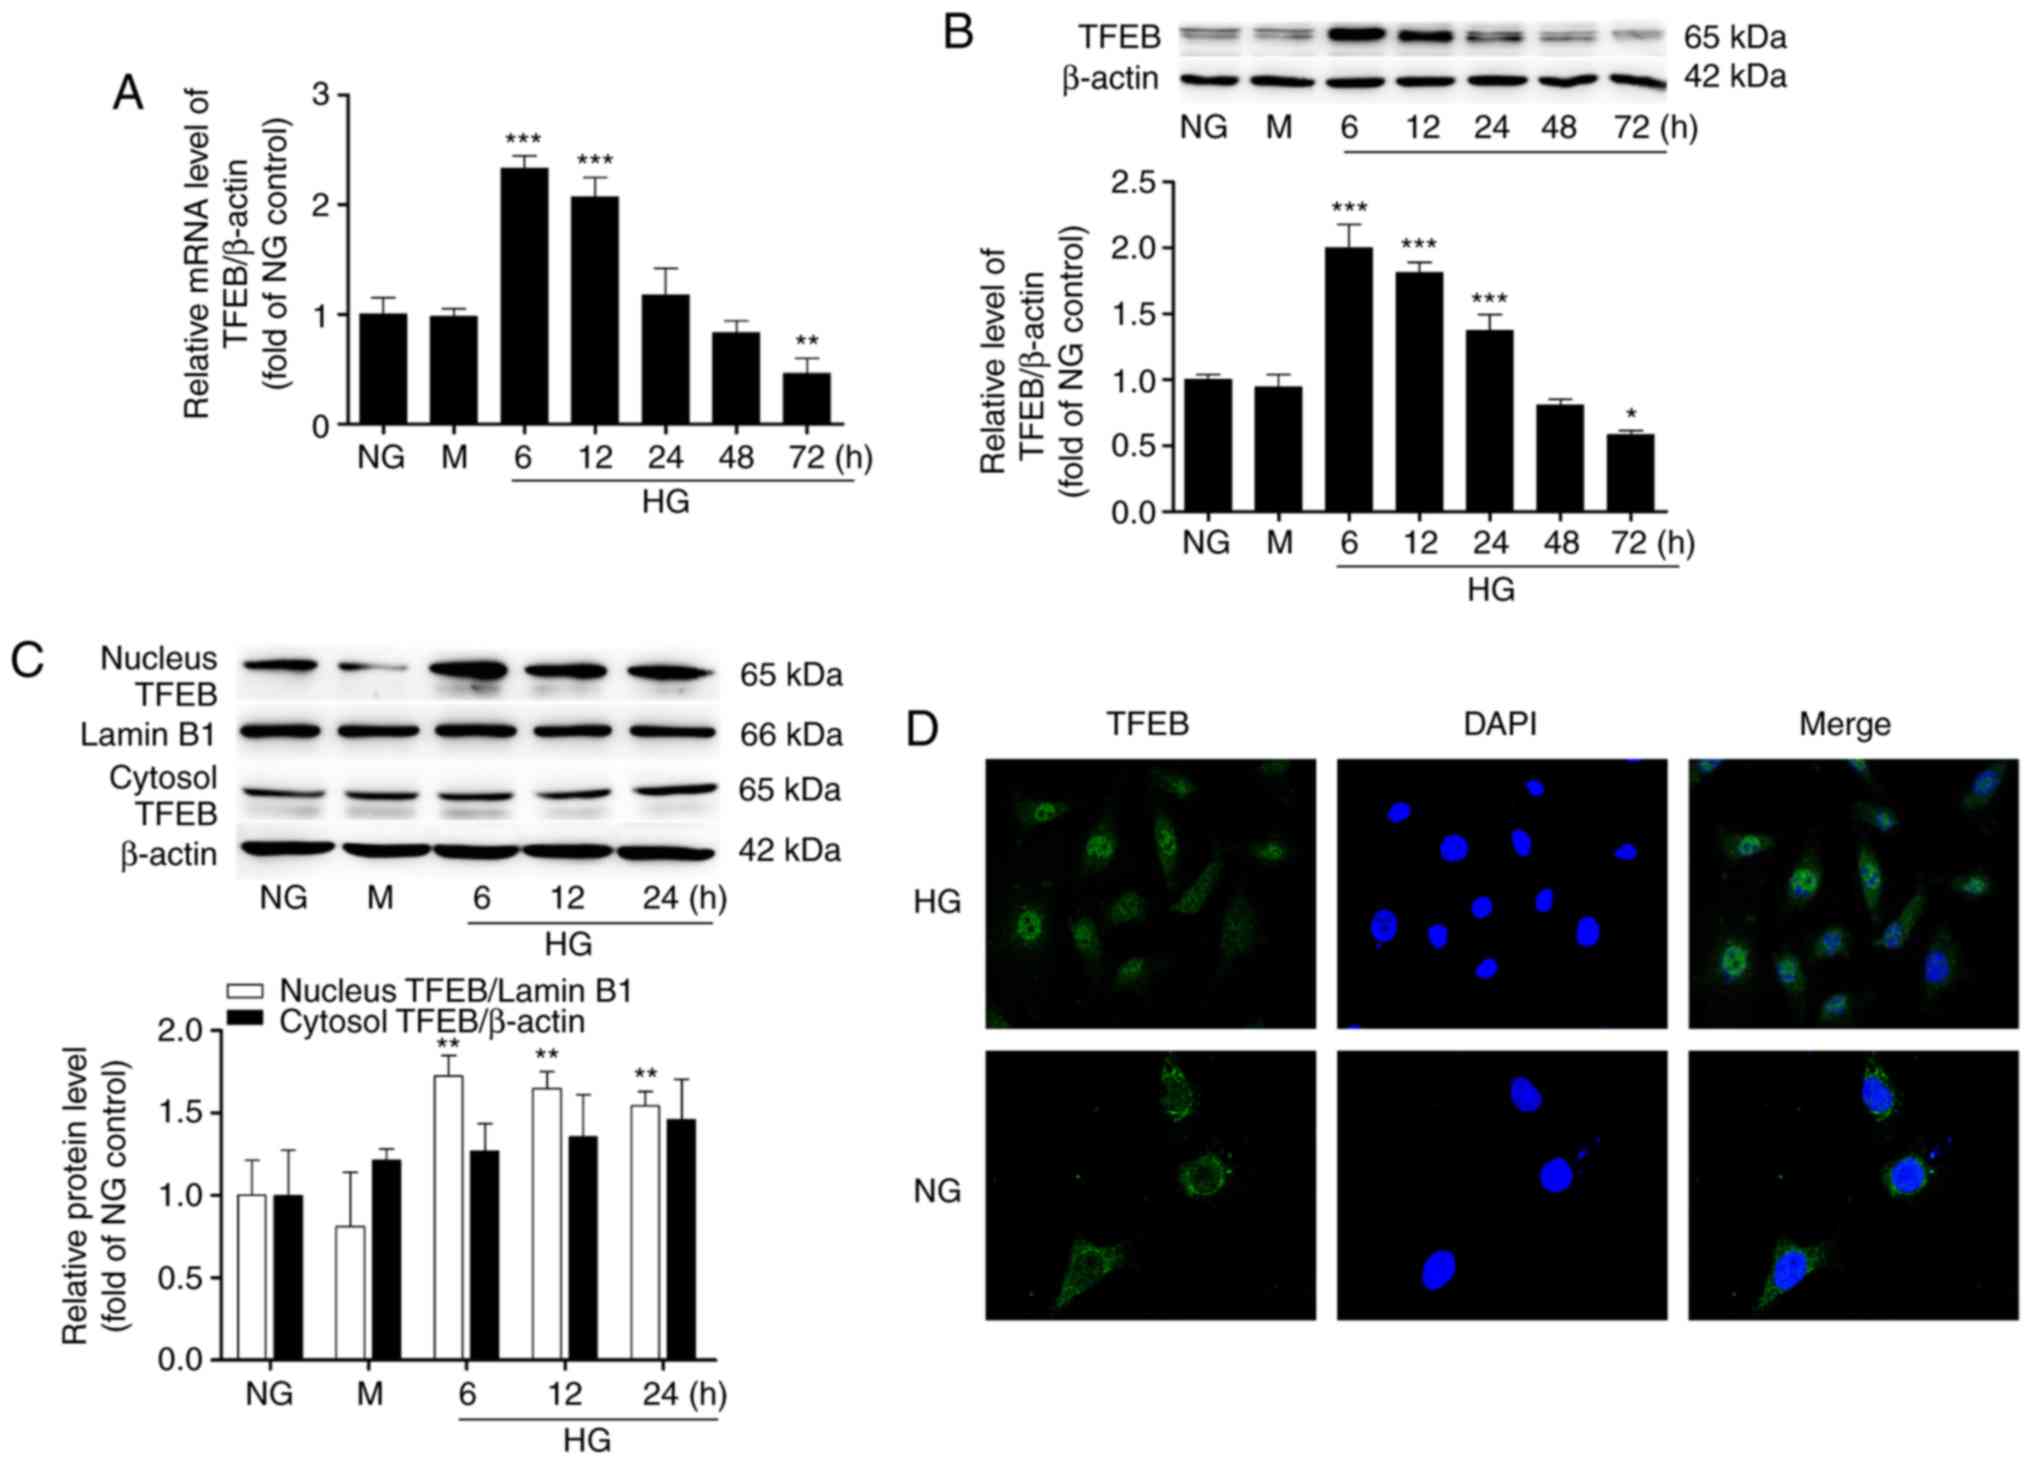
The mRNA and protein levels of TFEB were detected by
RT-qPCR and western blot analysis, respectively. The results
demonstrated that the expression of TFEB induced by HG was
time-dependent, with a tendency to increase first and then
decrease. Compared with the NG group, the level of TFEB
significantly increased after 6 h of HG culture and then gradually
decreased. After 72 h of HG culture, the protein level of TFEB
decreased to 58% of the level of the NG group and the mRNA level of
TFEB decreased to 46% (Fig. 1A and
B). However, no significant difference was observed in the
expression level of TFEB between the NG group and the
mannitol-hypertonic group. Within 24 h following HG stimulation,
the TFEB level in the nucleus was significantly higher compared
with that in the NG group, while the protein level of TFEB in the
cytosol did not change significantly (Fig. 1C). Cellular immunofluorescence
also revealed that the nuclear location of TFEB was weak and the
cytoplasmic fluorescence was strong in the NG group, while the
nuclear location of TFEB increased and the fluorescence of the
nucleus was enhanced in the HG group (Fig. 1D).
Overexpression of TFEB alleviates
HG-induced oxidative stress in mouse podocytes
To further clarify the role of TFEB in HG
stimulation, plasmids overexpressing TFEB were transfected into
mouse podocytes. The efficacy of transfection is presented in
Fig. S1. It was identified that
the expression of TFEB significantly increased following
transfection with TFEB-overexpression plasmids. The present study
further detected the expression of the anti-oxidative
stress-related proteins SOD2 and HO1 using RT-qPCR and western blot
analysis after 48 h of HG induction. The results demonstrated that
the mRNA and protein levels of SOD2 and HO1 in the HG group were
significantly decreased compared with those of the NG group.
Overexpression of TFEB significantly reversed the HG-induced
decease in SOD2 and HO1, and there was no significant difference
from the positive control HG + NAC group. No significant changes
were observed between the HG + control group (podocytes transfected
with empty vectors) and the HG group (Fig. 2A and B).
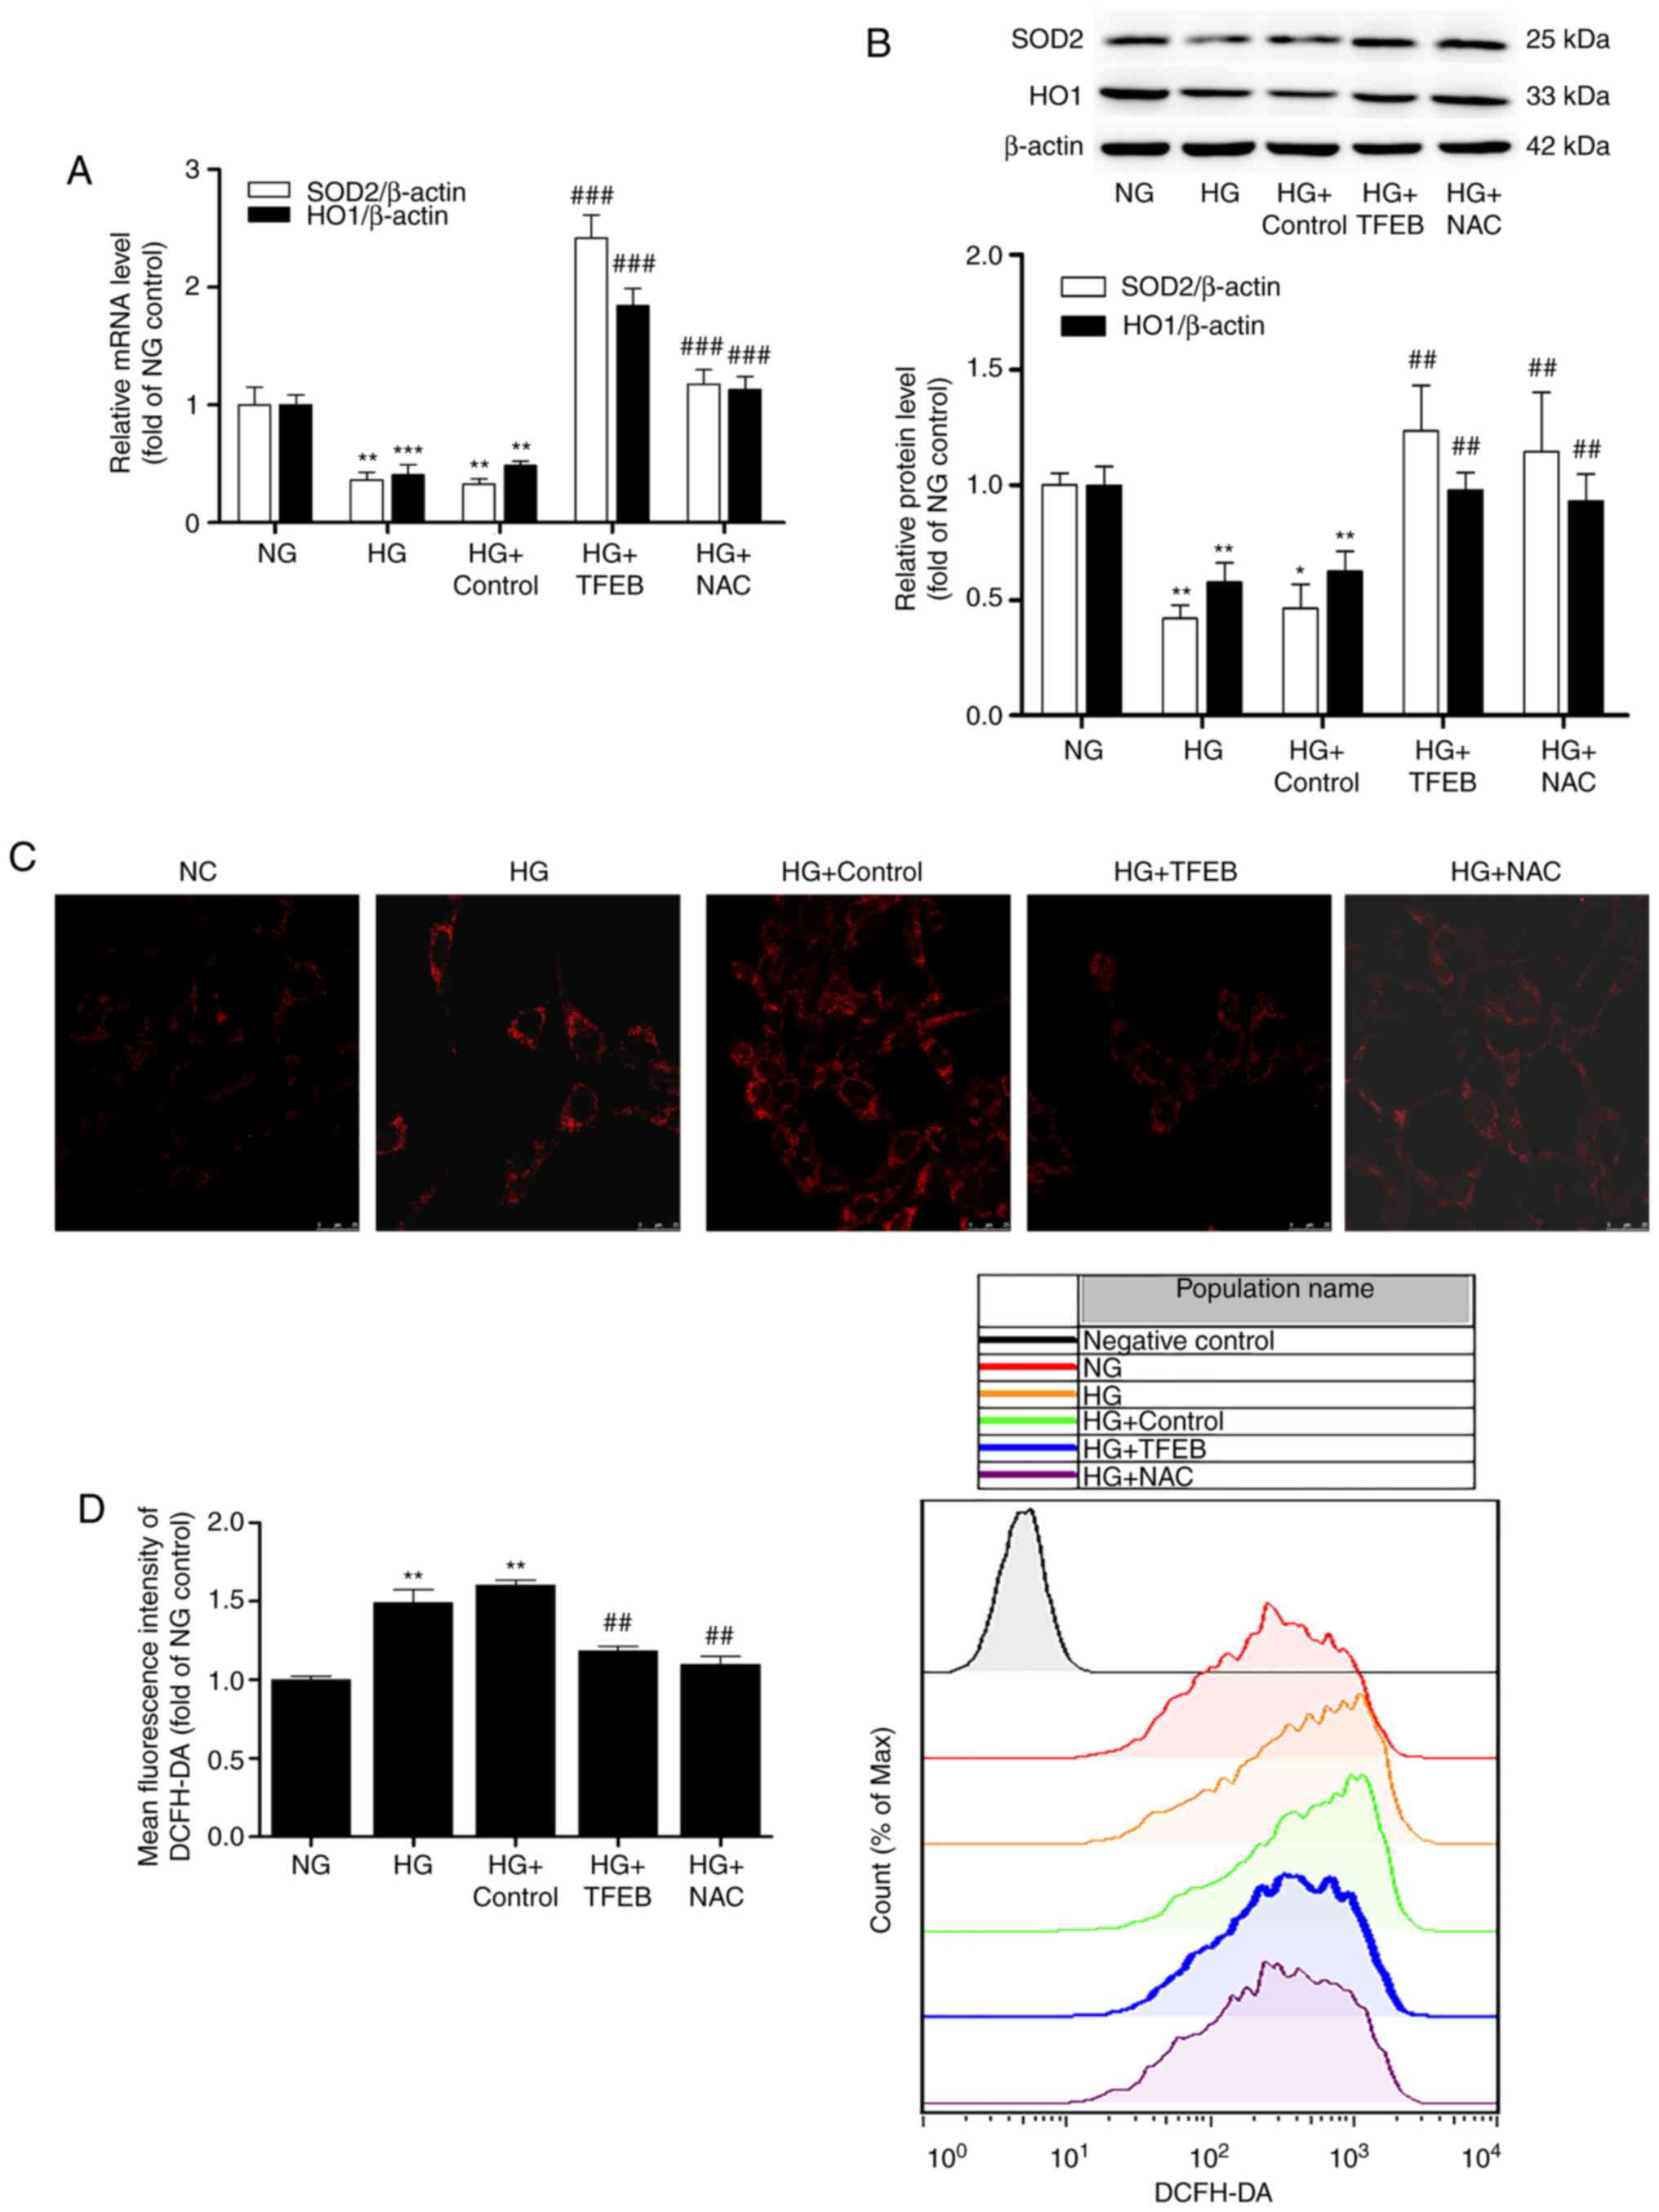 | Figure 2Overexpression of TFEB reduces
HG-induced podocyte oxidative stress. The HG + TFEB group
transfected with the TFEB expression vector and the HG + control
group transfected with an empty plasmid vector were cultured in HG
medium for 48 h. Subsequently, (A) mRNA and (B) protein levels of
SOD2 and HO1 were detected by reverse transcription-quantitative
polymerase chain reaction and western blot analysis, respectively.
(C) Detection of mitochondrial ROS accumulation by confocal
microscopy. (D) Flow cytometry analysis of intracellular ROS using
a DCFH-DA fluorescent probe. Scale bar=25 µm; Magnification,
×630. *P<0.05, **P<0.01,
***P<0.001 vs. NG group. ##P<0.01,
###P<0.001 vs. HG + control group. HG, high glucose;
TFEB, transcription factor EB; NG, normal glucose; NAC,
N-acetylcysteine; SOD2, superoxide dismutase 2; HO1, anti-heme
oxygenase 1; DCFH-DA, 2′,7′-dichlorodihydrofluorescein
diacetate. |
Subsequently, the fluorescence probes MitoSOX Red
and DCFH-DA were used to detect ROS in each group. The
overexpression of TFEB and NAC-treatment significantly reduced the
production and accumulation of ROS induced by HG. These results
suggest that overexpression of TFEB could reduce the oxidative
stress of podocytes induced by HG (Fig. 2C and D).
Overexpression of TFEB protects the
morphology and function of podocyte mitochondria
Compared with the NG group, the expression levels of
PGC-1α, TFAM and COX IV in the HG group were decreased by 44, 41
and 40%, respectively, while the mRNA and protein levels of PGC-1α,
TFAM and COX IV were significantly increased following
overexpression of TFEB (Fig. 3A and
B), suggesting that TFEB enhanced the mitochondrial biogenesis
function.
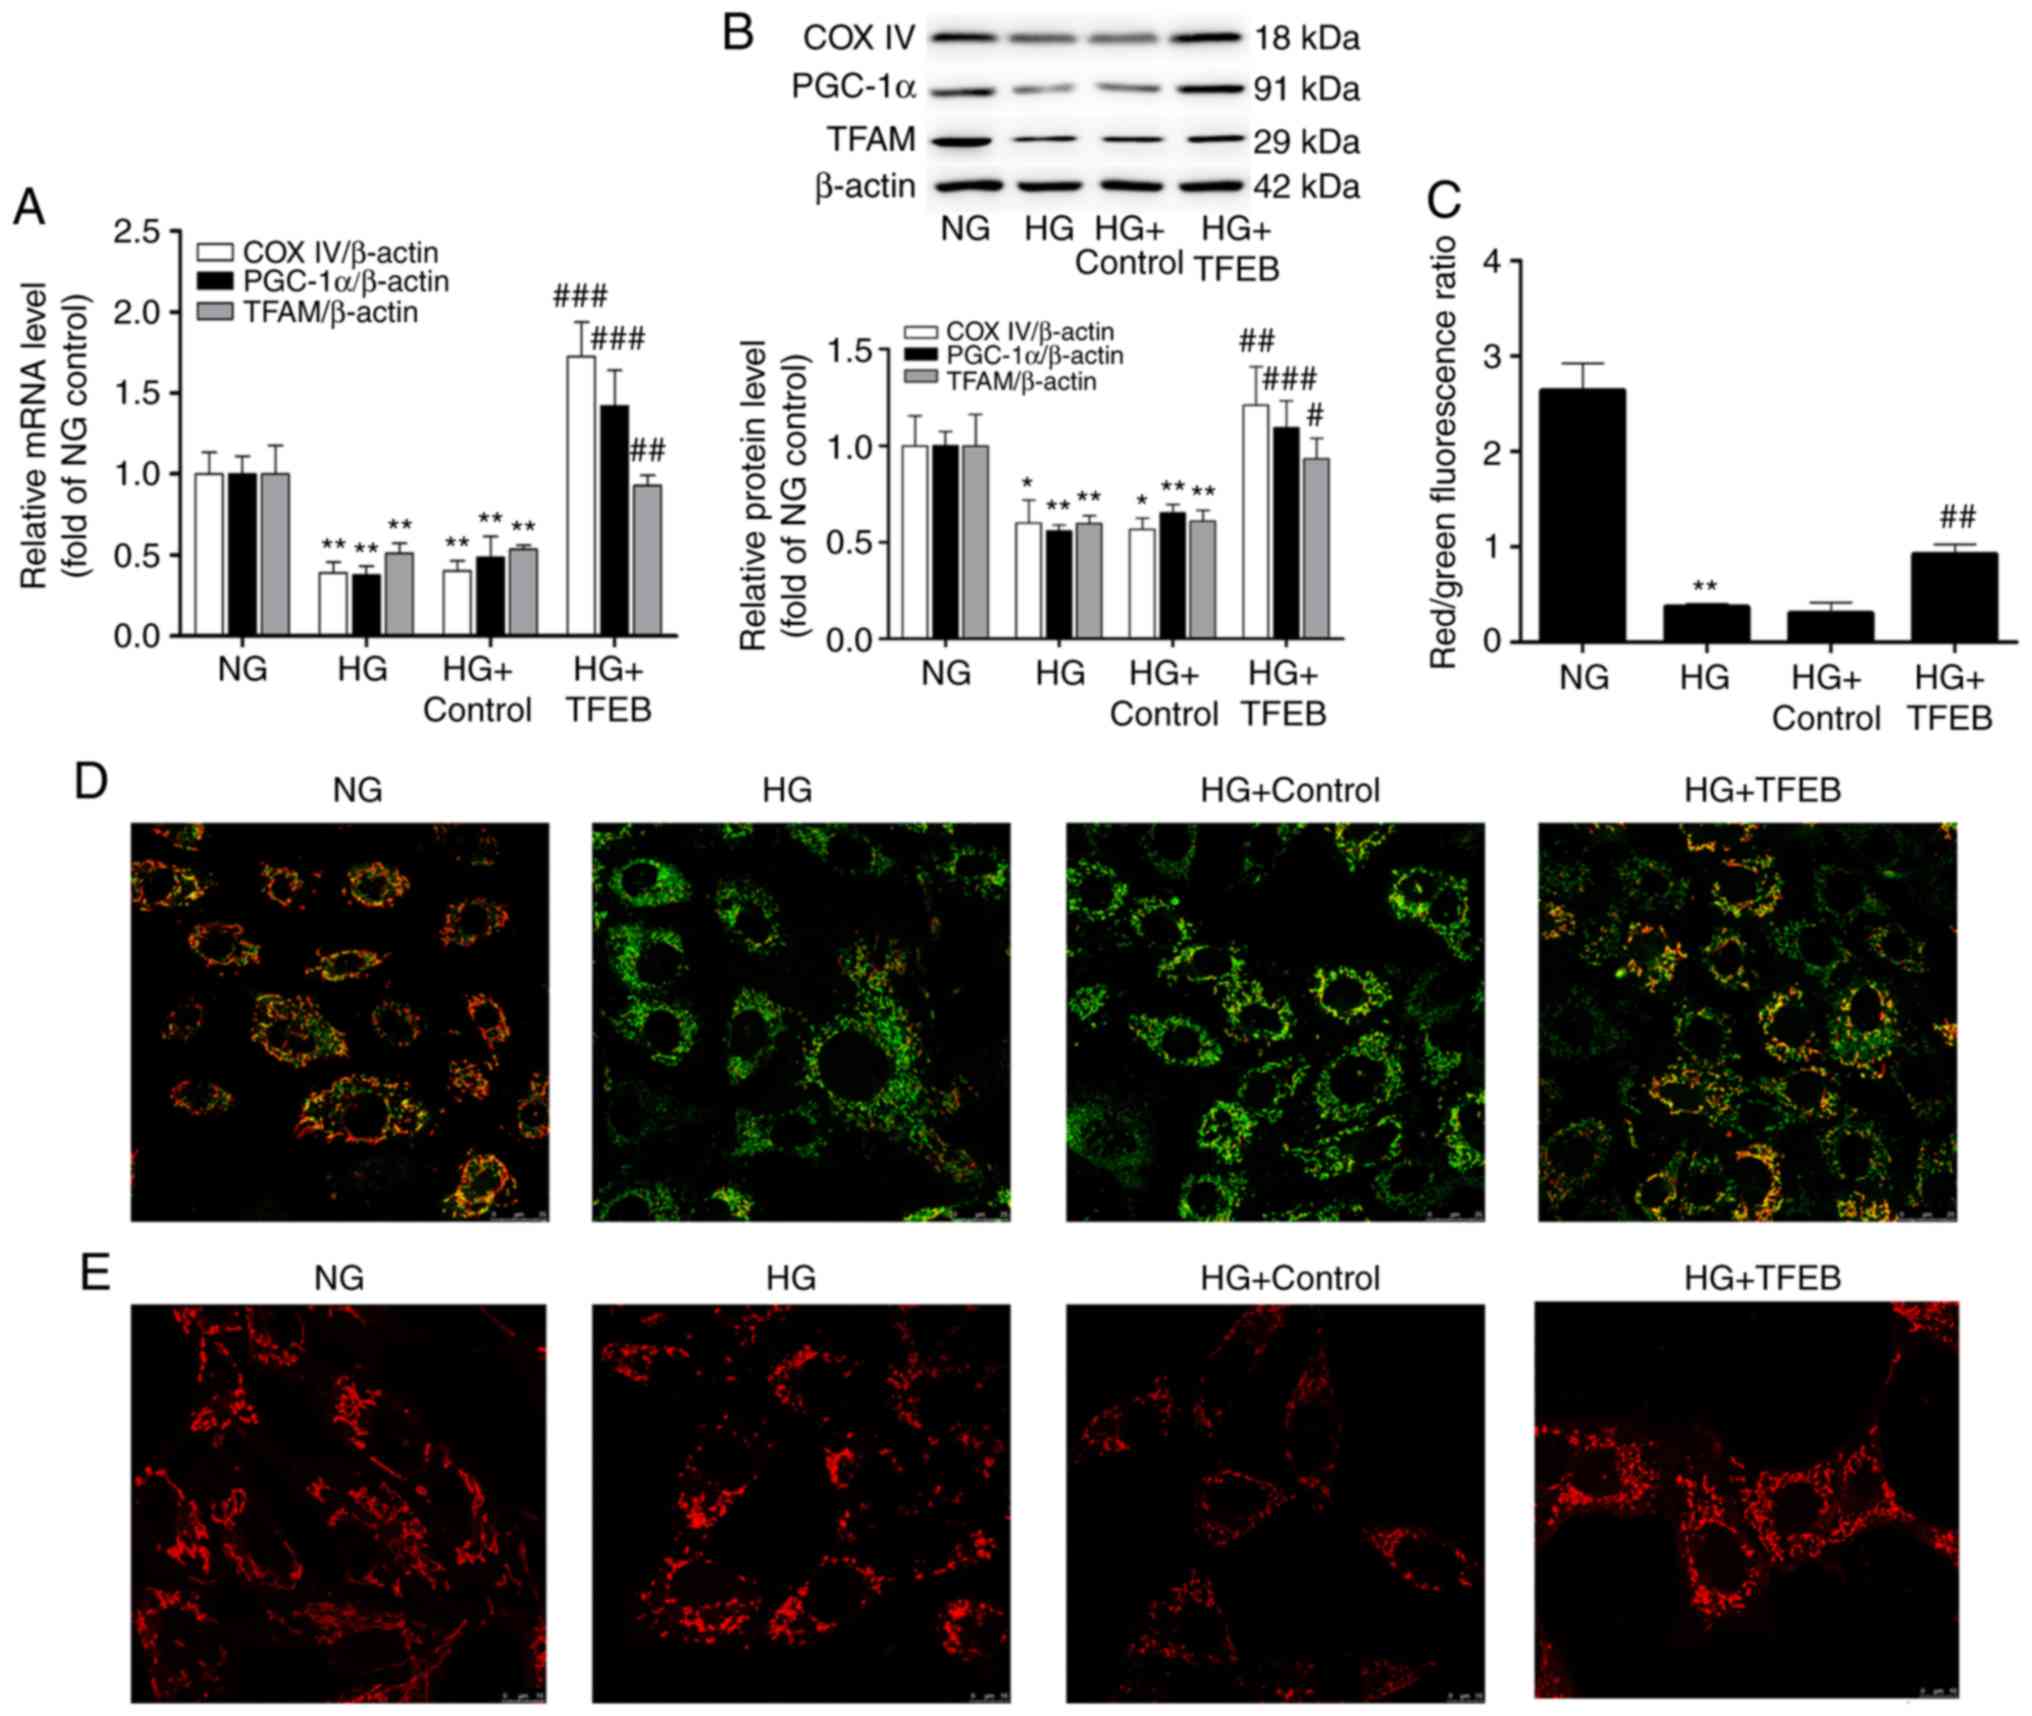 | Figure 3Overexpression of TFEB can maintain
mitochondrial morphology and function. The HG + TFEB group
transfected with the TFEB expression vector and the HG + control
group transfected with an empty plasmid vector were cultured in HG
medium for 48 h. Then, (A) mRNA and (B) protein levels of PGC-1α,
TFAM and COX IV were detected by reverse transcription-quantitative
polymerase chain reaction and western blot analysis. (C) The red
fluorescence/green fluorescence ratio indicates the change in
mitochondrial membrane potential. (D) Detection of mitochondrial
morphology by confocal microscopy. Scale bar=10 µm ;
Magnification, ×630. (E) Change of mitochondrial membrane potential
of podocytes detected by confocal microscopy. Scale bar=25
µm; Magnification, ×630. *P<0.05,
**P<0.01 vs. NG group. #P<0.05,
##P<0.01, ###P<0.001 vs. HG + Control
group. TFEB, transcription factor EB; HG, high glucose; PGC-1α,
peroxisome proliferator-activated receptor-γ coactivator-1α; TFAM,
transcription factor mitochondrial; COX IV, cytochrome c oxidase
subunit IV; NG, normal glucose. |
The summarized data for the number of
normal/polarized mitochondria are presented in Fig. 3C. The JC-1 probe demonstrated that
JC-1 red fluorescence in the NG group was significantly stronger
compared with JC-1 green. Compared with the NG group, JC-1 green
fluorescence was significantly increased and mitochondrial membrane
potential was significantly decreased in the HG group. The
TFEB-overexpression group demonstrated partial recovery of the
membrane potential reduced by HG and an increase in the number of
polarized mitochondria (Fig. 3D).
Under the confocal microscope, the MitoTracker Red probe revealed
that the mitochondria in the HG group demonstrated swelling and
fragmentation compared with those in the NG group. Compared with
the HG group, the TFEB-overexpression group demonstrated reduced
mitochondrial fragmentation and the number of mitochondria with
normal morphology increased (Fig.
3E).
Overexpression of TFEB alleviates
HG-induced podocyte apoptosis by activating the Akt/Bad
pathway
With prolonged HG stimulation, the expression of
nephrin gradually decreased, while cleaved-caspase-3 and Bax/Bcl-2
gradually increased. By 48 h, nephrin decreased by 40% in the HG
group compared with the NG group, while cleaved-caspase-3 and
Bax/Bcl-2 demonstrated a 1.23 and 2.35-fold increase, respectively
(Fig. 4A). Furthermore, the
phosphorylation levels of Akt and Bad were altered following HG
stimulation. The level of p-Akt first increased and then decreased;
the p-Akt/Akt ratio increased by 70% after 12 h of HG stimulation,
and the p-Akt/Akt and p-Bad/Bad ratios decreased to 48 and 45% of
the NG group after 72 h of HG stimulation, respectively (Fig. 4B).
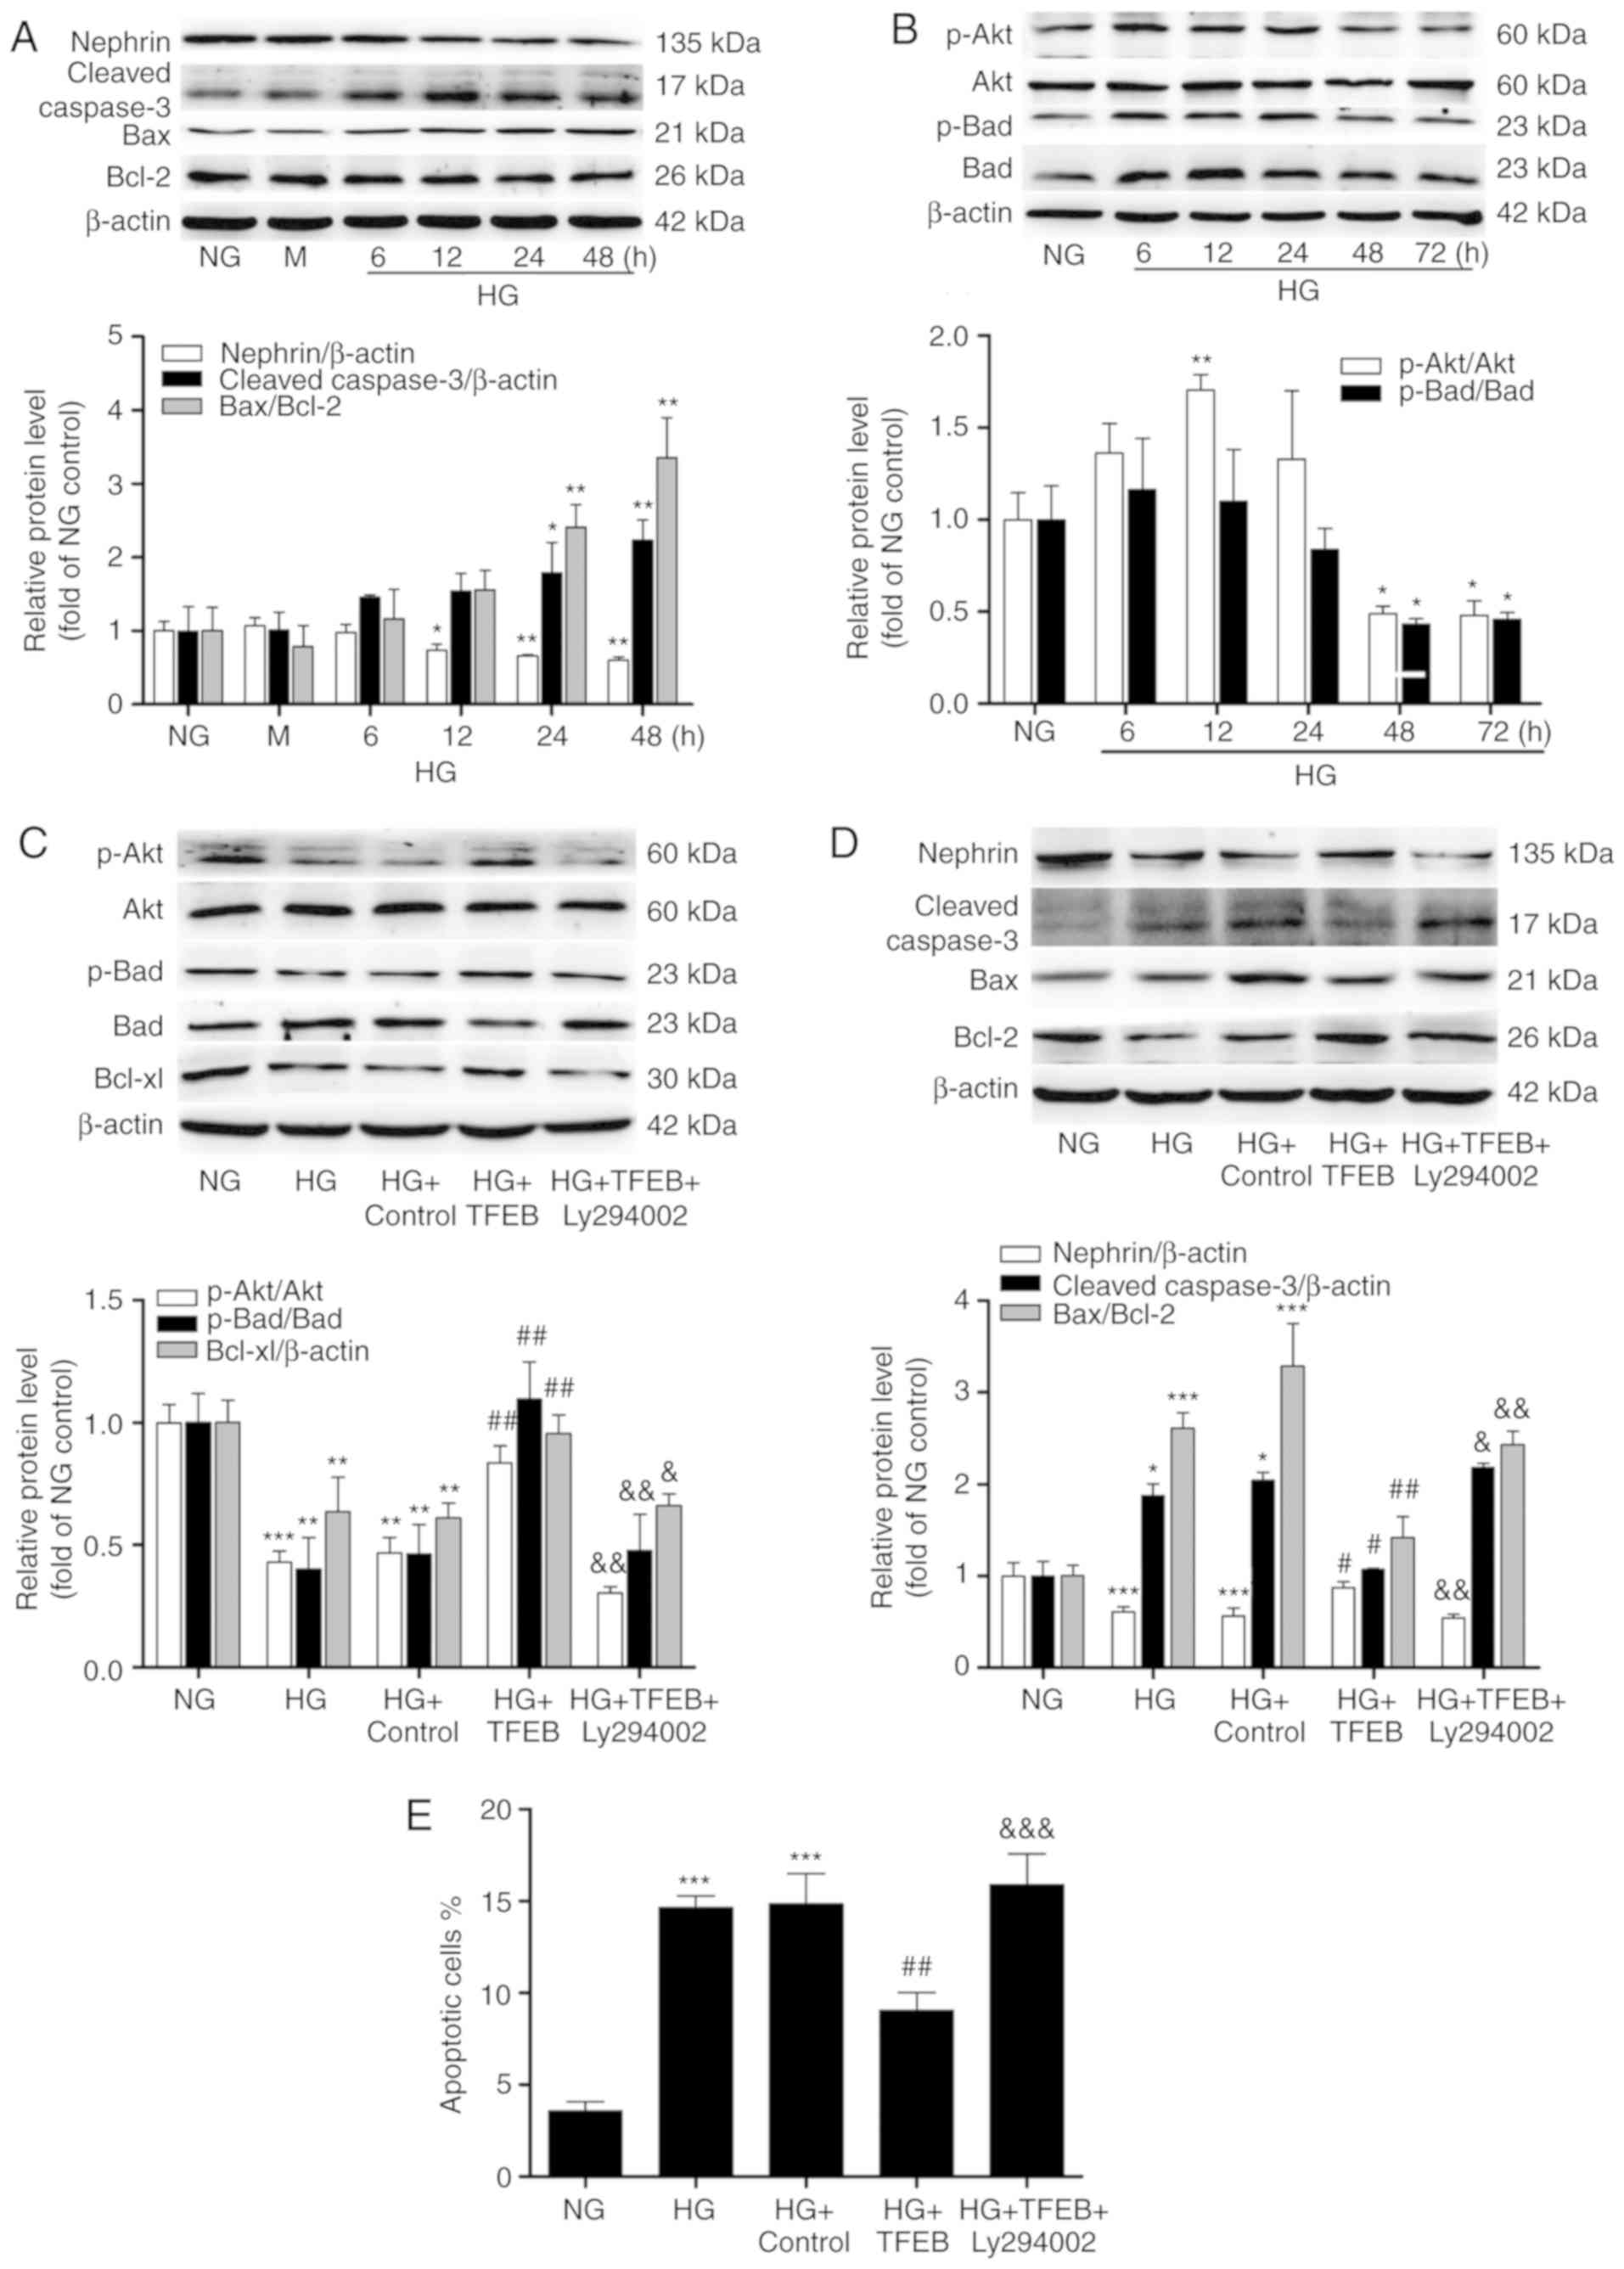 | Figure 4Effects of TFEB overexpression on
podocyte apoptosis and the Akt/Bad pathway. (A) The expression
levels of nephrin, cleaved-caspase-3 and Bax/Bcl-2 in podocytes
exposed to HG at different time points were analyzed by western
blot. (B) The expression levels of p-Akt, Akt, p-Bad, Bad and
downstream Bcl-xl were detected by western blot. (C) p-Akt, AKT,
p-Bad, Bad and Bcl-xl protein expression in the NG, HG, HG +
Control, HG + TFEB and HG + TFEB + Ly294002 groups. (D) Nephrin,
cleaved-caspase-3, Bax and Bcl-2 protein expression in the NG, HG,
HG + Control, HG + TFEB and HG + TFEB + Ly294002 groups. (E) Flow
cytometry was used to detect the apoptosis rate of each group when
podocytes were exposed to HG for 48 h after overexpression of TFEB.
*P<0.05, **P<0.01,
***P<0.001 vs. NG group. #P<0.05,
##P<0.01 vs. HG + Control group.
&P<0.05, &&P<0.01,
&&&<0.001 vs. HG + TFEB group. TFEB,
transcription factor EB; HG, high glucose; p, phosphorylated; NG,
normal glucose; M, mannitol-hypertonic control. |
By overexpressing TFEB, it was observed that
compared with HG, TFEB significantly increased the ratios of
p-Akt/Akt and p-Bad/Bad, significantly enhanced the expression of
downstream Bcl-xl, significantly reduced the ratio of Bax/Bcl-2,
significantly reduced the expression of cleaved-caspase-3 and
significantly increased the expression of nephrin. Furthermore,
when Ly294002 was added, p-Akt, p-Bad, Bcl-xl and nephrin were
significantly inhibited compared with the HG + TFEB group (Fig. 4C and D).
Flow cytometry analyses demonstrated that the
percentage of apoptotic cells in the HG group was significantly
higher compared with that of the NG group (Figs. S2 and 4E). Overexpression of TFEB significantly
reduced the HG-induced increase in apoptosis. The percentage of
apoptotic cells in the HG + TFEB + Ly294002 group was significantly
higher compared with that of the TFEB overexpression group;
however, no significant difference was observed in comparison with
the HG group (Figs. S2 and
4E).
Discussion
Previous studies have demonstrated that the
expression of TFEB decreased in the myocardium of mice fed high-fat
and high-sugar diets (27), and
HG at 30 mmol/l could induce nuclear translocation of TFEB in U937
monocytic cells (28). Similarly,
the present study identified that TFEB expression first increased
and then decreased, and nuclear translocation occurred in mouse
podocytes cultured in HG for different time points. The early
increase may be due to a feedback mechanism that strengthens cells
against undesirable factors and at the same time, entry into the
nucleus initiates the transcription of downstream protective genes;
however, when the stimulation persists, it causes the expression to
decrease rapidly. It is hypothesized that TFEB may serve a positive
role in diabetes and its complications.
ROS can induce the dephosphorylation of TFEB
(29). When excessive ROS
accumulate, oxidative stress occurs and triggers more
pathophysiological cascades. Knockdown of TFEB can lead to
overproduction of ROS in the mitochondria of osteoblasts, which can
be attenuated by NAC (30),
whereas overexpression of TFEB can remove excess ROS to a certain
extent (31). The present study
identified that HG resulted in a large accumulation of ROS in the
cytoplasm and mitochondria of podocytes, and significantly reduced
the expression levels of SOD2 and HO1. During overexpression of
TFEB, oxidative stress was reduced and the expression levels of
SOD2 and HO1 increased significantly, with no difference in stress
level compared with the ROS scavenger NAC-treated group. RT-qPCR
analysis demonstrated that the mRNA levels of SOD2 and HO1
increased by 5.7 and 3.5-fold, respectively, following
overexpression of TFEB, which may be explained by the presence of
TFEB-binding sites on SOD2 and HO1 gene promoters and introns
(31). These results indicate
that TFEB alleviates oxidative stress, reduces accumulated excess
ROS and is associated with upregulation of the anti-oxidative
stress proteins SOD2 and HO1.
TFEB has been reported to be involved in
mitochondrial quality control, can improve the activity of
respiratory chain complexes and can increase ATP synthesis
(17,32). The current results demonstrated
that the TFEB-overexpression group exhibited significantly higher
mRNA and protein levels of PGC-1α, TFAM and COX IV in podocytes
compared with the HG group. PGC-1α and TFAM are important
regulators of mitochondrial biogenesis. Functionally, deacetylation
of PGC-1α activates TFAM, which in turn initiates the replication
of mitochondrial DNA (33). COX
IV is a key factor in COX assembly in the respiratory chain and is
also a marker of mitochondria (34). Therefore, the current result
suggests that TFEB enhances mitochondrial biogenesis. In addition,
confocal microscopy demonstrated that the mitochondrial rod-like
structure was destroyed and became swollen and fragmented after HG
stimulation, whereas TFEB significantly improved the mitochondrial
morphology. TFEB also partially restored the mitochondrial membrane
potential that was reduced by HG. Considering the previously
reported close association between TFEB and cellular
autophagy/mitophagy (35), we
hypothesize that TFEB serves an important role in protecting
mitochondrial morphology and function, maintaining mitochondrial
renewal, and maintaining mitochondrial homeostasis.
Renal intrinsic cell apoptosis is elevated in DN and
in HG conditions in vitro (36,37). The current study also demonstrated
that in HG-induced apoptosis of podocytes, cleaved-caspase-3 and
Bax/Bcl-2 were significantly increased. Mitochondria are the main
targets of numerous pro-apoptotic factors and initiate apoptosis
after injury. Akt/Bad is an apoptosis-inhibitory pathway involved
in mitochondria (38). Animal
studies have confirmed that by activating Akt/Bad, diabetes-induced
apoptosis can be reduced (39).
Following activation of Akt, Bad phosphorylates and binds to the
14-3-3 protein. This leads to dissociation of downstream Bcl-2 and
Bcl-xl, which then bind to Bax to inhibit the pro-apoptotic effects
of Bax (40,41), blocking the cascade of subsequent
apoptosis. The present study identified that phosphorylation of Akt
and Bad decreased significantly after 48 h of HG stimulation and
after 72 h p-Akt/Akt and p-Bad/Bad decreased to less than 50% of
the NG group. TFEB can promote the phosphorylation of Akt (42). In the current study,
overexpression of TFEB partially reversed the HG-reduced p-Akt/Akt
and p-Bad/Bad, upregulated downstream Bcl-2 and Bcl-xl, decreased
cleaved-caspase-3 and increased the podocyte function protein
nephrin. To further clarify whether TFEB could regulate the Akt
pathway, Ly294002, an Akt phosphorylation inhibitor, was used. It
was observed that the improvement by TFEB to apoptosis was
significantly attenuated. In addition, flow cytometry for detecting
the apoptosis rate in each group was consistent with this. Overall,
the current data suggest that TFEB reduces HG-induced podocyte
apoptosis by activating the Akt/Bad pathway to inhibit the
mitochondrial apoptotic regulatory pathway.
The present findings suggest that overexpression of
TFEB can reduce the production of ROS in podocytes in a HG
environment, relieve oxidative stress, and promote mitochondrial
biogenesis and renewal functions. Furthermore, TFEB could also
reduce HG-induced podocyte apoptosis by activating the Akt/Bad
pathway to inhibit the mitochondrial apoptotic regulatory pathway.
Therefore, TFEB may be considered a potential therapeutic target
for DN.
However, there were certain limitations of the
current study. Firstly, lack of information regarding TFEB location
and the protein level in nuclei and cytoplasm at 72 h was a
limitation. Due to the long time since the study, the data of the
TFEB location and the protein level at 72 h cannot be supplemented.
Other limitations include lack of design interaction experiments
and lack of evaluation of the mitochondria ultra-structure, which
need to be further investigated. In the future, attention should be
paid to these issues to ensure the integrity of the experiments and
data.
Supplementary Data
Acknowledgments
Not applicable.
Funding
No funding was received.
Availability of data and materials
All data generated or analyzed during this study are
included in this article.
Authors' contributions
All authors conceived and designed the experiments.
YK and YL performed the experiments and analyzed the data. TZ wrote
the manuscript. YC and ML modified the manuscript. All authors read
and approved the final manuscript.
Ethics approval and consent to
participate
The present study was approved by the Pathology
Laboratory of Hebei Medical University (Shijiazhuang, China) for
the use of purchased mouse podocytes. All procedures were performed
in accordance with the World Medical Association's Declaration of
Helsinki.
Patient consent for publication
Not applicable.
Competing interests
The authors declare that they have no competing
interests.
References
|
1
|
Afkarian M, Sachs MC, Kestenbaum B, Hirsch
IB, Tuttle KR, Himmelfarb J and de Boer IH: Kidney disease and
increased mortality risk in type 2 diabetes. J Am Soc Nephrol.
24:302–308. 2013. View Article : Google Scholar : PubMed/NCBI
|
|
2
|
Collins AJ, Foley RN, Chavers B,
Gilbertson D, Herzog C, Ishani A, Johansen K, Kasiske BL, Kutner N,
Liu J, et al: US Renal Data System 2013 Annual Data Report. Am J
Kidney Dis. 63:A72014. View Article : Google Scholar
|
|
3
|
Ogurtsova K, da Rocha Fernandes JD, Huang
Y, Linnenkamp U, Guariguata L, Cho NH, Cavan D, Shaw JE and
Makaroff LE: IDF Diabetes Atlas: Global estimates for the
prevalence of diabetes for 2015-2040. Diabetes Res Clin Pract.
128:40–50. 2017. View Article : Google Scholar : PubMed/NCBI
|
|
4
|
Kawakami T, Ren S and Duffield JS: Wnt
signalling in kidney diseases: Dual roles in renal injury and
repair. J Pathol. 229:221–231. 2013. View Article : Google Scholar
|
|
5
|
Conti S, Perico N, Novelli R, Carrara C,
Benigni A and Remuzzi G: Early and late scanning electron
microscopy findings in diabetic kidney disease. Sci Rep.
8:49092018. View Article : Google Scholar
|
|
6
|
Khazim K, Gorin Y, Cavaglieri RC, Abboud
HE and Fanti P: The antioxidant silybin prevents high
glucose-induced oxidative stress and podocyte injury in vitro and
in vivo. Am J Physiol Renal Physiol. 305:F691–F700. 2013.
View Article : Google Scholar : PubMed/NCBI
|
|
7
|
Newsholme P, Haber EP, Hirabara SM,
Rebelato EL, Procopio J, Morgan D, Oliveira-Emilio HC, Carpinelli
AR and Curi R: Diabetes associated cell stress and dysfunction:
Role of mitochondrial and non-mitochondrial ROS production and
activity. J Physiol. 583:9–24. 2007. View Article : Google Scholar : PubMed/NCBI
|
|
8
|
Claussen AD, Fox DJ, Yu XC, Meech RP,
Verhulst SJ, Hargrove TL and Campbell KC: D-methionine pre-loading
reduces both noise-induced permanent threshold shift and outer hair
cell loss in the chinchilla. Int J Audiol. 52:801–807. 2013.
View Article : Google Scholar : PubMed/NCBI
|
|
9
|
Tsukagoshi H, Busch W and Benfey PN:
Transcriptional regulation of ROS controls transition from
proliferation to differentiation in the root. Cell. 143:606–616.
2010. View Article : Google Scholar : PubMed/NCBI
|
|
10
|
Fubini B and Hubbard A: Reactive oxygen
species (ROS) and reactive nitrogen species (RNS) generation by
silica in inflammation and fibrosis. Free Radic Biol Med.
34:1507–1516. 2003. View Article : Google Scholar : PubMed/NCBI
|
|
11
|
Yang HW, Hwang KJ, Kwon HC, Kim HS, Choi
KW and Oh KS: Detection of reactive oxygen species (ROS) and
apoptosis in human fragmented embryos. Hum Reprod. 13:998–1002.
1998. View Article : Google Scholar : PubMed/NCBI
|
|
12
|
Brownlee M: Biochemistry and molecular
cell biology of diabetic complications. Nature. 414:813–820. 2001.
View Article : Google Scholar : PubMed/NCBI
|
|
13
|
Kim WH, Lee JW, Suh YH, Hong SH, Choi JS,
Lim JH, Song JH, Gao B and Jung MH: Exposure to chronic high
glucose induces beta-cell apoptosis through decreased interaction
of glucokinase with mitochondria: Downregulation of glucokinase in
pancreatic beta-cells. Diabetes. 54:2602–2611. 2005. View Article : Google Scholar : PubMed/NCBI
|
|
14
|
Steingrimsson E, Copeland NG and Jenkins
NA: Melanocytes and the microphthalmia transcription factor
network. Annu Rev Genet. 38:365–411. 2004. View Article : Google Scholar : PubMed/NCBI
|
|
15
|
Sardiello M, Palmieri M, di Ronza A,
Medina DL, Valenza M, Gennarino VA, Di Malta C, Donaudy F, Embrione
V, Polishchuk RS, et al: A gene network regulating lysosomal
biogenesis and function. Science. 325:473–477. 2009. View Article : Google Scholar : PubMed/NCBI
|
|
16
|
Settembre C, Di Malta C, Polito VA, Garcia
Arencibia M, Vetrini F, Erdin S, Erdin SU, Huynh T, Medina D,
Colella P, et al: TFEB links autophagy to lysosomal biogenesis.
Science. 332:1429–1433. 2011. View Article : Google Scholar : PubMed/NCBI
|
|
17
|
Ivankovic D, Chau KY, Schapira AH and Gegg
ME: Mitochondrial and lysosomal biogenesis are activated following
PINK1/parkin-mediated mitophagy. J Neurochem. 136:388–402. 2016.
View Article : Google Scholar
|
|
18
|
Erlich AT, Brownlee DM, Beyfuss K and Hood
DA: Exercise induces TFEB expression and activity in skeletal
muscle in a PGC-1α-dependent manner. Am J Physiol Cell Physiol.
314:C62–C72. 2018. View Article : Google Scholar
|
|
19
|
Martina JA, Diab HI, Brady OA and
Puertollano R: TFEB and TFE3 are novel components of the integrated
stress response. EMBO J. 35:479–495. 2016. View Article : Google Scholar : PubMed/NCBI
|
|
20
|
Pastore N, Brady OA, Diab HI, Martina JA,
Sun L, Huynh T, Lim JA, Zare H, Raben N, Ballabio A and Puertollano
R: TFEB and TFE3 cooperate in the regulation of the innate immune
response in activated macrophages. Autophagy. 12:1240–1258. 2016.
View Article : Google Scholar : PubMed/NCBI
|
|
21
|
Peres GB, Schor N and Michelacci YM:
Impact of high glucose and AGEs on cultured kidney-derived cells.
Effects on cell viability, lysosomal enzymes and effectors of cell
signaling pathways. Biochimie. 135:137–148. 2017. View Article : Google Scholar : PubMed/NCBI
|
|
22
|
Alghamdi TA, Majumder S, Thieme K, Batchu
SN, White KE, Liu Y, Brijmohan AS, Bowskill BB, Advani SL, Woo M
and Advani A: Janus kinase 2 regulates transcription factor EB
expression and autophagy completion in glomerular podocytes. J Am
Soc Nephrol. 28:2641–2653. 2017. View Article : Google Scholar : PubMed/NCBI
|
|
23
|
Covington MD and Schnellmann RG: Chronic
high glucose downregulates mitochondrial calpain 10 and contributes
to renal cell death and diabetes-induced renal injury. Kidney Int.
81:391–400. 2012. View Article : Google Scholar
|
|
24
|
Hou Y, Wu M, Wei J, Ren Y, Du C, Wu H, Li
Y and Shi Y: CD36 is involved in high glucose-induced epithelial to
mesenchymal transition in renal tubular epithelial cells. Biochem
Biophys Res Commun. 468:281–286. 2015. View Article : Google Scholar : PubMed/NCBI
|
|
25
|
Ito Y, Hsu MF, Bettaieb A, Koike S, Mello
A, Calvo-Rubio M, Villalba JM and Haj FG: Protein tyrosine
phosphatase 1B deficiency in podocytes mitigates
hyperglycemia-induced renal injury. Metabolism. 76:56–69. 2017.
View Article : Google Scholar : PubMed/NCBI
|
|
26
|
Livak KJ and Schmittgen TD: Analysis of
relative gene expression data using real-time quantitative PCR and
the 2(−Delta Delta C(T)) Method. Methods. 25:402–408. 2001.
View Article : Google Scholar
|
|
27
|
Trivedi PC, Bartlett JJ, Perez LJ, Brunt
KR, Legare JF, Hassan A, Kienesberger PC and Pulinilkunnil T:
Glucolipotoxicity diminishes cardiomyocyte TFEB and inhibits
lysosomal autophagy during obesity and diabetes. Biochim Biophys
Acta. 1861:1893–1910. 2016. View Article : Google Scholar : PubMed/NCBI
|
|
28
|
Tseng HHL, Vong CT, Kwan YW, Lee SM and
Hoi MPM: Lysosomal Ca2+ signaling regulates high
glucose-mediated interleukin-1β secretion via transcription factor
EB in human monocytic cells. Front Immunol. 8:11612017. View Article : Google Scholar
|
|
29
|
Zhang X, Cheng X, Yu L, Yang J, Calvo R,
Patnaik S, Hu X, Gao Q, Yang M, Lawas M, et al: MCOLN1 is a ROS
sensor in lysosomes that regulates autophagy. Nat Commun.
7:121092016. View Article : Google Scholar : PubMed/NCBI
|
|
30
|
Yoneshima E, Okamoto K, Sakai E,
Nishishita K, Yoshida N and Tsukuba T: The transcription factor EB
(TFEB) regulates osteoblast differentiation through
ATF4/CHOP-dependent pathway. J Cell Physiol. 231:1321–1333. 2016.
View Article : Google Scholar
|
|
31
|
Lu H, Fan Y, Qiao C, Liang W, Hu W, Zhu T,
Zhang J and Chen YE: TFEB inhibits endothelial cell inflammation
and reduces atherosclerosis. Sci Signal. 10:2017. View Article : Google Scholar
|
|
32
|
Ma X, Liu H, Murphy JT, Foyil SR, Godar
RJ, Abuirqeba H, Weinheimer CJ, Barger PM and Diwan A: Regulation
of the transcription factor EB-PGC1α axis by beclin-1 controls
mitochondrial quality and cardiomyocyte death under stress. Mol
Cell Biol. 35:956–976. 2015. View Article : Google Scholar : PubMed/NCBI
|
|
33
|
Aquilano K, Vigilanza P, Baldelli S,
Pagliei B, Rotilio G and Ciriolo MR: Peroxisome
proliferator-activated receptor gamma co-activator 1alpha
(PGC-1alpha) and sirtuin 1 (SIRT1) reside in mitochondria: Possible
direct function in mitochondrial biogenesis. J Biol Chem.
285:21590–21599. 2010. View Article : Google Scholar : PubMed/NCBI
|
|
34
|
Zsengellér ZK and Rosen S: The use of
cytochrome C oxidase enzyme activity and immunohistochemistry in
defining mitochondrial injury in kidney disease. J Histochem
Cytochem. 64:546–555. 2016. View Article : Google Scholar : PubMed/NCBI
|
|
35
|
Nezich CL, Wang C, Fogel AI and Youle RJ:
MiT/TFE transcription factors are activated during mitophagy
downstream of Parkin and Atg5. J Cell Biol. 210:435–450. 2015.
View Article : Google Scholar : PubMed/NCBI
|
|
36
|
Zhang X, Zhao Y, Chu Q, Wang ZY, Li H and
Chi ZH: Zinc modulates high glucose-induced apoptosis by
suppressing oxidative stress in renal tubular epithelial cells.
Biol Trace Elem Res. 158:259–267. 2014. View Article : Google Scholar : PubMed/NCBI
|
|
37
|
Zhang X, Liang D, Lian X, Jiang Y, He H,
Liang W, Zhao Y and Chi ZH: Berberine activates Nrf2 nuclear
translocation and inhibits apoptosis induced by high glucose in
renal tubular epithelial cells through a phosphatidylinositol
3-kinase/Akt-dependent mechanism. Apoptosis. 21:721–736. 2016.
View Article : Google Scholar : PubMed/NCBI
|
|
38
|
Zeng KW, Wang XM, Ko H, Kwon HC, Cha JW
and Yang HO: Hyperoside protects primary rat cortical neurons from
neurotoxicity induced by amyloid β-protein via the
PI3K/Akt/Bad/Bcl(XL)-regulated mitochondrial apoptotic pathway. Eur
J Pharmacol. 672:45–55. 2011. View Article : Google Scholar : PubMed/NCBI
|
|
39
|
Tao SC, Yuan T, Rui BY, Zhu ZZ, Guo SC and
Zhang CQ: Exosomes derived from human platelet-rich plasma prevent
apoptosis induced by glucocorticoid-associated endoplasmic
reticulum stress in rat osteonecrosis of the femoral head via the
Akt/Bad/Bcl-2 signal pathway. Theranostics. 7:733–750. 2017.
View Article : Google Scholar : PubMed/NCBI
|
|
40
|
Wang XM, Yao M, Liu SX, Hao J, Liu QJ and
Gao F: Interplay between the Notch and PI3K/Akt pathways in high
glucose-induced podocyte apoptosis. Am J Physiol Renal Physiol.
306:F205–F213. 2014. View Article : Google Scholar
|
|
41
|
Nishihama K, Yasuma T, Yano Y, D'
Alessandro-Gabazza CN, Toda M, Hinneh JA, Baffour Tonto P,
Takeshita A, Totoki T, Mifuji-Moroka R, et al: Anti-apoptotic
activity of human matrix metalloproteinase-2 attenuates diabetes
mellitus. Metabolism. 82:88–99. 2018. View Article : Google Scholar : PubMed/NCBI
|
|
42
|
Mansueto G, Armani A, Viscomi C, D'Orsi L,
De Cegli R, Polishchuk EV, Lamperti C, Di Meo I, Romanello V,
Marchet S, et al: Transcription factor EB controls metabolic
flexibility during exercise. Cell Metab. 25:182–196. 2017.
View Article : Google Scholar :
|