Introduction
Systemic sclerosis (SSc), also called systemic
scleroderma, is a complex autoimmune disease. Pathological features
of SSc include skin and visceral fibrosis, vascular alterations and
auto-antibodies against various cellular antigens (1). The available data show the
prevalence of SSc to be 50-300 cases/per million population/per
year, with the incidence of new cases being 2.3-22.8 cases/per
million population/per year (2).
Despite the rarity of the disease, the mortality rate of SSc is
higher compared with other rheumatic diseases, especially diffuse
cutaneous systemic sclerosis (dcSSc) (3,4).
The pathogenesis of SSc is currently unclear,
although as with other rheumatic diseases its pathogenesis is
complicated. SSc may be caused by genetic susceptibility or by
environmental factors (1).
Genetic association studies and sequencing analysis have identified
factors that may lead to genetic susceptibility to SSc and its
specific complications (5,6).
Gene expression profiling of the whole transcriptome is
increasingly being used to explore disease-related genes and enable
disease classification and clinical prediction (5,6).
Derrett-Smith et al (7)
conducted gene expression profiling analysis of unaffected skin
obtained from patients with localized cutaneous systemic sclerosis
(lcSSc). The results showed that the differentially expressed genes
(DEGs) are related to cardiovascular system and mainly enriched in
fibrotic signaling pathways. It may be helpful to explain the
mechanisms of vascular complications in SSc. Gardner et al
(8) found that biopsy samples
from patients with SSc had a robust and unique gene expression
profile. A total of ~1,800 candidate genes can be used to
distinguish between lesioned skin and normal skin (P<0.05).
Therefore, gene expression analysis of SSc provides a possible
means to gain insights into its pathogenesis. Furthermore, it can
also provide clues and ideas for exploring potential therapeutic
targets.
High-throughput sequencing and microarray technology
offer ideal tools for profiling large gene expression datasets in
order to gain a comprehensive understanding of the mechanisms
underlying various diseases. For example, by microarray technology,
the expression levels of microRNAs (miRNAs) can be evaluated in the
tissue samples from patients and in the normal tissue. This
analysis can reveal a group of differentially expressed miRNAs.
With further functional studies and downstream targeted genes and
pathways recognition, specific miRNAs could be identified as
candidate biomarkers related to disease pathogenesis or progression
(9). The same can be done by
computational approaches (10-12). Through the integrated analysis of
publicly available bioinformatics datasets can also reach the
starting point of identifying effective markers for disease
diagnosis and prognosis (13).
In recent years, with the continuous development of
bioinformatics technology, a series of different analytical methods
have been used for researching disease processes, based on
differentially expressed genes (DEGs). For the present study two
datasets, GSE95065 and GSE76885, were downloaded from the Gene
Expression Omnibus (GEO) database, the sample sources of which were
from SSc patients with affected skin tissue and healthy control
(HC) skin tissue. GEO2R (http://www.ncbi.nlm.nih.gov/geo/geo2r/) is an
interactive online tool that can be used to identify DEGs by
comparing samples from GEO series (14). GEO2R was used to screen DEGs.
Then, the biological processes (BP), cell components (CC),
molecular functions (MF) and signal pathways the two groups of DEGs
are involved in were investigated by Gene Ontology (GO) and Kyoto
Encyclopedia of Genes and Genomes (KEGG) analysis. Next, by framing
the protein-protein interaction (PPI) network and filtering the
significant modules of this network it was possible to define the
top-ten hub genes. The aims of the present study were to identify
novel biomarkers and potential therapeutic targets for SSc.
Materials and methods
Access to public data
The GEO database (http://www.ncbi.nlm.nih.gov/geo) is an open functional
genomics database of high-throughput resources, including
microarrays, gene expression data and ChIP-seq data (15). The selection criteria for this
study were GEO datasets compilated of skin biopsy expression data
obtained genome-wide from patients with SSc and the exclusion
criteria was samples from patients with lcSSc. The Search details
were 'Scleroderma, Systemic'[Mesh] AND 'Homo sapiens'[porgn] AND
('gse'[Filter] AND 'Expression profiling by array'[Filter] AND
'attribute name tissue'[Filter]) and revealed 66 different results
relative to SSc gene expression datasets. After having other
tissues or diseases filtering out, two expression profiling
datasets, GSE95065 [GPL23080 (HG-U133A_2) Affymetrix Human Genome
U133A 2.0 Array] (16) and
GSE76885 (GPL6480 Agilent-014850 Whole Human Genome Microarray
4×44K G4112F) (https://www.ncbi.nlm.nih.gov/geo/query/acc.cgi?acc=GSE76885),
were downloaded from the GEO database. The probes were transformed
into homologous gene symbols by means of the platform's annotation
information. The GSE95065 dataset was based on 15 control (Con)
skin tissue samples from healthy individuals and 18 skin tissue
samples from patients with SSc. The GSE76885 dataset was based on
18 Con skin tissue samples from healthy individuals and 59 skin
tissue samples from patients with SSc. The samples were taken from
an in silico approach. Although GSE76885 was not specific to
dcSSc or lcSSc, there was a strong correlation among the samples in
the SSc group according to the results of the present study, dcSSc
is more common than lcSSc, as in clinical practice so this was
taken into account. The overall design of GSE117928 was performed
on peripheral blood mononuclear cells, GSE73674 was on endothelial
progenitor cell-derived endothelial cells and GSE81292 on lung
tissues. GSE76809 was a SuperSeries composed of SubSeries. Of these
SubSeries, GSE9285 contained gene expression profiling of diffuse
scleroderma and limited scleroderma; GSE32413, GSE45485, GSE59785,
GSE68698 were not genome-wide datasets; samples of other series
were from lcSSc or not from skin tissue.
Intra-group data repeatability test
The Pearson's correlation test was performed to
verify intra-group data repeatability in the per group. The R
programming language was used to provide the software and operating
environment for statistical analysis and drawing of graphs.
Correlations between all samples from the same dataset were
visualized using heat maps which were also drawn using R. Principal
component analysis (PCA) is a commonly used method for sample
clustering and is often used for gene expression, diversity
analysis, resequencing, and other sample clustering based on
various variable information. The intra-group data repeatability of
the dataset was tested by sample clustering analysis.
Identification of DEGs
GEO2R is an interactive web tool that allows users
to compare two or more groups of samples in a GEO series in order
to identify genes that are differentially expressed across
experimental conditions. Results are presented as a table of genes
ordered by significance. GEO2R performs comparisons on original
submitter-supplied processed data tables using the GEOquery and
limma R packages from the Bioconductor project. Bioconductor is an
open source software project (http://www.bioconductor.org/) based on the R
programming language that provides tools for the analysis of
high-throughput genomic data. The GEO query R package parses GEO
data into R data structures that can be used by other R packages.
The limma (Linear Models for Microarray Analysis) R package, which
could perform the paired-samples T test, has emerged as one of the
most widely used statistical tests for identifying differentially
expressed genes (17). It handles
a wide range of experimental designs and data types and applies
multiple-testing corrections on P-values to help correct for the
occurrence of false positives. Therefore, GEO2R provides a simple
interface that allows users to perform R statistical analysis
without command line expertise.
GEO2R was used to search for mRNAs (DEGs) that were
differentially expressed between control tissue samples and SSc
tissue samples. The cut-off criterion was a P<0.05, whereas the
fold-change was ≥1.5 or ≤-1.5. Venn diagrams were used to determine
the intersection between the two data-sets to obtain DEGs in
common. Volcano maps were drawn using the volcano plotting tool
(https://shengxin.ren). The DEGs were then
screened by introducing the two datasets into the FunRich
(functional enrichment analysis tool; http://www.funrich.org/). Venn diagrams were
delineated using an online Venn tool (http://bioinformatics.psb.ugent.be/webtools/Venn/),
which could then be used to visualize common DEGs shared between
the two datasets.
Functional annotation for DEGs using GO
and KEGG analysis
DAVID (https://david.ncifcrf.gov/home.jsp; version 6.8) is an
online analysis tool suite that includes the function of Integrated
Discovery and Annotation (18).
DAVID is an online analysis tool, which could perform GO and KEGG
analysis. Gene Ontology (GO) is a widely used initiative in
bioinformatics and covers three key biological aspects, including
BP, CC, and MF (19). The KEGG
(https://www.kegg.jp/) is one of the most commonly
used biological information databases in the world. To perform GO
and KEGG analysis of DEGs, the DAVID online tool was used. Results
were considered statistically significant if P<0.05.
Construction and analysis of the PPI
network
The Search Tool for the Retrieval of Interacting
Genes (STRING) online database (http://string-db.org) can be used to predict and trace
the PPI network once common DEGs have been imported into it. The
STRING database was used for the construction of the PPI network of
the DEGs. The free visualization software tool, Cytoscape (version
2.8) (20), was used to visualize
PPI networks. Next, the Cytoscape plug-in Molecular Complex
Detection tool (MCODE; version 1.5.1) was used to identify the most
important module on the network map. The criteria for the MCODE
analysis were that the degree of cut-off = 2, MCODE scores >5,
maximum depth = 100, node score cut-off = 0.2 and k-score = 2
(21).
Identification and analysis of hub
genes
Once the degrees were set (degrees ≥10), the hub
genes were identified. Subsequently, following the GO and KEGG
analysis using the DAVID database, functional annotation of the hub
genes was performed. Correlation analysis between the hub genes was
also carried out. A total of three hierarchical clustering
heat-maps of hub gene expression were visualized using R. Finally,
receiver operator characteristic (ROC) curve analysis was performed
to determine the usefulness of these hub genes for predicting
SSc.
Statistical analyses
All statistical analyses were conducted using SPSS
software (version 21.0; IBM Corps.). The Pearson's correlation
coefficient was used to validate the intra-group data repeatability
and to analyze correlation among hub genes. The two-sample t-test
was used for comparing the mean values of two groups (SSc and
control groups). ROC curve analysis was performed to determine the
ability of the hub genes to predict SSc. P<0.05 was considered
to indicate a statistically significant difference.
Results
Validation of the datasets
To further validate the intra-group data
repeatability, the Pearson's correlation test and PCA were
employed. Based on the Pearson's correlation test, it was found
that in the GSE95065 dataset there were strong correlations among
the samples in the control group and that there were also strong
correlations among the samples in the SSc group (Fig. 1A). Based on the PCA the
intra-group data repeatability for GSE95065 was acceptable. The
distances between the samples in the control group were close and
the distances between samples in the SSc group were also close in
the dimension of PC1 (Fig. 1B).
Based on Pearson's correlation test, it was found that for GSE76885
there was a strong correlation among the samples in the control
group and a strong correlation among the samples in the SSc group
(Fig. 2A). The PCA showed the
intra-group data repeatability to be acceptable in the GSE76885
dataset. The distances between per samples in the control group
were close and distances between per samples in the SSc group were
also close in the dimension of PC1 (Fig. 2B).
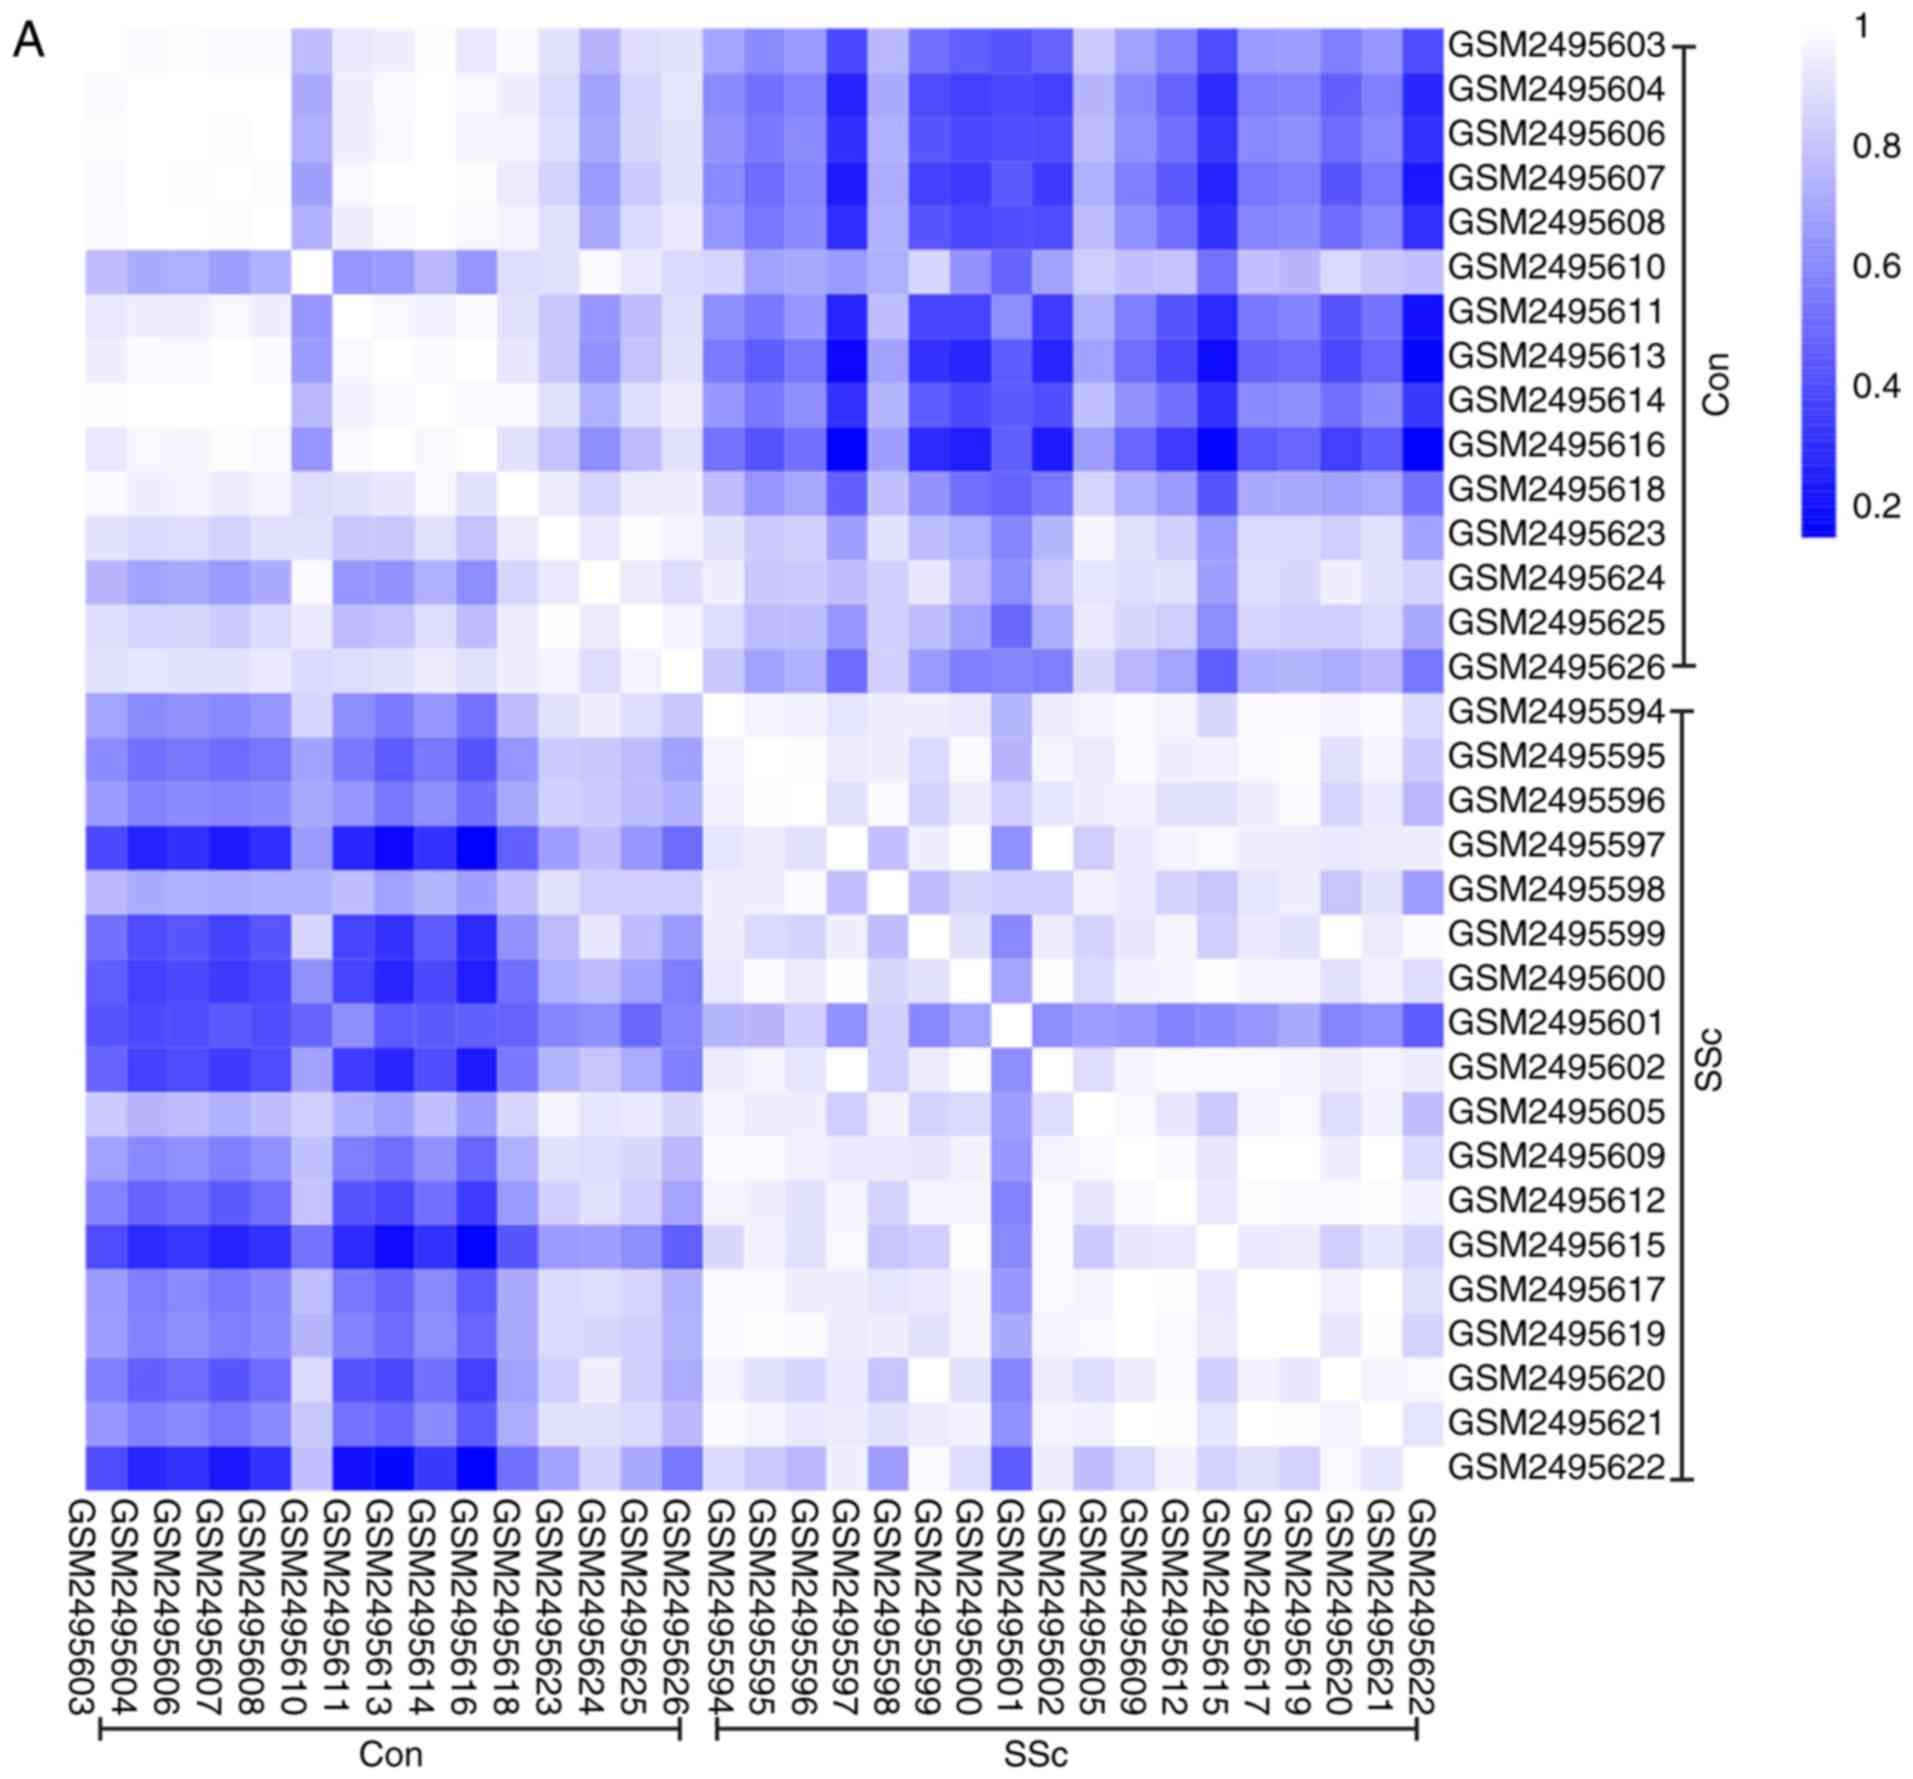 | Figure 1Intra-group data repeatability test
for GSE95065 through the Pearson's correlation analysis and PCA.
(A) Pearson's correlation analysis of samples from the GSE95065
dataset. The color reflects the intensity of the correlation. When
0< correlation <1, there exists a positive correlation. When
-1< correlation <0, there exists a negative correlation. The
larger the absolute value of a number the stronger the correlation.
(B) PCA of samples from the GSE95065 dataset. In the figure, PC1
and PC2 are used as the X-axis and Y-axis, respectively, to draw
the scatter diagram, where each point represents a sample. In such
a PCA diagram, the farther the two samples are from each other, the
greater the difference is between the two samples in gene
expression patterns. PC1, principal component 1; PC2, principal
component 2; PCA, principal component analysis; SSc, Systemic
sclerosis; Con, control. |
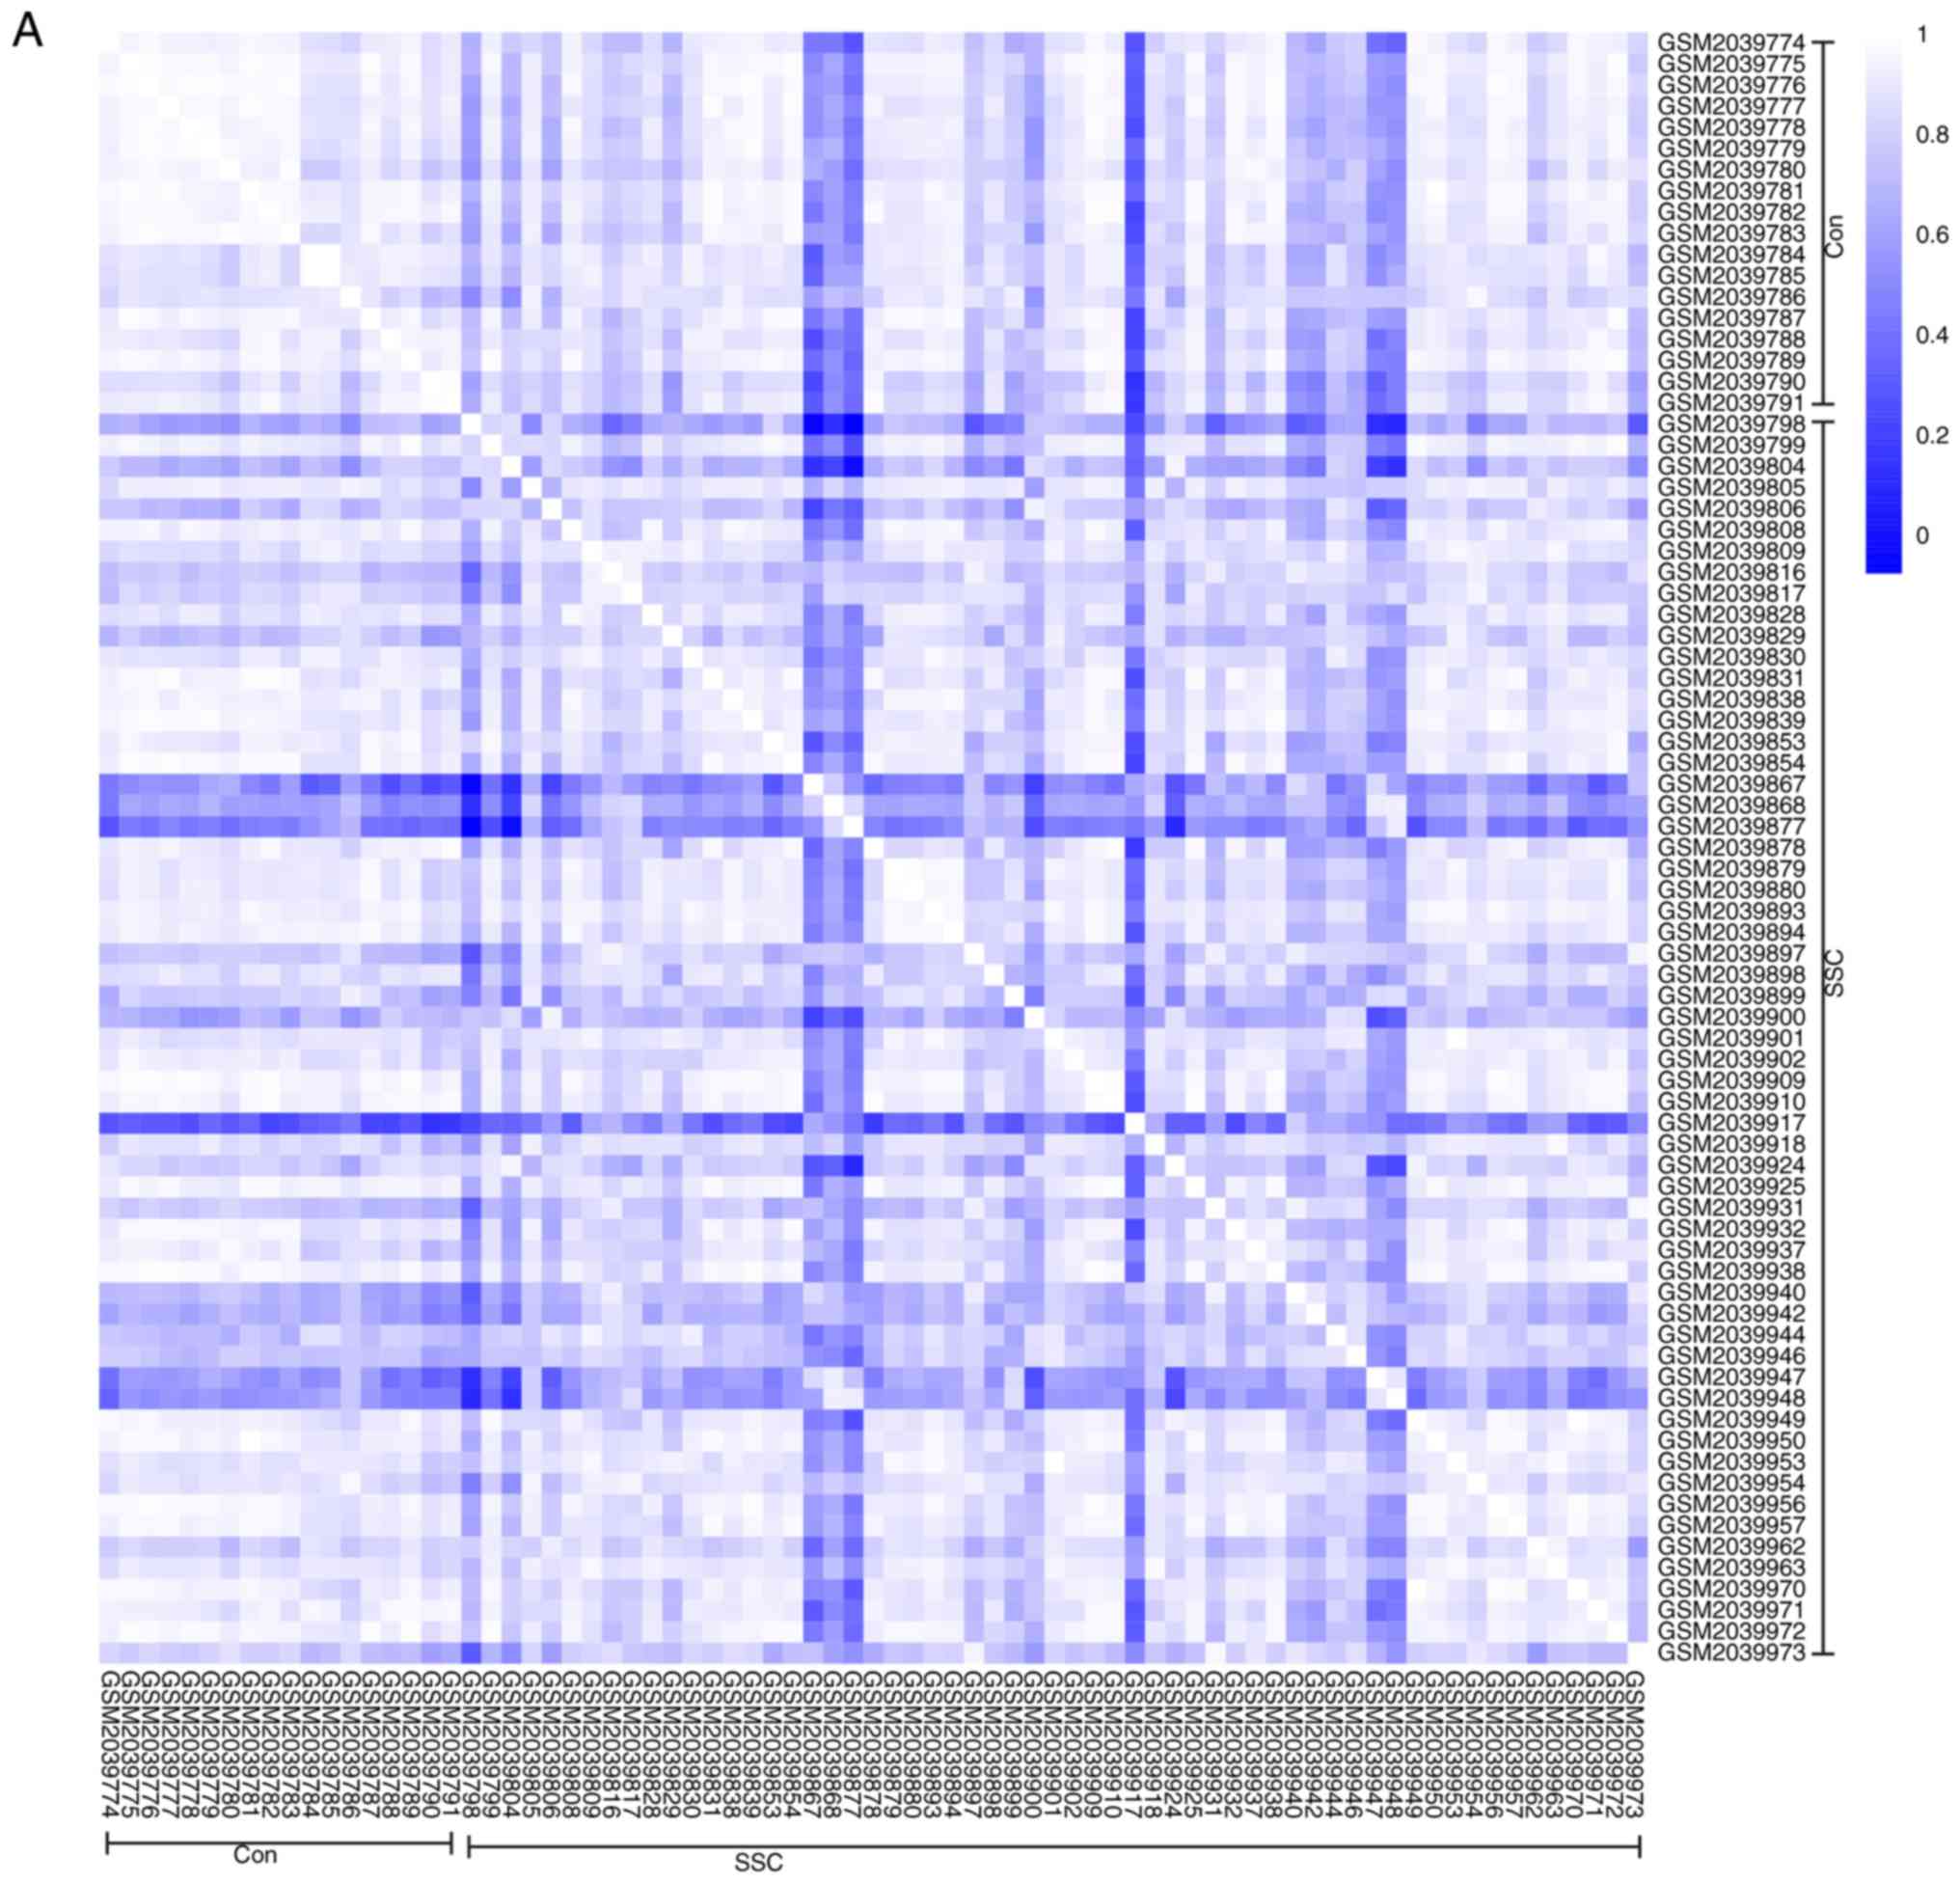 | Figure 2Intra-group data repeatability test
for GSE76885 through the Pearson's correlation analysis and PCA.
(A) Pearson's correlation analysis of samples from the GSE76885
dataset. The color reflects the intensity of the correlation. When
0< correlation <1, there exists a positive correlation. When
-1< correlation <0, there exists a negative correlation. The
larger the absolute value of a number the stronger the correlation.
(B) PCA of samples from the GSE76885 dataset. In the figure, PC1
and PC2 are used as the X-axis and Y-axis, respectively, to draw
the scatter diagram, where each point represents a sample. In such
a PCA diagram, the farther the two samples are from each other, the
greater the difference is between the two samples in gene
expression patterns. PC1, principal component 1; PC2, principal
component 2; PCA, principal component analysis; SSc, systemic
sclerosis. |
Identification of DEGs in SSc and control
samples
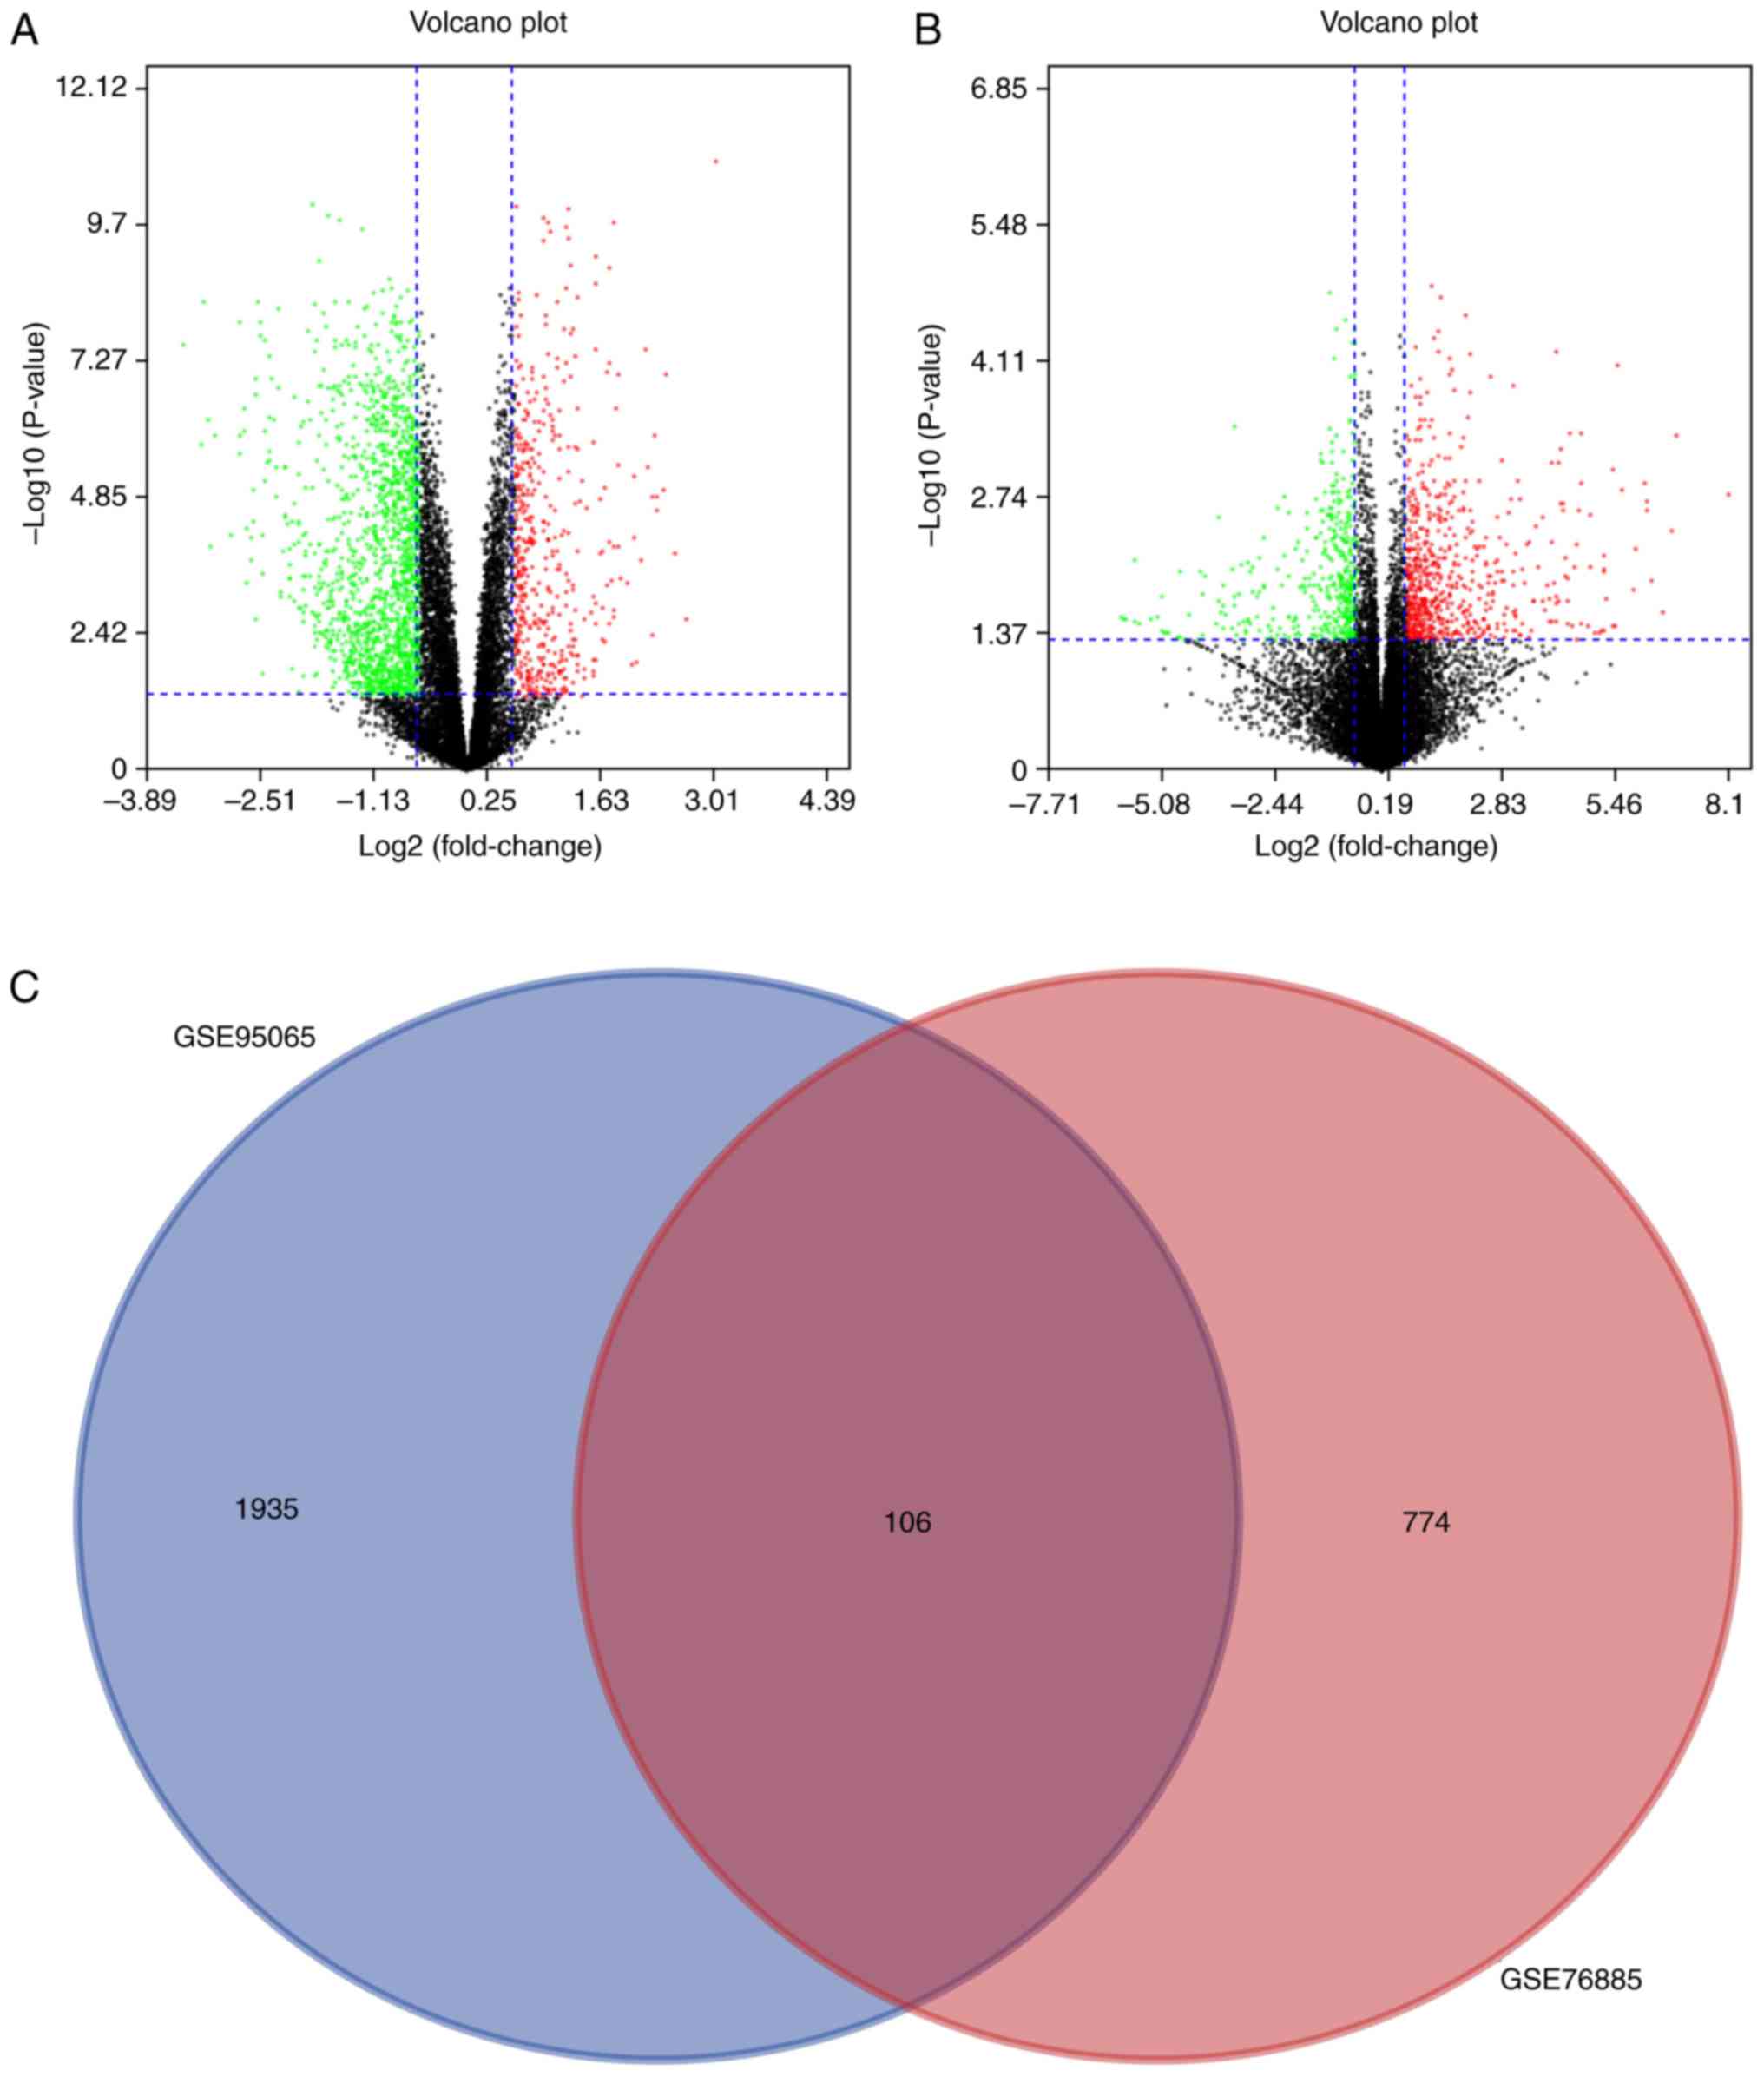
The volcano plot analysis was performed to present
the DEGs between the Con skin tissue samples and SSc tissue
samples. In the volcano plot, all nodes present the DEGs between
the Con and SSc group. When the DEGs conformed to the cut-off
criterion (P<0.05, whereas the fold-change was ≥1.5 or ≤-1.5),
the nodes were significant and would be marked as green or red. The
green nodes present the downregulated DEGs and the red nodes
present the upregulated DEGs in the SSc group, compared with the
Con group. A total of 2,041 and 880 DEGs were obtained from the
GSE95065 and GSE76885 datasets, respectively. Volcano plots of
GSE95065 and GSE76885 are shown in Fig. 3A and B. A Venn diagram showed that
106 DEGs were common to both datasets (Fig. 3C).
Functional and pathway enrichment
analysis of DEGs
GO analysis consists of three items: BP, CC and MF.
The results of the GO analysis in the present study showed that
variations in DEGS linked with BP were mainly enriched in
extracellular matrix organization, positive regulation of gene
expression, inflammatory responses, positive regulation of IL-6
production, actin cytoskeleton reorganization, responses to viruses
and monocyte differentiation (Fig.
4A). Variations in DEGs linked with CC were significantly
enriched in extracellular spaces, extracellular regions,
extracellular matrix, extracellular exosomes, the perinuclear
region of the cytoplasm, intracellular spaces, Golgi cisternae
membranes, Golgi apparatus, cell surfaces, cell-cell junctions,
host cells and COPI-coated vesicles (P<0.05). Regarding MF, DEGs
were significantly enriched in receptor binding, protein binding,
integrin binding, oxidoreductase activity, transcription
regulatory-region DNA binding, GDP binding, actin filament binding
and GTPase activity (P<0.05). Analysis of KEGG pathways
indicated that the top canonical pathways associated with DEGs were
salmonella infection, legionellosis, cytokine-cytokine receptor
interaction, TNF signaling pathways and insulin resistance.
PPI and module network construction and
hub gene selection
Construction of the PPI network and the
identification of significant modules was performed, with 101 edges
and 66 nodes found to be in the PPI network in Fig. 5A and 21 edges and 7 nodes found to
be in the significant module in Fig.
5B. A total of ten genes [interleukin-6 (IL6), bone
morphogenetic protein 4 (BMP4), calumenin (CALU), clusterin (CLU),
cysteine rich angiogenic inducer 61 (CYR61), serine protease 23
(PRSS23), secretogranin II (SCG2), suppressor of cytokine signaling
3 (SOCS3), Toll-like receptor 4 (TLR4), tenascin C (TNC)] were
identified as hub genes with degrees ≥10 (Fig. 5C).
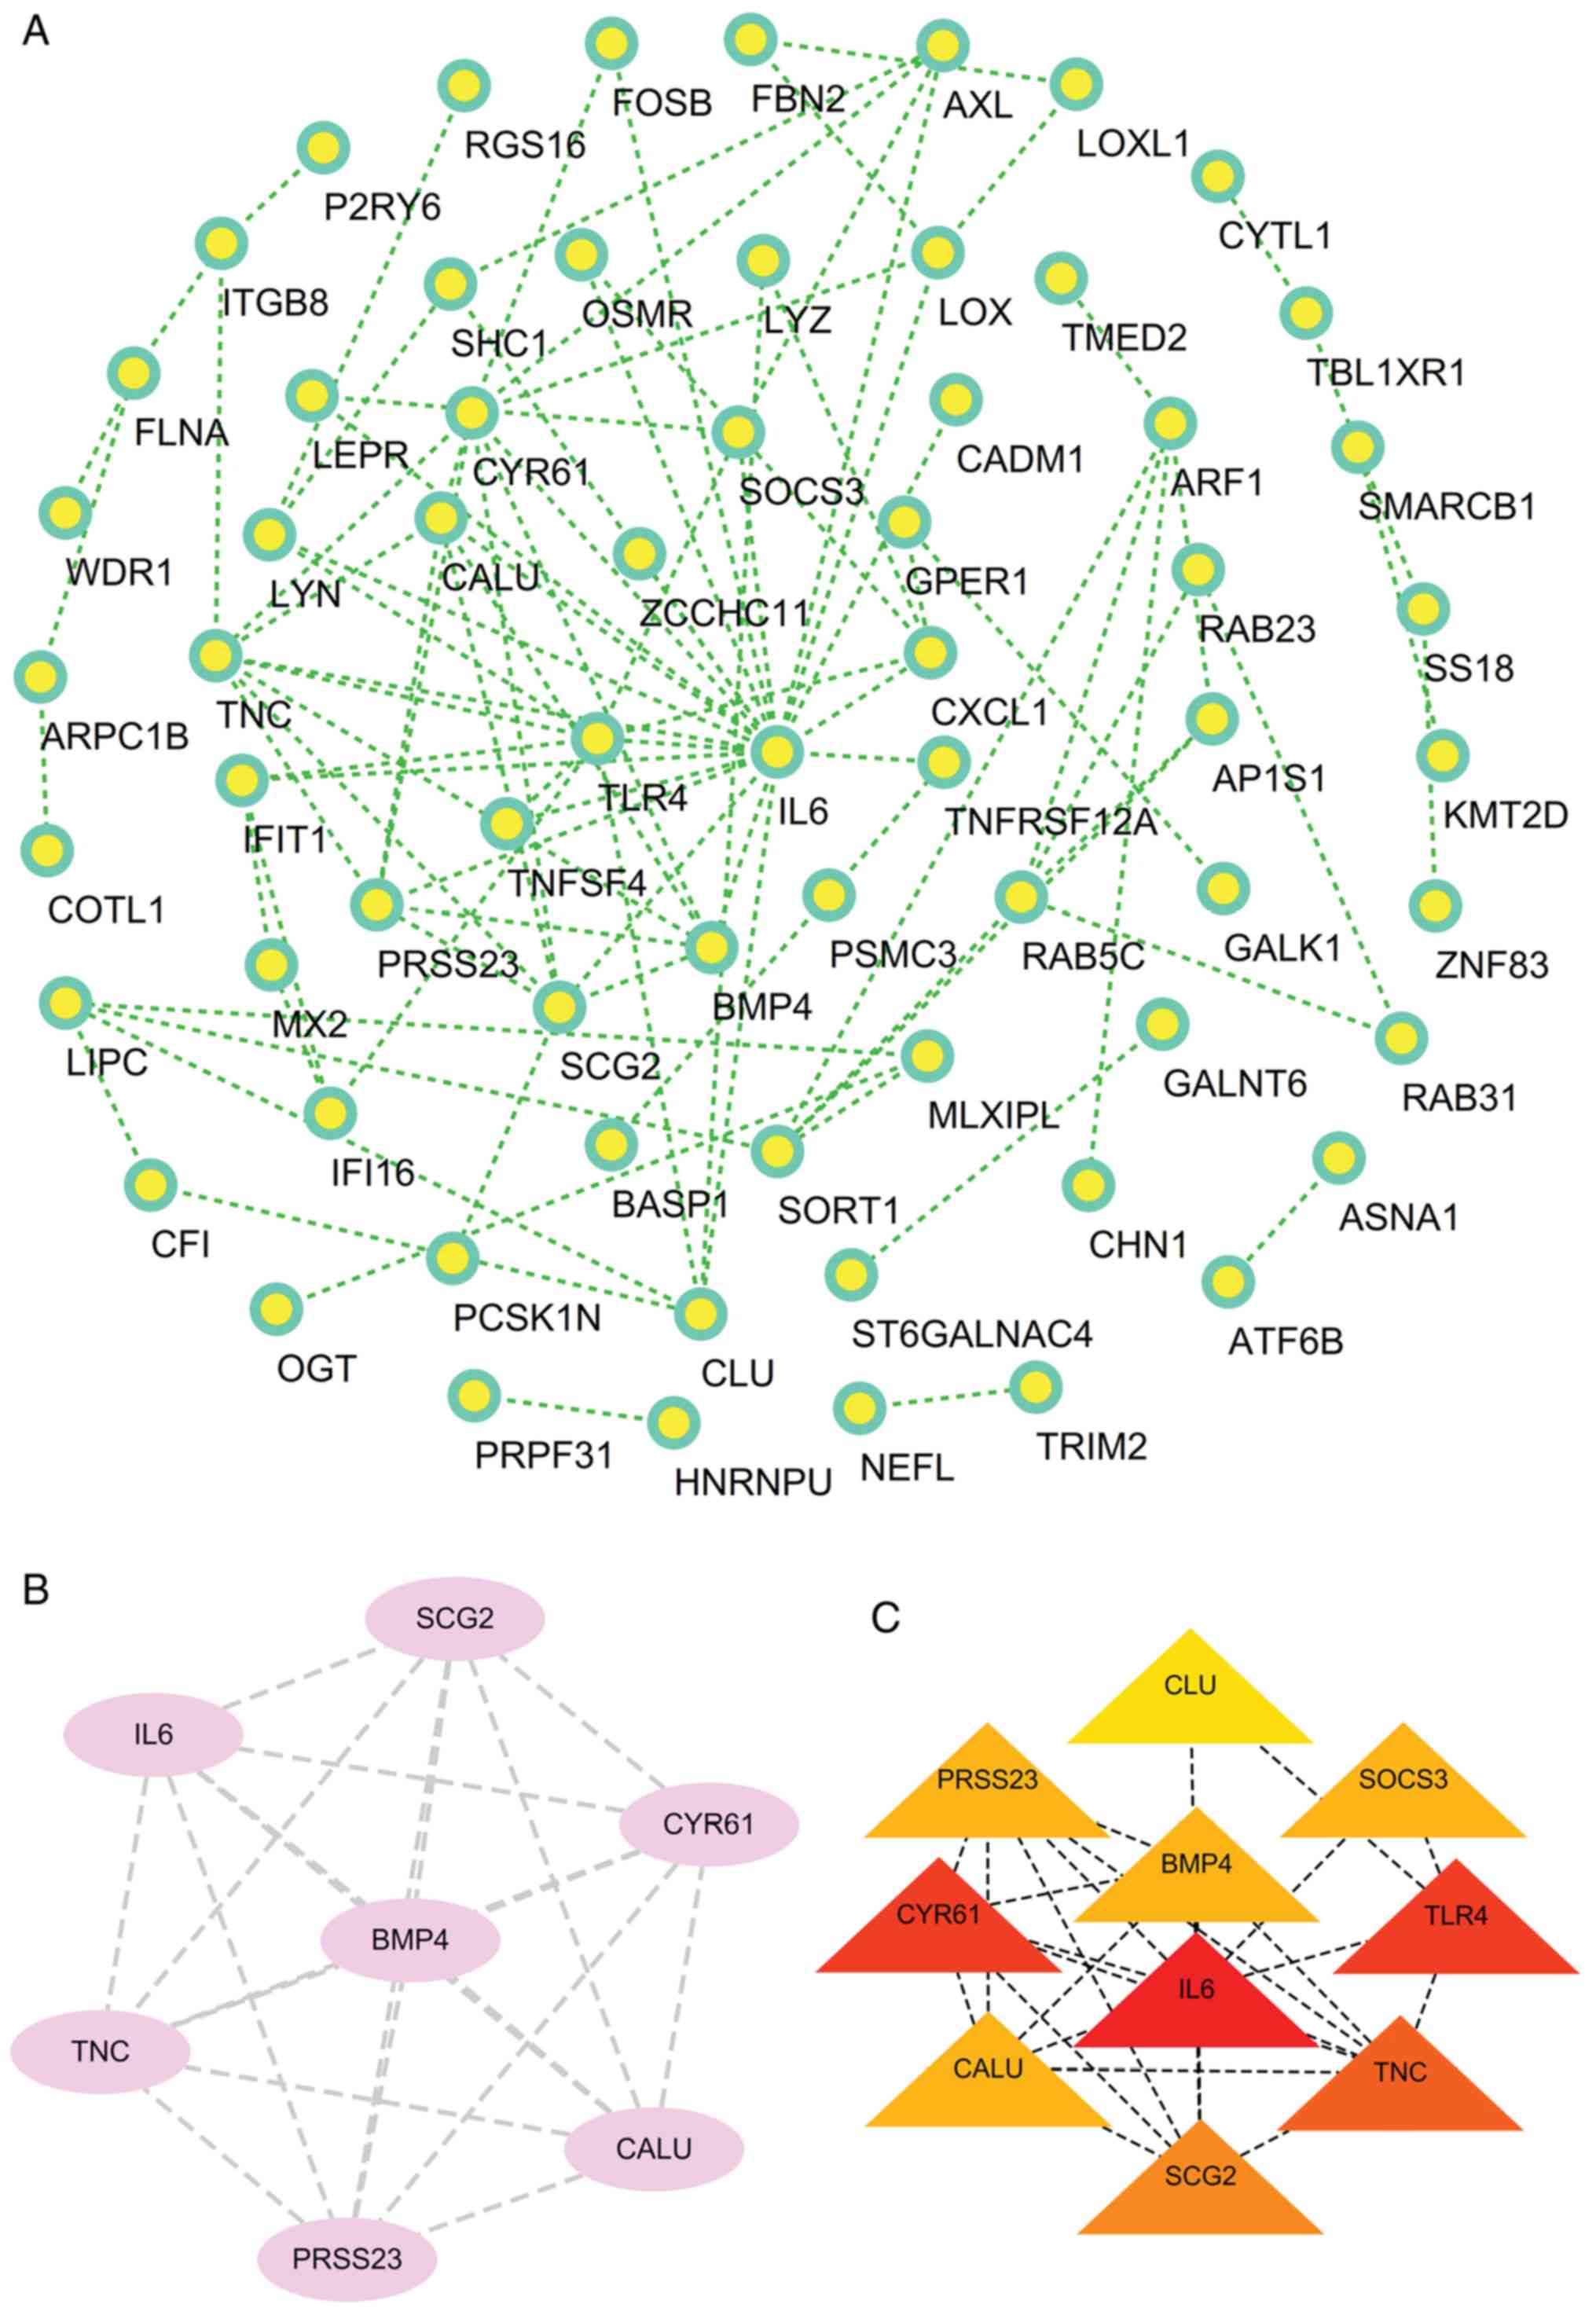 | Figure 5PPI network, significant module
network, and the hub genes. (A) The PPI network showing the
intricate relationships between DEGs. (B) The significant module
network selected based on the PPI network. (C) A total of 10 genes
(CLU, SOCS3, PRSS23, BMP4, TLR4, CYR61, IL6, CALU, TNC and SCG2)
were identified as hub genes with degrees ≥10. PPI, protein-protein
interaction; DEGs, differentially expressed genes. IL6,
interleukin-6; BMP4, bone morphogenetic protein 4; CALU, calumenin;
CLU, clusterin; CYR61, cysteine rich angiogenic inducer 61; PRSS23,
serine protease 23; SCG2, secretogranin II; SOCS3, suppressor of
cytokine signaling 3; TLR4, Toll-like receptor 4; TNC, tenascin
C. |
Hub gene analysis
The names, abbreviations and functions for the hub
genes are shown in Table I.
 | Table ISummaries for the function of 10 hub
genes. |
Table I
Summaries for the function of 10 hub
genes.
| No. | Gene symbol | Full name | UniProtKB ID | Function |
|---|
| 1 | IL6 | Interleukin 6 | P05231
(IL6_HUMAN) | It is a potent
inducer of the acute phase response. It induces myeloma and
plasmacytoma growth and induces nerve cells differentiation. |
| 2 | TLR4 | Toll-like receptor
4 | O00206
(TLR4_HUMAN) | Toll-like receptors
are single transmembrane cell-surface receptors, which have a key
role in the innate immune system. |
| 3 | CYR61 | Cysteine rich
angiogenic inducer 61 | O00622
(CCN1_HUMAN) | Promotes cell
proliferation, chemotaxis, angiogenesis and cell adhesion. Appears
to play a role in wound healing by being upregulated in skin
fibroblasts. |
| 4 | TNC | Tenascin C | P24821
(TENA_HUMAN) | Extracellular
matrix protein implicated in guidance of migrating neurons as well
as axons during development, synaptic plasticity as well as
neuronal regeneration. Promotes neurite outgrowth from cortical
neurons grown on a monolayer of astrocytes. |
| 5 | SCG2 | Secretogranin
II | P13521
(SCG2_HUMAN) | Secretogranin-2 is
a neuroendocrine secretory granule protein, which is the precursor
for biologically active peptides. |
| 6 | SOCS3 | Suppressor of
cytokine signaling 3 | O14543
(SOCS3_HUMAN) | Regulates IL-6
signaling in vivo. Mediate the ubiquitination and subsequent
proteasomal degradation of target proteins. |
| 7 | BMP4 | Bone morphogenetic
protein 4 | P12644
(BMP4_HUMAN) | Induces cartilage
and bone formation. Acts in concert with PTHLH/PTHRP to stimulate
ductal outgrowth and to inhibit hair follicle induction. |
| 8 | CALU | Calumenin | O43852
(CALU_HUMAN) | Involved in
regulation of vitamin K-dependent carboxylation of multiple
N-terminal glutamate residues. Binds 7 calcium ions with a low
affinity. |
| 9 | PRSS23 | Serine protease
23 | O95084
(PRS23_HUMAN) | This gene encodes a
conserved member of the trypsin family of serine proteases. Mouse
experiments found a decrease of mRNA levels of this gene after
ovulation was induced (49). |
| 10 | CLU | Clusterin | P10909
(CLUS_HUMAN) | Mitochondrial
isoforms suppress BAX-dependent release of cytochrome c into the
cytoplasm and inhibit apoptosis. Plays a role in the regulation of
cell proliferation. |
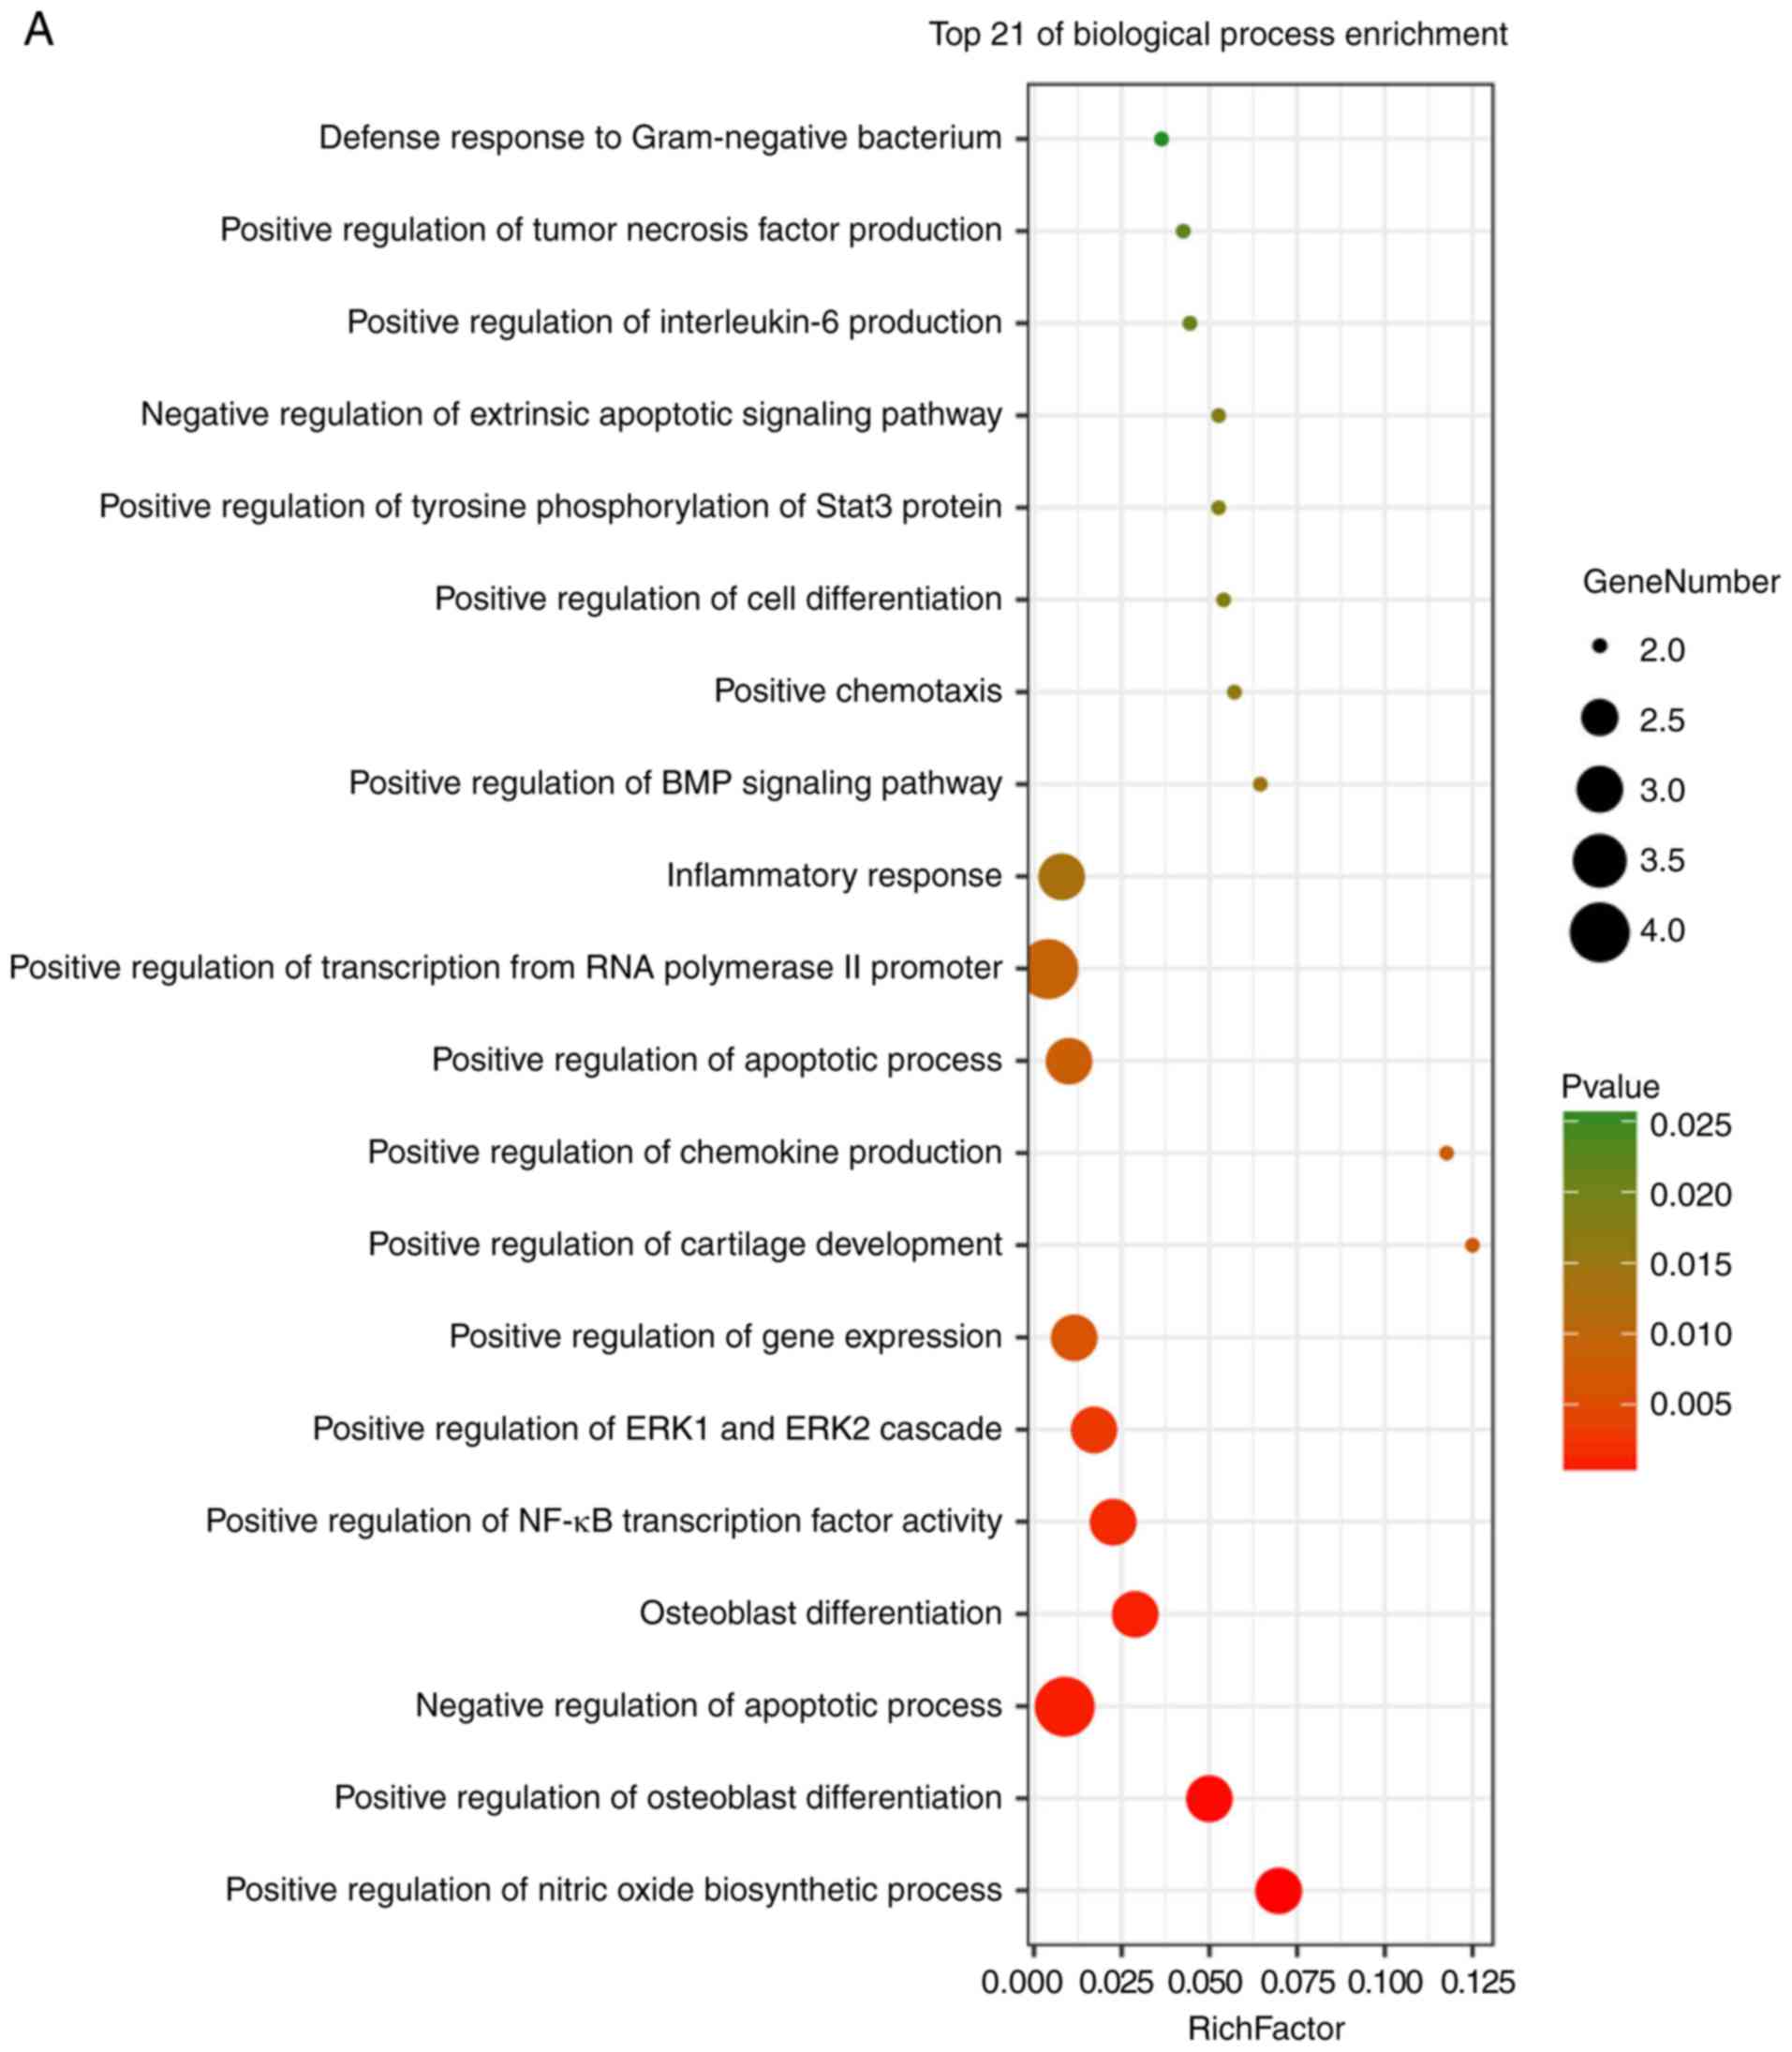
These hub genes were analyzed using DAVID, GO and
KEGG analysis. The results of these analyses showed that variations
in BP of hub genes were mainly enriched in positive regulation of
nitric oxide biosynthetic processes, positive regulation of
osteoblast differentiation, negative regulation of apoptotic
processes, osteoblast differentiation, positive regulation of NF-κB
transcription factor activity, positive regulation of the
extracellular signal regulated kinase (ERK)1 and ERK2 cascade,
positive regulation of gene expression, positive regulation of
cartilage development, and positive regulation of chemokine
production (Fig. 6A). Variations
in the CC of hub genes were significantly enriched in the
extracellular region, extracellular space and extracellular matrix
(P<0.01; Fig. 6B). Variations
in the MF of hub genes were significantly enriched in cytokine
activity, and chemo-attractant activity, but were not significantly
enriched in heparin binding and growth factor activity (Fig. 6C). Analysis of KEGG pathways
showed that hub genes were mainly enriched in influenza A
infection, the PI3K-Akt signaling pathway, malaria, legionellosis,
inflammatory bowel disease, pertussis infection, salmonella
infection, rheumatoid arthritis, the HIF-1 signaling pathway and
Chagas disease (Fig. 6D).
Heat maps showed that there was correlation between
hub genes in the GSE95065 (Fig.
7A) and GSE76885 (Fig. 7B)
datasets. Hierarchical clustering allowed for simple
differentiation of SSc skin samples from the Con skin samples via
the expression levels of hub genes in the GSE95065 (Fig. 8A) and GSE76885 (Fig. 8B) datasets.
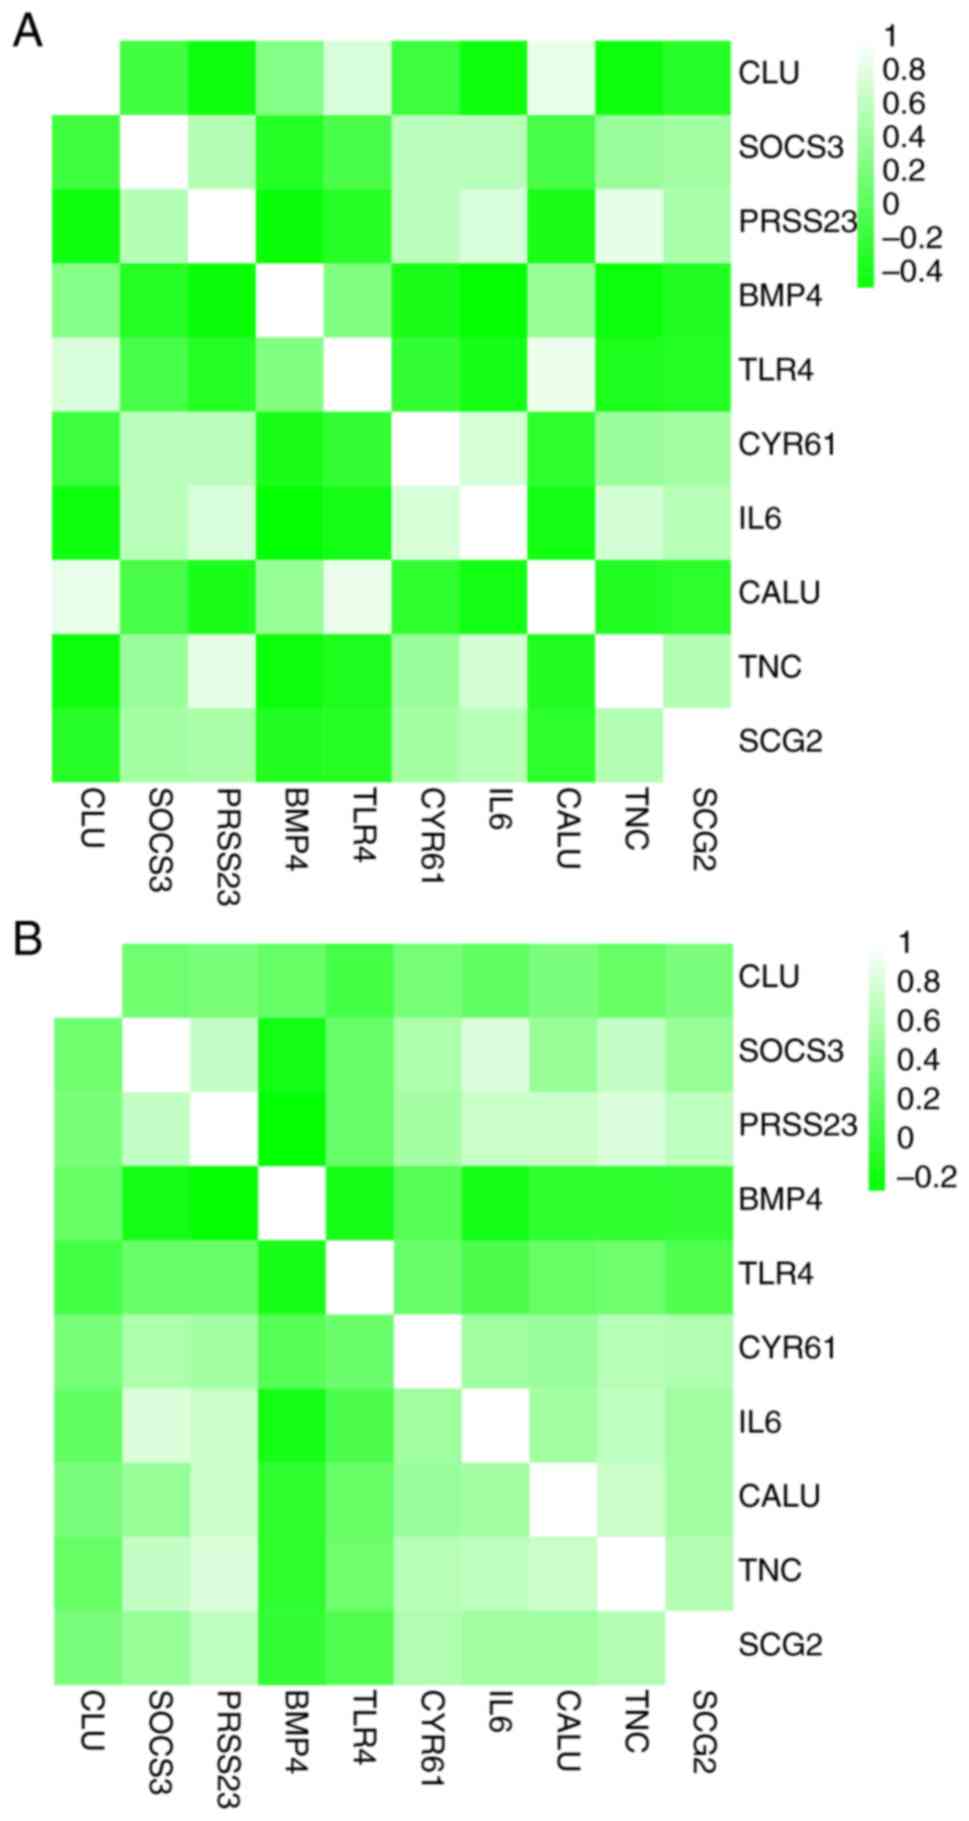 | Figure 7Correlation analysis among the hub
genes. Heat maps showing the correlations between hub genes in the
(A) GSE95065 and (B) GSE76885 datasets. The color reflects the
intensity of the correlation. When 0< correlation <1, there
exists a positive correlation. When -1< correlation <0, there
exists a negative correlation. The larger the absolute value of a
number the stronger the correlation. IL6, interleukin-6; BMP4, bone
morphogenetic protein 4; CALU, calumenin; CLU, clusterin; CYR61,
cysteine rich angio-genic inducer 61; PRSS23, serine protease 23;
SCG2, secretogranin II; SOCS3, suppressor of cytokine signaling 3;
TLR4, Toll-like receptor 4; TNC, tenascin C. |
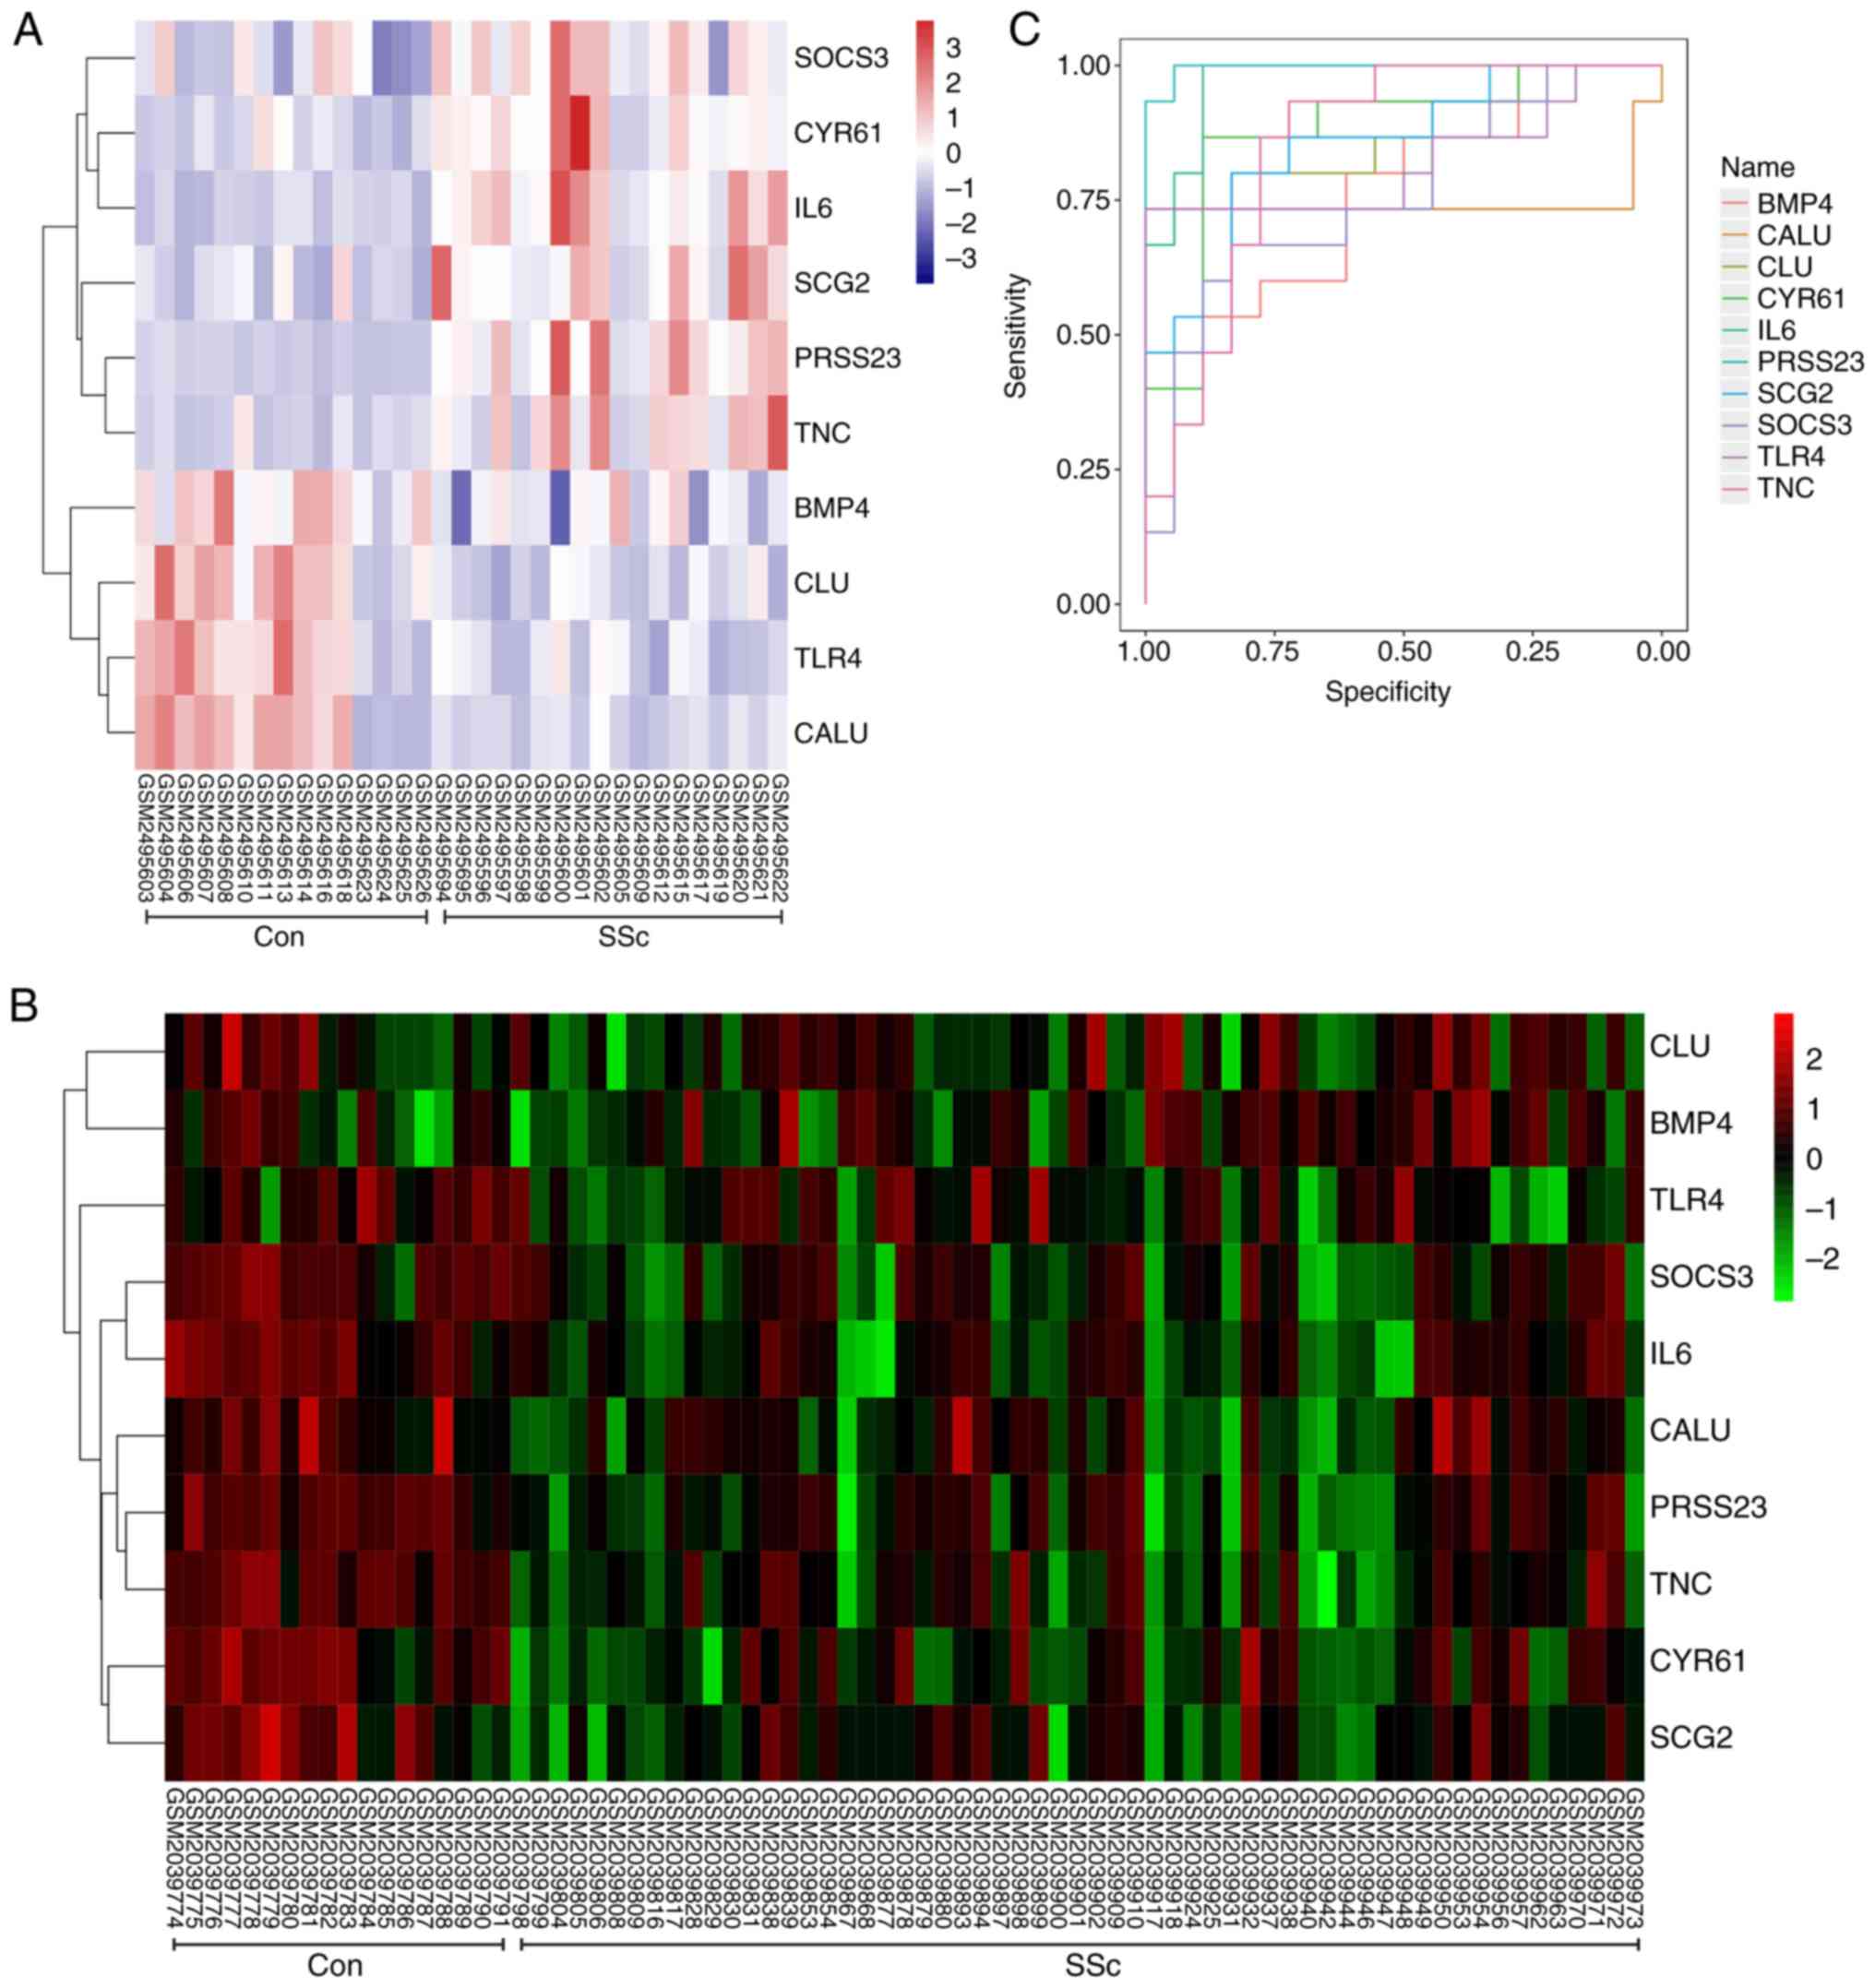 | Figure 8Expression analysis and ROC curves of
all the hub genes. (A) A hierarchical clustering heat-map of the
hub genes from control and SSc skin tissue from the GSE95065
dataset. The X-axis represents sample symbols (from left to right:
Samples of the control skin tissue and samples of SSc skin tissue);
the Y-axis represents differentially expressed genes. Blue, low
expression; white, medium expression; and red, high expression. (B)
A hierarchical clustering heat-map of the hub genes from control
and SSc skin tissue from the GSE76885 dataset. The X-axis
represents sample symbols (from left to right: Samples of the
control skin tissue and samples of SSc skin tissue); the Y-axis
represents differentially expressed genes. Green, low expression;
black, medium expression; and red, high expression. (C) ROC curves
indicating that all hub genes could sensitively and specifically
predict SSc. ROC, receiver operator characteristic; SSc, systemic
scelerosis. IL6, interleukin-6; BMP4, bone morphogenetic protein 4;
CALU, calumenin; CLU, clusterin; CYR61, cysteine rich angiogenic
inducer 61; PRSS23, serine protease 23; SCG2, secretogranin II;
SOCS3, suppressor of cytokine signaling 3; TLR4, Toll-like receptor
4; TNC, tenascin C. |
ROC curve based on hub genes can be used
to sensitively and specifically predict SSc
To identify accurate thresholds for hub genes to
predict SSc ROC curves were constructed. The expression of all hub
genes was associated with a diagnosis of SSc (0.7<AUC<1;
P≤0.05; Table II; Fig. 8C). The ROC curves of per hub genes
are shown in Fig. 9.
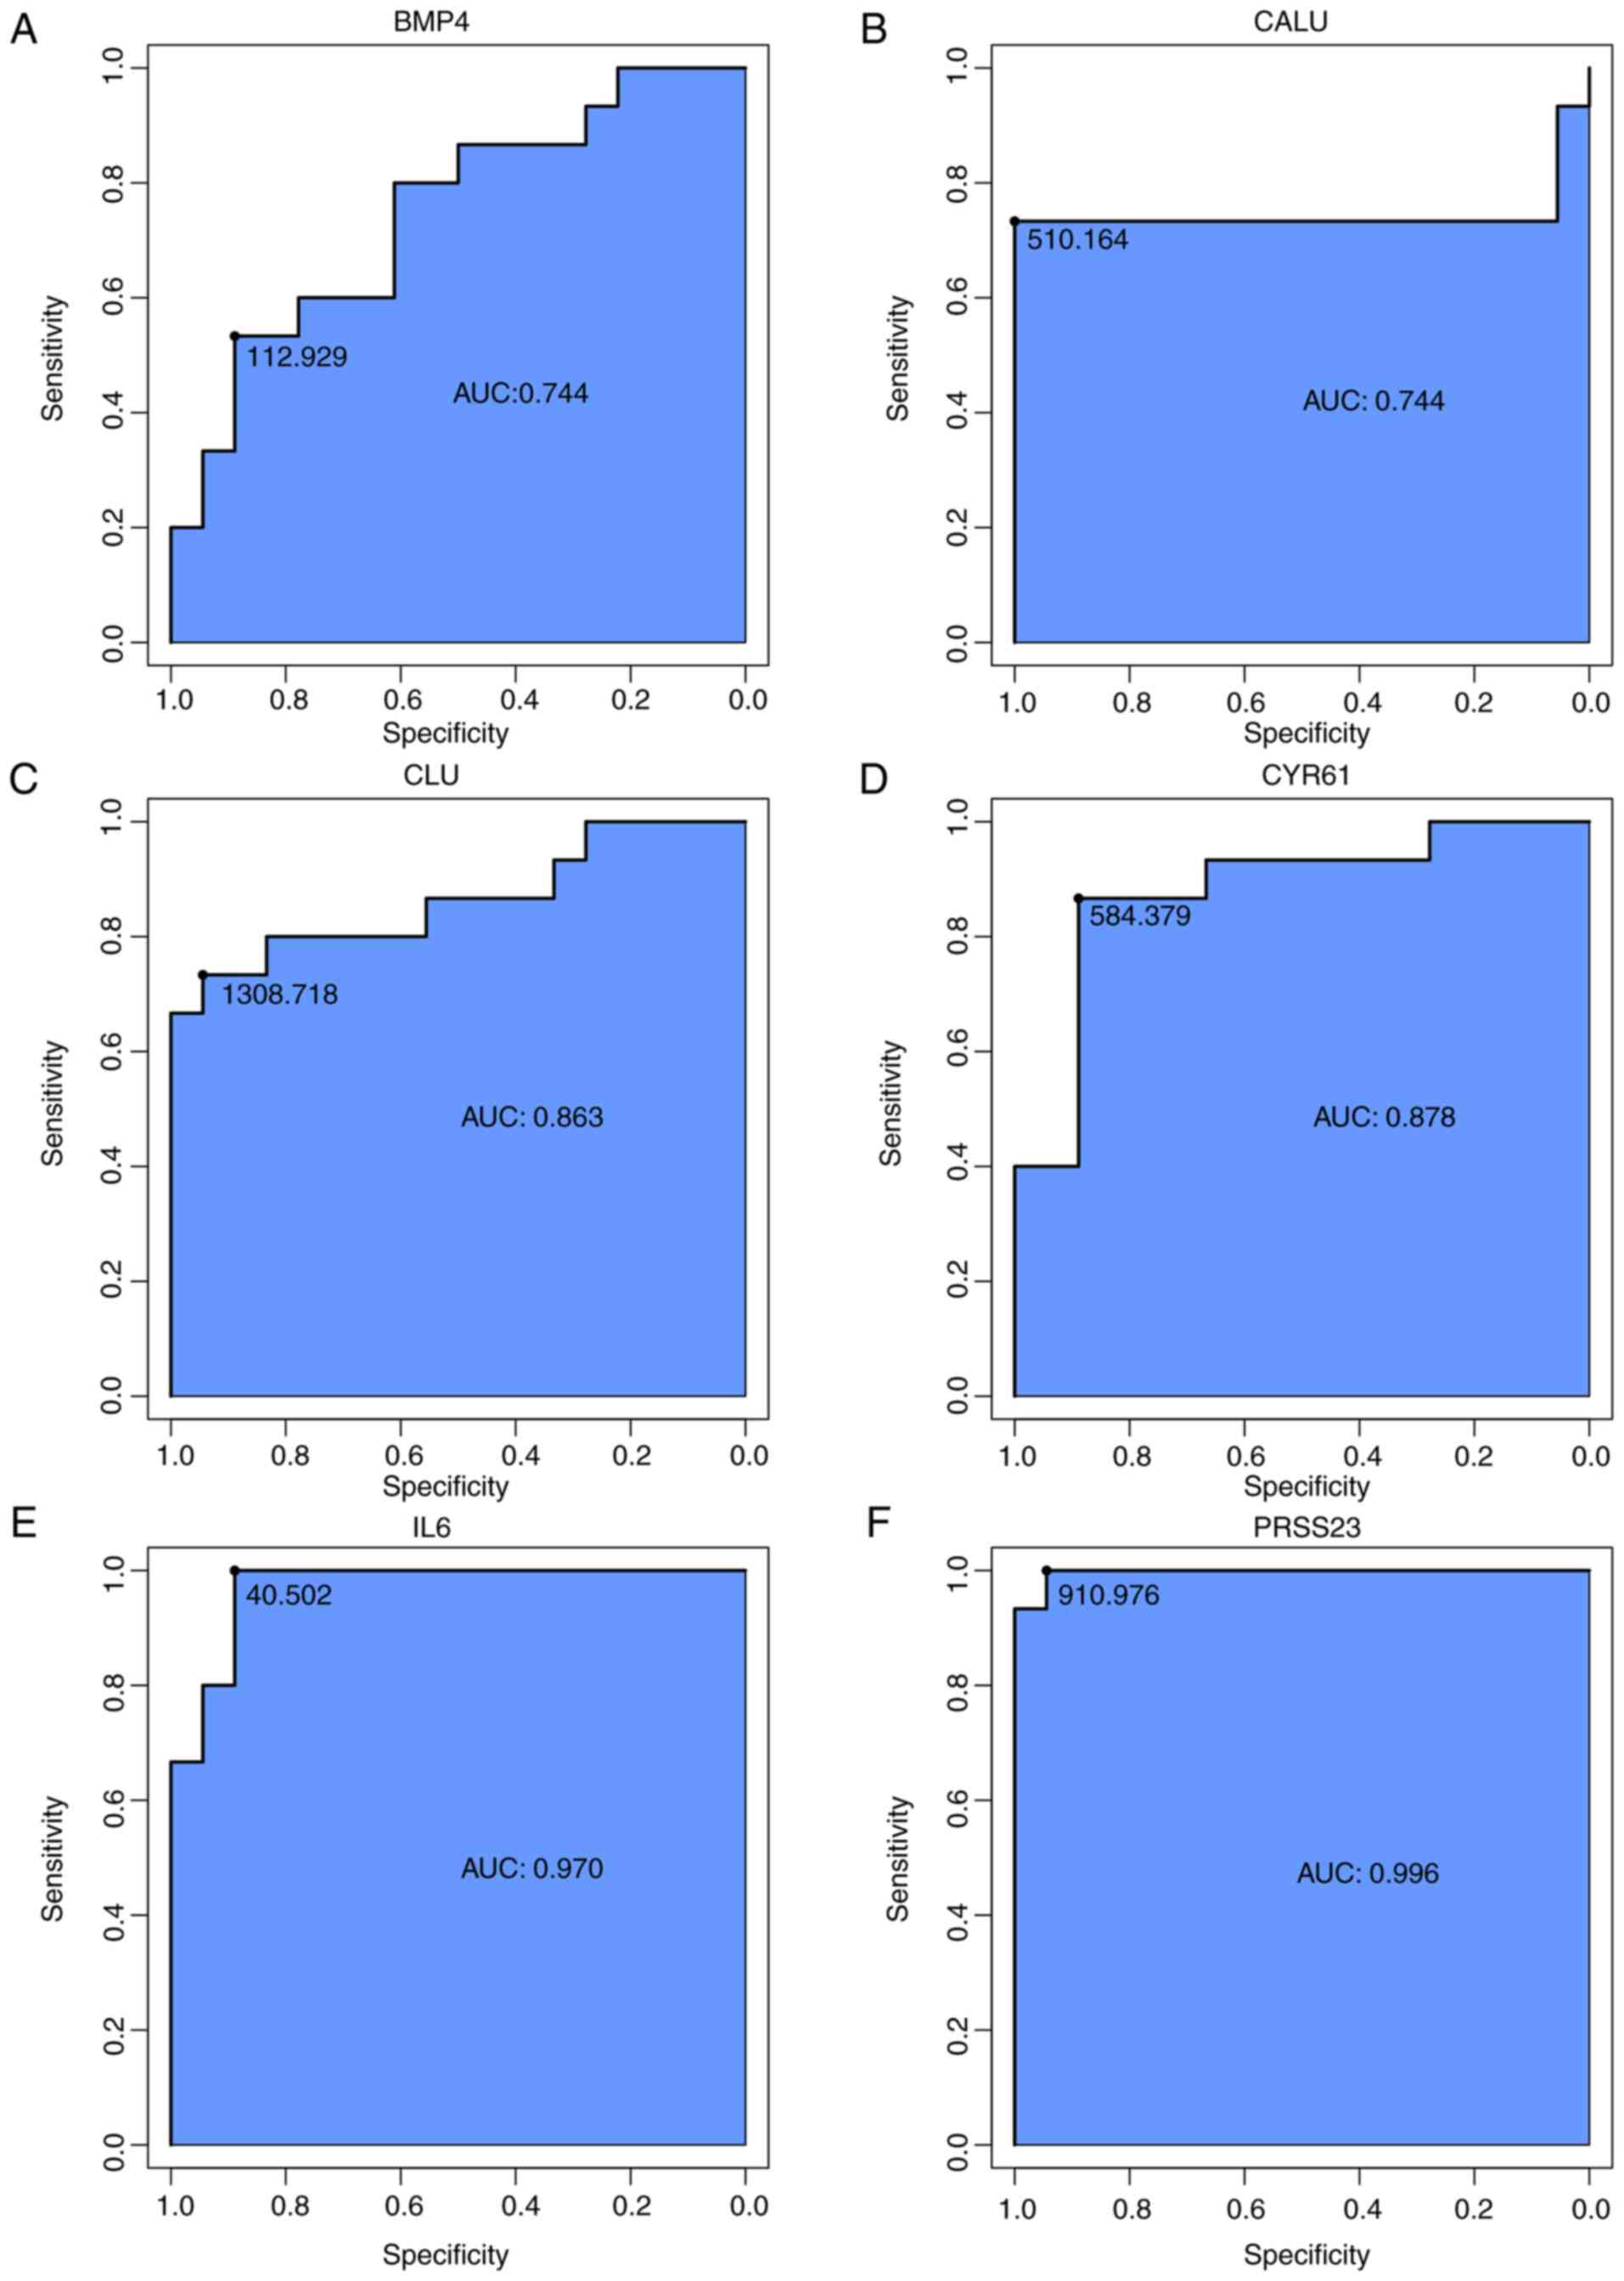 | Figure 9The respective receiver operator
characteristic curves of per hub genes. (A) BMP4, (B) CALU, (C)
CLU, (D) CYR61, (E) IL6, (F) PRSS23. AUC, area under the curve;
BMP4, bone morphogenetic protein 4; CALU, calumenin; CLU,
clusterin; CYR61, cysteine rich angiogenic inducer 61; IL6,
interleukin-6; PRSS23, serine protease 23. The respective receiver
operator characteristic curves of per hub genes. (G) SCG2, (H)
SOCS3, (I) TLR4, (J) TNC. AUC, area under the curve; SCG2,
secretogranin II; SOCS3, suppressor of cytokine signaling 3; TLR4,
Toll-like receptor 4; TNC, tenascin C. |
| Table IIReceiver operator characteristic
curve analysis of hub gene expression for SSc. |
Table II
Receiver operator characteristic
curve analysis of hub gene expression for SSc.
| Gene symbol | SSc |
|---|
| AUC | P-value | 95% CI | ODT |
|---|
| IL6 | 0.970 | 0.000c | 0.889-1.000 | 40.502 |
| TLR4 | 0.822 | 0.002b | 0.733-1.000 | 69.185 |
| CYR61 | 0.878 | 0.000c | 0.867-0.889 | 584.379 |
| TNC | 0.852 | 0.001b | 0.722-0.933 | 1128.397 |
| SCG2 | 0.856 | 0.001b | 0.800-0.833 | 47.679 |
| SOCS3 | 0.759 | 0.011a | 0.667-0.833 | 28.669 |
| BMP4 | 0.744 | 0.017a | 0.533-0.889 | 112.929 |
| CALU | 0.744 | 0.017a | 0.733-1.000 | 510.164 |
| PRSS23 | 0.996 | 0.000c | 0.944-1.000 | 910.976 |
| CLU | 0.863 | 0.000c | 0.733-0.944 | 1308.718 |
Discussion
Pathological fibrosis is the most common and
prominent feature of SSc. Since there is no treatment strategy for
significantly delaying fibrosis, current treatment for SSc mainly
focuses on mitigating symptoms and improving complications
(22). Therefore, the exploration
of the molecular mechanism that underlies SSc development and ways
to identify patients at risk of severe organ involvement is of
great importance to assist in the diagnosis, early treatment, and
prognosis of SSc (23).
Gene expression profiling using microarray
technology can provide information about the expression of
thousands of genes in the human genome. For this study, several
bioinformatics techniques were integrated to investigate data to
screen and identify hub genes related to SSc. Two datasets,
GSE95065 and GSE76885, were screened for DEGs and 106 DEGs were
discovered that shared 10 hub genes in common: CLU, SOCS3, PRSS23,
BMP4, TLR4, CYR61, IL6, CALU, TNC and SCG2. Among them, CLU, TLR4
and CALU were found to be differentially expressed and displayed
better homogeneity between samples of SSc or samples of the Con
group. Then a literature search was performed in Pubmed and it was
found that the role of TLR4 in SSc was inconsistent with former
studies and might be a 'bone of contention' (24-26). IL-6 has been a research hotspot in
recent years. However, unlike TLR4 or IL-6, research into CALU has
so far been limited. The results of the present study might
represent a starting point for subsequent investigations into CALU.
Therefore, the present study considered these three genes were
significant and needed to be discussed.
TLR4 belongs to the family of pattern recognition
receptors. As the first line of defense against infections, such
receptors recognize pathogen-associated molecular patterns. TLR4
also binds to endogenous damage-associated molecular patterns
(DAMPs) produced as a result of tissue damage. TLR4-mediated
inflammation triggered by exogenous or endogenous ligands is
involved in several diseases and plays a pivotal role in the
amplification and cascading of the inflammatory response (27,28). Bhattacharyya et al
(25,30) and Bhattacharyya and Varga
(29) suggested that repeated
injuries caused by chemical, infectious, mechanical, or autoimmune
factors in genetically susceptible individuals produce DAMPs such
as fibronectin-EDA and tenascin-C. These dangerous signals can be
recognized by TLR4, dramatically augmenting the intensity of
downstream signaling. On one hand, the increased expression of
multiple genes involved in tissue remodeling in mesenchymal cells
and the differentiation of myofibroblasts was elicited and
fibroblasts were sensitized. On the other hand, the synergetic
transforming growth factor also produced a fibrogenic effect. The
elevated levels of tenascin-C in SSc skin biopsy samples are
congruent with the 'DAMP hypothesis' (31). However, it is worth noting that
the conclusion that numerous DAMPs are endogenous ligands of TLR4
was based on in vitro immunoprecipitation and in vivo
functional cell-based assays using TLR4 (−/−) mutant mice.
Additionally there have been no reports relating to the complex
crystal structure of DAMP-TLR4 to confirm any direct interaction
between DAMP and TLR4 (30).
Furthermore, there are 'contradictory' observations on the
expression of TNC according to the results of the present
study.
Stifano et al (32) performed skin biopsies of the
dorsal forearm from 24 patients with dcSSc and 11 HC patients and
tested the samples using RNA isolation and quantitative PCR. The
results revealed that the expression of TLR4 mRNA in patients with
dcSSc was significantly increased compared with the control group.
Bhattacharyya et al (25)
performed immunohistochemistry on the forearm from 19 patients with
dcSSc and 11 cases of HC. They drew a similar conclusion and
semi-quantitative analysis of TLR4 expression confirmed it. The
present study, however, combined two different micro-array datasets
for analysis and showed that TLR4 expression was low in patients
with SSc. This indicates that the expression of TLR4 in patients
with SSc is not straightforward. This may be due to sampling being
performed at different stages of the disease process or sites of
the skin, but the role of TLR4 in the pathogenesis of SSc may also
be investigated from other perspectives. Yang et al
(33) found that genetic or
pharmacological inhibition of TLR4 promoted the formation of a
local immunosuppressive microenvironment and attenuated
autophagy-associated degradation of collagen and cell death in the
fibrotic lung tissues, and thus led to pulmonary inflammation,
fibrosis, and dysfunction induced by bleomycin being aggravated,
which eventually caused the death of the experimental animals. In
contrast, activation of TLR4 rapidly ended acute inflammation,
reversed any pulmonary fibrosis that occurred and improved lung
function. Similarly, blocking TLR4 can impair the resolution of
silica-induced chronic inflammation and fibrosis (33). Thus, as a crucial component of the
innate immune system, the counter-regulation of TLR4 is likely to
be a self-protection mechanism initiated during defense reactions
and both its over-activation and deficiency may exacerbate
inflammation and fibrosis. It might be of great significance to
investigate which condition is predominant in SSc at its different
stages and in SSc with pulmonary or other organ fibrosis.
IL-6 is a pleiotropic cytokine that plays a crucial
role in immune regulation and inflammation. Excessive IL-6
increases the secretion of immunoglobulin and the production of
autoantibodies. In murine models, IL-6 plays an key role in the
differentiation of cytotoxic T cells and T helper 17 cells in
addition to its B-cell stimulatory effect (34,35). Although its role in SSc has not
yet been determined, increased IL-6 expression in the skin has been
observed in SSc, as was shown in the present study (36). Furthermore, anti-IL-6 antibody
treatment suppressed procollagen production in SSc-affected
fibroblasts in vitro (37). In the bleomycin-induced SSc
models, genetic deletion of IL-6 reduced myofibroblasts numbers and
resulted in remission of the disease (38). Elevated serum IL-6 levels were
also correlated with modified Rodnan total skin scores in SSc
patients and elevated IL-6 in bronchoalveolar lavage fluid of SSc
patients is thought to relate to pulmonary fibrosis (39,40). Most importantly, the faSScinate
study, a phase II trial, demonstrated a significant improvement of
skin sclerosis in progressive dcSSc patients with IL-6-related
inflammatory signs after 24 weeks of administration of tocilizumab
(41). Recent findings indicate
that tocilizumab has the potential to modify SSc vasculopathy. To
further validate tocilizumab efficacy, a global phase III trial is
currently under way (42).
The present study also found that CALU expression
was low in patients with SSc. The coding product of CALU is
calumenin, which belongs to the CREC protein family, the EF-hand
calcium-binding proteins localizes to multiple sites of the
secretory pathway of mammalian cells (e.g., endoplasmic reticulum,
Golgi apparatus and the extracellular matrix). Of these proteins,
calumenin is the only member reported as likely to be exocytic
(43,44). Additionally calumenin was revealed
to be associated with malignant cell transformation and metastasis
(45-47). Vorum et al (48) suggested that calumenin might play
a role in the immune defense system because it interacted with the
P component of serum amyloid protein. Further research is needed
into the function of CALU in immune responses and its role in the
set of SSc.
Although the work described here involved rigorous
bioinformatics analysis, it has some limitations. First, the sample
size was relatively small and analysis of a larger data sample is
necessary to verify the results. Second, the results of this study
are based on an in silico analysis and molecular and
experimental validation is necessary.
In conclusion, using bioinformatics technologies two
data-sets from the GEO database were integrated for analysis and
obtained 106 DEGs and 10 hub genes related to SSc (CLU, SOCS3,
PRSS23, BMP4, TLR4, CYR61, IL6, CALU, TNC, and SCG2), with TLR4,
IL6 and CALU being particularly prominent. There are several
contradictions and ambiguities relating to the roles played by TLR4
in SSc, which are waiting for further explanation. Notably there
have been no previous reports of CALU being associated with SSc.
Therefore, the present study suggests that more studies should be
conducted to explore and elucidate these areas, so as to provide
new ideas and targets for the diagnosis and treatment of SSc.
Acknowledgments
The authors gratefully thank the Department of
Rheumatology in Beijing Hospital for technical assistance.
Funding
This study was funded by the National Natural
Science Foundation of China (grant. no. 31140008) and the Beijng
Hospital Research Foundation (grant. no. BJ-2014-033).
Availability of data and materials
The datasets used and/or analyzed during the current
study are available from the corresponding author on reasonable
request.
Authors' contributions
CX and LM conceived and designed the study. CX was a
major contributor in writing the manuscript and submitting the
manuscript. YD collected the datasets; YC analyzed the data; CZ and
CH made substantial contributions to research conception; XZ and CH
designed the draft of the research process. CH had been involved in
revising manuscript critically for important intellectual content.
All authors read and approved the final manuscript.
Ethics approval and consent to
participate
The data of this research was downloaded from the
GEO database, a public website. All institutional and national
guidelines for the care and use of participates were followed.
Patient consent for publication
Not applicable.
Competing interests
The authors declare that they have no competing
interests.
References
|
1
|
Denton CP and Khanna D: Systemic
sclerosis. Lancet. 390:1685–1699. 2017. View Article : Google Scholar : PubMed/NCBI
|
|
2
|
Chifflot H, Fautrel B, Sordet C, Chatelus
E and Sibilia J: Incidence and prevalence of systemic sclerosis: A
systematic literature review. Semin Arthritis Rheum. 37:223–235.
2008. View Article : Google Scholar
|
|
3
|
Nihtyanova SI, Tang EC, Coghlan JG, Wells
AU, Black CM and Denton CP: Improved survival in systemic sclerosis
is associated with better ascertainment of internal organ disease:
A retrospective cohort study. QJM. 103:109–115. 2010. View Article : Google Scholar
|
|
4
|
Tyndall AJ, Bannert B, Vonk M, Airo P,
Cozzi F, Carreira PE, Bancel DF, Allanore Y, Muller-Ladner U,
Distler O, et al: Causes and risk factors for death in systemic
sclerosis: A study from the EULAR Scleroderma Trials and Research
(EUSTAR) database. Ann Rheum Dis. 69:1809–1815. 2010. View Article : Google Scholar : PubMed/NCBI
|
|
5
|
Bossini-Castillo L, Lopez-Isac E, Mayes MD
and Martin J: Genetics of systemic sclerosis. Semin Immunopathol.
37:443–451. 2015. View Article : Google Scholar : PubMed/NCBI
|
|
6
|
Salazar G and Mayes MD: Genetics,
epigenetics, and genomics of systemic sclerosis. Rheum Dis Clin
North Am. 41:345–366. 2015. View Article : Google Scholar : PubMed/NCBI
|
|
7
|
Derrett-Smith EC, Martyanov V, Chighizola
CB, Moinzadeh P, Campochiaro C, Khan K, Wood TA, Meroni PL, Abraham
DJ, Ong VH, et al: Limited cutaneous systemic sclerosis skin
demonstrates distinct molecular subsets separated by a
cardiovascular development gene expression signature. Arthritis Res
Ther. 19:1562017. View Article : Google Scholar : PubMed/NCBI
|
|
8
|
Gardner H, Shearstone JR, Bandaru R,
Crowell T, Lynes M, Trojanowska M, Pannu J, Smith E, Jablonska S,
Blaszczyk M, et al: Gene profiling of scleroderma skin reveals
robust signatures of disease that are imperfectly reflected in the
transcript profiles of explanted fibroblasts. Arthritis Rheum.
54:1961–1973. 2006. View Article : Google Scholar : PubMed/NCBI
|
|
9
|
Chouri E, Servaas NH, Bekker CPJ, Affandi
AJ, Cossu M, Hillen MR, Angiolilli C, Mertens JS, van den Hoogen
LL, Silva-Cardoso S, et al: Serum microRNA screening and functional
studies reveal miR-483-5p as a potential driver of fibrosis in
systemic sclerosis. J Autoimmun. 89:162–170. 2018. View Article : Google Scholar : PubMed/NCBI
|
|
10
|
Falzone L, Scola L, Zanghi A, Biondi A, Di
Cataldo A, Libra M and Candido S: Integrated analysis of colorectal
cancer microRNA datasets: Identification of microRNAs associated
with tumor development. Aging (Albany NY). 10:1000–1014. 2018.
View Article : Google Scholar
|
|
11
|
Falzone L, Candido S, Salemi R, Basile MS,
Scalisi A, McCubrey JA, Torino F, Signorelli SS, Montella M and
Libra M: Computational identification of microRNAs associated to
both epithelial to mesenchymal transition and NGAL/MMP-9 pathways
in bladder cancer. Oncotarget. 7:72758–72766. 2016. View Article : Google Scholar : PubMed/NCBI
|
|
12
|
Hafsi S, Candido S, Maestro R, Falzone L,
Soua Z, Bonavida B, Spandidos DA and Libra M: Correlation between
the overexpression of Yin Yang 1 and the expression levels of
miRNAs in Burkitt's lymphoma: A computational study. Oncol Lett.
11:1021–1025. 2016. View Article : Google Scholar : PubMed/NCBI
|
|
13
|
Falzone L, Lupo G, La Rosa GRM, Crimi S,
Anfuso CD, Salemi R, Rapisarda E, Libra M and Candido S:
Identification of novel MicroRNAs and their diagnostic and
prognostic significance in oral cancer. Cancers (Basel). 11. pp.
E6102019, View Article : Google Scholar
|
|
14
|
Barrett T, Wilhite SE, Ledoux P,
Evangelista C, Kim IF, Tomashevsky M, Marshall KA, Phillippy KH,
Sherman PM, Holko M, et al: NCBI GEO: Archive for functional
genomics data sets-update. Nucleic Acids Res. 41:Database Issue.
pp. D991–D995. 2013, View Article : Google Scholar
|
|
15
|
Edgar R, Domrachev M and Lash AE: Gene
Expression Omnibus: NCBI gene expression and hybridization array
data repository. Nucleic Acids Res. 30:207–210. 2002. View Article : Google Scholar :
|
|
16
|
Sun YH, Xie M, Wu SD, Zhang J and Huang
CZ: Identification and interaction analysis of key genes and
MicroRNAs in systemic sclerosis by bioinformatics approaches. Curr
Med Sci. 39:645–652. 2019. View Article : Google Scholar : PubMed/NCBI
|
|
17
|
Ritchie ME, Phipson B, Wu D, Hu Y, Law CW,
Shi W and Smyth GK: Limma powers differential expression analyses
for RNA-sequencing and microarray studies. Nucleic Acids Res.
43:pp. e472015, View Article : Google Scholar
|
|
18
|
Huang DW, Sherman BT, Tan Q, Collins JR,
Alvord WG, Roayaei J, Stephens R, Baseler MW, Lane HC and Lempicki
RA: The DAVID gene functional classification tool: A novel
biological module-centric algorithm to functionally analyze large
gene lists. Genome Biol. 8:R1832007. View Article : Google Scholar : PubMed/NCBI
|
|
19
|
Ashburner M, Ball CA, Blake JA, Botstein
D, Butler H, Cherry JM, Davis AP, Dolinski K, Dwight SS, Eppig JT,
et al: Gene ontology: Tool for the unification of biology. The Gene
Ontology Consortium. Nat Genet. 25:25–29. 2000. View Article : Google Scholar : PubMed/NCBI
|
|
20
|
Smoot ME, Ono K, Ruscheinski J, Wang PL
and Ideker T: Cytoscape 2.8: New features for data integration and
network visualization. Bioinformatics. 27:431–432. 2011. View Article : Google Scholar :
|
|
21
|
Bader GD and Hogue CW: An automated method
for finding molecular complexes in large protein interaction
networks. BMC Bioinformatics. 4:22003. View Article : Google Scholar : PubMed/NCBI
|
|
22
|
Young A and Khanna D: Systemic sclerosis:
A systematic review on therapeutic management from 2011 to 2014.
Curr Opin Rheumatol. 27:241–248. 2015. View Article : Google Scholar : PubMed/NCBI
|
|
23
|
Elhai M, Avouac J, Kahan A and Allanore Y:
Systemic sclerosis: Recent insights. Joint Bone Spine. 82:148–153.
2015. View Article : Google Scholar : PubMed/NCBI
|
|
24
|
Takahashi T, Asano Y, Ichimura Y, Toyama
T, Taniguchi T, Noda S, Akamata K, Tada Y, Sugaya M, Kadono T and
Sato S: Amelioration of tissue fibrosis by toll-like receptor 4
knockout in murine models of systemic sclerosis. Arthritis
Rheumatol. 67:254–265. 2015. View Article : Google Scholar
|
|
25
|
Bhattacharyya S, Kelley K, Melichian DS,
Tamaki Z, Fang F, Su Y, Feng G, Pope RM, Budinger GR, Mutlu GM, et
al: Toll-like receptor 4 signaling augments transforming growth
factor-β responses: A novel mechanism for maintaining and
amplifying fibrosis in scleroderma. Am J Pathol. 182:192–205. 2013.
View Article : Google Scholar :
|
|
26
|
Fineschi S, Goffin L, Rezzonico R, Cozzi
F, Dayer JM, Meroni PL and Chizzolini C: Antifibroblast antibodies
in systemic sclerosis induce fibroblasts to produce profibrotic
chemokines, with partial exploitation of toll-like receptor 4.
Arthritis Rheum. 58:3913–3923. 2008. View Article : Google Scholar : PubMed/NCBI
|
|
27
|
Molteni M, Gemma S and Rossetti C: The
role of Toll-like receptor 4 in infectious and noninfectious
inflammation. Mediators Inflamm. 2016.6978936:2016.
|
|
28
|
Barton GM and Medzhitov R: Toll-like
receptor signaling pathways. Science. 300:1524–1525. 2003.
View Article : Google Scholar : PubMed/NCBI
|
|
29
|
Bhattacharyya S and Varga J: Endogenous
ligands of TLR4 promote unresolving tissue fibrosis: Implications
for systemic sclerosis and its targeted therapy. Immunol Lett.
195:9–17. 2018. View Article : Google Scholar :
|
|
30
|
Bhattacharyya S, Midwood KS, Yin H and
Varga J: Toll-like receptor-4 signaling drives persistent
fibroblast activation and prevents fibrosis resolution in
scleroderma. Adv Wound Care (New Rochelle). 6:356–369. 2017.
View Article : Google Scholar
|
|
31
|
Bhattacharyya S, Wang W, Morales-Nebreda
L, Feng G, Wu M, Zhou X, Lafyatis R, Lee J, Hinchcliff M,
Feghali-Bostwick C, et al: Tenascin-C drives persistence of organ
fibrosis. Nat Commun. 7:117032016. View Article : Google Scholar : PubMed/NCBI
|
|
32
|
Stifano G, Affandi AJ, Mathes AL, Rice LM,
Nakerakanti S, Nazari B, Lee J, Christmann RB and Lafyatis R:
Chronic Toll-like receptor 4 stimulation in skin induces
inflammation, macrophage activation, transforming growth factor
beta signature gene expression, and fibrosis. Arthritis Res Ther.
16:R1362014. View
Article : Google Scholar : PubMed/NCBI
|
|
33
|
Yang HZ, Wang JP, Mi S, Liu HZ, Cui B, Yan
HM, Yan J, Li Z, Liu H, Hua F, et al: TLR4 activity is required in
the resolution of pulmonary inflammation and fibrosis after acute
and chronic lung injury. Am J Pathol. 180:275–292. 2012. View Article : Google Scholar
|
|
34
|
Bettelli E, Carrier Y, Gao W, Korn T,
Strom TB, Oukka M, Weiner HL and Kuchroo VK: Reciprocal
developmental pathways for the generation of pathogenic effector
TH17 and regulatory T cells. Nature. 441:235–238. 2006. View Article : Google Scholar : PubMed/NCBI
|
|
35
|
Mangan PR, Harrington LE, O'Quinn DB,
Helms WS, Bullard DC, Elson CO, Hatton RD, Wahl SM, Schoeb TR and
Weaver CT: Transforming growth factor-beta induces development of
the T(H)17 lineage. Nature. 441:231–234. 2006. View Article : Google Scholar : PubMed/NCBI
|
|
36
|
Koch AE, Kronfeld-Harrington LB, Szekanecz
Z, Cho MM, Haines GK, Harlow LA, Strieter RM, Kunkel SL, Massa MC,
Barr WG, et al: In situ expression of cytokines and cellular
adhesion molecules in the skin of patients with systemic sclerosis.
Their role in early and late disease. Pathobiology. 61:239–246.
1993. View Article : Google Scholar : PubMed/NCBI
|
|
37
|
Kawaguchi Y, Hara M and Wright TM:
Endogenous IL-1alpha from systemic sclerosis fibroblasts induces
IL-6 and PDGF-A. J Clin Invest. 103:1253–1260. 1999. View Article : Google Scholar : PubMed/NCBI
|
|
38
|
Kitaba S, Murota H, Terao M, Azukizawa H,
Terabe F, Shima Y, Fujimoto M, Tanaka T, Naka T, Kishimoto T and
Katayama I: Blockade of interleukin-6 receptor alleviates disease
in mouse model of scleroderma. Am J Pathol. 180:165–176. 2012.
View Article : Google Scholar
|
|
39
|
Sato S, Hasegawa M and Takehara K: Serum
levels of interleukin-6 and interleukin-10 correlate with total
skin thickness score in patients with systemic sclerosis. J
Dermatol Sci. 27:140–146. 2001. View Article : Google Scholar : PubMed/NCBI
|
|
40
|
Gudbjörnsson B, Hällgren R, Nettelbladt O,
Gustafsson R, Mattsson A, af Geijerstam E and Totterman TH:
Phenotypic and functional activation of alveolar macrophages, T
lymphocytes and NK cells in patients with systemic sclerosis and
primary Sjogren's syndrome. Ann Rheum Dis. 53:574–579. 1994.
View Article : Google Scholar
|
|
41
|
Khanna D, Denton CP, Jahreis A, van Laar
JM, Frech TM, Anderson ME, Baron M, Chung L, Fierlbeck G,
Lakshminarayanan S, et al: Safety and efficacy of subcutaneous
tocilizumab in adults with systemic sclerosis (faSScinate): A phase
2, randomised, controlled trial. Lancet. 387:2630–2640. 2016.
View Article : Google Scholar : PubMed/NCBI
|
|
42
|
Taniguchi T, Asano Y, Fukasawa T,
Yoshizaki A and Sato S: Critical contribution of the
interleukin-6/signal transducer and activator of transcription 3
axis to vasculopathy associated with systemic sclerosis. J
Dermatol. 44:967–971. 2017. View Article : Google Scholar : PubMed/NCBI
|
|
43
|
Honore B and Vorum H: The CREC family, a
novel family of multiple EF-hand, low-affinity Ca(2+)-binding
proteins localised to the secretory pathway of mammalian cells.
FEBS Lett. 466:11–18. 2000. View Article : Google Scholar : PubMed/NCBI
|
|
44
|
Vorum H, Liu X, Madsen P, Rasmussen HH and
Honore B: Molecular cloning of a cDNA encoding human calumenin,
expression in Escherichia coli and analysis of its Ca2+-binding
activity. Biochim Biophys Acta. 1386:121–131. 1998. View Article : Google Scholar : PubMed/NCBI
|
|
45
|
Nimmrich I, Erdmann S, Melchers U, Finke
U, Hentsch S, Moyer MP, Hoffmann I and Muller O: Seven genes that
are differentially transcribed in colorectal tumor cell lines.
Cancer Lett. 160:37–43. 2000. View Article : Google Scholar : PubMed/NCBI
|
|
46
|
Nagano K, Imai S, Zhao X, Yamashita T,
Yoshioka Y, Abe Y, Mukai Y, Kamada H, Nakagawa S, Tsutsumi Y and
Tsunoda S: Identification and evaluation of metastasis-related
proteins, oxys-terol binding protein-like 5 and calumenin, in lung
tumors. Int J Oncol. 47:195–203. 2015. View Article : Google Scholar : PubMed/NCBI
|
|
47
|
Wang Q, Shen B, Chen L, Zheng P, Feng H,
Hao Q, Liu X, Liu L, Xu S, Chen J and Teng J: Extracellular
calumenin suppresses ERK1/2 signaling and cell migration by
protecting fibulin-1 from MMP-13-mediated proteolysis. Oncogene.
34:1006–1018. 2015. View Article : Google Scholar
|
|
48
|
Vorum H, Jacobsen C and Honore B:
Calumenin interacts with serum amyloid P component. FEBS Lett.
465:129–134. 2000. View Article : Google Scholar : PubMed/NCBI
|
|
49
|
Miyakoshi K, Murphy MJ, Yeoman RR, Mitra
S, Dubay CJ and Hennebold JD: The identification of novel ovarian
proteases through the use of genomic and bioinformatic
methodologies. Biol Reprod. 75:823–835. 2006. View Article : Google Scholar : PubMed/NCBI
|