Introduction
Angiogenesis is the process of forming new blood
vessels from existing blood vessels, which can supply oxygen and
nutrients to cells, remove metabolic waste and deliver necessary
immune cells or molecules into tissues to provide immune
surveillance to prevent disease (1,2).
Vascular maturation is a complex process of vascular remodeling
through the interactions between endothelial cells (ECs) and
perivascular cells, in the late stage of angiogenesis. It includes
partial degeneration of microvessels and the construction of the
vascular basement membrane, as well the gradual maturation of ECs
from their active proliferation stage to a relatively static
condition (3). The mature
vascular ECs will establish a relationship with the vascular
basement membrane and various peripheral cells in order to improve
the hemodynamic characteristics and diffusion function (4,5).
Angiogenesis and maturation are essential for tumorigenesis and
development, and they play an important role in the occurrence,
development and metastasis of numerous malignant tumors, which can
take advantage of abnormal angiogenesis for rapid growth,
metastasis and death (6,7). Rapidly growing tumors are in
continuous demand for oxygen and nutrients, which create an
imbalance in pro- and anti-angiogenic signaling and reduce vascular
maturation (8). As antiangiogenic
drugs, which were designed to starve tumors by cutting off the
vascular supply of cancer cells, only provide modest survival
benefits in the order of weeks to months in most patients with
cancer, tumor vascular normalization has developed as an
alternative strategy for anti-angiogenic cancer treatment (9). Therefore, factors associated with
reduced vascular maturity in tumors may be important targets for
anti-angiogenic drugs.
Neuropilin 1 (NRP1) is a non-tyrosine kinase
trans-membrane glycoprotein and is a co-receptor of semaphorin
(SEMA)3A and vascular endothelial growth factor (VEGF) on the cell
membrane. NRP1 plays an important role in angiogenesis, cell
survival, migration and invasion, and could be a novel tumor marker
(10). The expression of NRP1 is
closely related to angiogenesis (11). NRP1 overexpression can induce
excessive blood vessel formation, especially capillaries, and
knockdown of NRP1 can cause severe vascular developmental defects,
which can cause death in mice (12). The interaction between NRP1 and
VEGF has demonstrated that the VEGF/NRP1 signaling pathway in ECs
is essential for angiogenesis (13). Blocking SEMA3A/NRP1 signaling can
inhibit angiogenesis and also can control the heterogeneity of
tumor-associated macrophages (14). The NRP1:SEMA4A axis can regulate
stability of T cells, which may be related to certain inflammatory
sites (15). These studies
suggested an important role of NRP1 in angiogenesis; however, the
underlying molecular mechanisms remain unclear and require further
study.
NRP1 has been revealed to be strongly expressed in
tumor ECs of pancreatic ductal adenocarcinoma as well as liver
cancer (10,16). Our previous study found that NRP1
was predominantly expressed in ECs from the paratumor of lung
squamous cell carcinomas and could be identified as a potential
biomarker for anti-angiogenic therapies (17). To further study the effects of
NRP1 on angiogenesis, the present study was designed. An
overexpression NRP1 model and siRNA NRP1 model were established in
vascular ECs [microvascular EC (MVEC) and Ealy926], and the effects
of NRP1 on cell angiogenesis-related functions, including
proliferation, apoptosis, migration and tube-forming activity, were
examined at the cell level. The key factors related to NRP1-induced
promotion of angiogenesis were identified. Possible molecular
mechanisms of action underlying the effects of NRP1 on angiogenesis
and vascular maturity were analyzed using omics research.
Materials and methods
Database analysis
The association between NRP1 and tumor grades or the
prognosis was analyzed using UALCAN (http://ualcan.path.uab.edu), which is an interactive
web-portal that allows cancer researchers and clinicians to analyze
the relative expression levels of a query gene(s) across tumor and
normal samples, and to evaluate relative clinicopathological
parameters in various individual cancer types within TCGA database
(18). The variation in
expression levels between normal and different tumor grades were
analyzed using the in-built statistical methods of the UALCAN
web-software and a P<0.05 was considered to indicate a
statistically significant difference.
Survival analysis of differentially expressed NRP1
levels in cancer tissues were performed using the Kaplan-Meier
Plotter database (http://kmplot.com/analysis/) (19). The Kaplan-Meier Plotter was
established using gene expression data and survival information for
cancer survival rates. The cancer patients were divided into high-
and low-expression value groups, and the survival analysis was
carried out using the Kaplan-Meier method. Hazard ratios with 95%
confidence intervals and log-rank P-values were calculated.
Cell culture
An inferior mesenteric artery vascular EC line
(Ealy926; cat. no. 20911549; Shanghai Aolu Biological Technology
Co., Ltd.), and human MVECs (HMEC-1; plat-form no. bio-106081;
Biobw.org) were purchased and cultured in DMEM-F12
medium supplemented with 10% FBS (Thermo Fisher Scientific, Inc.).
Primary human umbilical vein ECs (HUVECs) were prepared by the
present laboratory (previously purchased and strictly preserved at
our laboratory; cat. no. C-003-5C; Invitrogen; Thermo Fisher
Scientific, Inc.) and cultured in Medium 131 (Thermo Fisher
Scientific, Inc.) supplemented with 10% microvascular growth
supplement (Invitrogen; Thermo Fisher Scientific, Inc.). The
mediums were supplemented with 100 U/ml penicillin and 100
µg/ml streptomycin (Invitrogen; Thermo Fisher Scientific,
Inc.). Cells were maintained in a humidified chamber at 37°C in 5%
CO2. The seeding cells of primary HUVECs were stored
using liquid nitrogen, and after each resuscitation, and only ~3-4
generations were used.
To detect the general angiogenesis function of NRP1
in ECs, all of these three EC lines were used for identification.
The primary HUVECs, which were not easy to culture and closer to
the state of cells in vivo, were just used for gene
expression profile analysis.
NRP1 silencing and overexpression
The siRNA targeting NRP1 was designed and
synthesized by Sigma-Aldrich; Merck KGaA. Transfections of the
siRNA were performed using Lipofectamine® RNAiMAX
(Invitrogen; Thermo Fisher Scientific, Inc.) in 6-well plates,
according to the manufacturer's protocol. Briefly, the NRP1 siRNA
was diluted in Opti-MEM (Invitrogen; Thermo Fisher Scientific,
Inc.) and incubated with Lipofectamine® RNAiMAX for 20
min before being added to the cultures for transfections. After a
6-h culture, the medium was replaced with new complete medium
cultured for another 48 h. The efficiency of siRNA transfections
was verified by reverse transcription-quantitative PCR (RT-qPCR)
and western blot analysis. The siRNA sequences that resulted in
efficient NRP1 knockdown were as follows: NRP1 siRNA-1, 5′-CUG AAU
GUU CCC AGA ACU AdT dT-3′; NRP1 siRNA-2, 5′-GAA GUA UAC GGU UGC AAG
AdT dT-3′; NRP1 siRNA-3, 5′-UGU UGU GGU UGC AGU AUU CdT dT-3′; NRP1
forward, 5′-GCA GGA TTT TCC ATA CGT TAT-3′ and reverse, 5′-AAA TTC
CAG GAT AAT CTC TGA C-3′; 18srRNA forward, 5′-CCT GGA TAC CGC AGC
TAG GA-3′ and reverse, 5′-GCG GCG CAA TAC GAA TGC CCC-3′. siRNA
sequences which resulted in efficient SEMA4D knockdown were
also prepared: SEMA4D siRNA-1, 5′-GGA AGG TCT CAG AAG ACA A-3′;
SEMA4D siRNA-2, 5′-CCT TGA ATT TGC CAG ACA A-3′; SEMA4D siRNA-3,
5′-GGA CAC CTT GTA CAT AGG T-3′; SEMA4D forward, 5′-GCT ACA CAT CCG
TCA TGG TT-3′ and reverse, 5′-AGA CAC CTC CGT GAA GAA GA-3′.
A lentiviral expression vector (pLVX-IRES-Neo) was
used for NRP1 gene delivery and stable overexpression. The human
NRP1 gene (NM_001024628.2) was PCR-amplified from the human 293T
cell cDNA library. PCR primers were designed and the XhoI
and BamHI restriction endonuclease sites were introduced
into the plasmid as follows: NRP1-XhoI forward, 5′-ccg ctc
gag gcc acc ATG GAG AGG GGG CTG CCG CTC CTC TGC-3′;
NRP1-BamHI reverse, 5′-cgc gga tcc TTA TTT GAT ACC TGA TTG
TAT GGT GCT G-3′. The plasmid was doubly digested using XhoI
and BamHI (New England Biolabs, Inc.). The PCR product
recovery and enzymatic-digested plasmid were purified using a DNA
Gel Extraction kit (Guangzhou Dongsheng Biotech Co., Ltd.). Then
they were ligated (T4 DNA Ligase was purchased from Takara
Biotechnology Co., Ltd.) and the ligation mixture was transformed
into competent E.coli DH5α cells (Invitrogen; Thermo Fisher
Scientific, Inc.). The clones were selected using double enzyme
digestion and sequencing, and the recombinant plasmid was extracted
for transfections. The plasmids were transfected into the MVEC and
Ealy926 cells according to the instructions of
Lipofectamine® 2000 (Invitrogen; Thermo Fisher
Scientific, Inc.).
RT-qPCR and western blotting
Total RNA was extracted from ECs using
TRIzol® (Invitrogen; Thermo Fisher Scientific, Inc.)
according to the manufacturer's protocol. DNase I (Promega
Corporation) was used to remove DNA. Reverse transcription was
performed using GoScript™ reverse transcriptase (Promega
Corporation). RT-qPCR was carried out using SYBR Green qPCR
SuperMix (Invitrogen; Thermo Fisher Scientific, Inc.) and an ABI
PRISM® 7500 Sequence Detection System. The primers used
were as follows: NRP1 forward, 5′-GCA GGA TTT TCC ATA CGT TAT-3′
and reverse, 5′-AAA TTC CAG GAT AAT CTC TGA C-3′; 18srRNA forward,
5′-CCT GGA TAC CGC AGC TAG GA-3′ and reverse, 5′-GCG GCG CAA TAC
GAA TGC CCC-3′. The thermocycling conditions were as follows: 95°C
for 3 min; followed by 95°C for 15 sec and 60°C for 32 sec, for 40
cycles. The 2−ΔΔCq method (20) was employed to perform the analysis
of differential gene expression.
For western blotting, 1×10⁶ cells of each
group were collected for total protein extraction using RIPA buffer
(product no. R0278) with protease inhibitor cocktail (1:100;
product no. P8340; both from Sigma-Aldrich; Merck KGaA), and the
concentration was detected using Bradford assay (cat. no. KGPBCA;
KeyGen Biotech Co., Ltd.). Equal amounts of lysates (40 µg)
were separated by 10% SDS-PAGE, transferred to nitrocellulose
membranes and blocked using 5% skim milk at room temperature for 1
h. Subsequently, the membranes were incubated with following
primary antibodies: Anti-NRP1 (1:1,000; product code ab25998),
anti-SEMA4D (1:2,000; product code ab134128) and anti-GAPDH-HRP
(1:10,000; product code 9485; all from Abcam) at 4°C overnight.
Then the secondary antibody, HRP-conjugated goat anti-rabbit IgG
(H+L) (1:20,000; cat. no. 4050-05; SouthernBiotech) was added and
the membranes were incubated at 37°C for 1 h. Immobilon western
chemiluminescent HRP substrate (cat. no. WBKLS0500; Millipore;
Merck KGaA) was used for protein band visualization, and ImageJ
1.4.4 software (National Institutes of Health) for densitometric
analysis.
Cell proliferation assay
Cell Counting Kit-8 (CCK-8) assays were employed to
detect the effects of NRP1 overexpression/knockdown on the cell
proliferative ability of MVEC and Ealy926 cells. Cells were seeded
in 96-well plates at 4.0×10³ cells/well and the cell
viability was evaluated through the CCK-8 assay (10 µl of
solution reagent for each well of a 96-well assay plate containing
the samples in 100 µl of culture medium) (cat. no. G3582;
Promega Corporation) after the cells were cultured for 0, 24, 48,
72 and 96 h, following the manufacturer's protocol.
Flow cytometric analysis
A total of 3×10⁵ cells/well were cultured
in 12-well cell culture plates and were harvested after 48 h of
incubation. Annexin V-FITC and propidium iodide were used to stain
the cells, following the protocol of Cellular Apoptosis Detection
kit (Nanjing KeyGen Biotech Co., Ltd.). Apoptosis was determined
using flow cytometry (BD Biosciences) and the flow rate and cell
concentration of the samples were adjusted to ensure an acquisition
<500 cells/sec. At least 104 cells were acquired for
analysis. Data were collected and further analyzed using FlowJo 7.0
(FlowJo LLC).
Transwell assay
Cell migration assays were performed using Transwell
chambers (cat. no. 353097; Corning, Inc.). MVEC, Ealy926 and HUVEC
cells (with overexpression/knockdown of NRP1), as well as Ealy926
cells (with knockdown of SEMA4D and SEMA4D knockdown + NRP1
overexpression) were cultured in serum-free DMEM-F12 medium
(5×10⁴ cells/ml). A total of 300 µl of the cell
suspension was added into the upper chamber and 600 µl
DMEM-F12 medium with 10% FBS was added into the lower chamber at
37°C for 24 h. A cotton-tipped swab was used to wipe out the cells
that did not migrate through the membrane of the upper chamber. The
filters were fixed using 4% paraformaldehyde for 20 min at room
temperature, stained using 1% crystal violet for 20 min at room
temperature (product no. 61135; Sigma-Aldrich; Merck KGaA) and
observed using a light microscope (CKX41, U-CTR30-2; Olympus
Corporation, ×200). Each sample was assayed in triplicate.
Tube-forming assay
MVEC, Ealy926 or HUVEC cells (2×10⁴) were
cultured in the 96-well plates, which were pre-coated with 50
µl of 10 mg/ml solution of Matrigel (BD Biosciences) and
allowed to polymerize at 37°C for 2 h. After 6 h of culture on the
Matrigel-coated wells at 37°C, cell angiogenesis, including
junction, segment and node formation, were observed and analyzed
using light microscopy (×40) and ImageJ V1.44 (National Institutes
of Health).
Human angiogenesis antibody array
The human angiogenesis array kit was purchased from
RayBiotech, Inc. (cat. no. QAH-ANG-1000). Control and
overexpression NRP1 HUVEC cells were harvested from 6-well plates
after 48 h. The angiogenesis antibody array analysis procedure was
performed according to the manufacturer's instructions. The signals
were visualized using a laser scanner equipped with a Cy3
wavelength (green channel), along with Axon GenePix (Axon
Instruments). Data was analyzed using GenePix. Proteins densities
exhibiting a >1.5-fold or a <0.67-fold change were defined as
differentially expressed proteins.
RNA-seq analysis
HUVEC cells infected with the lentiviral expression
vector for the increased expression of NRP1 or with mock vectors
were prepared for RNA extraction and transcriptomic sequencing
analysis. Total RNA was extracted using TRIzol®
according to the manufacturer's protocol. The RNA-seq libraries
were constructed using an Ultra RNA sample preparation kit
(Illumina) and sequencing was performed using an Illumina HiSeq™
according to the manufacturer's protocol. The differentially
expressed genes (DEGs) were identified using two criteria: i) A
false discovery rate of <0.05 and ii) A log2 fold
change of >1. Heatmap, volcano plot map, Gene Ontology (GO) and
Kyoto Encyclopedia of Genes and Genomes (KEGG) pathway enrichment
analysis were performed. A protein-protein interaction network was
constructed using the STITCH website, version 5.0 (http://stitch.embl.de).
Statistical analysis
The results are presented as the mean ± SD/SEM and
analyzed using SPSS 22 (IBM Corp.) and GraphPad Prism 7 (GraphPad
Software, Inc.). Differences among groups were analyzed using
one-way ANOVAs, two-tailed Student's t-tests, Mann-Whitney U tests
or Fisher's exact test when applicable. P<0.05 was considered to
indicate a statistically significant difference.
Results
Increased expression level of NRP1 is
associated with increasing tumor grades
Data extracted from the UALCAN database demonstrated
that NRP1 was significantly higher in the 6 tumor tissues compared
with the matched TCGA normal tissue (P<0.01; Fig. 1A-F). NRP1 was expressed at higher
levels in primary tumor tissue than in normal tissue in head and
neck squamous cell carcinoma (HNSC), kidney renal clear cell
carcinoma, liver hepatocellular carcinoma, thyroid carcinoma and
stomach adenocarcinoma (STAD), as well as being expressed at a
higher level in non-seminoma tissue than seminoma tissue in
testicular germ cell tumors.
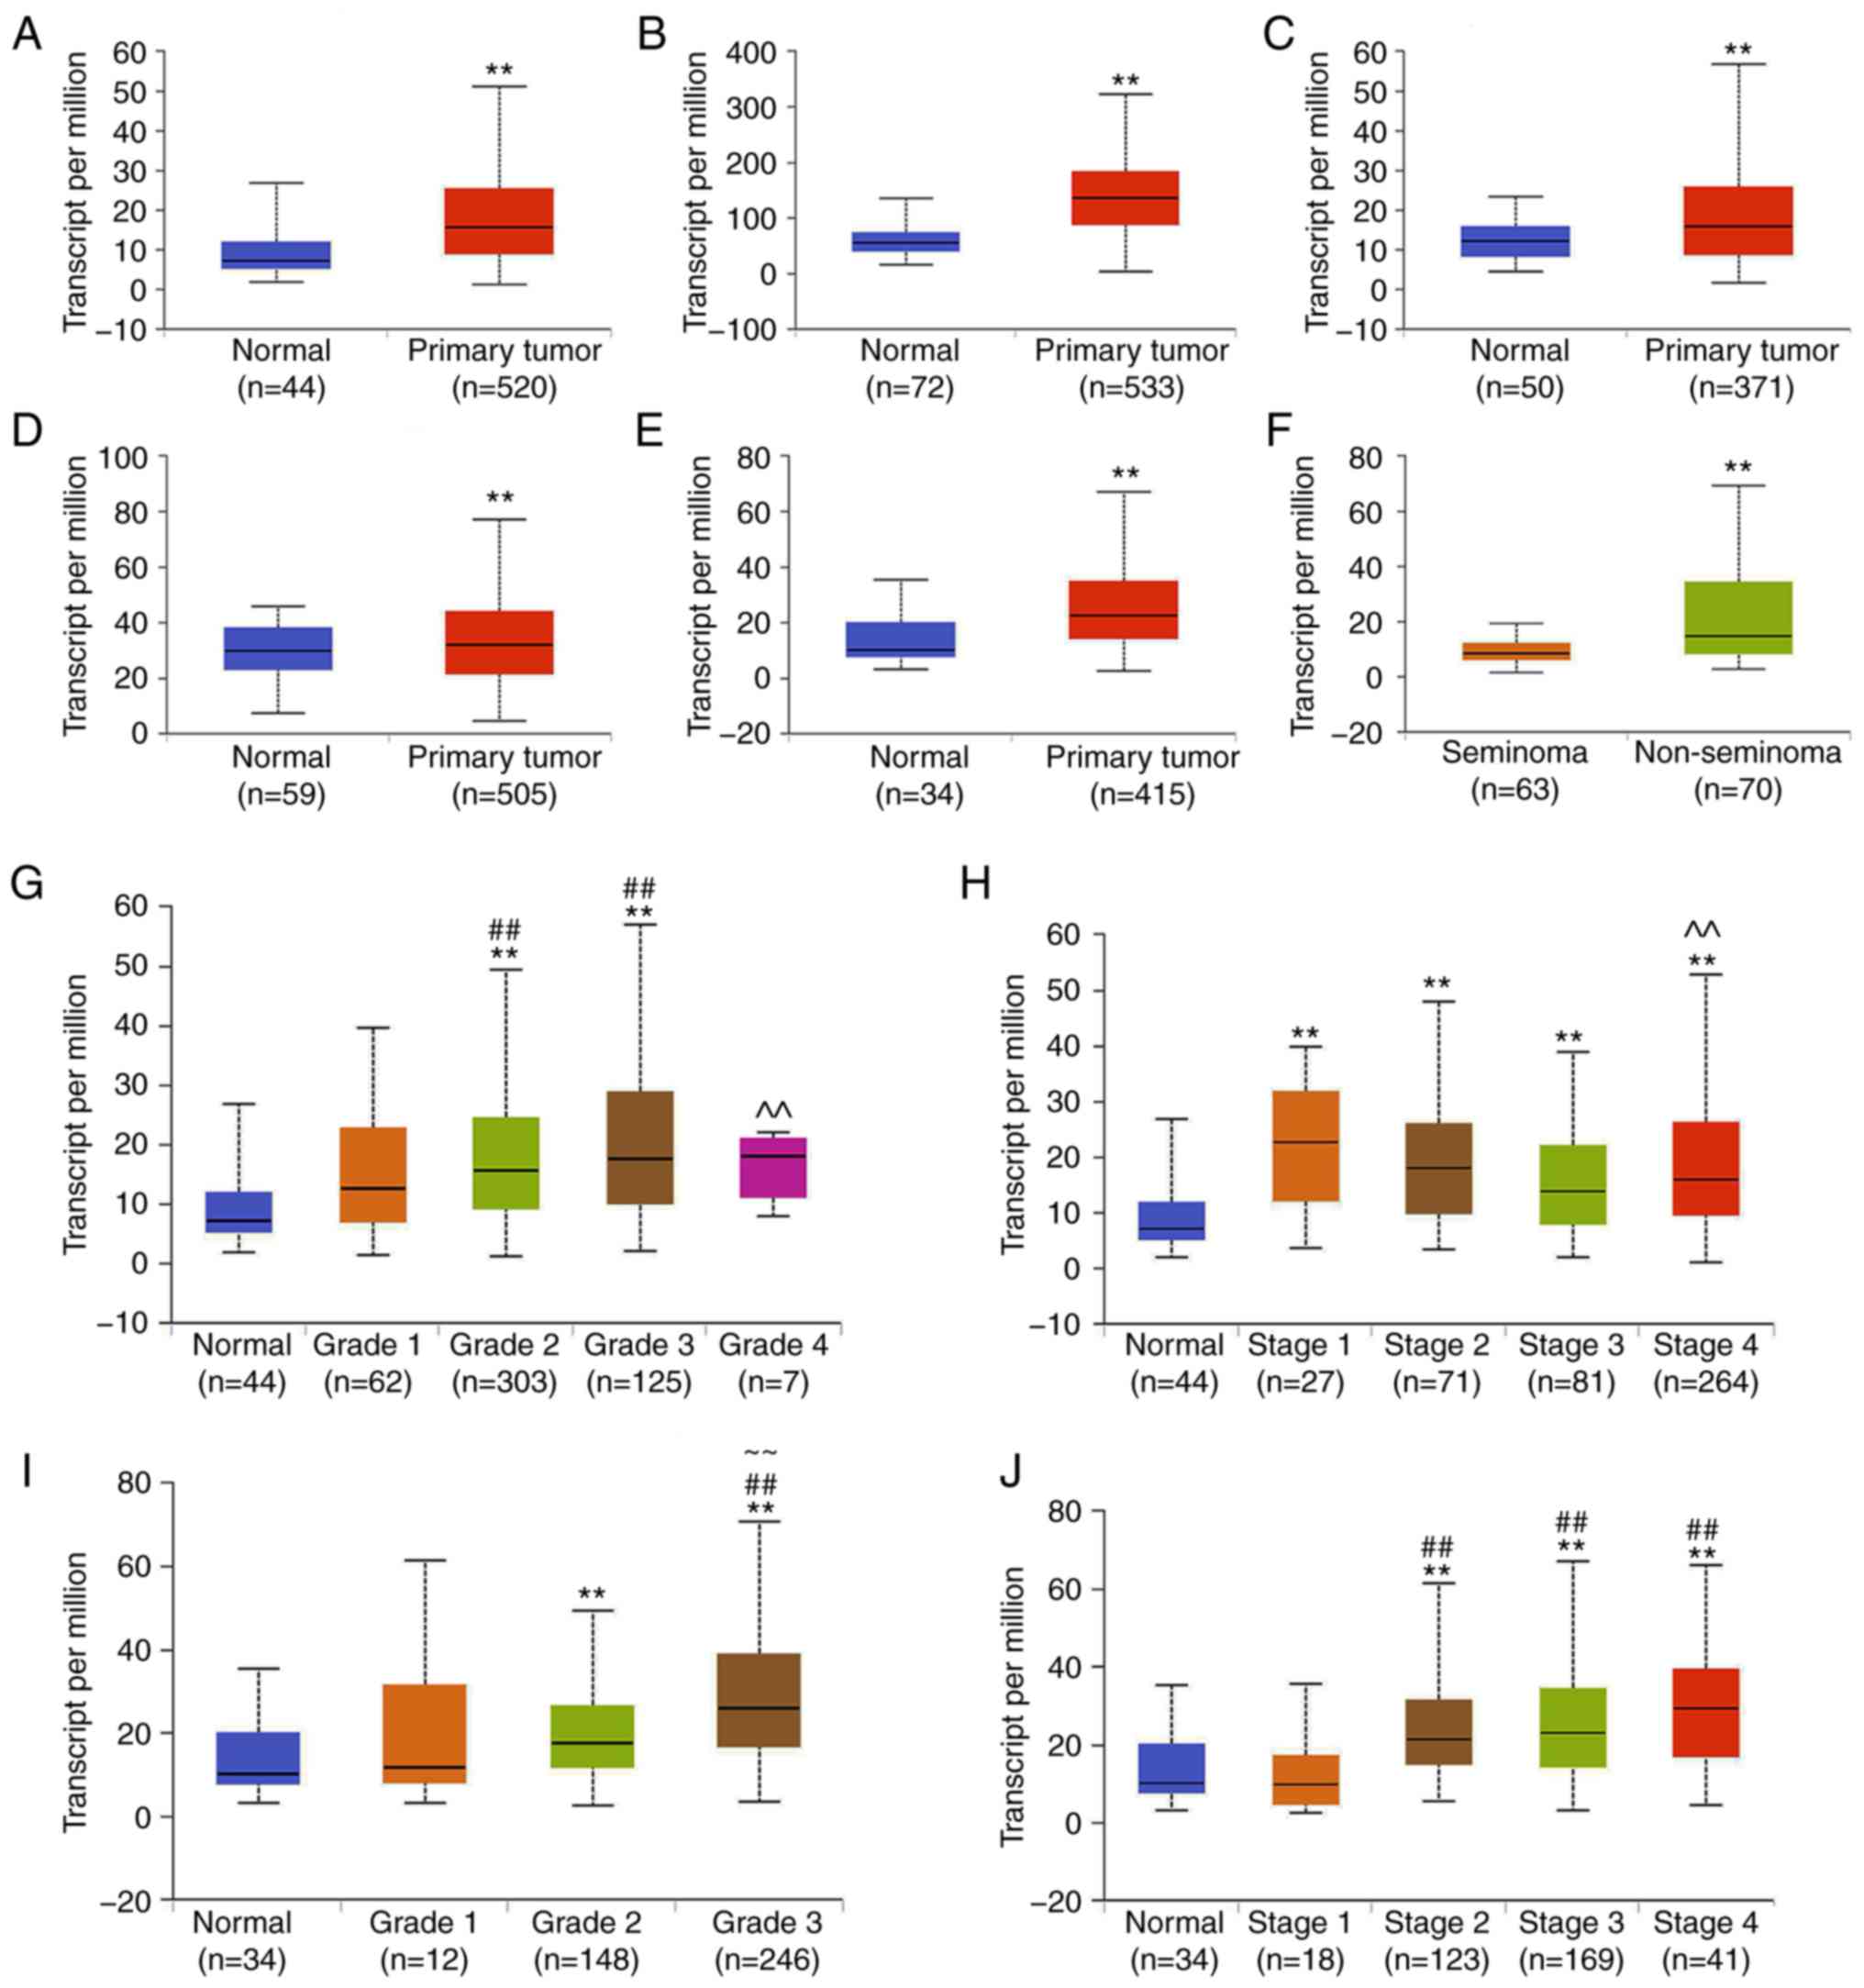 | Figure 1Expression of NRP1 in tumors using
the UALCAN database analysis. Expression of NRP1 in (A) HNSC, (B)
KIRC, (C) LIHC, (D) THCA and (E) STAD samples based on sample types
of normal and primary tumor TCGA samples. (F) Expression of NRP1 in
TGCTs based on tumor histology of seminoma and non-seminoma TCGA
samples. Expression of NRP1 in HNSC based on the (G) tumor grade
and (H) individual cancer stages in TCGA samples. Expression of
NRP1 in STAD samples based on the (I) tumor grade and (J)
individual cancer stages in TCGA samples. Grade 1, well
differentiated (low grade); grade 2, moderately differentiated
(intermediate grade); grade 3, poorly differentiated (high grade);
grade 4, undifferentiated (high grade). **P<0.01 vs.
Normal; ##P<0.01 vs. Grade 1 or Stage 1;
~~P<0.01 vs. Grade 2 or Stage 2;
^^P<0.01 vs. Grade 3 or Stage 3. NRP1, neuropilin 1;
HNSC, head and neck squamous cell carcinoma; KIRC, kidney renal
clear cell carcinoma; LIHC, liver hepatocellular carcinoma; THCA,
thyroid carcinoma; STAD, stomach adenocarcinoma; TCGA, The Cancer
Genome Atlas; TGCT, testicular germ cell tumor. |
The expression of NRP1 on the basis of the
pathological grades of patients and individual cancer stages in
TCGA cancer types were also investigated. In HNSC, the NRP1
expression levels were significantly higher at grades 2 and 3 than
the normal and grade 1 samples. NRP1 levels in grade 4 samples were
significantly lower than in grade 3 samples (P<0.01; Fig. 1G). In regard to the stages, NRP1
expression in all stages (stages 1-4) was higher than in the normal
samples. However, there was a reduced level of NRP1 in the stage 4
samples compared with the stage 3 samples (P<0.01; Fig. 1H). In STAD, NRP1 expression levels
in the grade 2 and 3 samples were significantly higher than in the
normal samples, and in the grade 3 samples, NRP1 expression was
also higher than in the grade 1 and 2 samples (P<0.01; Fig. 1I). Additionally, for the stages in
STAD, NRP1 expression levels in stage 2, 3 and 4 samples were
significantly higher than in the normal and stage 1 samples
(P<0.01; Fig. 1J). This
indicated that the increased expression of NRP1 occurred mainly in
the mid-grades (grades 2 and 3), and in stages that were higher
than normal.
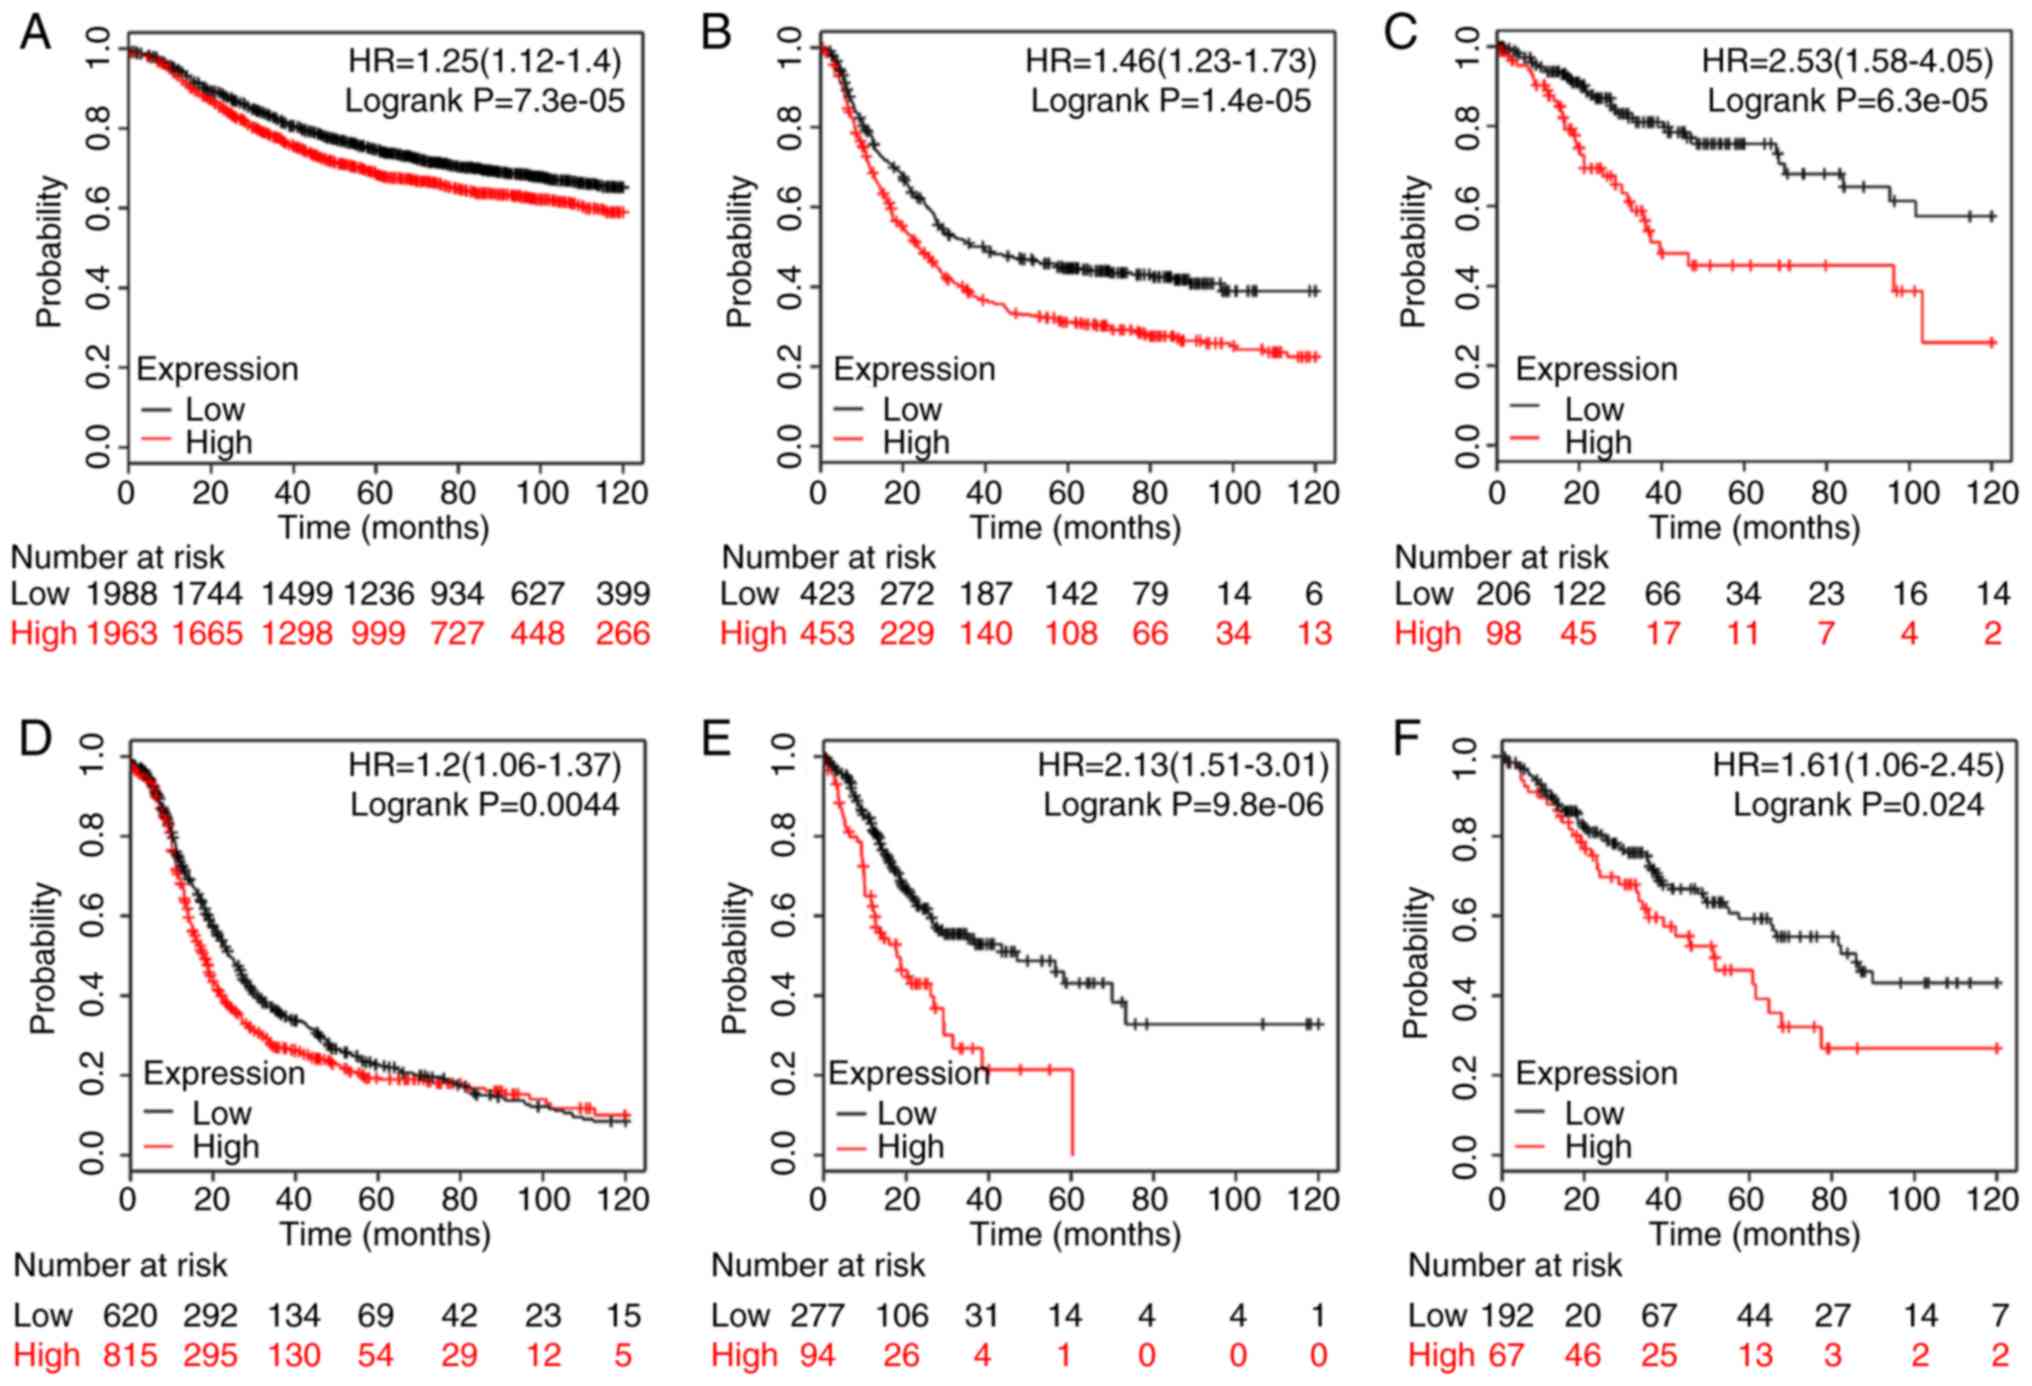
Survival analysis using the Kaplan-Meier Plotter
database results revealed that an increased NRP1 expression level
predicted a poorer prognosis in breast cancer (P<0.01; Fig. 2A), gastric cancer (P<0.01;
Fig. 2B), cervical squamous cell
carcinoma (P<0.01; Fig. 2C),
ovarian cancer (P<0.01; Fig.
2D), STAD (P<0.01; Fig.
2E) and sarcoma (P<0.05; Fig.
2F) for 120 months. Overexpression of NRP1 was significantly
related to a shorter survival time and there were significant
differences between the high and low NRP1 groups. These data
indicated the important roles of NRP1 in the development of various
tumors and more studies are warranted to investigate the function
of NRP1 in tumor angiogenesis.
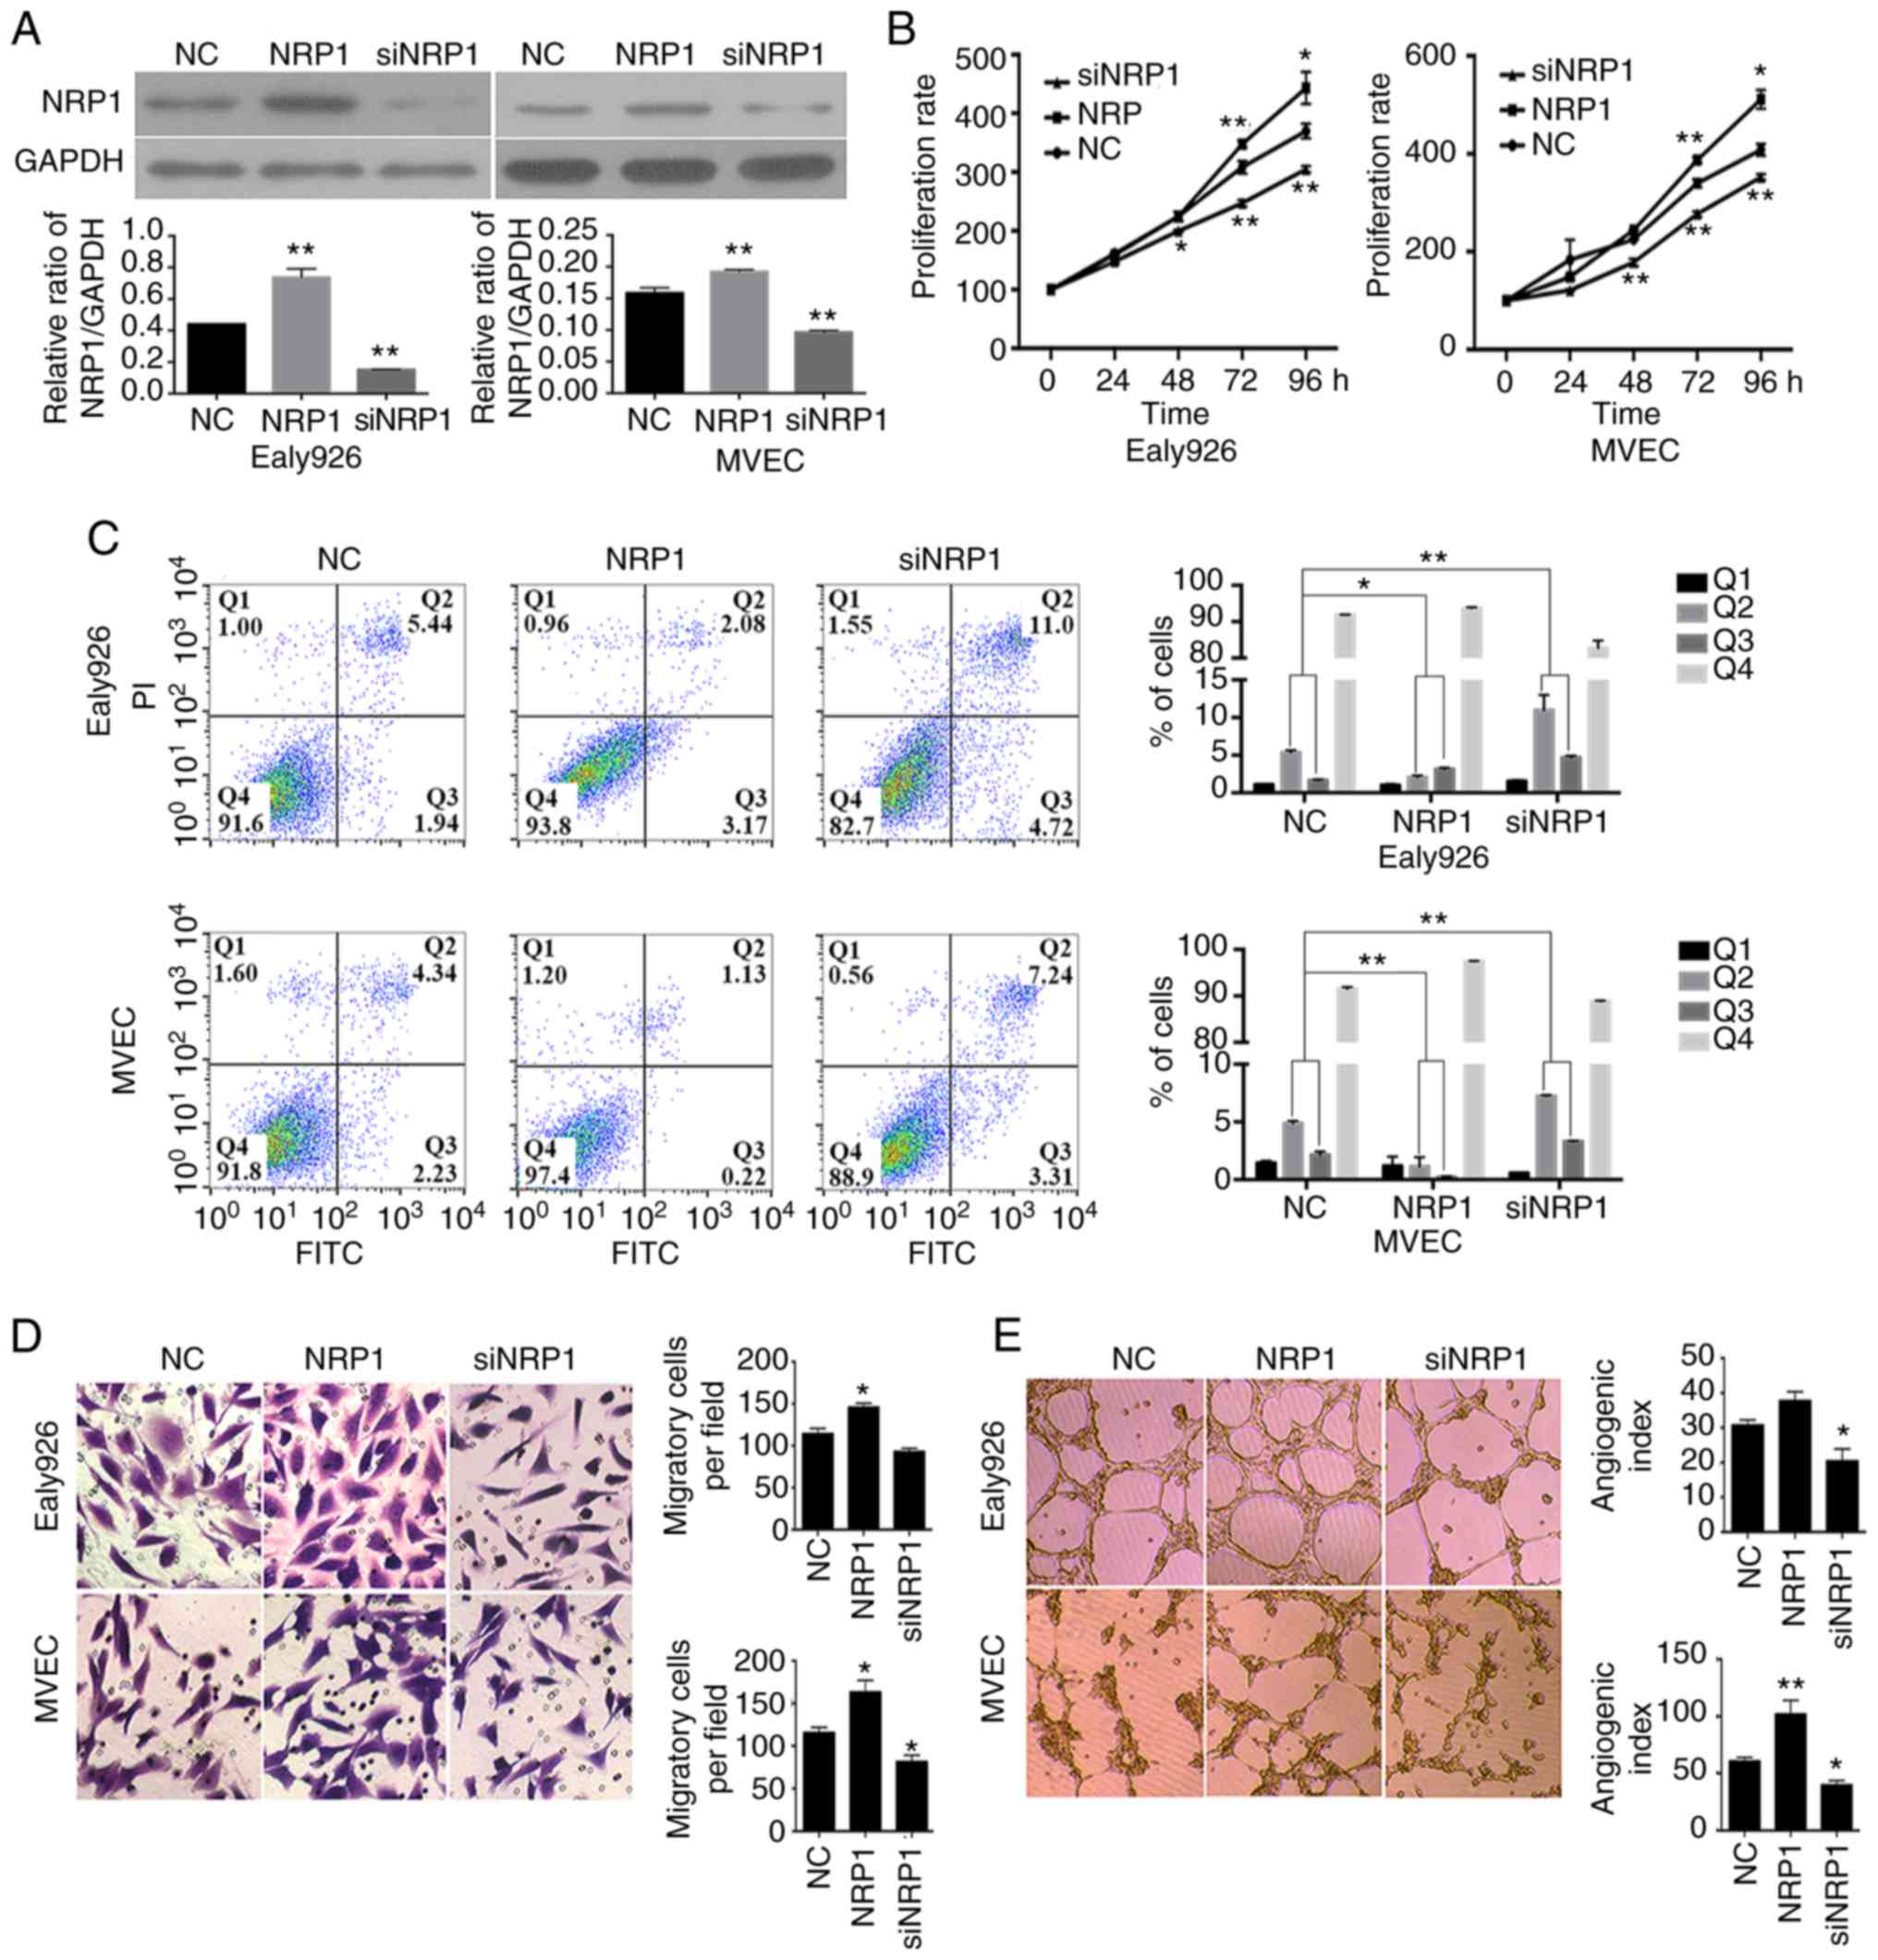
NRP1 promotes endothelial
angiogenesis
The overexpression and knockdown of NRP1 in MVEC and
Ealy926 cells were carried out using pLVX-IRES-Neo-NRP1 vectors and
siNRP1 transfections. The effects of regulating NRP1 levels were
detected using western blotting and the results are presented in
Fig. 3A. It was demonstrated that
the overexpression and knockdown of NRP1 could effectively increase
or decrease the protein levels, respectively, in MVEC and Ealy926
cells (P<0.01). These data demonstrated that the expression NRP1
was effectively regulated in MVEC and Ealy926 cells in the present
study, for the subsequent experiments.
A CCK-8 assay was employed to detect the
proliferative rates of MVEC and Ealy926 cells in the control group,
overexpression-NRP1 group and the knockdown-NRP1 group. The results
demonstrated that NRP1 overexpression could significantly increase
the cell proliferative rate after 72 h (P<0.01) and at 96 h
(P<0.05) of culture in both the MVEC and Ealy926 cells (Fig. 3B). While the cells with low-NRP1
expression levels (knockdown) demonstrated a lower proliferative
rate than the control after 48 h (P<0.05 for Ealy926 cells and
P<0.01 for MVEC cells), 72 h (P<0.01 for both cell lines) and
96 h (P<0.01 for both cell lines) of culture.
The results of the flow cytometric apoptosis
analysis of the MVEC and Ealy926 cells in the three groups are
presented in Fig. 3C. The siNRP1
group had a greater proportion of apoptotic cells than the control
in the MVEC and Ealy926 cells after 48 h of culture. The early and
late apoptotic cells (Q2 + Q3; Fig.
3C) in the siNRP1 cells were significantly higher than in the
control group (P<0.01). While the apoptotic cells in the
overexpression-NRP1 groups both in the MVEC and Ealy926 cells were
significantly lower than the control (P<0.05 for Ealy926 cells
and P<0.01 for MVEC cells). According to the CCK-8 and flow
cytometric results, the high NRP1 expression levels promoted the
proliferation of vascular ECs, while low expression was not
conducive to vascular EC growth.
To examine the effect of NRP1 on vascular EC
motility, Transwell migration assays with MVEC, Ealy926 and HUVEC
cell lines were performed. The experiments revealed that NRP1
knockdown resulted in fewer cells migrating to the bottom of the
chamber compared with the control (P<0.05 for MVEC cell lines,
Fig. 3D; P<0.01 for the HUVEC
cell line, Fig. S1A). Following
NRP1 overexpression, there was a greater number of cells which
migrated to the bottom chamber (P<0.05 for Ealy926 cells and
P<0.01 for MVEC cell lines, Fig.
3D; P<0.01 for the HUVEC cell line, Fig. S1A). Although overexpression and
knockdown of NRP1 had no significant effect on MVEC and Ealy926
cell proliferation after 24 h of culture (Fig. 3B), migration assays revealed that
knockdown of NRP1 inhibited EC migration and that overexpression of
NRP1 promoted cell migration.
Angiogenesis and counting results are presented in
Figs. 3E and S1B. The NRP1-knockdown reduced the cord
forming ability of ECs (P<0.05 for both Ealy926 and MVEC cell
lines, Fig. 3E; P<0.01 for the
HUVEC cell line, Fig. S1B) while
overexpression of NRP1 significantly increased the angiogenesis
ability of MVEC and HUVEC cells, with the difference observed in
the counting analysis being significant (P<0.01 for the MVEC
cell line, Fig. 3E; P<0.01 for
the HUVEC cell line, Fig. S1B).
It was revealed that the expression levels of NRP1 were positively
associated with vascular EC proliferation, migration and
angiogenesis.
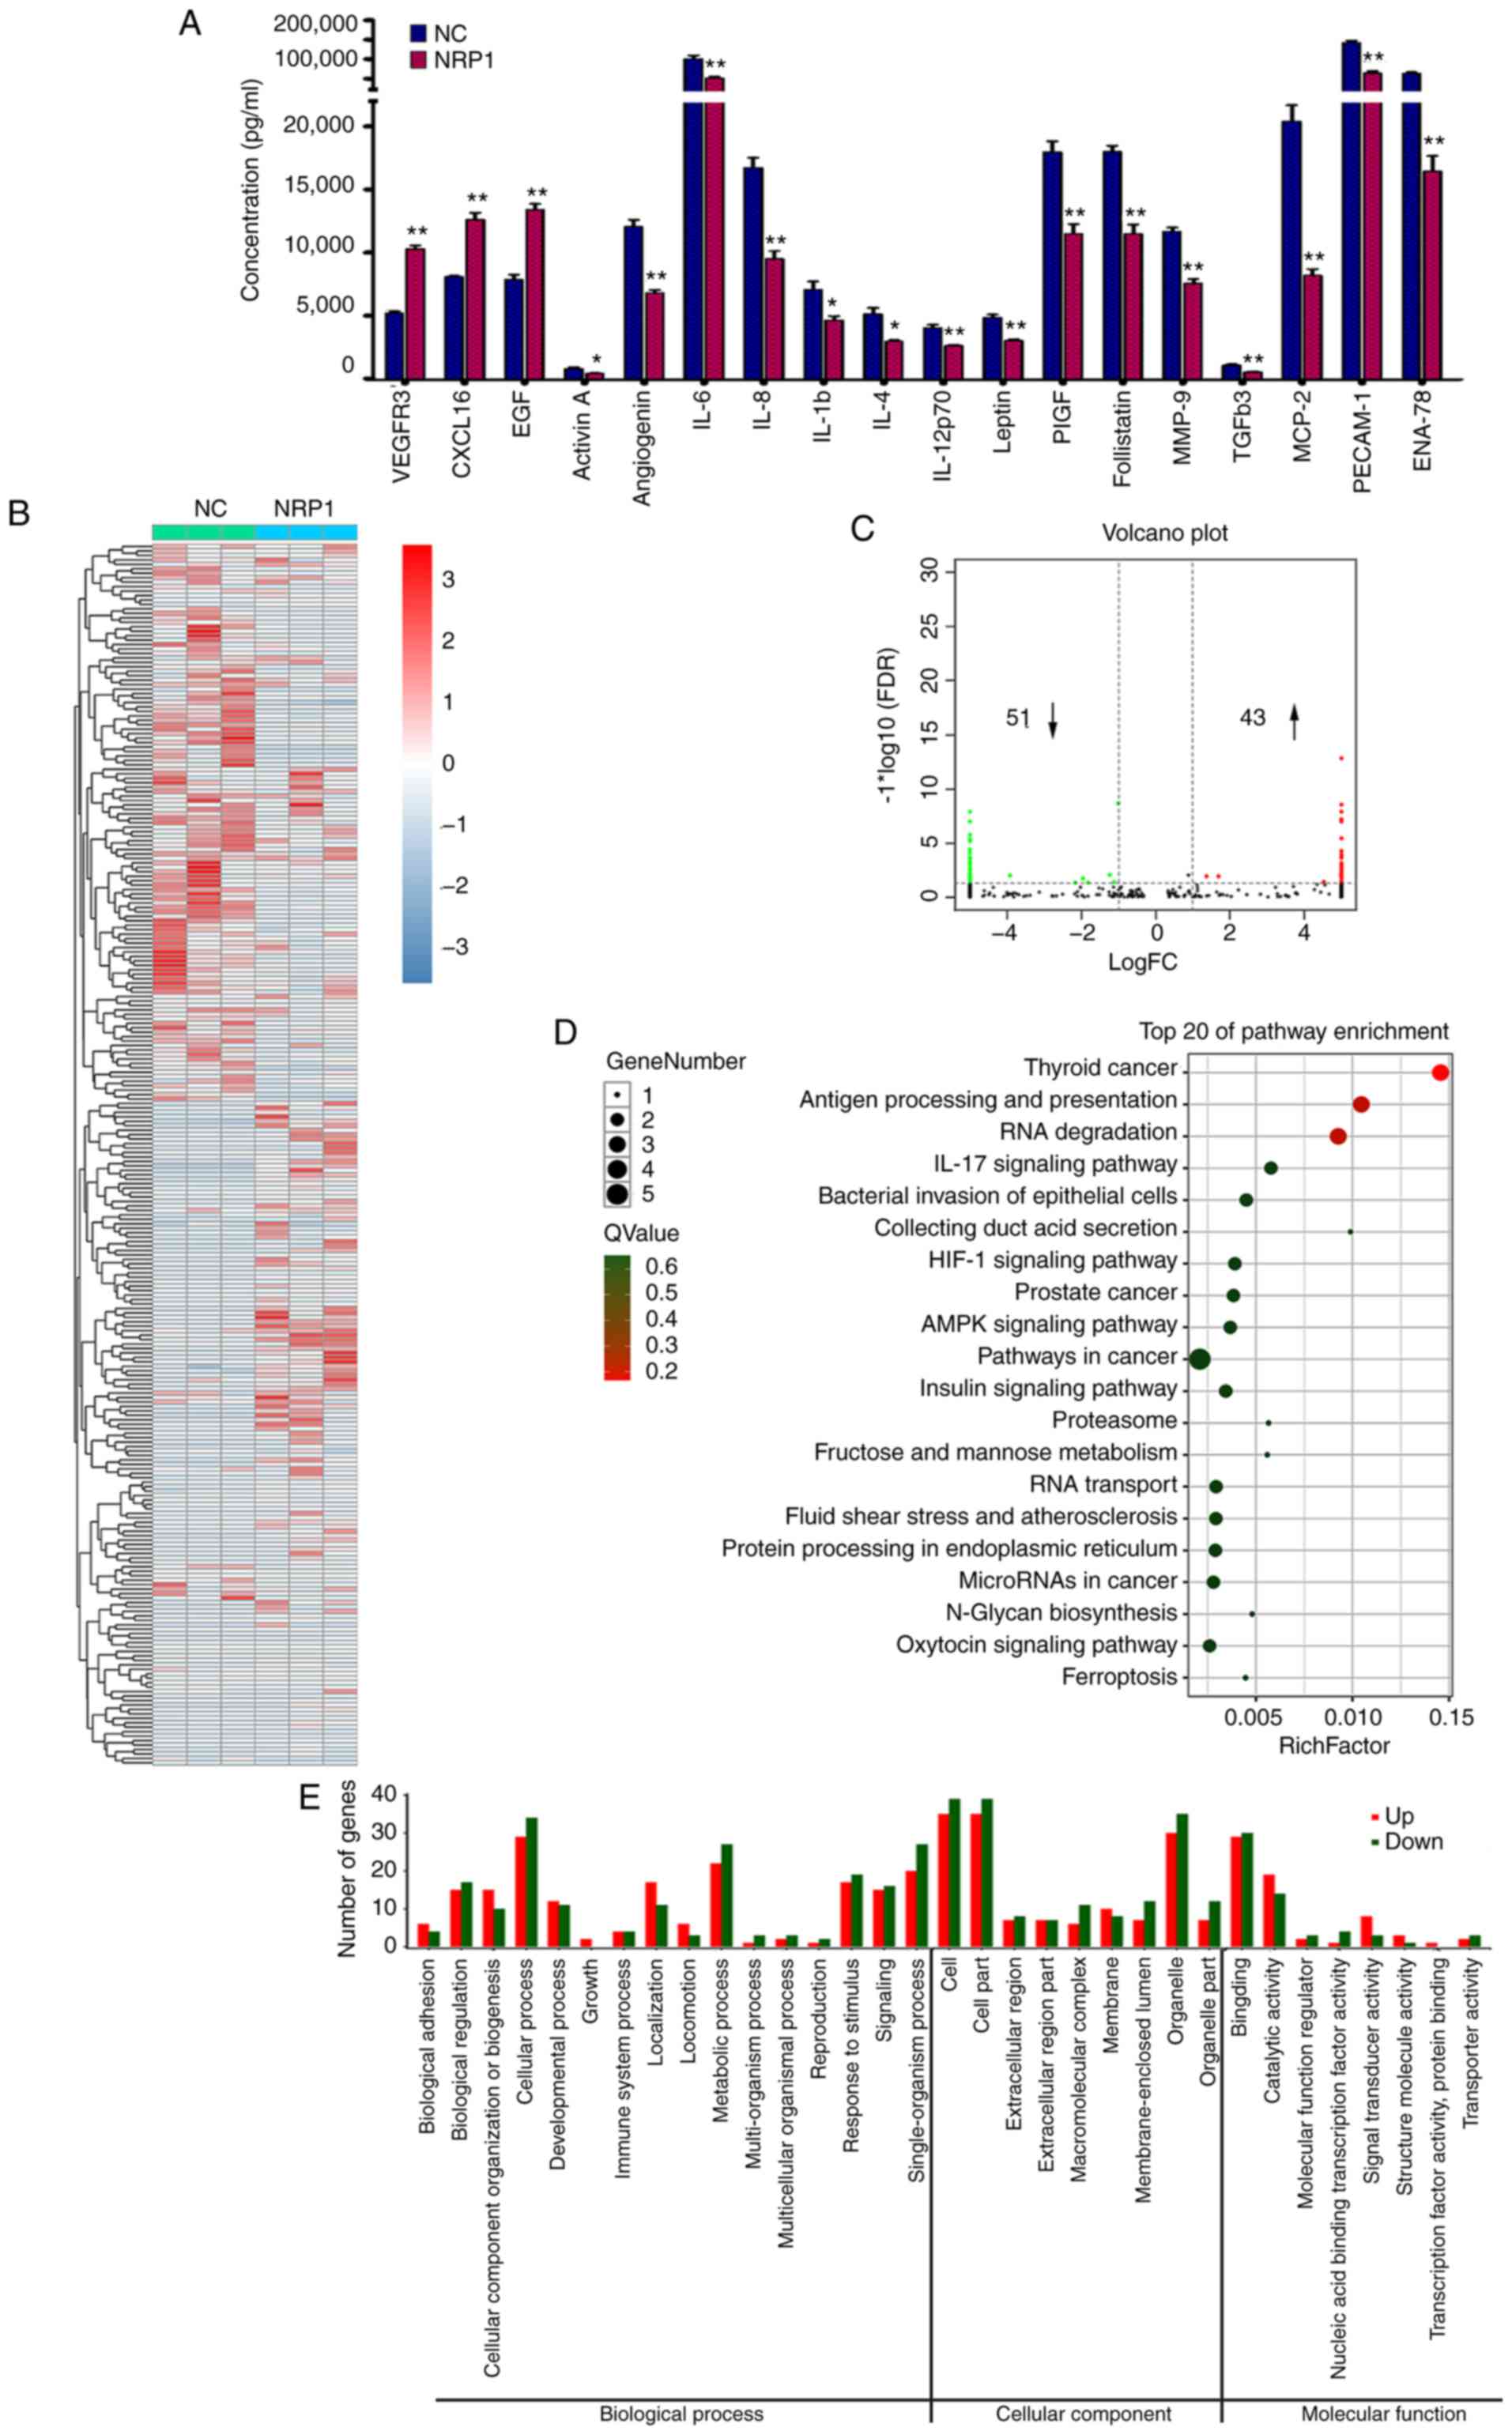
Potential proangiogenic mechanism of
NRP1
To further investigate the mechanisms of action
involved in the proangiogenic activity of NRP1, a human
angiogenesis antibody array (Fig.
4A) and RNA-Seq (Fig. 4B-E)
analysis were performed in HUVECs with the control group and the
overexpression NRP1 groups. The human angiogenesis antibody array
could concurrently detect the expression of 60 angiogenesis-related
proteins. Three proteins, VEGF receptor 3 (VEGFR3), CXCL16 and
epidermal growth factor (EGF), were significantly upregulated after
NRP1 overexpression (P<0.01; Fig.
4A). Fifteen proteins, including activin A, angiogenin (ANG),
interleukin (IL)-6, IL-8, IL-1b, IL-4, IL-12p70, leptin, PIGF,
follistatin, MMP-9, TGFb3, MCP-2, PECAM-1 and ENA-78, were
downregulated by NRP1 overexpression in HUVECs (P<0.05 for
activin A, IL-1b and IL-4; P<0.01 for the other proteins).
Proteins with band densities exhibiting a fold increase >1.5 or
a fold decrease <0.67 were defined as differentially expressed
between the control and NRP1 overexpression groups in HUVECs.
To obtain a more comprehensive understanding of the
NRP1-associated molecular mechanism of action, RNA-Seq analysis was
used for transcriptomic profiling. The overall Q30 percentage was
>90.43 and >98.87% of the reads were mapped to reference
genes in all groups. The gene expression levels were presented as
fragments per kilobase of transcript per million mapped read values
and a correlation coefficient >0.99 was observed between samples
of the same group. The heatmap of significantly expressed genes is
presented in Fig. 4B. Overall, 94
DEGs, including 45 upregulated (Table
I, not including NRP1) and 48 downregulated (Table II), were identified between the
control and NRP1 overexpression groups in HUVECs (Fig. 4C). DEGs were further analyzed
using the KEGG and GO databases for pathway and functional
annotations. The KEGG enrichment pathway analysis matched to 88
pathways (Table SI). The top 20
KEGG pathways most significantly enriched in DEGs are displayed in
Fig. 4D. The 10 most enriched
pathways with the greatest distribution of DEGs were the following:
Thyroid cancer; antigen processing and presentation; RNA
degradation; IL-17 signaling pathway; bacterial invasion of
epithelial cells; collecting duct acid secretion; HIF-1 signaling
pathway; prostate cancer; AMPK signaling pathway; and pathways in
cancer. Three of them were directly associated with some types of
cancer. The DEGs were assigned into 33 sub-categories from the
three main GO functional categories, namely: Biological process
(sixteen), cellular component (nine) and molecular function (eight)
(Fig. 4E).
 | Table IUpregulated genes by overexpression
of NRP1 using RNA-Seq. |
Table I
Upregulated genes by overexpression
of NRP1 using RNA-Seq.
| No. | Symbol | Description | FPKM
| P-value |
|---|
| Control | NRP1 |
|---|
| 1 | MAPK7 | Mitogen-activated
protein kinase 7 | 0.001 | 0.543 |
2.718×10−06 |
| 2 | CDC42BPA | CDC42 binding
protein kinase α | 0.001 | 0.267 |
5.426×10−05 |
| 3 | CAMKK2 |
Calcium/calmodulin-dependent protein
kinase kinase 2 | 0.001 | 0.687 |
1.347×10−05 |
| 4 | APLP2 | Amyloid β precursor
like protein 2 | 0.230 | 11.753 |
1.687×10−08 |
| 5 | RHOT1 | Ras homolog family
member T1 | 0.001 | 1.370 |
1.032×10⁻¹¹ |
| 6 | NRDC | Nardilysin
convertase | 0.001 | 1.950 |
3.621×10−07 |
| 7 | TPM1 | Tropomyosin 1 | 0.001 | 0.900 |
5.959×10−06 |
| 8 | CASP10 | Caspase-10 | 0.001 | 0.263 |
1.351×10−06 |
| 9 | PCMTD1 |
Protein-L-isoaspartate (D-aspartate)
O-methyltransferase domain containing 1 | 0.001 | 1.280 |
2.477×10−06 |
| 10 | RRBP1 | Ribosome binding
protein 1 | 0.001 | 0.727 |
5.203×10−05 |
| 11 | HIVEP2 | Human
immunodeficiency virus type I enhancer-binding protein 2 | 1.813 | 0.837 |
6.189×10−05 |
| 12 | PTPRK | Protein tyrosine
phosphatase, receptor type K | 0.001 | 0.383 |
5.873×10−07 |
| 13 | ZNF462 | Zinc finger protein
462 | 0.001 | 0.417 |
6.091×10−08 |
| 14 | NRP1 | Neuropilin 1 | 0.930 | 960.273 |
2.646×10⁻¹⁸ |
| 15 | ABCF1 | ATP binding
cassette subfamily F member 1 | 0.003 | 1.083 |
1.727×10⁻¹¹ |
| 16 | NSD2 | Nuclear receptor
binding SET domain protein 2 | 0.001 | 0.253 |
8.008×10−07 |
| 17 | MGAT1 | Mannosyl
(α-1,3-)-glycoprotein β-1,2-N-acetylglucosaminyltransferase | 0.001 | 1.430 |
1.994×10⁻¹¹ |
| 18 | LRRC37A | Leucine rich repeat
containing 37A | 0.001 | 0.253 |
1.017×10−05 |
| 19 | ELP5 | Elongator
acetyltransferase complex subunit 5 | 0.001 | 1.007 |
2.366×10−05 |
| 20 | NEB | Nebulin | 0.001 | 0.053 |
4.932×10−06 |
| 21 | DIAPH3 | Diaphanous related
formin 3 | 0.001 | 0.777 |
1.002×10−07 |
| 22 | SEMA4D | Semaphorin 4D | 0.001 | 1.027 |
1.650×10⁻¹³ |
| 23 | ZNF566 | Zinc finger protein
566 | 0.007 | 0.490 |
5.861×10−05 |
| 24 | VRK2 | Vaccinia related
kinase 2 | 0.001 | 1.510 |
8.116×10−05 |
| 25 | LANCL1 | LanC like 1 | 0.001 | 0.570 |
7.683×10−05 |
| 26 | 8 Sep | Septin 8 | 0.001 | 1.700 |
1.013×10−06 |
| 27 | OSBPL9 | Oxysterol binding
protein like 9 | 0.001 | 0.507 |
3.895×10−06 |
| 28 | TACC3 | Transforming acidic
coiled-coil protein 3 | 0.001 | 2.230 |
4.007×10−07 |
| 29 | SLBP | Stem-loop binding
protein | 1.940 | 0.040 |
2.892×10−05 |
| 30 | HNRNPH1 | Heterogeneous
nuclear ribonucleoprotein H1 | 0.001 | 6.140 |
1.272×10⁻¹² |
| 31 | ASPH | Aspartate
β-hydroxylase | 0.113 | 2.607 |
6.574×10−05 |
| 32 | DNPEP | Aspartyl
aminopeptidase | 0.001 | 3.310 |
2.407×10−06 |
| 33 | ATP2C1 | ATPase secretory
pathway Ca2+ transporting 1 | 0.843 | 2.737 |
1.329×10−05 |
| 34 | SLC38A2 | Solute carrier
family 38 member 2 | 2.913 | 7.513 |
1.511×10−05 |
| 35 | HSP90AA1 | Heat shock protein
90 α family class A member 1 | 19.937 | 5.660 |
8.247×10−05 |
| 36 | C16orf58 | Chromosome 16 open
reading frame 58 | 0.007 | 1.153 |
4.260×10−07 |
| 37 | NCOA4 | Nuclear receptor
coactivator 4 | 0.001 | 1.097 |
3.774×10−08 |
| 38 | RPL17-C18orf32 | RPL17-C18orf32
readthrough | 0.001 | 2.440 |
7.856×10⁻¹² |
| 39 | NCOA4 | Nuclear receptor
coactivator 4 | 0.001 | 0.847 |
1.586×10−06 |
| 40 | FCHO1 | FCH domain only
1 | 0.001 | 0.913 |
8.297×10⁻¹⁰ |
| 41 | PRKD2 | Protein kinase
D2 | 0.001 | 1.423 |
7.957×10−06 |
| 42 | GAS2L1 | Growth arrest
specific 2 like 1 | 0.001 | 3.313 |
4.079×10−07 |
| 43 | RPH3AL | Rabphilin 3A like
(without C2 domains) | 0.010 | 0.550 |
5.177×10−05 |
| 44 | MAPKAPK3 | Mitogen-activated
protein kinase-activated protein kinase 3 | 0.003 | 0.960 |
8.374×10−06 |
| 45 | TCF7L2 | Transcription
factor 7 like 2 | 0.001 | 0.363 |
1.569×10−05 |
| 46 | EAW79261 | hCG2022618 [Homo
sapiens] | 0.001 | 0.293 |
5.914×10−05 |
| Table IIDownregulated genes by overexpression
of NRP1 using RNA-Seq. |
Table II
Downregulated genes by overexpression
of NRP1 using RNA-Seq.
| No. | Symbol | Description | FPKM
| P-value |
|---|
| Control | NRP1 |
|---|
| 1 | COQ8B | Coenzyme Q8B | 1.053 | 0.001 |
3.004×10−07 |
| 2 | TUBGCP2 | Tubulin γ complex
associated protein 2 | 0.527 | 0.001 |
2.474×10−05 |
| 3 | SPINK5 | Serine peptidase
inhibitor, Kazal type 5 | 0.320 | 0.001 |
4.827×10−05 |
| 4 | GLIS2 | GLIS family zinc
finger 2 | 0.253 | 0.001 |
3.011×10−05 |
| 5 | ZNF217 | Zinc finger protein
217 | 0.833 | 0.003 |
2.186×10−05 |
| 6 | PTPRA | Protein tyrosine
phosphatase, receptor type A | 0.537 | 0.001 |
3.686×10−07 |
| 7 | ATP2C1 | ATPase secretory
pathway Ca2+ transporting 1 | 1.157 | 0.001 |
1.334×10⁻¹² |
| 8 | MBD1 | Methyl-CpG binding
domain protein 1 | 0.763 | 0.001 |
6.928×10−07 |
| 9 | GPSM1 | G protein signaling
modulator 1 | 1.623 | 0.001 |
2.892×10−06 |
| 10 | ELP5 | Elongator
acetyltransferase complex subunit 5 | 0.857 | 0.001 |
2.144×10−06 |
| 11 | PFKFB3 |
6-Phosphofructo-2-kinase/fructose-2,6-biphosphatase
3 | 1.353 | 0.001 |
5.488×10−05 |
| 12 | PJA1 | Praja ring finger
ubiquitin ligase 1 | 0.530 | 0.001 |
7.216×10−06 |
| 13 | PISD | Phosphatidylserine
decarboxylase | 3.573 | 0.001 |
2.896×10−07 |
| 14 | SFXN3 | Sideroflexin 3 | 3.280 | 0.001 |
1.663×10−07 |
| 15 | ARL6 | ADP ribosylation
factor like GTPase 6 | 0.813 | 0.001 |
1.320×10−05 |
| 16 | GLT8D1 | Glycosyltransferase
8 domain containing 1 | 3.860 | 0.860 |
7.515×10−05 |
| 17 | UBFD1 | Ubiquitin family
domain containing 1 | 3.867 | 1.633 |
8.530×10−06 |
| 18 | KIF16B | Kinesin family
member 16B | 0.280 | 0.001 |
3.078×10−05 |
| 19 | TSNAX | Translin associated
factor X | 1.720 | 0.001 |
2.502×10−05 |
| 20 | CDK19 | Cyclin dependent
kinase 19 | 0.457 | 0.001 |
5.554×10−05 |
| 21 | RGS4 | Regulator of G
protein signaling 4 | 0.807 | 0.001 |
1.101×10−09 |
| 22 | TMED2 | Transmembrane p24
trafficking protein 2 | 4.257 | 0.001 |
6.963×10−05 |
| 23 | CCM2 | CCM2 scaffolding
protein | 0.627 | 0.001 |
8.447×10−05 |
| 24 | MARK2 | Microtubule
affinity regulating kinase 2 | 0.420 | 0.001 |
1.108×10−05 |
| 25 | FBXL5 | F-box and
leucine-rich repeat protein 5 | 1.970 | 0.001 |
1.773×10⁻¹¹ |
| 26 | PAICS |
Phosphoribosylaminoimidazole carboxylase
and phosphoribosylaminoimidazolesuccinocarboxamide synthase | 9.247 | 0.010 |
4.015×10⁻¹⁰ |
| 27 | PABPC1 | Poly(A) binding
protein cytoplasmic 1 | 6.967 | 0.001 |
2.650×10−05 |
| 28 | TNIP1 | TNFAIP3 interacting
protein 1 | 1.540 | 0.001 |
1.133×10−07 |
| 29 | COPS7A | COP9 signalosome
subunit 7A | 1.113 | 0.001 |
5.359×10−07 |
| 30 | ARL13B | ADP ribosylation
factor like GTPase 13B | 0.287 | 0.001 |
4.100×10−05 |
| 31 | INPPL1 | Inositol
polyphosphate phosphatase like 1 | 0.510 | 0.001 |
8.327×10−05 |
| 32 | ENO2 | Enolase 2 | 1.200 | 0.001 |
1.513×10−07 |
| 33 | PITPNA |
Phosphatidylinositol transfer protein
α | 1.487 | 0.001 |
1.251×10−05 |
| 34 | SPARC | Secreted protein
acidic and cysteine rich | 11.103 | 0.733 |
1.092×10−05 |
| 35 | ZNF839 | Zinc finger protein
839 | 0.727 | 0.001 |
2.689×10−08 |
| 36 | PSME2 | Proteasome
activator subunit 2 | 14.677 | 3.767 |
2.264×10−05 |
| 37 | B2M |
β-2-Microglobulin | 248.433 | 123.977 |
7.467×10⁻¹⁴ |
| 38 | NBPF14 | Neuroblastoma
breakpoint family member 14 | 0.650 | 0.001 |
1.319×10−06 |
| 39 | NFE2L1 | Nuclear factor,
erythroid 2 like 1 | 6.493 | 0.001 |
7.856×10−08 |
| 40 | ZNF17 | Zinc finger protein
17 | 0.583 | 0.001 |
9.434×10−06 |
| 41 | TPR | Translocated
promoter region, nuclear basket protein | 1.153 | 0.001 |
6.454×10−05 |
| 42 | NAGK | N-acetylglucosamine
kinase | 1.793 | 0.001 |
2.326×10−05 |
| 43 | ATP6V0E2 | ATPase H+
transporting V0 subunit e2 | 1.050 | 0.001 |
1.849×10−09 |
| 44 | CNOT9 | CCR4-NOT
transcription complex subunit 9 | 1.210 | 0.001 |
1.082×10−07 |
| 45 | CBL | Cbl
proto-oncogene | 0.293 | 0.001 |
5.579×10−06 |
| 46 | PPT1 | Palmitoyl-protein
thioesterase 1 | 1.003 | 0.001 |
1.167×10−08 |
| 47 | PLEKHM1 | hCG2002091, isoform
CRA_c, partial | 0.193 | 0.001 |
3.445×10−05 |
| 48 | Uncharacterized
protein | LOC102723360 | 0.573 | 0.001 |
2.123×10−06 |
Most critical molecule and signaling
pathway related to the angiogenic function of NRP1
To identify the most critical molecule and signaling
pathway related to the angiogenic function of NRP1, the
relationship between 7 differentially regulated proteins from the
angiogenesis antibody array and DEGs identified by RNA-Seq
(including 36 upregulated and 35 downregulated DEGs) was analyzed
using the STITCH website. A protein-protein interaction network was
constructed, with isolated proteins not being shown (Fig. 5A). The maximum number of
interactors for the 1st shell and 2nd shells were set as no more
than 5, with the score of the predicted functional partners being
>0.999. The minimum required interaction score was a medium
confidence (0.400). The EGF receptor (EGFR) was an important node
in the protein-protein network and NRP1 was found to have a
'textmining' interaction with EGFR and an 'experimentally
determined' interaction with SEMA4D.
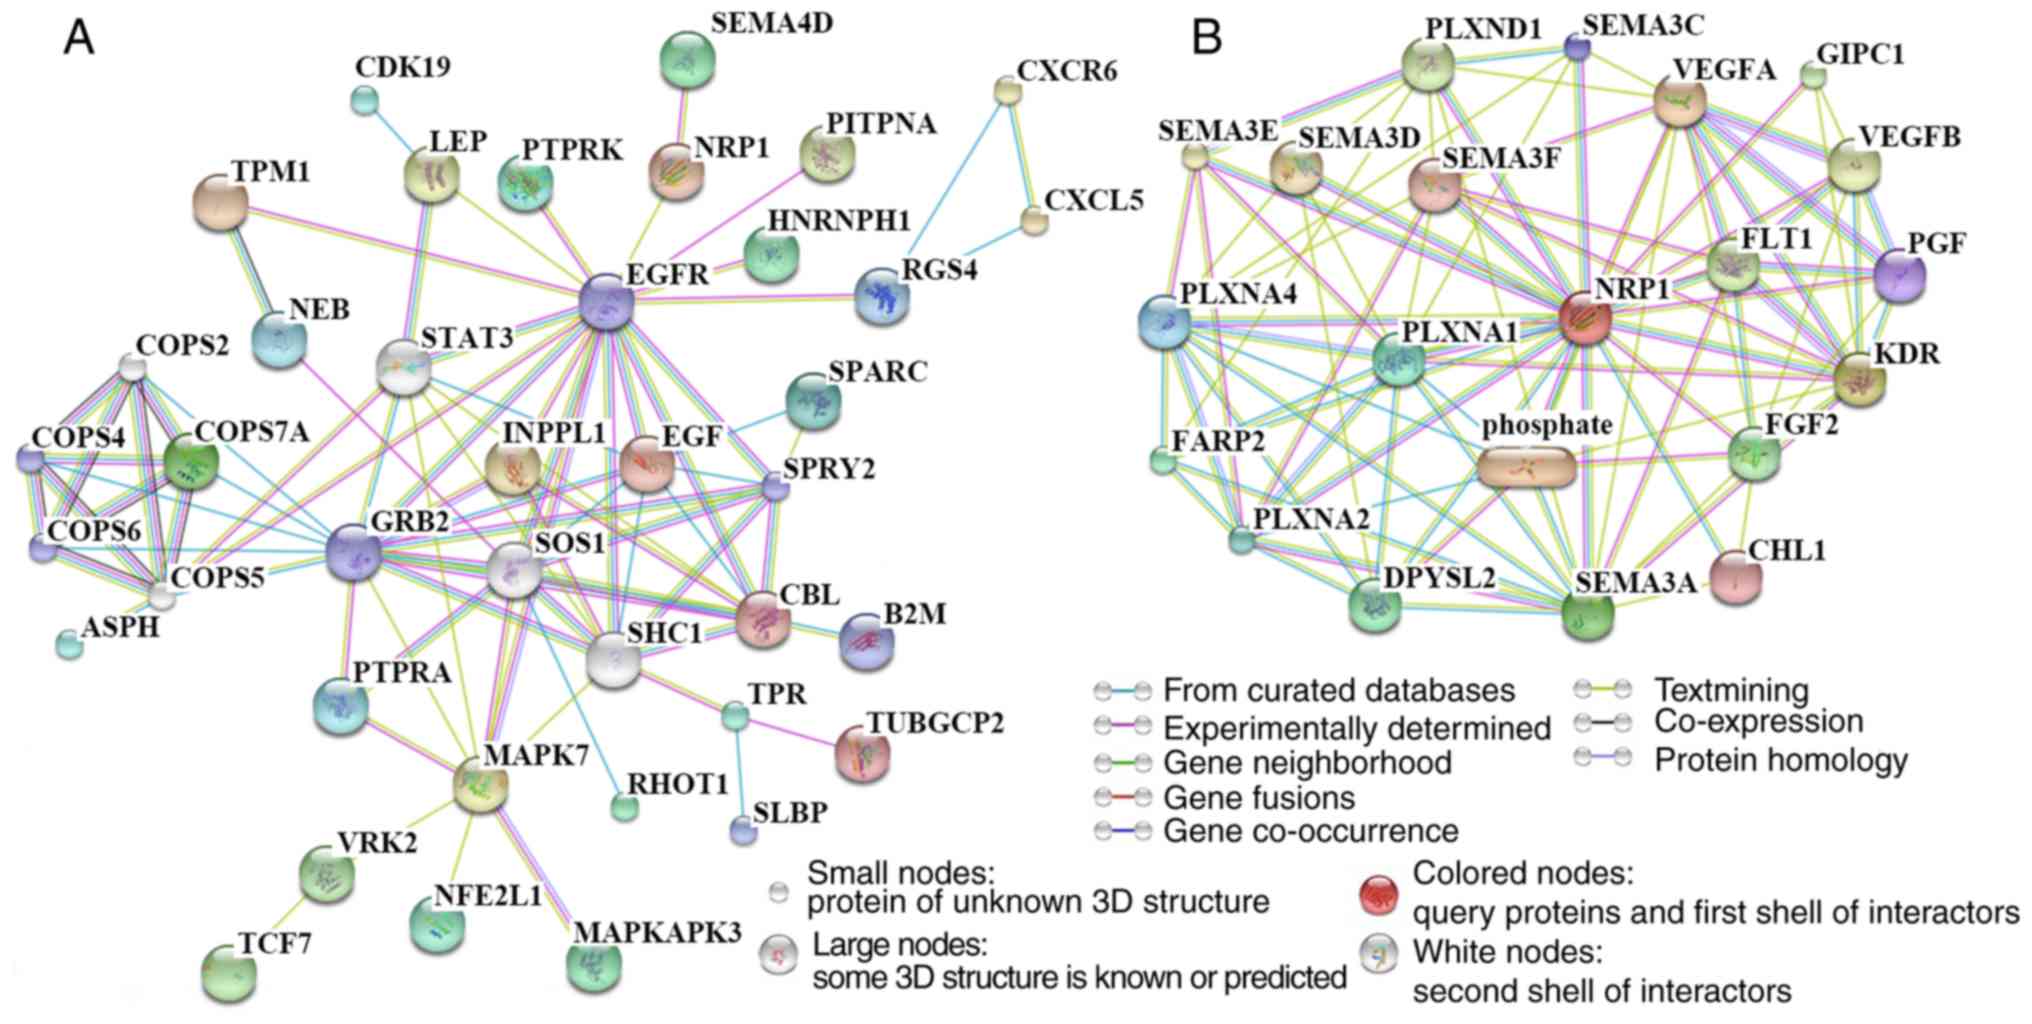 | Figure 5Signaling pathways related to the
angiogenic function of NRP1 as determined using the STITCH website.
(A) Pathway analysis of differentially expressed proteins detected
using the human angiogenesis antibody array and DEGs from RNA-Seq.
The maximum number of interactors for the 1st shell and 2nd shells
were set as no more than 5 and the score of predicted functional
partners was >0.999. (B) The top 20 proteins which were most
closely related to NRP1. The maximum number of interactors for the
1st shell was no more than 20 interactors and the score of
predicted functional partners was >0.935. The minimum required
interaction score was a medium confidence of 0.400. NRP1,
neuropilin 1; DEG, differentially expressed gene; GRB2, growth
factor receptor-bound protein 2; EGFR, epidermal growth factor
receptor; COPS6, COP9 constitutive photomorphogenic homolog subunit
6; SPRY2, sprout homolog 2; COPS4, COP9 constitutive
photomorphogenic homolog subunit 4; VEGFA, vascular endothelial
growth factor A; KDR, kinase insert domain receptor; FLT1,
fms-related tyrosine kinase 1; SEMA3A, semaphorin 3A; PLXNA1,
plexin A1, coreceptor for SEMA3A, SEMA3C, SEMA3F and SEMA6D;
PLXNA2, plexin A2, coreceptor for SEMA3A and SEMA6A; PLXNA4, plexin
A4, coreceptor for SEMA3A; SEMA3C, semaphorin 3C; PGF, placental
growth factor; CHL1, close homolog of L1; SEMA3F, semaphorin 3F;
phosphate, phosphoric acid; SEMA3D, semaphorin 3D; SEMA3E,
semaphorin 3E; VEGFB, vascular endothelial growth factor B; PLXND1,
plexin D1, cell surface receptor for SEMA4A and for class 3
semaphorins; GIPC1, GIPC PDZ domain-containing family, member 1;
FGF2, fibroblast growth factor 2; DPYSL2, dihydropyrimidinase-like
2; FARP2, FERM, RhoGEF and pleckstrin domain protein 2. |
To observe NRP1-related proteins in human cells, the
STITCH website also was employed to determine the top 20 proteins
which were most closely related to NRP1 (Fig. 5B). The predicted functional
partners score was >0.935. There were nine SEMA family related
proteins: Five SEMA family members including SEMA3A, SEMA3C,
SEMA3F, SEMA3D and SEMA3E; and four coreceptors for SEMA proteins,
PLXNA1, PLXNA2, PLXNA4 and PLXND1. There was a potential close
association between NRP1 and the SEMA family identified.
Key differentially expressed genes
related to vascular maturation
PECAM-1 has often been used as one of the indicators
of vascular maturation (21) and
a previous study found that the ability of tumor-associated
macrophages to produce SEMA4D was critical for tumor angiogenesis
and vessel maturation (22). The
effects of NRP1 on angiogenesis may be achieved by affecting
vascular maturity; therefore, the present study reviewed in detail
the functions of each DEG and protein. A total of 10 genes which
had been reported to be closely associated to angiogenesis and
maturation were found. The 10 genes are listed in Table III, including 7 upregulated
(MAPK7, TPM1, RRBP1, PTPRK, SEMA4D, HSP90AA1 and PRKD2) and 3
downregulated (PFKFB3, RGS4 and SPARC) factors. The related
functions, including fluid shear stress (MAPK7) (23), EC-cell junctions (TPM1) (24), maintenance of cell adherens
junction (PTPRK) (25), support
for tumor angiogenesis (PRKD2, HSP90A, PFKFB3 and RGS4) (26-29), critical and support for vessel
maturation (SEMA4D, RRBP1) (22,30-31) and suppression of angiogenesis
(SPARC) (32) were revealed.
These DEGs provided supporting evidence for the hypothesis that
NRP1 impacts angiogenesis by altering vascular maturity.
| Table IIIDifferentially expressed genes from
RNA-seq related to angiogenesis and maturation. |
Table III
Differentially expressed genes from
RNA-seq related to angiogenesis and maturation.
| No. | Name | Function (related
to angiogenesis and maturation) | Regulated by
NRP1 | (Refs.) |
|---|
| 1 | MAPK7 | Response to fluid
shear stress in endothelial cells | Up | (20) |
| 2 | TPM1 | Protects
endothelial cell-cell junctions | Up | (21) |
| 3 | RRBP1 | Novel biomarker of
intestinal epithelial cell maturation | Up | (37) |
| 4 | PTPRK | Dissolution of
adherens junctions in a rat model of pancreatitis | Up | (32) |
| 5 | SEMA4D | Critical for tumor
angiogenesis and vessel maturation; enhances angiogenesis | Up | (19,27) |
| 6 | HSP90AA1 | HSP90 supports
tumor growth and angiogenesis through PRKD2 protein
stabilization | Up | (23) |
| 7 | PRKD2 | | Up | |
| 8 | PFKFB3 | Tumor
angiogenesis | Down | (24,25) |
| 9 | RGS4 |
Angiogenesis-related | Down | (26) |
| 10 | SPARC | Inhibition of
angiogenesis | Down | (29) |
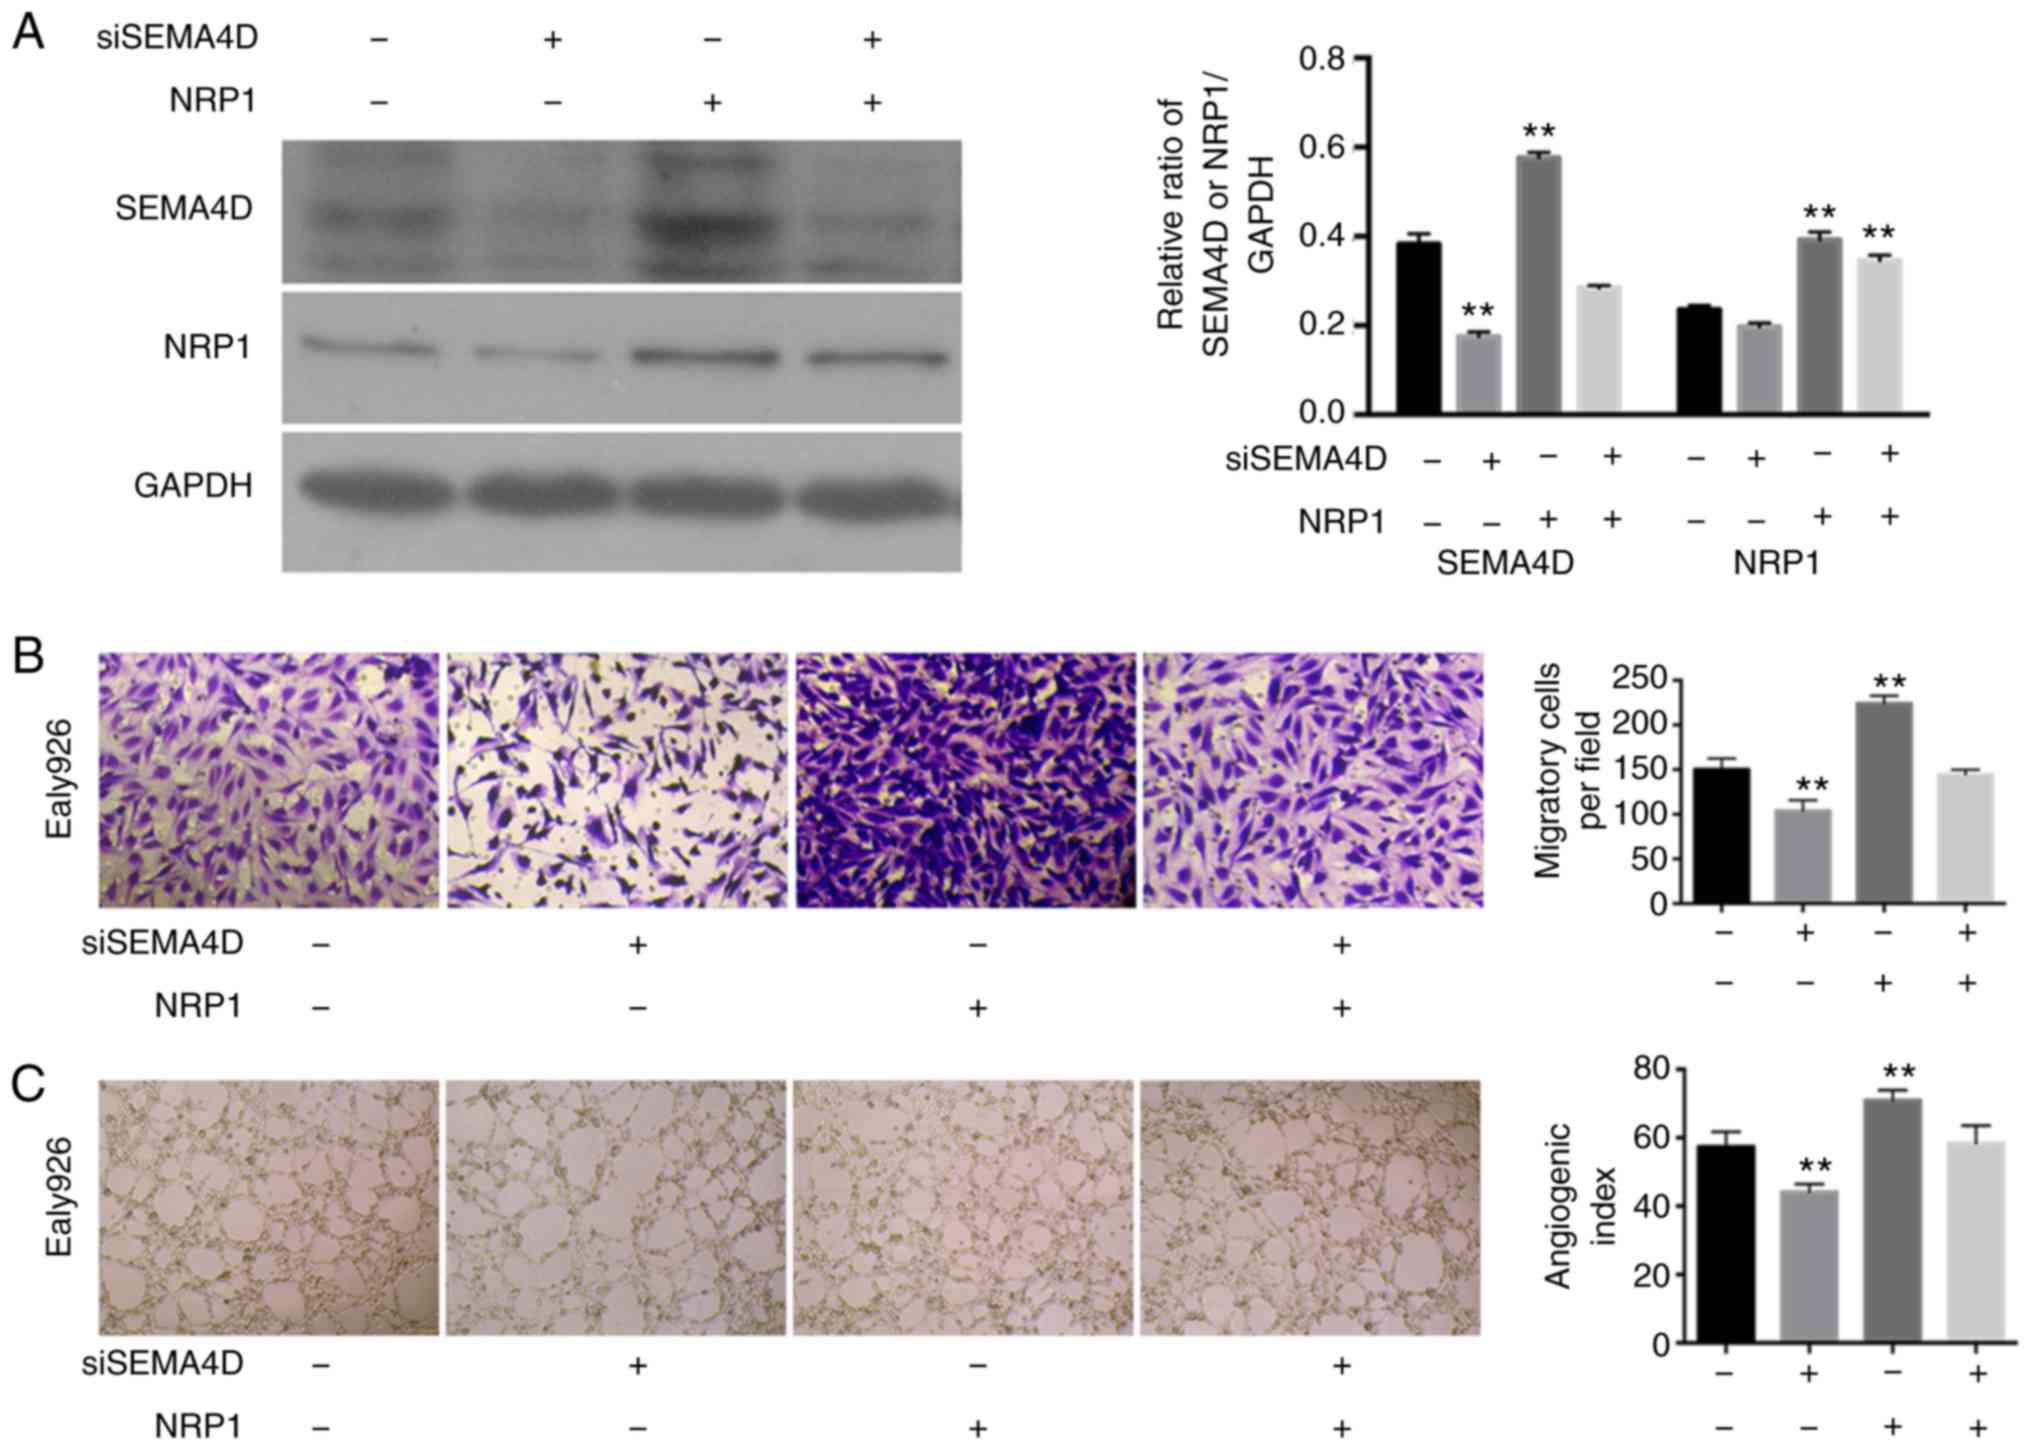
SEMA4D plays a key role in the angiogenic
function of NRP1
NRP1 overexpression significantly increased the
levels of SEMA4D (P<0.01) (Table
III and Fig. 6A), and
siSEMA4D could not significantly regulate the expression levels of
NRP1 (P>0.05) in the Ealy926 cell line. However, SEMA4D
knockdown could not effectively downregulate the expression levels
of SEMA4D when NRP1 was overexpressed concurrently (Fig. 6A). SEMA4D knockdown with normal
NRP1 expression levels maintained significantly decreased the
migratory ability of the Ealy926 cell line compared with the
control (P<0.01). While NRP1 overexpression increased the cell
migration, SEMA4D knockdown with NRP1-overexpression did not result
in a significant change in the cell migration of Ealy926 cells
compared with the control (P>0.05; Fig. 6B). SEMA4D knock-down significantly
reduced the cord forming ability (P<0.01; Fig. 6C) compared with the control in the
Ealy926 cell lines. However, SEMA4D-knockdown with
NRP1-overexpression did not cause a change in the cord forming
ability compared with the control (P>0.05; Fig. 6C). SEMA4D may have played an
important role in the process whereby NRP1 affects the angiogenesis
and maturation of ECs.
Discussion
According to the TCGA database analysis, NRP1 mRNA
expression levels were significantly higher in primary tumor
tissues than in normal tissues for various tumor types. In
addition, NRP1 was abundantly expressed in the mid-grade and
persistently overexpressed throughout the process of tumor
development. Moreover, high NRP1 expression levels were associated
to the survival time of patients with various types of tumors.
Therefore, the present data indicated a pro-carcinogenic effect of
NRP1 in tumors, which was also supported by previous studies
(10,33).
The proangiogenic function of NRP1 may be produced
by promoting the endothelial tip cell function during angiogenesis,
to promote neovascularization (34). NRP1 over-expression significantly
promoted EC proliferation, migration and angiogenesis, but these
processes were inhibited after NRP1 downregulation.
According to the antibody array analysis results,
the levels of angiogenic cytokines and chemokines (activin A, IL-6,
IL-8, IL-1b, IL-4, IL-12p70, leptin, follistatin, TGFβ3, MCP-2 and
ENA78) and EC markers (PECAM-1, ANG, PIGF and MMP-9) were
significantly downregulated by NRP1 overexpression. PECAM-1 (CD31)
has been reported as one of the commonly used markers of vascular
ECs during the process of angiogenesis in tumors (35), and is one of the main components
of the EC intercellular junction (36). ANG was first isolated and
identified solely by its ability to induce new blood vessel
formation (37) and also was
reported to have a potential control over vascular homeostasis
through the maintenance of EC self-renewal (38). PIGF is a homodimeric glycoprotein,
belonging to the vascular EGF sub-family and is a potent angiogenic
factor (39). MMP-9, is a key
regulator of the extracellular matrix, involved in the degradation
of various extracellular matrix proteins (40). The EC-cell junction and matrix
maintain the connections between ECs and control vascular
permeability and leukocyte migration. Downregulation of ANG and
PIGF may result in damage to the endothelial or vascular
homeostasis. Downregulation of PECAM-1 and MMP-9 were revealed to
play an important role in regulating the EC network, both in terms
of the formation and migration (41), indicating a reduced connection and
support among ECs, and a function of these molecules in reducing
the vascular maturity.
High expression levels of NRP1 in ECs also
significantly regulated other key factors which were related to the
effects on angiogenesis and maturation. MAPK7 has been reported as
essential for EC function, such as the response to fluid shear
stress and angiogenesis (23,42). TPM1 protects EC-cell junctions
through the stabilization of F-actin-dependent cell-cell junctions
in the H1299 and EA.hy926 cell lines (24). RRBP1 is a novel marker for
intestinal epithelial cell maturation, as revealed using proteomic
detection (31). PTPRK is a
negative regulator of adhesion, invasion and the proliferative
capacity of cancer cells (43),
and interacts, as determined by co-immunoprecipitation, with
E-cadherin, α-catenin and β-catenin prior to the dissolution of
adherens junctions in a rat model of pancreatitis (25). The HSP90AA1 gene encodes for the
HSP90A protein, which is essential for malignant transformation and
progression (44). Signals from
hypoxia and the HSP90 pathways are interconnected and funneled by
PRKD2 into the nuclear factor-κB/VEGF-A signaling axis to promote
tumor angiogenesis (26,45). The enrichment of PFKFB3 may
promote HUVEC angiogenesis (27),
with its blockade inhibiting cancer cell proliferation, causing
tumor vessel disintegration and suppressing EC growth (28). RGS4 levels are decreased when
angiogenesis is induced using nitric oxide (29). SPARC expression may reduce the
extent of angiogenesis, and SPARC silencing increased angiogenesis.
These observations were found by regulating the expression levels
of VEGF and MMP-7 (32). The
angiogenesis and reduced vascular maturity of ECs generated by NRP1
overexpression were also found to be closely associated with MAPK7,
TPM1, RRBP1, PTPRK, HSP90A, PRKD2, PFKFB3, RGS4 and SPARC
expression levels.
Furthermore, the results of an integrated analysis
of anti-body array and RNA-Seq data suggested that SEMA4D may be
the critical molecule which mediates the angiogenic and maturation
related to NRP1 regulation. SEMA4D is a protein of the semaphorin
family, which plays an important role in the tumor microenvironment
and neoplastic angiogenesis, and may markedly enhance angiogenic
potential (30). When SEMA4D was
lacking in the tumor microenvironment, the ability of cancer cells
to generate tumor masses and metastasize was severely impaired,
which was determined to be due to a defective vascularization
inside the tumor, and the ability of tumor-associated macrophages
to produce SEMA4D was found to be critical for tumor angiogenesis
and vessel maturation (22). NRPs
are also closely associated to the SEMA protein family members,
especially NRP1 (46). In the
present study, SEMA4D knockdown effectively reduced the migratory
and cord forming ability of ECs, and this downregulation was
prevented when NRP1 was overexpressed concurrently. NRP1
overexpression was also found to increase the expression levels of
SEMA4D, while SEMA4D knockdown did not affect the expression levels
and the angiogenic function of NRP1. The results of these assays
further revealed the critical role of SEMA4D in the angiogenic and
maturation activity of NRP1. These findings indicated the potential
therapeutic value of NRP1 in combating angiogenesis in tumors.
In conclusion, the present study demonstrated that
NRP1 was significantly upregulated in solid primary tumors compared
with that of normal tissues, and was significantly associated with
tumor development. The results of gain- and loss-of-function
experiments emphasized the function of NRP1 in promoting EC
proliferation, motility and capillary-like tube formation, as well
as in reducing apoptosis. NRP1 overexpression led to significantly
decreased expression levels of EC markers (PECAM-1, ANG, PIGF and
MMP-9) to reduce the vascular maturity. MAPK7, TPM1, RRBP1, PTPRK,
HSP90A, PRKD2, PFKFB3, RGS4 and SPARC were revealed to play
important roles in this process. SEMA4D was the key molecule
associated with the angiogenic function of NRP1 in ECs. NRP1 may
therefore be both a therapeutic target in combination with current
antiangiogenic strategies and a candidate prognostic marker for
tumors.
Supplementary Data
Funding
The present study was supported by the Natural
Science Foundation of Fujian Province (grant nos. 2016J01618 and
2017J01380), and the Projects for Technology Plan of Xiamen in
China (grant nos. 3502Z20174076 and 3502Z20174077).
Availability of data and materials
The datasets generated and/or analyzed during this
study are available from the corresponding author on reasonable
request.
Authors' contributions
HZ and HP conceived and designed the study. ZL, ZY,
HJ, HP, KH and HJ performed the experiments. HP, HJ and HJ
processed and analyzed the data. ZL, HP and HZ wrote, reviewed,
and/or revised the manuscript. All authors read and approved the
final manuscript.
Ethics approval and informed consent
Not applicable.
Patient consent for publication
Not applicable.
Competing interests
The authors declare that they have no competing
interests.
Acknowledgments
Not applicable.
References
|
1
|
Moriya J and Minamino T: Angiogenesis,
cancer, and vascular aging. Front Cardiovasc Med. 4:652017.
View Article : Google Scholar : PubMed/NCBI
|
|
2
|
Gacche RN and Meshram RJ: Targeting tumor
micro-environment for design and development of novel
anti-angiogenic agents arresting tumor growth. Prog Biophys Mol
Biol. 113:333–354. 2013. View Article : Google Scholar : PubMed/NCBI
|
|
3
|
Sun X, Evren S and Nunes SS: Blood vessel
maturation in health and disease and its implications for
vascularization of engineered tissues. Crit Rev Biomed Eng.
43:433–454. 2015. View Article : Google Scholar : PubMed/NCBI
|
|
4
|
Jain RK: Normalization of tumor
vasculature: An emerging concept in antiangiogenic therapy.
Science. 307:58–62. 2005. View Article : Google Scholar : PubMed/NCBI
|
|
5
|
Goel S, Duda DG, Xu L, Munn LL, Boucher Y,
Fukumura D and Jain RK: Normalization of the vasculature for
treatment of cancer and other diseases. Physiol Rev. 91:1071–1121.
2011. View Article : Google Scholar : PubMed/NCBI
|
|
6
|
Viallard C and Larrivée B: Tumor
angiogenesis and vascular normalization: Alternative therapeutic
targets. Angiogenesis. 20:409–426. 2017. View Article : Google Scholar : PubMed/NCBI
|
|
7
|
Ronca R, Benkheil M, Mitola S, Struyf S
and Liekens S: Tumor angiogenesis revisited: Regulators and
clinical implications. Med Res Rev. 37:1231–1274. 2017. View Article : Google Scholar : PubMed/NCBI
|
|
8
|
De Bock K, Cauwenberghs S and Carmeliet P:
Vessel abnormalization: Another hallmark of cancer? Molecular
mechanisms and therapeutic implications. Curr Opin Genet Dev.
21:73–79. 2011. View Article : Google Scholar
|
|
9
|
Cantelmo AR, Pircher A, Kalucka J and
Carmeliet P: Vessel pruning or healing: Endothelial metabolism as a
novel target? Expert Opin Ther Targets. 21:239–247. 2017.
View Article : Google Scholar : PubMed/NCBI
|
|
10
|
Lin J, Zhang Y, Wu J, Li L, Chen N, Ni P,
Song L and Liu X: Neuropilin 1 (NRP1) is a novel tumor marker in
hepatocellular carcinoma. Clin Chim Acta. 485:158–165. 2018.
View Article : Google Scholar : PubMed/NCBI
|
|
11
|
Lampropoulou A and Ruhrberg C: Neuropilin
regulation of angiogenesis. Biochem Soc Trans. 42:1623–1628. 2014.
View Article : Google Scholar : PubMed/NCBI
|
|
12
|
Takashima S, Kitakaze M, Asakura M,
Asanuma H, Sanada S, Tashiro F, Niwa H, Miyazaki Ji JI, Hirota S,
Kitamura Y, et al: Targeting of both mouse neuropilin-1 and
neuropilin-2 genes severely impairs developmental yolk sac and
embryonic angiogenesis. Proc Natl Acad Sci USA. 99:3657–3662. 2002.
View Article : Google Scholar : PubMed/NCBI
|
|
13
|
Gu C, Rodriguez ER, Reimert DV, Shu T,
Fritzsch B, Richards LJ, Kolodkin AL and Ginty DD: Neuropilin-1
conveys semaphorin and VEGF signaling during neural and
cardiovascular development. Dev Cell. 5:45–57. 2003. View Article : Google Scholar : PubMed/NCBI
|
|
14
|
Casazza A, Laoui D, Wenes M, Rizzolio S,
Bassani N, Mambretti M, Deschoemaeker S, Van Ginderachter JA,
Tamagnone L and Mazzone M: Impeding macrophage entry into hypoxic
tumor areas by sema3a/Nrp1 signaling blockade inhibits angiogenesis
and restores antitumor immunity. Cancer Cell. 24:695–709. 2013.
View Article : Google Scholar : PubMed/NCBI
|
|
15
|
Delgoffe GM, Woo SR, Turnis ME, Gravano
DM, Guy C, Overacre AE, Bettini ML, Vogel P, Finkelstein D,
Bonnevier J, et al: Stability and function of regulatory T cells is
maintained by a neuropilin-1-semaphorin-4a axis. Nature.
501:252–256. 2013. View Article : Google Scholar : PubMed/NCBI
|
|
16
|
Morin E, Sjöberg E, Tjomsland V, Testini
C, Lindskog C, Franklin O, Sund M, Öhlund D, Kiflemariam S, Sjöblom
T and Claesson-Welsh L: VEGF receptor-2/neuropilin 1 trans-complex
formation between endothelial and tumor cells is an independent
predictor of pancreatic cancer survival. J Pathol. 246:311–322.
2018. View Article : Google Scholar : PubMed/NCBI
|
|
17
|
Zhuo H, Lyu Z, Su J, He J, Pei Y, Cheng X,
Zhou N, Lu X, Zhou S and Zhao Y: Effect of lung squamous cell
carcinoma tumor microenvironment on the CD105+ endothelial cell
proteome. J Proteome Res. 13:4717–4729. 2014. View Article : Google Scholar : PubMed/NCBI
|
|
18
|
Chandrashekar DS, Bashel B, Balasubramanya
SA, Creighton CJ, Ponce-Rodriguez I, Chakravarthi BV and Varambally
S: UALCAN: A portal for facilitating tumor subgroup gene expression
and survival analyses. Neoplasia. 19:649–658. 2017. View Article : Google Scholar : PubMed/NCBI
|
|
19
|
Gyorffy B, Lanczky A, Eklund AC, Denkert
C, Budczies J, Li Q and Szallasi Z: An online survival analysis
tool to rapidly assess the effect of 22,277 genes on breast cancer
prognosis using microarray data of 1809 patients. Breast Cancer Res
Treat. 123:725–731. 2010. View Article : Google Scholar
|
|
20
|
Livak KJ and Schmittgen TD: Analysis of
relative gene expression data using real-time quantitative PCR and
the 2(-Delta Delta C(T)) method. Methods. 25:402–408. 2001.
View Article : Google Scholar
|
|
21
|
Jin H, Cheng X, Pei Y, Fu J, Lyu Z, Peng
H, Yao Q, Jiang Y, Luo L and Zhuo H: Identification and
verification of transgelin-2 as a potential biomarker of
tumor-derived lung-cancer endothelial cells by comparative
proteomics. J Proteomics. 136:77–88. 2016. View Article : Google Scholar : PubMed/NCBI
|
|
22
|
Sierra JR, Corso S, Caione L, Cepero V,
Conrotto P, Cignetti A, Piacibello W, Kumanogoh A, Kikutani H,
Comoglio PM, et al: Tumor angiogenesis and progression are enhanced
by sema4d produced by tumor-associated macrophages. J Exp Med.
205:1673–1685. 2008. View Article : Google Scholar : PubMed/NCBI
|
|
23
|
Maleszewska M, Vanchin B, Harmsen MC and
Krenning G: The decrease in histonemethyl transferase EZH2 in
response to fluid shear stress alters endothelial gene expression
and promotes quiescence. Angiogenesis. 19:9–24. 2016. View Article : Google Scholar
|
|
24
|
Gagat M, Grzanka D, Izdebska M, Sroka WD,
Hałas- Wiśniewska M and Grzanka A: Tropomyosin-1 protects
transformed alveolar epithelial cells against cigarette smoke
extract through the stabilization of F-actin-dependent cell-cell
junctions. Acta Histochem. 118:225–235. 2016. View Article : Google Scholar : PubMed/NCBI
|
|
25
|
Schnekenburger J, Mayerle J, Krüger B,
Buchwalow I, Weiss FU, Albrecht E, Samoilova VE, Domschke W and
Lerch MM: Protein tyrosine phosphatase kappa and SHP-1 are involved
in the regulation of cell-cell contacts at adherens junctions in
the exocrine pancreas. Gut. 54:1445–1155. 2005. View Article : Google Scholar : PubMed/NCBI
|
|
26
|
Azoitei N, Diepold K, Brunner C, Rouhi A,
Genze F, Becher A, Kestler H, van Lint J, Chiosis G, Koren J III,
et al: HSP90 supports tumor growth and angiogenesis through PRKD2
protein stabilization. Cancer Res. 74:7125–7136. 2014. View Article : Google Scholar : PubMed/NCBI
|
|
27
|
Gu M, Li L, Zhang Z, Chen J, Zhang W,
Zhang J, Han L, Tang M, You B, Zhang Q and You Y: PFKFB3 promotes
proliferation, migration and angiogenesis in nasopharyngeal
carcinoma. J Cancer. 8:3887–3896. 2017. View Article : Google Scholar : PubMed/NCBI
|
|
28
|
Conradi LC, Brajic A, Cantelmo AR, Bouché
A, Kalucka J, Pircher A, Brüning U, Teuwen LA, Vinckier S,
Ghesquière B, et al: Tumor vessel disintegration by maximum
tolerable PFKFB3 blockade. Angiogenesis. 20:599–613. 2017.
View Article : Google Scholar : PubMed/NCBI
|
|
29
|
Jaba IM, Zhuang ZW, Li N, Jiang Y, Martin
KA, Sinusas AJ, Papademetris X, Simons M, Sessa WC, Young LH and
Tirziu D: NO triggers RGS4 degradation to coordinate angiogenesis
and cardiomyocyte growth. J Clin Invest. 123:1718–1731. 2013.
View Article : Google Scholar : PubMed/NCBI
|
|
30
|
Zou T, Dissanayaka WL, Jiang S, Wang S,
Heng BC, Huang X and Zhang C: Semaphorin 4D enhances angiogenic
potential and suppresses osteo-/odontogenic differentiation of
human dental pulp stem cells. J Endod. 43:297–305. 2017. View Article : Google Scholar
|
|
31
|
Chang J, Chance MR, Nicholas C, Ahmed N,
Guilmeau S, Flandez M, Wang D, Byun DS, Nasser S, Albanese JM, et
al: Proteomic changes during intestinal cell maturation in vivo. J
Proteomics. 71:530–546. 2008. View Article : Google Scholar : PubMed/NCBI
|
|
32
|
Zhang JL, Chen GW, Liu YC, Wang PY, Wang
X, Wan YL, Zhu J, Gao HQ, Yin J, Wang W and Tian ML: Secreted
protein acidic and rich in cysteine (SPARC) suppresses angiogenesis
by down-regulating the expression of VEGF and MMP-7 in gastric
cancer. PLoS One. 7:e446182012. View Article : Google Scholar : PubMed/NCBI
|
|
33
|
Leng Q, Woodle MC and Mixson AJ: NRP1
transport of cancer therapeutics mediated by tumor-penetrating
peptides. Drugs Future. 42:95–104. 2017. View Article : Google Scholar : PubMed/NCBI
|
|
34
|
Fantin A, Vieira JM, Plein A, Denti L,
Fruttiger M, Pollard JW and Ruhrberg C: NRP1 acts cell autonomously
in endothelium to promote tip cell function during sprouting
angiogenesis. Blood. 121:2352–2362. 2013. View Article : Google Scholar : PubMed/NCBI
|
|
35
|
Newman PJ, Berndt MC, Gorski J, White GC
II, Lyman S, Paddock C and Muller WA: PECAM-1 (CD31) cloning and
relation to adhesion molecules of the immunoglobulin gene
superfamily. Science. 247:1219–1222. 1990. View Article : Google Scholar : PubMed/NCBI
|
|
36
|
Lertkiatmongkol P, Liao D, Mei H, Hu Y and
Newman PJ: Endothelial functions of platelet/endothelial cell
adhesion molecule-1 (CD31). Curr Opin Hematol. 23:253–259. 2016.
View Article : Google Scholar : PubMed/NCBI
|
|
37
|
Fett JW, Strydom DJ, Lobb RR, Alderman EM,
Bethune JL, Riordan JF and Vallee BL: Isolation and
characterization of angiogenin, an angiogenic protein from human
carcinoma cells. Biochemistry. 24:5480–5486. 1985. View Article : Google Scholar : PubMed/NCBI
|
|
38
|
Sheng J and Xu Z: Three decades of
research on angiogenin: A review and perspective. Acta Biochim
Biophys Sin (Shanghai). 48:399–410. 2016. View Article : Google Scholar
|
|
39
|
Athanassiades A and Lala PK: Role of
placenta growth factor (PIGF) in human extravillous trophoblast
proliferation, migration and invasiveness. Placenta. 19:465–473.
1998. View Article : Google Scholar : PubMed/NCBI
|
|
40
|
Appleby TC, Greenstein AE, Hung M,
Liclican A, Velasquez M, Villaseñor AG, Wang R, Wong MH, Liu X,
Papalia GA, et al: Biochemical characterization and structure
determination of a potent, selective antibody inhibitor of human
MMP9. J Biol Chem. 292:6810–6820. 2017. View Article : Google Scholar : PubMed/NCBI
|
|
41
|
Chistiakov DA, Orekhov AN and Bobryshev
YV: Endothelial PECAM-1 and its function in vascular physiology and
atherogenic pathology. Exp Mol Pathol. 100:409–415. 2016.
View Article : Google Scholar : PubMed/NCBI
|
|
42
|
Roberts OL, Holmes K, Müller J, Cross DA
and Cross MJ: ERK5 and the regulation of endothelial cell function.
Biochem Soc Trans. 37:1254–1259. 2019. View Article : Google Scholar
|
|
43
|
Sun PH, Ye L, Mason MD and Jiang WG:
Protein tyrosine phos-phatase kappa (PTPRK) is a negative regulator
of adhesion and invasion of breast cancer cells, and associates
with poor prognosis of breast cancer. J Cancer Res Clin Oncol.
139:1129–1139. 2013. View Article : Google Scholar : PubMed/NCBI
|
|
44
|
Zuehlke AD, Beebe K, Neckers L and Prince
T: Regulation and function of the humanHSP90AA1 gene. Gene.
570:8–16. 2015. View Article : Google Scholar : PubMed/NCBI
|
|
45
|
Azoitei N, Fröhling S, Scholl C and
Seufferlein T: PRKD2: A two-pronged kinase crucial for the
tumor-supporting activity of HSP90. Mol Cell Oncol. 2:e9814442015.
View Article : Google Scholar : PubMed/NCBI
|
|
46
|
Alto LT and Terman JR: Semaphorins and
their signaling mechanisms. Methods Mol Biol. 1493:1–25. 2017.
View Article : Google Scholar :
|