Introduction
Hepatocellular carcinoma (HCC) is one of main causes
of cancer-related mortality (1).
Currently, the incidence of hepatitis B and C viruses (HBV and
HCV)-related HCC has been greatly reduced by widely adopted HBV
vaccination and curative HCV treatments; however, non-alcoholic
steatohepatitis (NASH)-related HCC (NASH-HCC) is another type of
HCC caused by non-alcoholic fatty liver disease (NAFLD) or NASH.
NAFLD and its histological progressive form, NASH, are risk factors
for the development of HCC. NAFLD, the most frequent chronic liver
disease, is characterized by the accumulation of fat in the liver
(2), and 4-22% of HCC cases are
ascribed to NAFLD. A previous study demonstrated that increased
bile acid levels promote liver carcinogenesis in a mouse model of
NASH-HCC (3). Different
strategies, such as, checkpoint blockade, vaccination, adoptive
cell transfer, pan-tyrosine kinase inhibitors and tumor ablation
have been developed for the treatment of NASH-HCC (4). However, the prevention and treatment
of NASH-HCC remains a challenge due to a lack of understanding of
the mechanisms underlying the development and progression of
NASH-HCC.
NASH-HCC is often accompanied by a number of
metabolic comorbidities, including type II diabetes (5). Diabetes/obesity accounts for 36.6%
of all HCC cases, and is therefore one of the main risk factors for
the development of HCC in the United States (6). In type II diabetes, the
insensitivity of cells to insulin decreases glucose consumption and
increases glucose levels in the blood. Notably, patients with
diabetes or insulin resistance are more likely to develop HCC
(7,8). HCV can enhance the expression levels
of pathways associated with cancer and type II diabetes (9), which suggests that there is an
association between type II diabetes and HCC. Research has also
found that 6-27% of HCC cases are attributed to diabetes with
ethnic differences (10). In
addition, the long-term survival of patients with HBV-related HCC
with diabetes following liver transplantation is lower than that of
non-diabetic patients (11). In
addition, diabetes is positively associated with mortality
resulting from HCC (12,13). A previous study demonstrated that
metformin inhibits high-fat diet-induced cancer progression by
reducing inflammation and potentially restoring
NAFLD/NASH-associated tumor surveillance in zebrafish with HCC
(14). Moreover, in human
NASH-HCC, the expression of the obesity-associated protein, JCAD,
is upregulated, which promotes the progression of NASH-HCC by
inhibiting LATS2 kinase activity (15). However, the molecular biological
mechanisms connecting diabetes to NASH-HCC are not yet fully
understood.
Over the past several years, different mouse models
of diabetes, for example, using apolipoprotein E
(ApoE)−/− mice, have been developed (16-18). ApoE is involved in the transport
of lipoproteins in the blood and in homozygous knockout mice, for
gene accumulation-induced high levels of cholesterol in the blood
and atherosclerosis. Low doses of β-cell toxin streptozotozin (STZ)
can induce diabetes, mimicking type I diabetes in humans. In the
present study, NASH-HCC was induced via an injection of STZ and the
administration of a high-fat diet (HFD) in ApoE−/− mice.
Following a systematic investigation of the molecular biological
mechanisms under-lying NASH-HCC in ApoE−/− mice with
diabetes, critical factors important for the development of
NASH-HCC were identified. The present study aimed to provide a
comprehensive understanding of NASH-HCC developed from
diabetes.
Materials and methods
Mouse model of NASH-HCC
ApoE−/− (7 weeks of age, n=15) mice were
bred at a constant temperature (23±1°C) with 55±15% humidity and a
12-h light-dark cycle (lights on 09:00 to 21:00) in a typical SPF
laboratory animal room at the Animal Center of Guangdong Medical
Laboratory, and ApoE−/− male mice (8 weeks of age, n=3)
were then mated with ApoE−/− female mice (8 weeks of
age, n=12). After birth, only male mice were selected. There were 2
research groups, namely, the STZ-HFD group and the STZ-NC group,
with 10 male mice were in each group. The mice in the STZ-HFD group
were injected with 0.1 M sodium citrate-hydrochloric acid buffer
with 150 µg STZ (S0130; Sigma-Aldrich; Merck KGaA) 5 days
after birth, and were then fed a HFD (1055.05 Kcal/100 g; protein,
19.2%; fat, 4.3%; carbohydrates, 67.3%) beginning from the age of 4
weeks. The mice in the STZ-NC group were injected with 0.1 M sodium
citrate-hydrochloric acid buffer at 5 days after birth, and fed a
diet of 404 kcal/100 g (water, 10%; protein, 25.0%; fat, 4.5%; ash,
6.7%; carbohydrate, 49.3%; and fiber, 4.5%) beginning from the age
of 4 weeks.
The mice from the STZ-HFD and STZ-NC groups (10 mice
in each group) were sacrificed at the age of 22 weeks. Mouse serum
was prepared for serum biochemical analysis, and liver tissues were
isolated for weighing, histological, biochemical and molecular
biological analysis. NASH-HCC [tumor (T)], non-cancerous matched
tissues (STZ-HFD) and normal liver tissues (STZ-NC) were,
respectively, collected for RT-qPCR and RNA-sequencing. The animal
experiments were performed according to the guidelines of the
Minhang Hospital Animal Ethics Committee. Efforts were made in
consideration of animal welfare.
Patients and tissue samples
A total of 42 cases of NASH-HCC (age, 35-72 years;
female, n=20; male, n=22), 45 cases of other types of HCC (age,
43-68 years; female, n=23; male, n=22) and non-cancerous matched
tissues (n=42, NASH-HCC adjacent tissues; n=45). HCC adjacent
tissues were respectively collected from patients with NASH-HCC or
other types of HCC during surgery at the Minhang Hospital from May
1, 2016 to May 1, 2018. The samples were frozen in liquid nitrogen
and maintained at -80°C. The present study was approved by the
Ethics Committee of Minhang Hospital and written informed consent
was signed by each participant prior to surgery.
Cells and cell culture
Human liver epithelial cells (THLE-2, CBP61031) and
the human liver cancer cell lines, SNU-182 (CBP60211), SNU-387
(CBP60214), Hep3B (CBP60197) and PLC/PRF/5 (CBP60223), were
purchased from Nanjing Cobioer BioScience Co., Ltd. The human liver
cancer cell line, SK-Hep1 (HTB-52), was obtained from the American
Tissue Culture Collection (ATCC). THLE-2 cells were cultured in
Dulbecco's modified Eagle's medium (DMEM, 10566024; Gibco; Thermo
Fisher Scientific, Inc.) supplemented with 10% fetal bovine serum
(FBS, 16140071; Gibco; Thermo Fisher Scientific, Inc.), 100 IU/ml
penicillin and 100 µg/ml streptomycin (15070063; Gibco;
Thermo Fisher Scientific, Inc.). The SNU-182, SNU-387 and PLC/PRF/5
cells were cultured in RPMI-1640 medium (61870044; Gibco; Thermo
Fisher Scientific, Inc.) with 10% heat-inactivated FBS in 5%
CO2. The SK-Hep1 and Hep3B were grown in DMEM
supplemented with 10% FBS, 2 mM L-glutamine (4 mM, 25030081; Gibco;
Thermo Fisher Scientific, Inc.), penicillin and streptomycin.
Liver/weight body ratio and
histopathology
The mouse livers were collected, observed, weighed
and photographed. Liver organ index was determined based on the
liver weight (g)/the body weight of the mice (g). One part of the
liver tissues was snap-frozen in liquid nitrogen for further
experiments, while another part was fixed with 10% formalin for
liver histopathological analysis by H&E staining. For H&E
staining, the tissue blocks (3-5 µm thick) were cut using a
freezing microtome. Specifically, the samples were fixed in 10%
(v/v) neutral-buffered formaldehyde (G2161, Beijing Solarbio
Science & Technology Co., Ltd.), rinsed in PBS, and then
orderly stained with hematoxylin and eosin (C0105; Beyotime
Institute of Biotechnology, Inc.) for 10 min at room temperature,
and washed with distilled water for 10 min. Finally, images of the
sections was captured using a light microscope (E200; Nikon
Corporation) at ×40, ×100 and ×400 magnification.
Serum biochemical analysis
The blood samples were separately obtained via tail
vein puncture from 5 mice in each group at 6, 10, 14, 16 and 22
weeks of age. Blood glucose levels were determined using glucose
strips (107233294888; Roche Diagnostics) at room temperature. Serum
was then collected following centrifugation at 850 × g for 15 min
at room temperature. A fully-automatic biochemical analyzer
(BS-420; Mindray Medical International Co. Ltd.) was used to detect
the contents of the liver injury markers, alanine aminotransferase
(ALT), aspartate aminotransferase (AST), triglycerides (TGs),
low-density lipoprotein (LDL), total bile acid (TBA) and total
cholesterol (TC) in serum according to the specifications and
instructions of the manufacturer.
RNA isolation and RT-qPCR
For the extraction of RNA from the tissues, the
tissue specimens were disrupted in liquid nitrogen, homogenized
using TRIzol reagent (15596018, Invitrogen; Thermo Fisher
Scientific, Inc.) at 4°C, followed by centrifugation at 500 × g at
4°C for 15 min. The supernatant was then collected and total RNA
was isolated from the supernatant using the Qiagen RNeasy Plus Mini
kit (74134; Qiagen GmbH) at 4°C. For RNA extraction from the HCC
cell lines, the cells were treated with TRIzol reagent and RNA was
extracted using chloroform and isopropanol at 4°C. The
concentration of the RNA was determined using a NanoDrop 8000
spectrophotometer (ND-8000-GL; Thermo Fisher Scientific, Inc.).
Reverse transcription was performed using the PrimeScript™ II 1st
Strand cDNA Synthesis kit (6210B; Takara Bio, Inc.).
SYBR®-Green PCR Master Mix (4312704; Applied Biosystems)
and the Bio-Rad CFX 96 Touch Real-Time PCR Detection System
(1855196; Bio-Rad Laboratories, Inc.) were employed for RT-qPCR,
which was conducted at 95°C for 5 min, 40 cycles at 95°C for 15
sec, at 60°C for 30 sec, and at 70°C for 10 sec. GAPDH was used as
an internal control, and the 2−ΔΔCq method (19) was used to calculate the relative
expression levels. All the reactions were performed 3 times. The
primers used are listed in Table
I.
 | Table IPrimers used for RT-qPCR. |
Table I
Primers used for RT-qPCR.
| Gene | Forward | Reverse |
|---|
| Ubc (mouse) |
GAGGTTGCTGAGACTCGTCC |
CCATCTACTGTTATCACTCGGCT |
| Asxl2 (mouse) |
TGTCCCAGTAGTTCCTCAGTC |
TGGGTTTCATGGTGATAAGCTC |
| Asxl2 (human) |
GGAAAAGGGACGTAGGAAGAAG |
ACTCATGGGTGTATTGGGGTA |
| HOMER1 |
CCCTCTCTCATGCTAGTTCAGC |
GCACAGCGTTTGCTTGACT |
| XPO1 (mouse) |
GGGTAACTCGCGGCCTAAAC |
AGGGCTTCGGGAAAAGTCAC |
| cbx5 (mouse) |
GTGGTGGAAAAGGTGTTGGAC |
GTTCCCAAGTATTGTGCTCCTC |
| NSD1 (mouse) |
TCCGGTGAATTTAGATGCCTCC |
CGGTAACTGCATAGTACACCCAT |
| MMP-2 (human) |
TACAGGATCATTGGCTACACACC |
GGTCACATCGCTCCAGACT |
| MMP-9 (human) |
TGTACCGCTATGGTTACACTCG |
GGCAGGGACAGTTGCTTCT |
| cyclin D1
(human) |
GCTGCGAAGTGGAAACCATC |
CCTCCTTCTGCACACATTTGAA |
| c-Myc (human) |
GGCTCCTGGCAAAAGGTCA |
CTGCGTAGTTGTGCTGATGT |
| IL-6 (mouse) |
CTGCAAGAGACTTCCATCCAG |
AGTGGTATAGACAGGTCTGTTGG |
| TNF-α (mouse) |
CAGGCGGTGCCTATGTCTC |
CGATCACCCCGAAGTTCAGTAG |
| GPC3 (mouse) |
CAGCCCGGACTCAAATGGG |
GCCGTGCTGTTAGTTGGTATTTT |
| p65 (mouse) |
TGCGATTCCGCTATAAATGCG |
ACAAGTTCATGTGGATGAGGC |
| MCP-1 (mouse) |
TAAAAACCTGGATCGGAACCAAA |
GCATTAGCTTCAGATTTACGGGT |
| TGF-β (mouse) |
CCACCTGCAAGACCATCGAC |
CTGGCGAGCCTTAGTTTGGAC |
| Collagen type 1
(mouse) |
GCTCCTCTTAGGGGCCACT |
ATTGGGGACCCTTAGGCCAT |
| Collagen type 3
(mouse) |
CTGTAACATGGAAACTGGGGAAA |
CCATAGCTGAACTGAAAACCACC |
| Gapdh (mouse) |
AATGGATTTGGACGCATTGGT |
TTTGCACTGGTACGTGTTGAT |
| Gapdh (human) |
TGTGGGCATCAATGGATTTGG |
ACACCATGTATTCCGGGTCAAT |
Bioinformatics analysis of RNA-sequencing
data
Raw sequence data were processed using the standard
Illumina pipe-lines for base-calling and FASTQ file generation.
Paired-end reads were mapped to the Musculus reference
genome and transcriptome (build mm10) using Burrows-Wheeler Aligner
(BWA). FeatureCounts (version 1.4.6-p5) was used to assign sequence
reads to genes (20).
Differential expression analysis was conducted using Bioconductor
edgeR package 1.6 (21).
Differentially expressed genes (DEGs) were determined according to
an adjusted P-value <0.05 based on the Benjamini-Hochberg
multiple-testing correction and the absolute value of
log2-transformed fold change >2. Principle Component Analysis
(PCA) was performed to evaluate the determination of associations
by total gene content using FactoMineR and Factoextra R packages.
The gene ontology (GO) analysis for examining molecular function
was performed using EnrichR. Heatmap analysis for the top 16 DEGs
was conducted by the DEGseq test after the median center had been
transformed in MultiExperiment Viewer software (22). Pathway analysis employed the KEGG
database (https://www.genome.jp/kegg/). KOBAS
software (version v2.0) (23) was
used to examine the statistical enrichment of DEGs in the KEGG
pathways.
Cell transfection
siRNA targeting Asxl2 (AM16708, Sigma-Aldrich; Merck
KGaA) (forward, 5′-AUA CAA UUU ACU CAA UGU GAA-3′; and reverse,
5′-CAC AUU GAG UAA AUU GUA UUG-3′) and negative control siRNA
(A06001; GenePharma) were transfected into SNU-182 cells according
to the instructions of the manufacturers. The full-length sequence
of Asxl2 was amplified and cloned into the pcDNA 3.1 plasmid
(V79020; Invitrogen; Thermo Fisher Scientific, Inc.). The pcDNA
3.1- Asxl2 or pcDNA 3.1 empty plasmid were then transfected into
the Hep3B cells. Opti-MEM (11058021; Invitrogen; Thermo Fisher
Scientific, Inc.) mixed with Lipofectamine® 2000
(11668019; Invitrogen; Thermo Fisher Scientific, Inc.) was used for
the transfection of siRNAs or plasmids (50 pmol) into the cells at
room temperature for 10 min. Following incubation at 37°C for 24 h,
the medium was refreshed and the cells were prepared for use in
further experiments.
Western blot (WB) analysis
For WB analysis, total protein samples were
extracted from the cells using RIPA lysis buffer (89901; Thermo
Fisher Scientific, Inc.) with a protease inhibitor (36978; Thermo
Fisher Scientific, Inc.). The Pierce™ BCA Protein Assay kit (23225;
Thermo Fisher Scientific, Inc.) was used for detecting the protein
concentration. Protein (60 µg/lane) was separated on 8%
SDS-polyacrylamide gels and then transferred onto a polyvinylidene
difluoride (PVDF) membrane (LC2002; Invitrogen; Thermo Fisher
Scientific, Inc.), which was blocked with 5% skimmed milk
(PA201-01; HBM BioMed China Ltd.) for 10 min at room temperature.
The PVDF membrane was then incubated with primary antibodies at 4°C
overnight. Primary antibodies used were as follows: Anti-Asxl2
(ab176599, 1:2,000), anti-matrix metalloproteinase (MMP)-2
(ab37150, 1:2,000), anti-MMP-9 (ab73734, 1:2,000), anti-cyclin D1
(ab134175, 1:2,000), anti-c-Myc (ab32072, 1:2,000), anti-GAPDH
(ab8245, 1:5,000) (all from Abcam). The membrane was further
incubated with HRP-linked anti-rabbit IgG antibody (1:2,000, 7074;
Cell Signaling Technology, Inc.) for ZEB1 and GAPDH at 4°C
overnight. Finally, SignalFire™ ECL reagent (6883; Cell Signaling
Technology, Inc.) and ImageQuant ECL Imager (28-9605-63; GE
Healthcare) were employed for signal detection. ImageLab software
(version 5.0; Bio-Rad Laboratories, Inc.) was used to analyze
according to grayscale value. Prior to each incubation, 1X TBST (50
mM Tris, 150 mM NaCl and 2% Tween-20; pH 7.5) was used to wash the
membrane 3 times. GADPH served as an internal control.
Cell Counting kit (CCK)-8 assay
The transfected cells at 2,000 cells per well were
seeded into 96-well plates. Following incubation for 24, 48, 72 or
96 h at 37°C, the wells were rinsed with PBS. Subsequently, 20
µl cell CCK-8 reagent (70-CCK801; MultiSciences Biotech Co.
Ltd.) mixed with 100 µl fresh culture were added to each
well. Following incubation for 4 h at 37°C in a 5% CO2
atmosphere, cell viability was measured by reading the optical
density value (DG-3022A microplate reader; Nanjing Huadong Electron
Tube Factory) at a wavelength of 450 nm. All the experiments were
performed in triplicate.
Flow cytometry
The cells were first trypsinized at 37°C for 2 min,
collected by centrifugation at 500 × g at 4°C for 5 min, washed
twice with 300 µl PBS and then fixed in 700 µl
ethanol at −20°C overnight. The cells were then stained with 1
µg/ml of propidium iodide (PI, 25535-16-4; Aladdin, China)
in 1 ml of PBS containing 50 µg/ml RNase A for 30 min at 4°C
in the dark and subsequently subjected to flow cytometry
(FACSCalibur flow cytometer; BD Biosciences) and data were analyzed
using FlowJo software (version 7.6.1; FlowJo LLC). The experiment
was repeated 3 times.
Wounding-healing assay
The cells (5.0×10⁵ cells/well) were
cultured in 6-well plates (140660; Thermo Fisher Scientific, Inc.)
at 37°C until cells appeared contact inhibition. The cells were
then scratched with a 10-µl micropipette tip. After washing
the cells twice with 1X PBS, the cells were starved by the addition
of fresh medium without FBS into the plates. Subsequently, the
cells were transfected with siRNA or plasmids for 48 h as described
above. Images of wound healing were captured using a microscope
(TS100; Nikon Corporation) at 0 and 48 h. The average horizontal
migration rate was calculated according to the formula:
(width0 h−width24 h)/width0 h
×100%.
Transwell assay
The cells (5.0×10⁵ cells/well) were
seeded into Matrigel invasion chambers (3428; Corning, Inc.).
Following incubation at 37°C for 24 h, the invaded cells were fixed
with methanol (M116127; Aladdin, China) and stained with 0.1%
crystal violet (548-62-9; Aladdin, China) at room temperature for
15 min. The number of invasive cells was counted under a microscope
(TS100; Nikon Corporation).
Statistical analysis
The data are presented as the means ± standard error
of mean (SEM) and analyzed by one-way analysis of variance (ANOVA),
followed by Dunnett's post hoc test or Tukey's test. P<0.05 was
considered to indicate a statistically significant difference.
GraphPad Prism 6 software (GraphPad Prism, Inc.) was used to
perform the statistical analyses.
Results
Liver pathology and biochemical
parameters of normal mice and mice in the NASH-HCC model group
By combining chemical and dietary interventions, a
simple model system using diabetic ApoE−/− mice was
successfully induced to establish the model of NASH-HCC.
Macroscopically, the livers from NASH-HCC model mice (STZ-HFD)
exhibited a pale yellow color, mild swelling and tumor protrusion
at 20 weeks (Fig. 1A). H&E
staining also revealed fatty liver with severe steatosis in the
NASH-HCC model mice, with inflammatory foci and moderate
inflammatory infiltration, including neutrophils, lymphocytes and
monocytes (Fig. 1B). The
concentration of blood glucose in the NASH-HCC model mice was
significantly higher than that in normal mice (STZ-NC, P<0.05,
Fig. 1C). Moreover, no
significant differences in liver/weight index between the NASH-HCC
model mice and the normal mice (P>0.05, Fig. 1D) were identified. Furthermore,
the serum levels of ALT, AST, TG, LDL, TBA and TC in the NASH-HCC
model mice and normal mice were determined, and it was found that
the serum levels of ALT, AST, LDL and TBA in the NASH-HCC model
mice were higher than those in the normal mice (P<0.05; Fig. 1E-J).
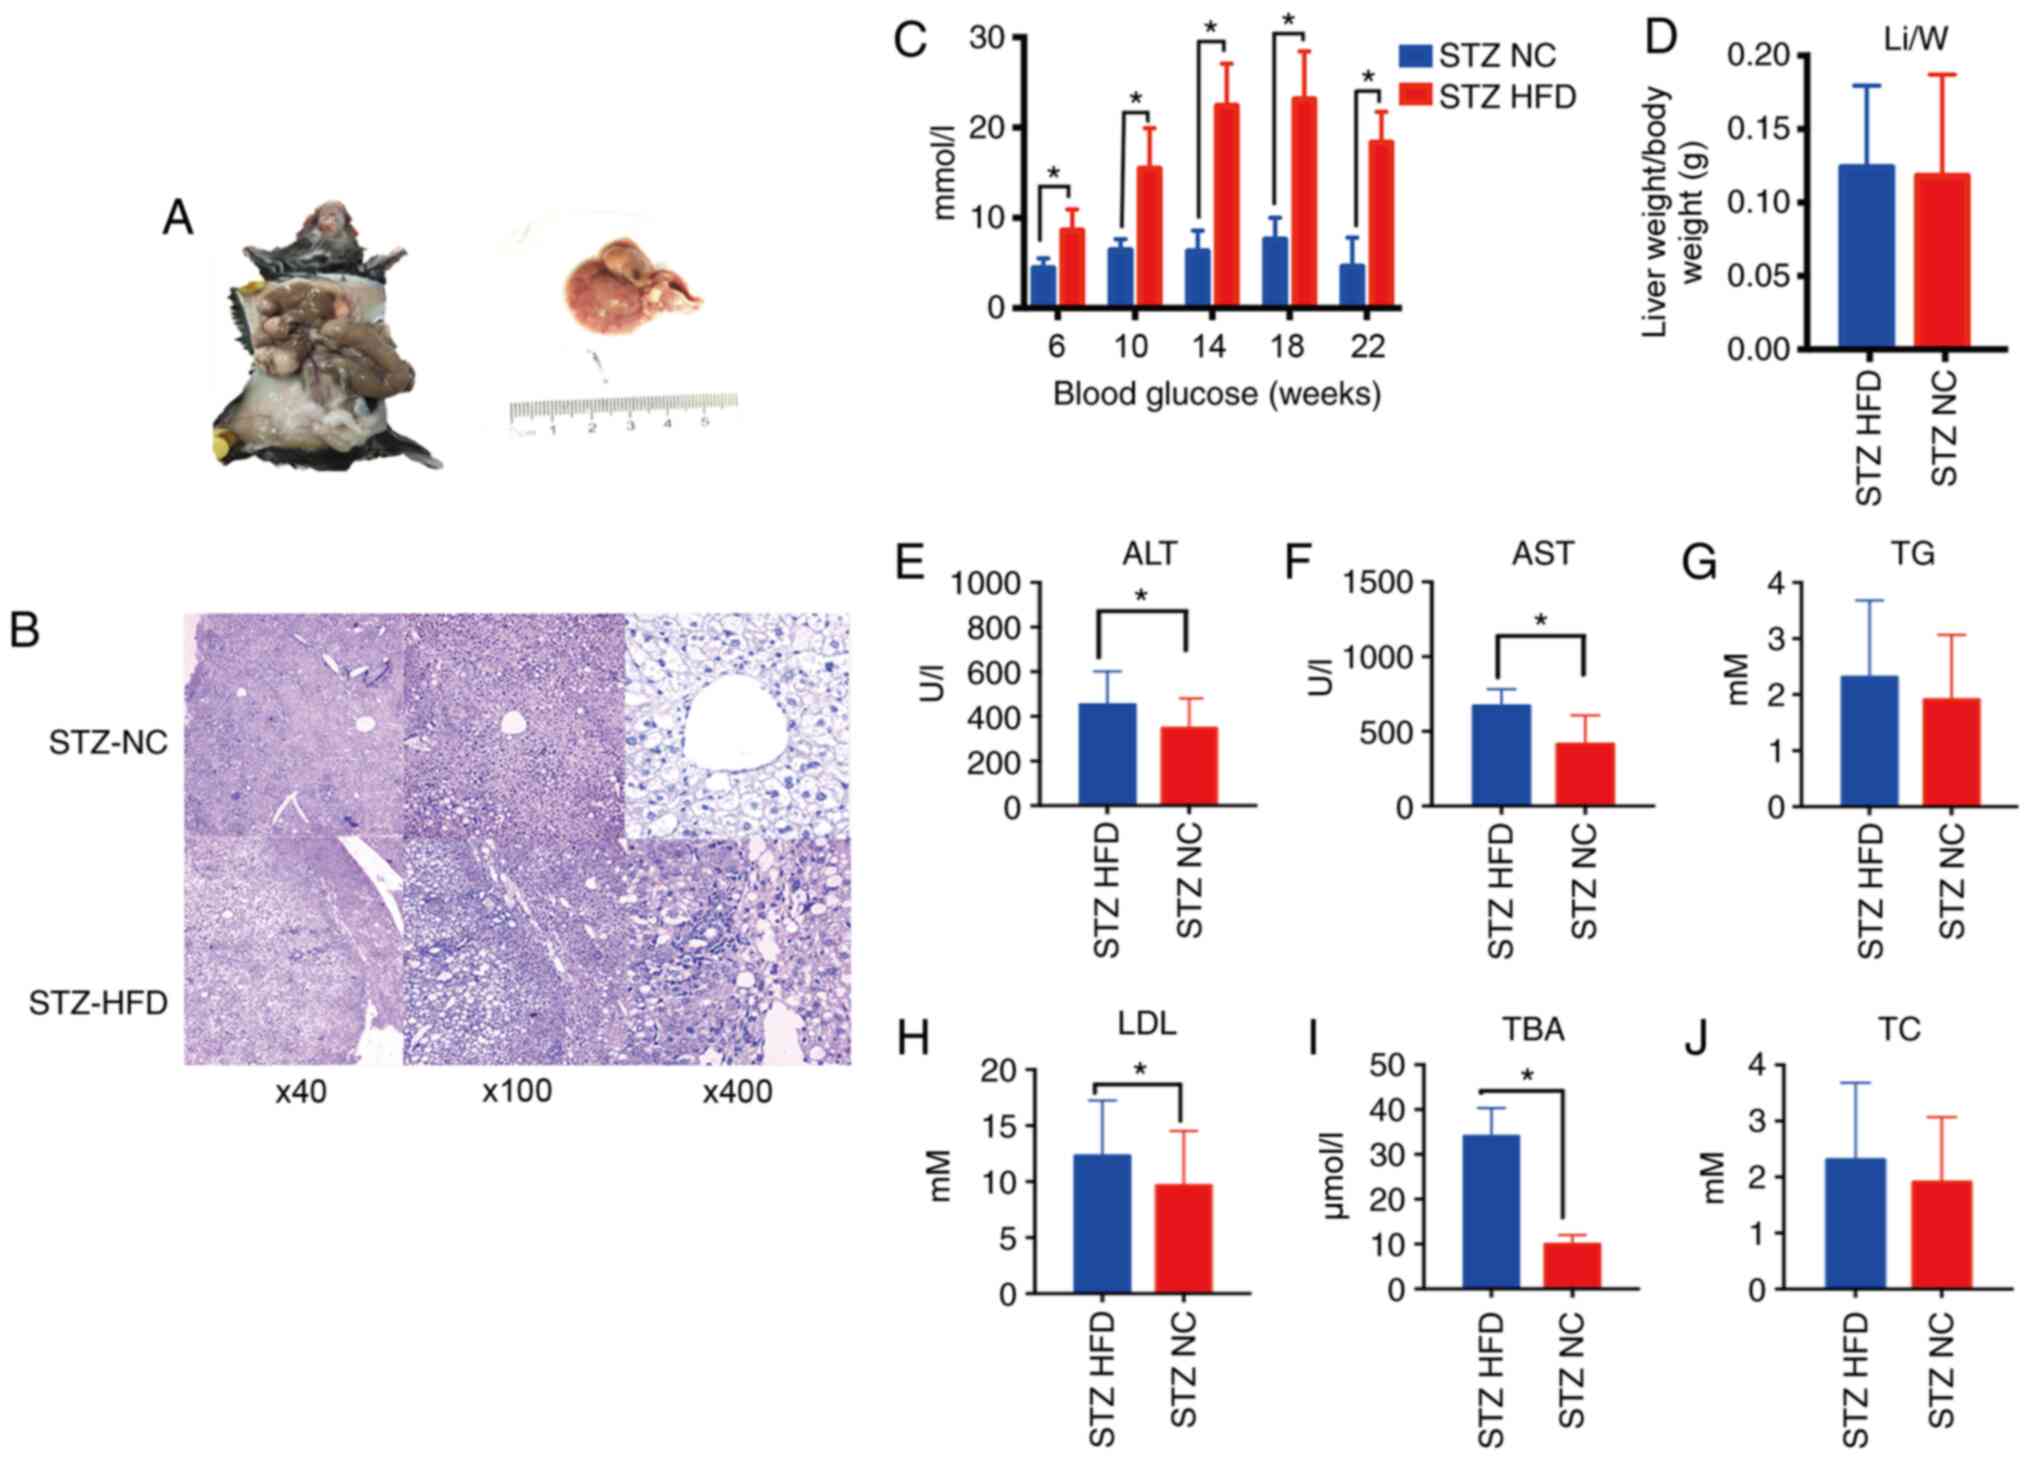 | Figure 1Pathophysiological features and
biochemical analysis of normal and NASH-HCC tissues. (A) STZ-HFD
group general view. (B) H&E was used to stain the liver
sections from mice in the STZ-HFD group (week 22) and STZ-NC group
(week 22). Original magnifications ×40, ×100 and ×400. (C) The
concentrations of blood glucose in mice after feeding the mice for
6, 10, 14, 18 and 22 weeks were measured using a blood glucose
meter. (D) The liver (g) body weight (g) determined in STZ-HFD mice
(week 22) and STZ-NC mice (week 22). (E-J) Serum levels of ALT,
AST, TG, LDL, TBA and TC were measured using a biochemical
analyzer. *P<0.05 vs. NC group. STZ, streptozotocin;
HFD, high-fat diet; NC, negative control; ALT, alanine
aminotransferase; AST, aspartate aminotransferase; TG,
triglyceride; LDL, low-density lipoprotein; TBA, serum total bile
acid; TC, total cholesterol. |
Expression levels of pro-inflammatory
factors in normal, NASH-HCC and non-cancerous matched tissues
Subsequently, the expression levels of
pro-inflammatory cytokines [interleukin (IL)-6, tumor necrosis
factor (TNF)-α and transforming growth factor (TGF)-β],
pro-inflammatory chemokines [monocyte chemoattractant protein-1
(MCP-1)], pro-inflammatory signaling intermediates [glypican 3
(GPC3), p65], collagens (collagen type 1 and collagen type 3) in
normal (STZ-NC), NASH-HCC (T) and non-cancerous matched tissues
(STZ-HFD) were measured. The results of RT-qPCR revealed that the
expression levels of IL-6, TNF-α and GPC3 were significantly
increased in both the NASH-HCC and non-cancerous matched tissues
(all P<0.05; Fig. 2A-C). p65
expression was found to be significantly down-regulated, while that
of MCP-1, collagen types 1 and 3 was markedly upregulated in the
non-cancerous matched tissues (all P<0.05; Fig. 2D, E, G and H). The results also
demonstrated that TGF-β expression was specifically upregulated in
the NASH-HCC group, whereas that of collagen type 3 was notice-ably
downregulated (both P<0.05; Fig.
2F and H).
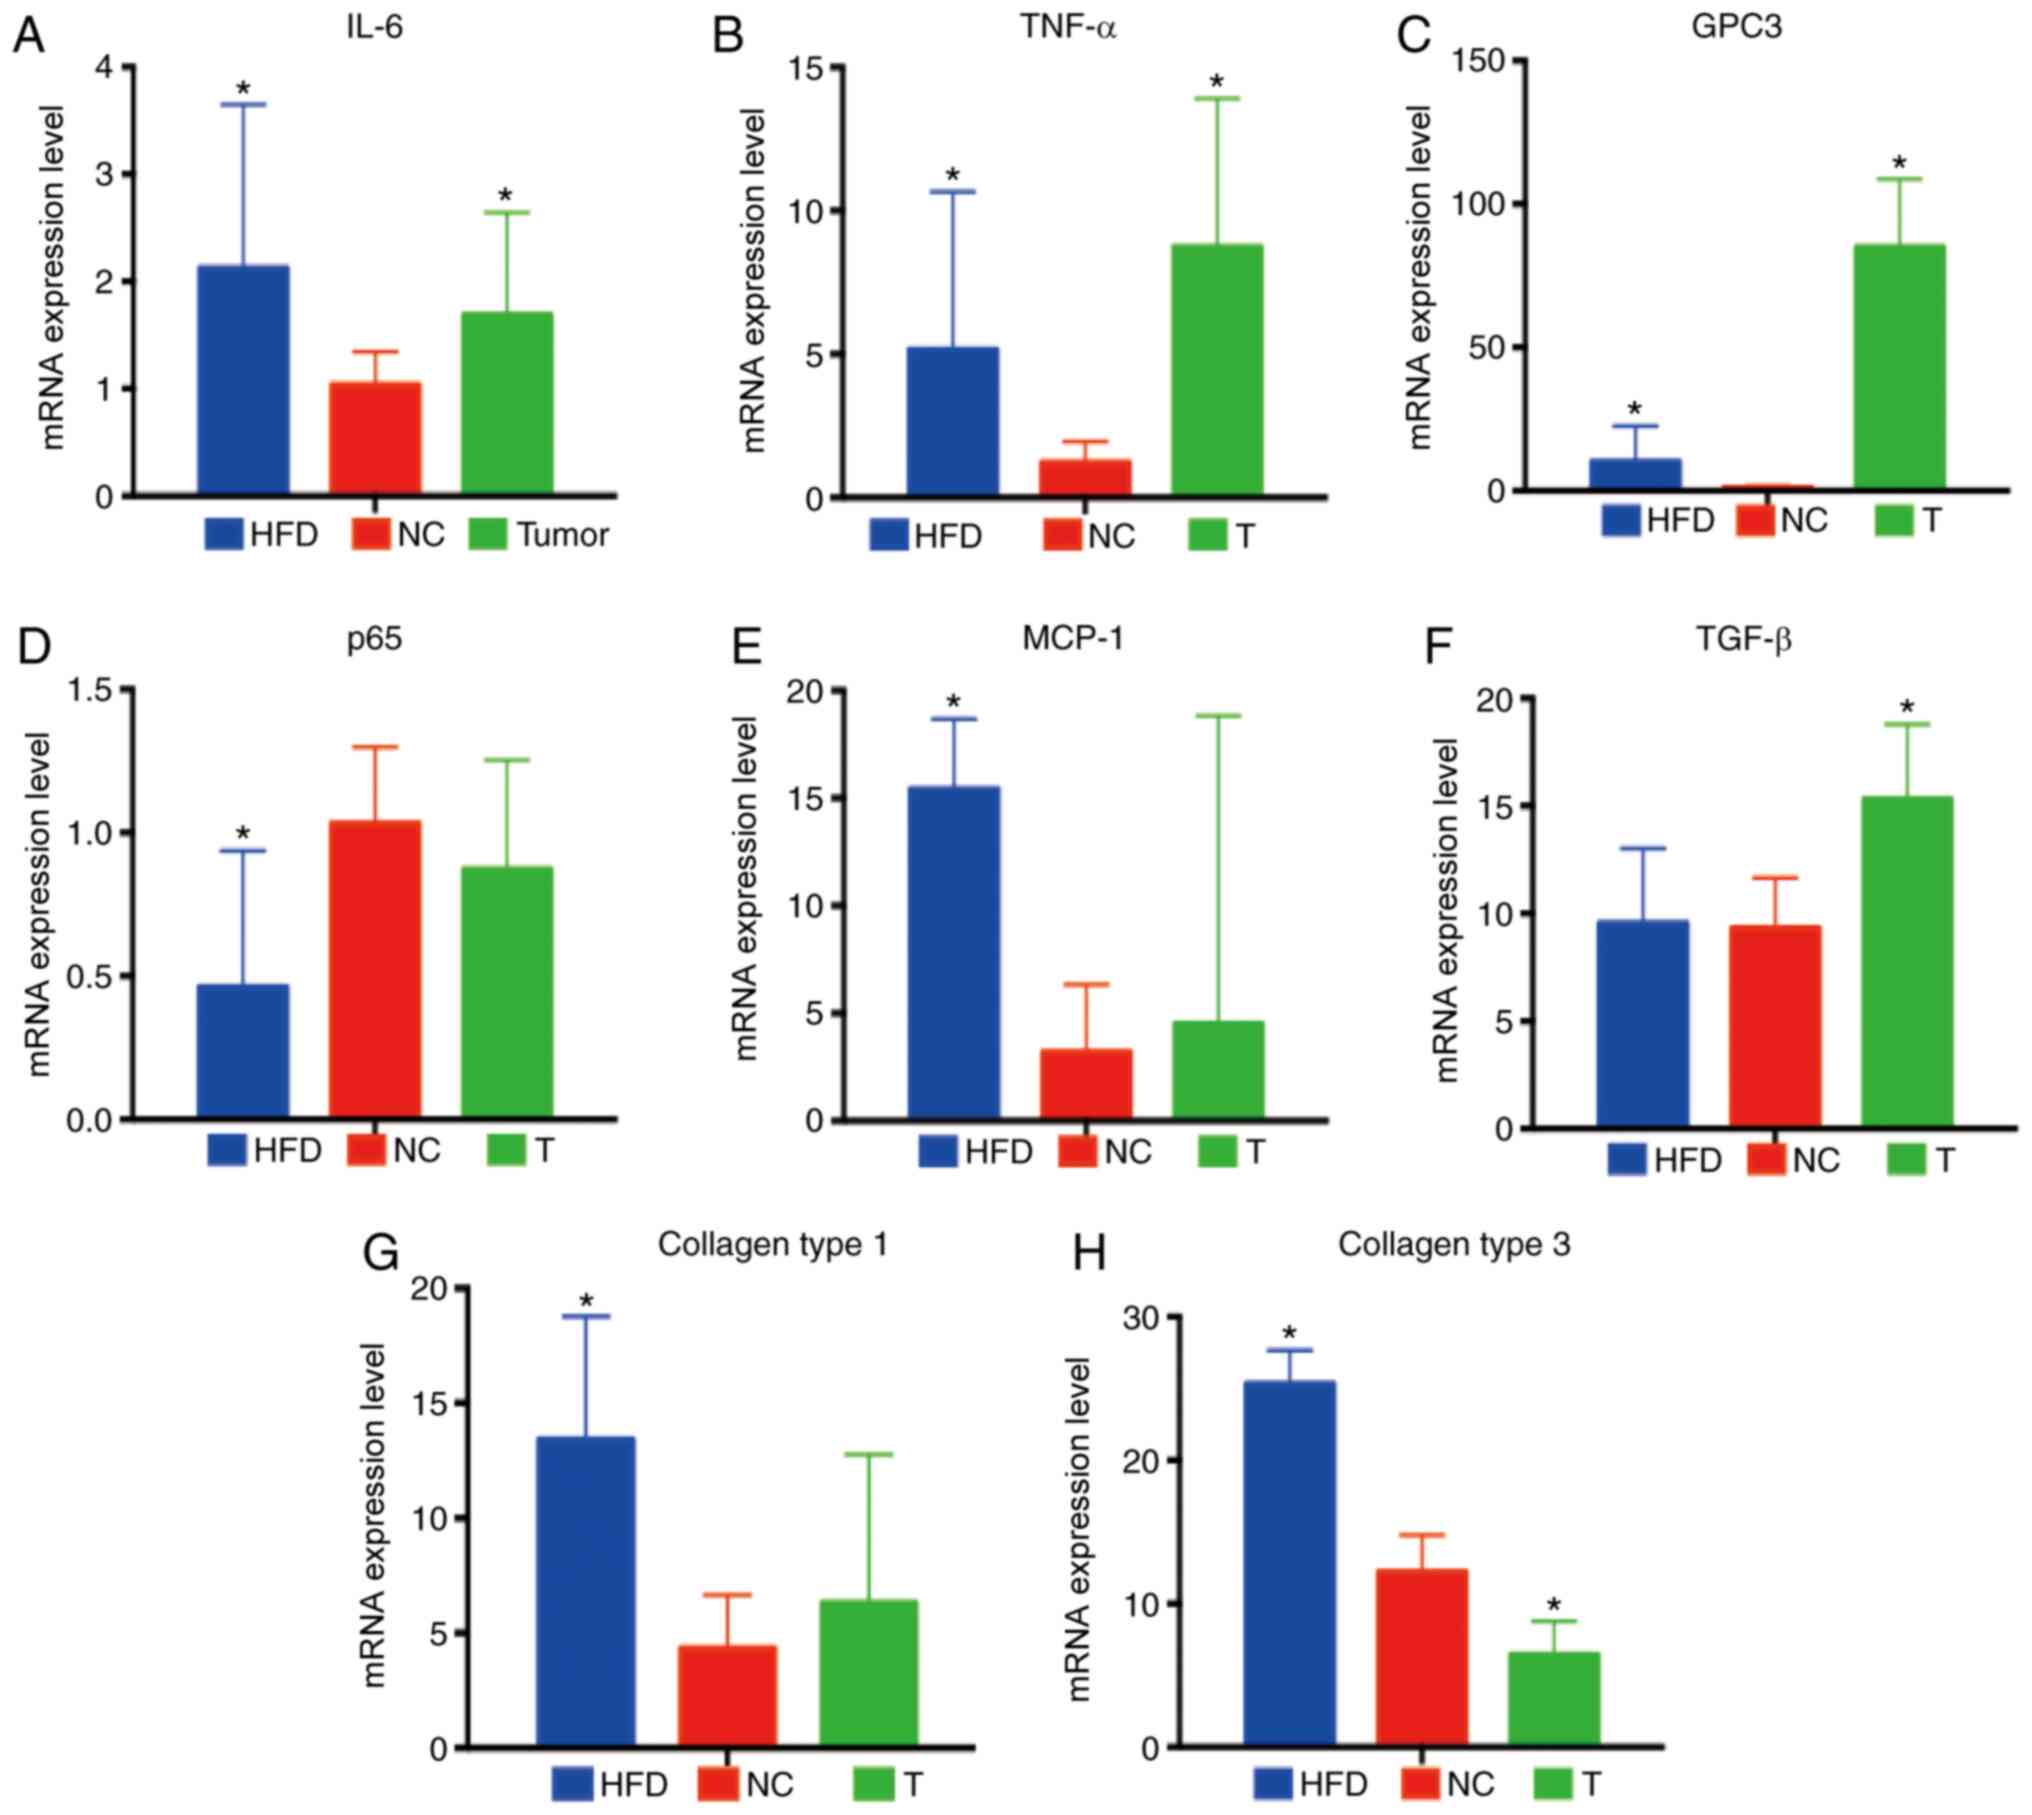 | Figure 2Inflammation-associated factors in
normal, NASH-HCC and non-cancerous matched tissues. (A-H)
Expression levels of IL-6, TNF-α, GPC3, p65, MCP-1, TGF-β, collagen
type 1, collagen type 3 in the liver and tumor tissues of STZ-HFD
mice were measured by RT-qPCR in comparison with normal liver
tissues of mice in the STZ-HFD group (week 22). Data are the means
± SD (n=3/each group). *P<0.05 vs. NC group. NASH,
non-alcoholic steatohepatitis; HCC, hepatocellular carcinoma; STZ,
streptozotocin; HFD, high-fat diet; NC, negative control. |
DEGs, molecular functions and pathways
enriched in NASH-HCC
To elucidate the molecular basis for
hepato-carcinogenesis in NASH-HCC, gene expression profiles in
NASH-HCC, non-cancerous matched tissues (NCMTs) and normal tissues
were compared by RNA-seq analysis. According to the results of PCA,
the NASH-HCC samples and normal tissues were clustered,
respectively, to themselves; therefore, the samples from different
tissues were distinguished (Fig.
3A). GO molecular functional analysis of all DGEs in the tumor
tissues was mainly related to chromosome organization, mitotic
nuclear division, chromatin modification, DNA repair, mRNA
processing and chromosome segregation (Fig. 3B). Furthermore, the heatmap
revealed the 5 most differentially upregulated and 11 most
differentially downregulated genes in NASH-HCC in comparison with
the normal tissues (Fig. 3C). To
further investigate the signaling networks enriched in NASH-HCC,
KEGG pathway analysis was conducted on the DEGs in NASH-HCC in
comparison with those in normal tissues, and it was found that the
DEGs in NASH-HCC were significantly related to the cell cycle,
mitogen-activated protein kinase (MAPK) signaling pathways,
platinum drug resistance and the Fanconi anemia pathway (Fig. 3D).
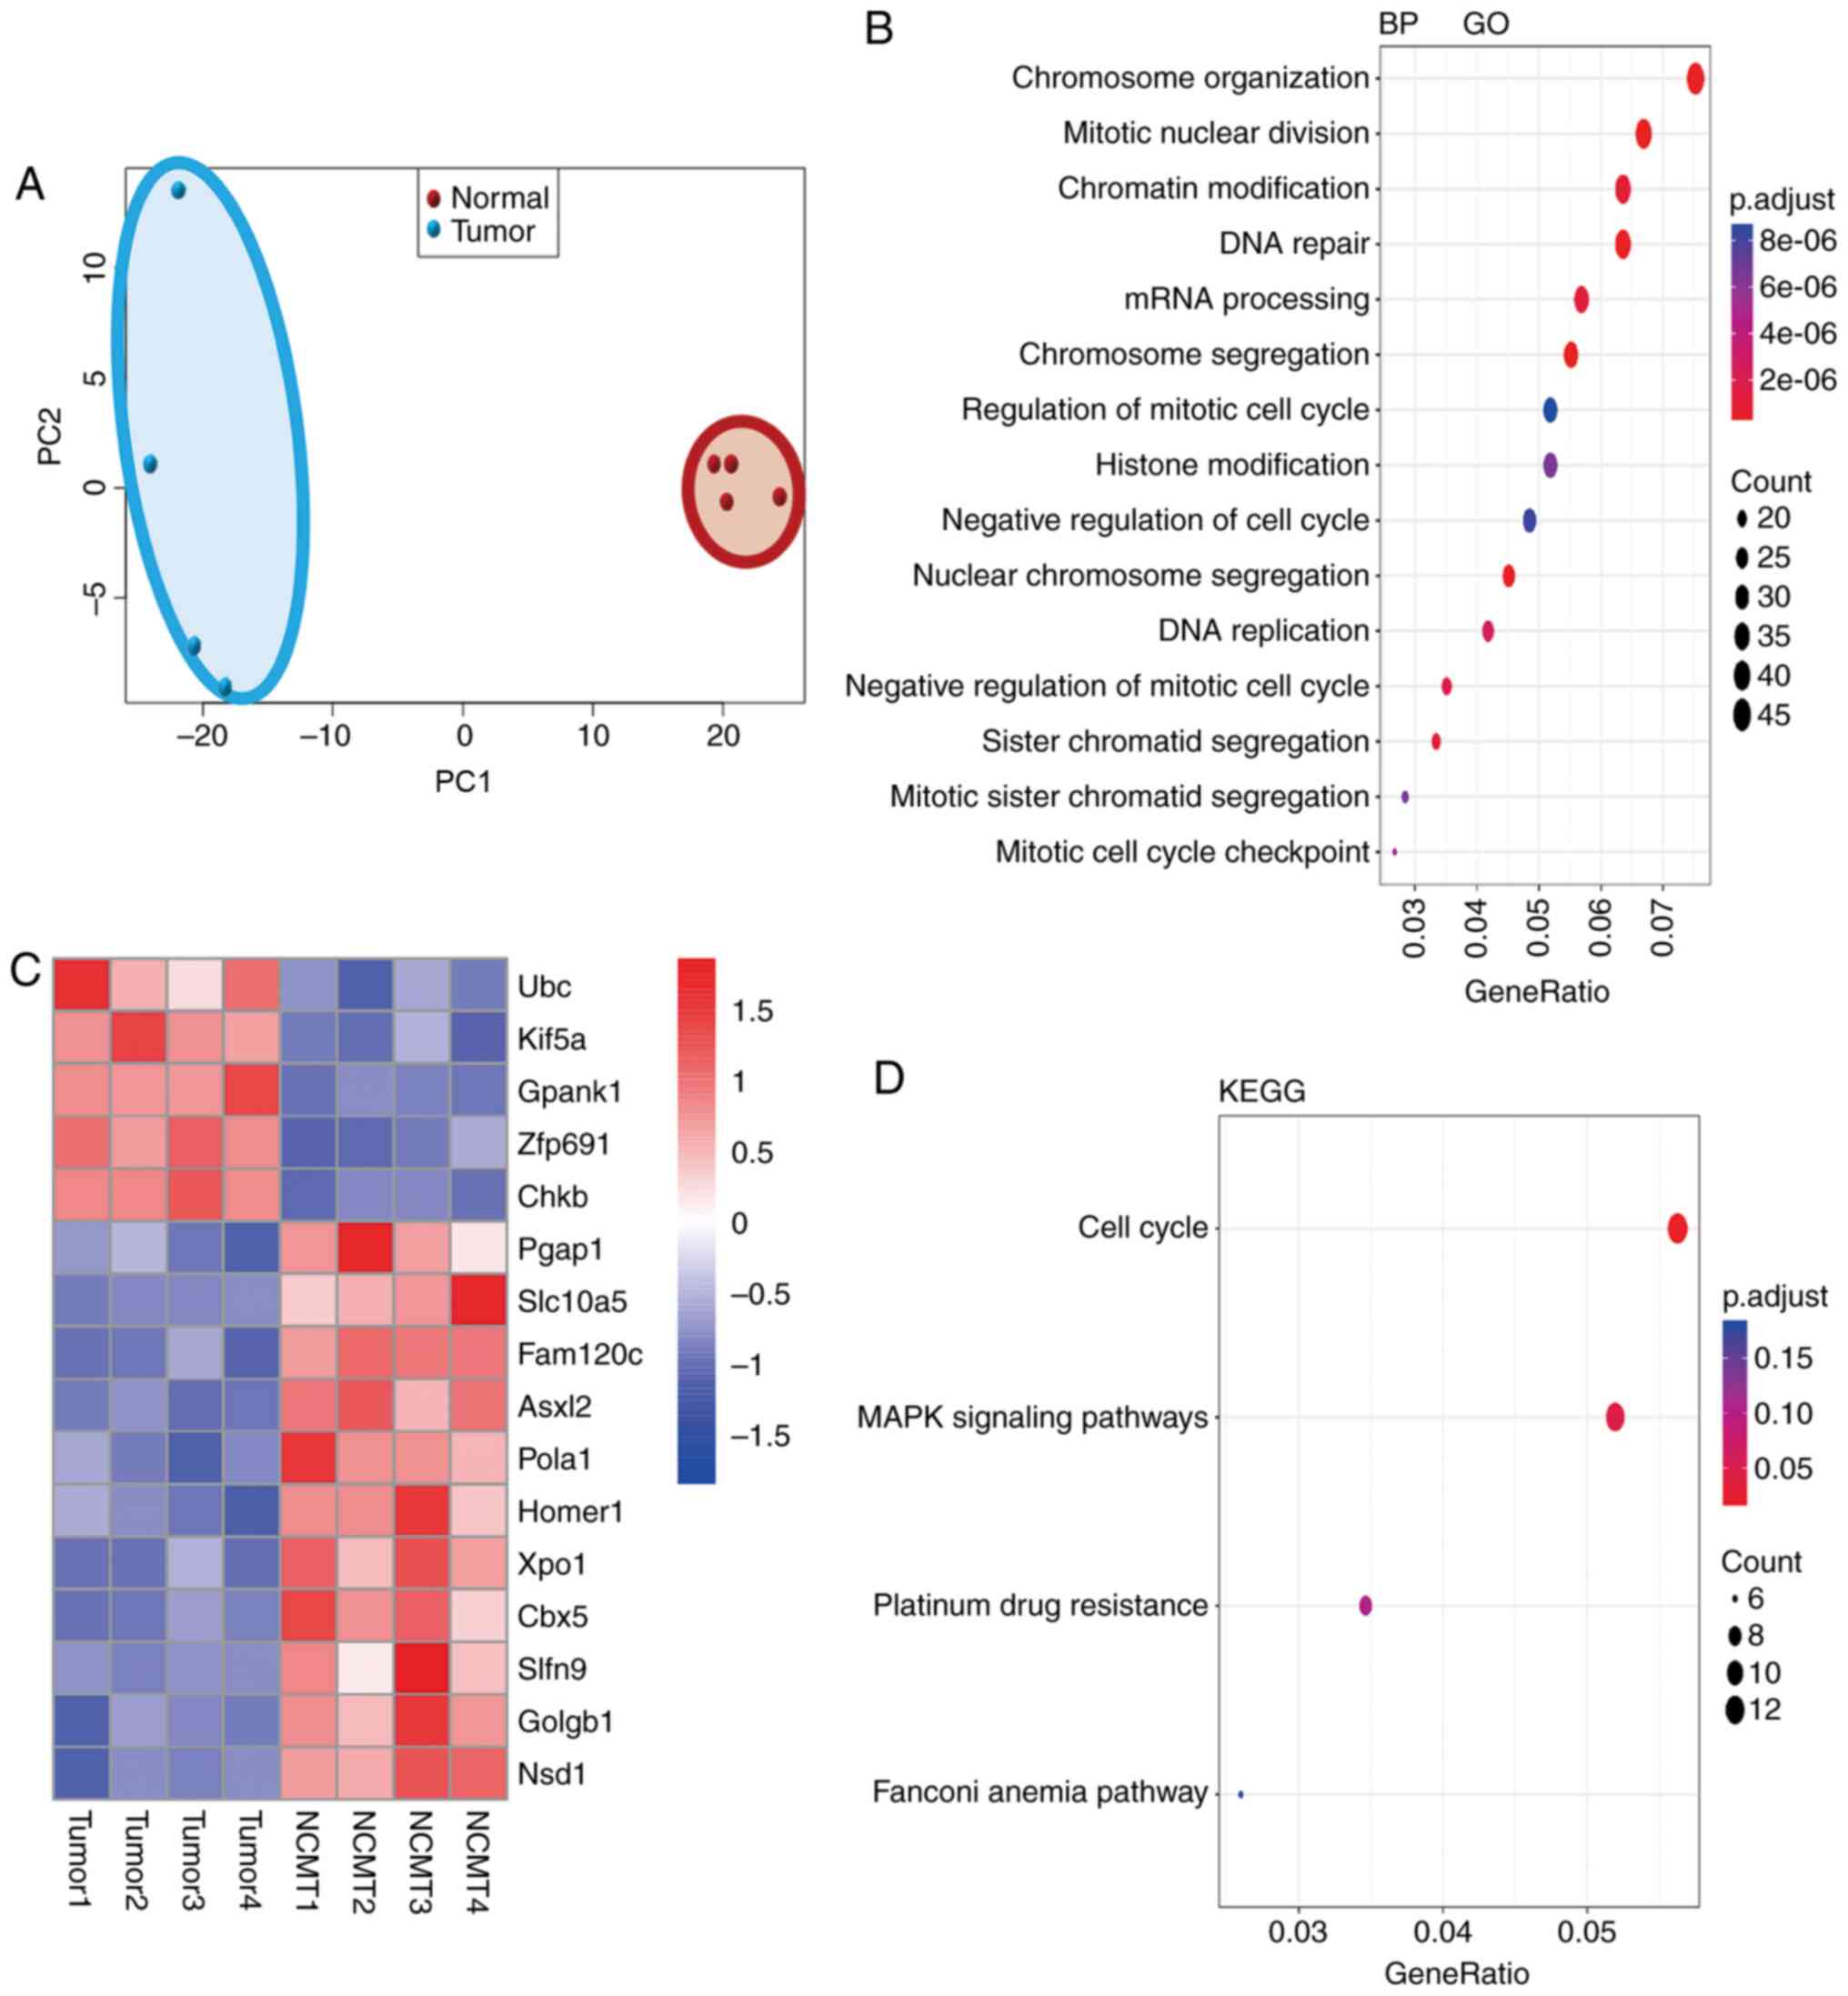 | Figure 3Aberrant gene expression, associated
molecular functions and pathways in NASH-HCC compared with normal
tissues. (A) PCA analysis sorted liver from normal (STZ-NC, n=4)
and NASH-HCC [tumor tissue (T), n=4]. Genes were plotted in 2D
visualization, indicating that samples within each group shared
more similarity. The red dots in the red circle showed the PCA
values of 4 normal samples and the blue dots in the blue circle
indicate the PCA value of 4 tumor samples. (B) Gene ontology (GO)
ana1lysis for the differentially expressed genes (DGEs) in NASH-HCC
(T), as compared with normal tissues (n=4). p.adjust is the
corrected P-value by the multiple hypothesis test. p.adjust
<2e−6 indicates significant differences. The black
dots indicate the numbers of DEGs. (C) The DEGs in NASH-HCC
(tumors, T), as compared with normal tissues (n=4). The fold change
cut-off was 1.5. (D) KEGG pathway enrichment for DEGs in NASH-HCC.
GeneRatio indicates the ratio of DEGs number in a certain pathway
to the number of all annotated genes in this pathway. p.adjust was
corrected P-value by multiple hypothesis test. p.adjust <0.05
indicated significant differences. The black dots indicate the
numbers of DEGs. NASH, non-alcoholic steatohepatitis; HCC,
hepatocellular carcinoma; STZ, streptozotocin; HFD, high-fat diet;
NC, negative control. |
It was considered that Ubc, Asxl2, HOMER1, XPO1,
cbx5 and NSD1 had a close association with cancer. Therefore, the
expression levels of Ubc, Asxl2, HOMER1, XPO1, cbx5 and NSD1 in the
normal, NASH-HCC and non-cancerous matched tissues were further
measured by RT-qPCR. The data revealed that Ubc expression was
significantly upregulated in the tumor and non-cancerous matched
tissues, as compared with normal tissues, and that the expression
of Ubc was the highest in tumor tissues (both P<0.001; Fig. 4A). The expression levels of Asxl2,
HOMER1, XPO1, cbx5 and NSD1 were significantly downregulated in the
tumor and non-cancerous matched tissues, and the expression of
Asxl2, which increased approximately 8-fold, was the most
downregulated gene in the tumor tissues (all P<0.001; Fig. 4A). Asxl2 is frequently mutated in
patients with acute myeloid leukemia. A recent study demonstrated
that the loss of Asxl2 caused myeloid malignancies in mice
(24). More importantly, Asxl2
regulates glucose and lipids (25), which are both important factors
for the development of diabetes and NASH-HCC. Therefore, the
present study wished to further investigate the role of Asxl2 in
NASH-HCC developed from diabetes.
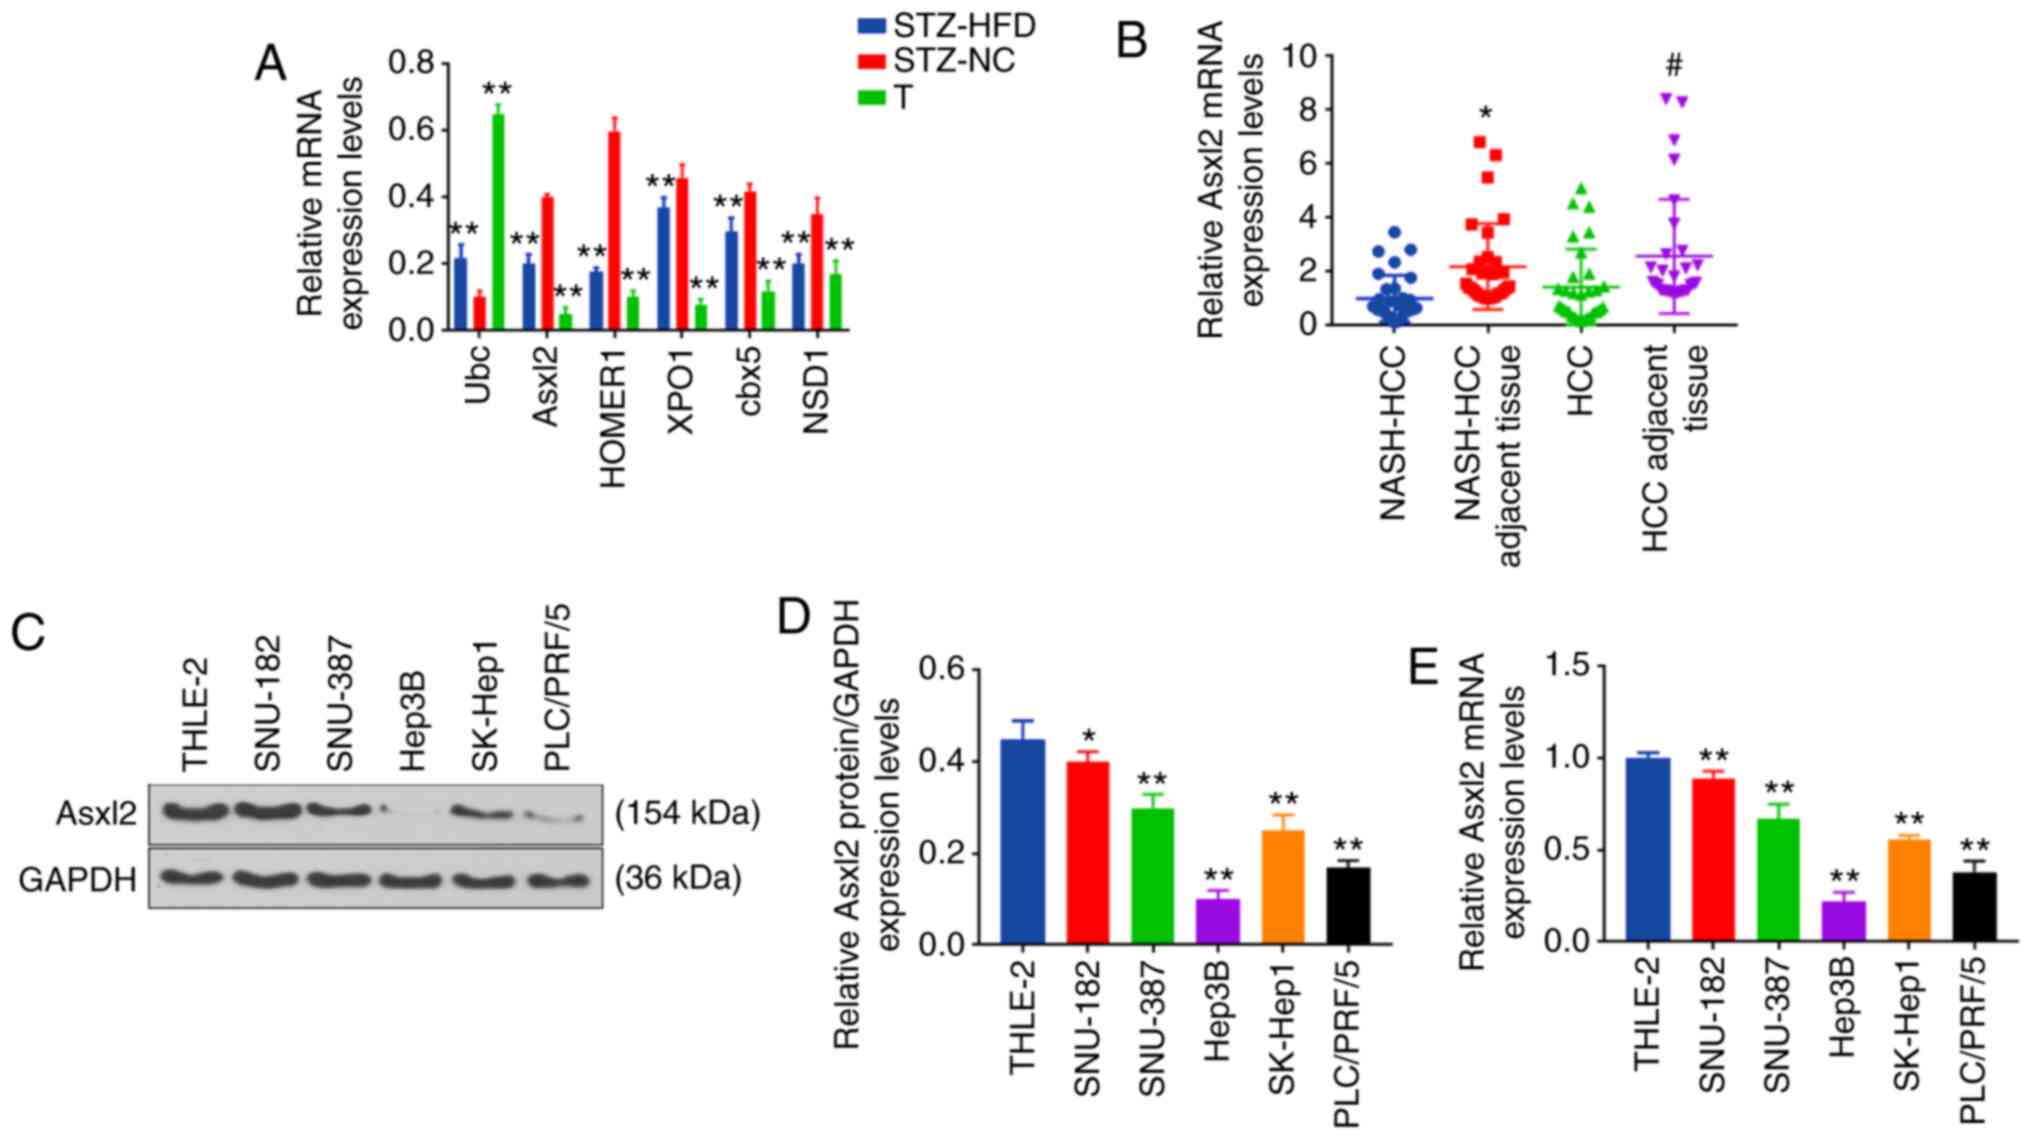 | Figure 4Representative DEGs in NASH-HCC,
other HCC and non-cancerous matched tissues from mice or humans.
(A) Expression levels of Ubc, Asxl2, HOMER1, XPO1, cbx5, NSD1 in
NASH-HCC (tumor, T), normal (STZ-NC group) and non-cancerous
matched tissues (STZ-HFD group, n=3 in each group) measured by
RT-qPCR. **P<0.001 vs. STZ-NC group. (B) Expression
of Asxl2 in human NASH-HCC, NASH-HCC adjacent tissues, HCC and HCC
adjacent tissues (n=3/each group) measured by RT-qPCR.
*P<0.05 vs. NASH-HCC. #P<0.05 vs. HCC.
(C-E) Expression of Asxl2 in human liver epithelial cell line
(THLE-2), human liver cancer cell lines (SNU-182, SNU-387, Hep3B,
SK-Hep1and PLC/PRF/5) measured by (C and D) western blot analysis
and (E) RT-qPCR. *P<0.05, **P<0.001 vs.
THLE-2 cells. NASH, non-alcoholic steatohepatitis; HCC,
hepatocellular carcinoma; STZ, streptozotocin; HFD, high-fat diet;
NC, negative control. |
Asxl2 expression is downregulated in
human NASH-HCC and HCC tissues, and HCC cell lines
The expression levels of Asxl2 in human NASH-HCC and
HCC tissues, and HCC cells were detected by RT-qPCR. It was
observed that Asxl2 expression was significantly higher in the
NASH-HCC adjacent tissues and HCC adjacent tissues than in the
NASH-HCC and HCC tissues (both P<0.001; Fig. 4B). As measured by WB analysis and
RT-qPCR, Asxl2 expression was similarly downregulated in HCC cells
(Fig. 4C-E). As the expression of
Asxl2 was relatively the highest in SNU-182 cells and the lowest in
Hep3B cells among the 5 HCC cell lines examined, the SNU-182 and
Hep3B cells were selected for use in further experiments.
Asxl2 regulates the growth, migration and
invasion of SNU-182 and Hep3B cells
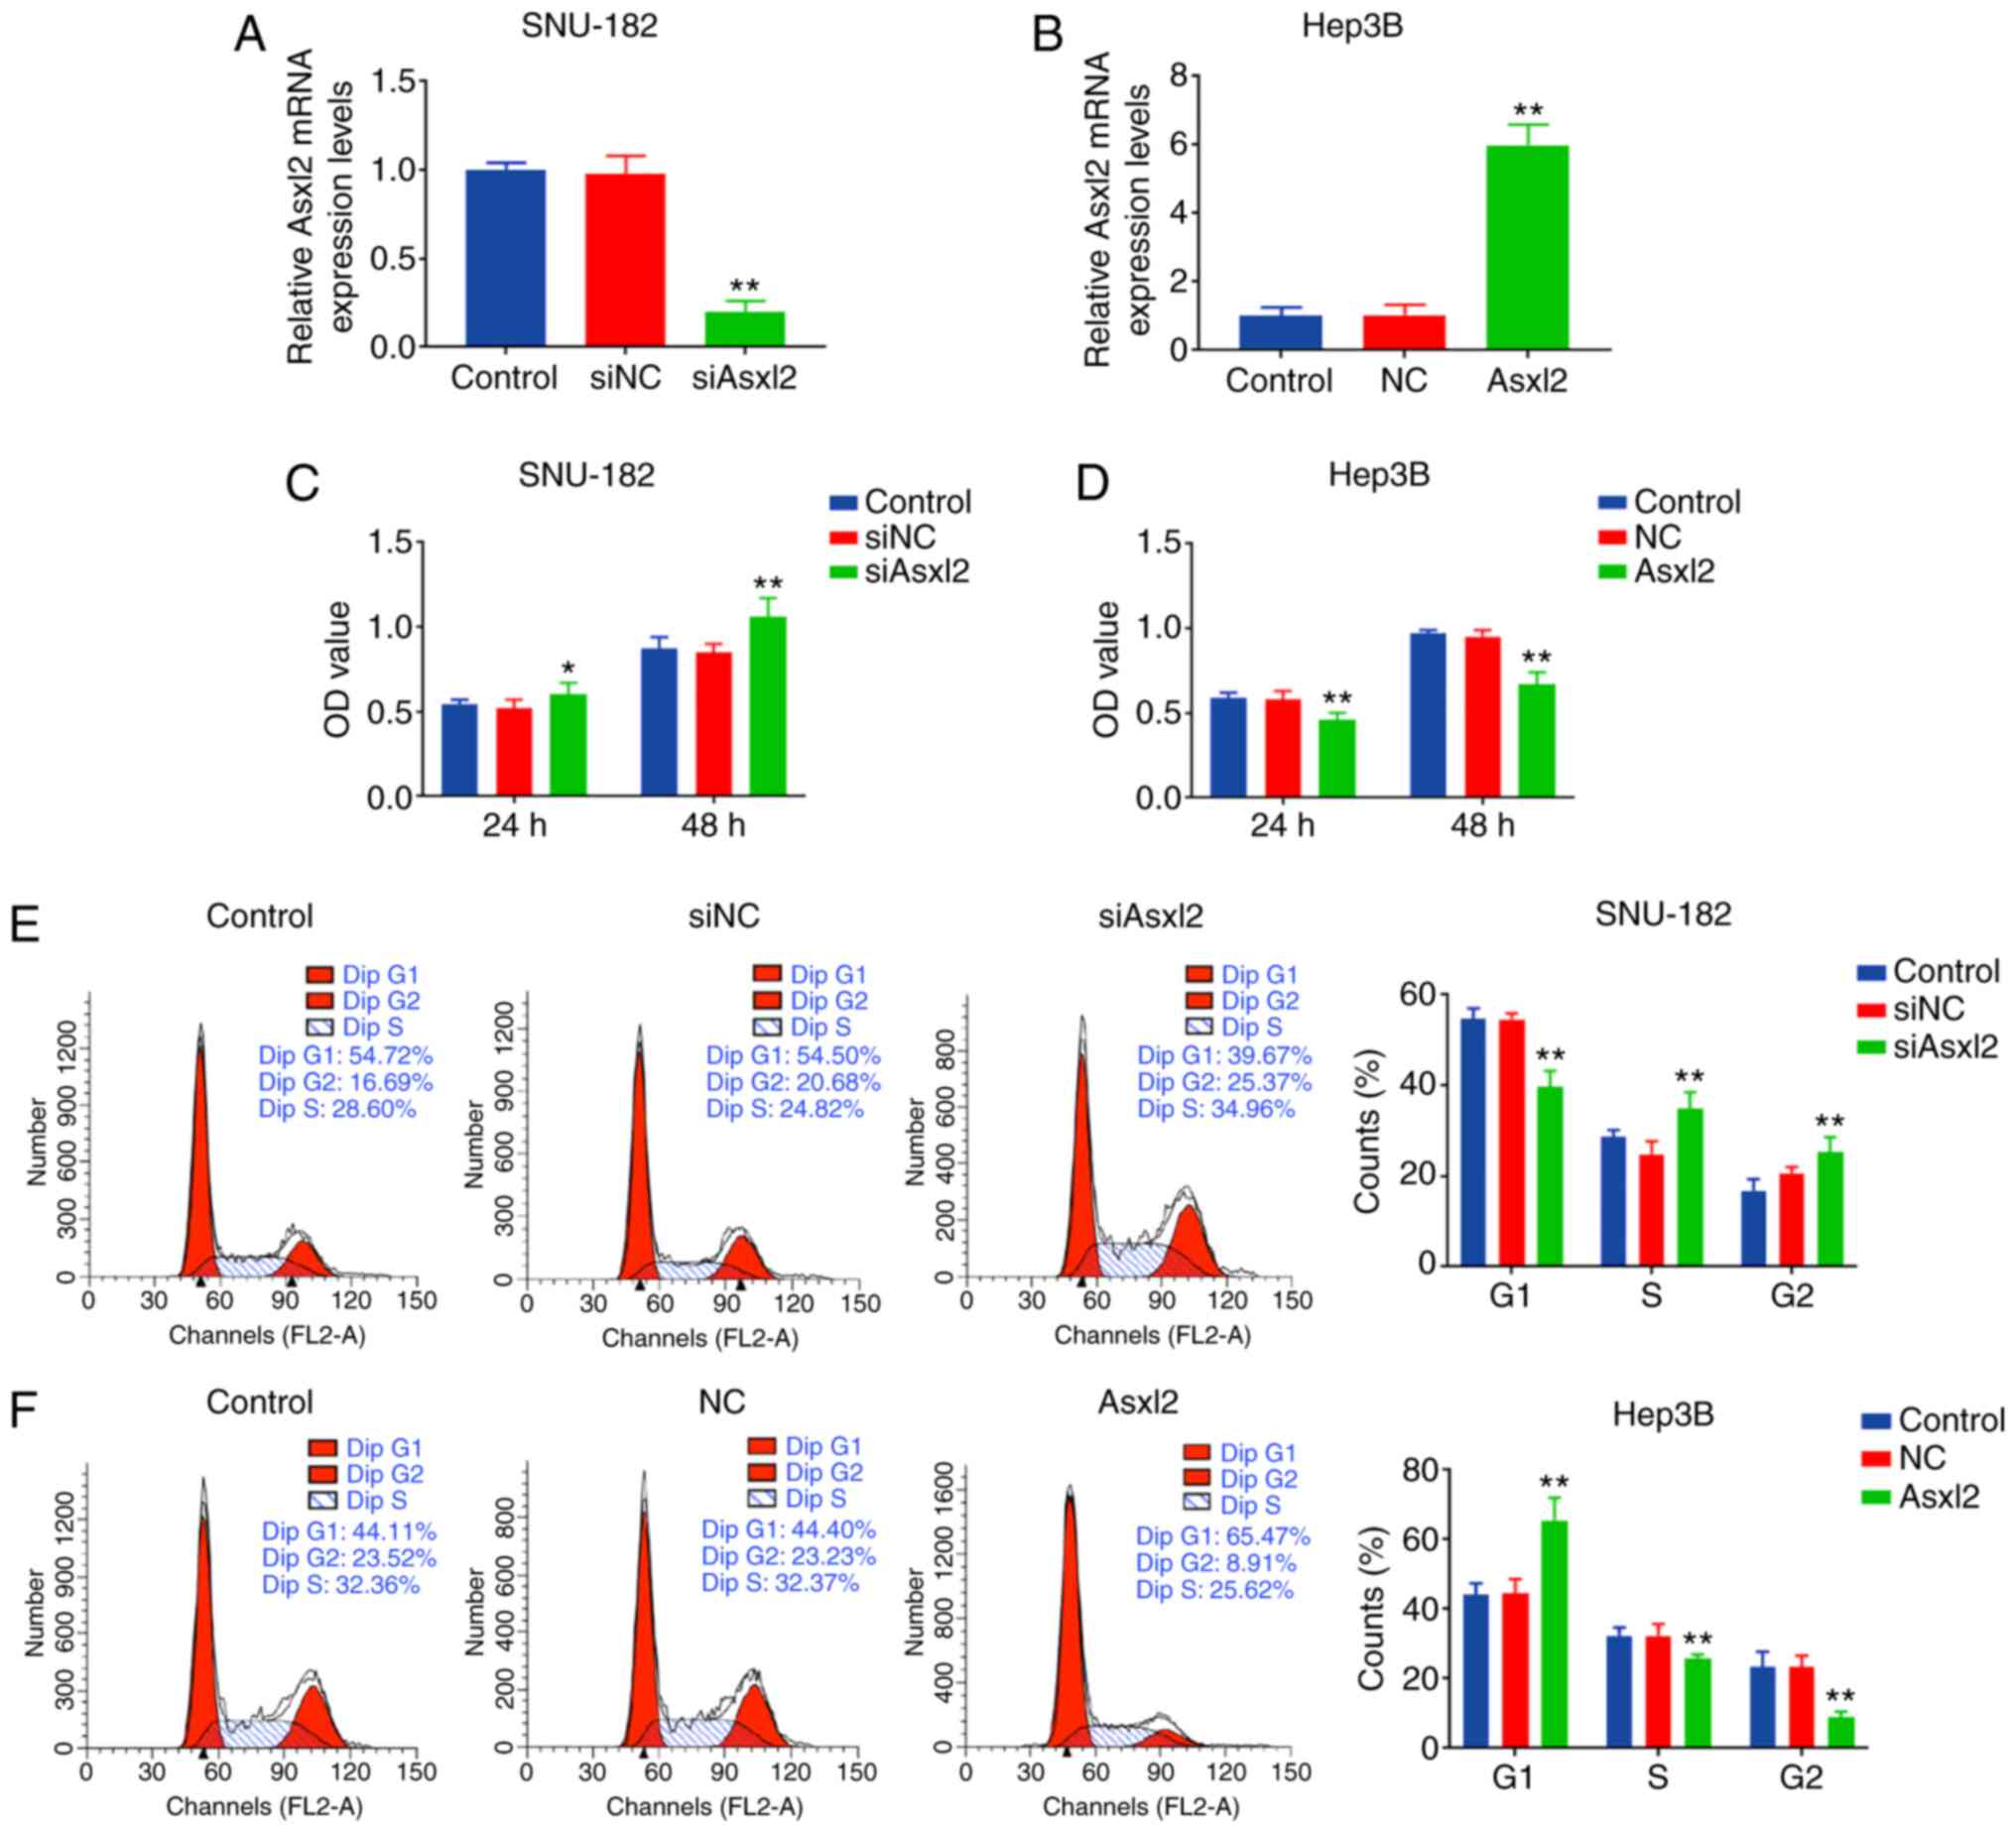
In order to investigate the role of Asxl2 in SNU-182
and Hep3B cells, overexpression plasmids of siAsxl2 and Asxl2 were
respectively transfected into SNU-182 and Hep3B cells, and it was
observed that Asxl2 expression was significantly downregulated in
the SNU-182 cells by siAsxl2, but was markedly upregulated in the
Hep3B cells by Asxl2 overexpression (both P<0.001; Fig. 5A and B). The proliferation of the
SNU-182 cells was promoted following transfection with siAsxl2,
while that of the Hep3B cells was suppressed by Asxl2
overexpression (both P<0.001 at 48 h; Fig. 5C and D). CCK-8 assays also
revealed that Asxl2 knockdown accelerated the cell cycle with an
increase in the number of cells in the S/G2 phase, and Asxl2
overexpression induced cell cycle arrest at the G1 phase (all
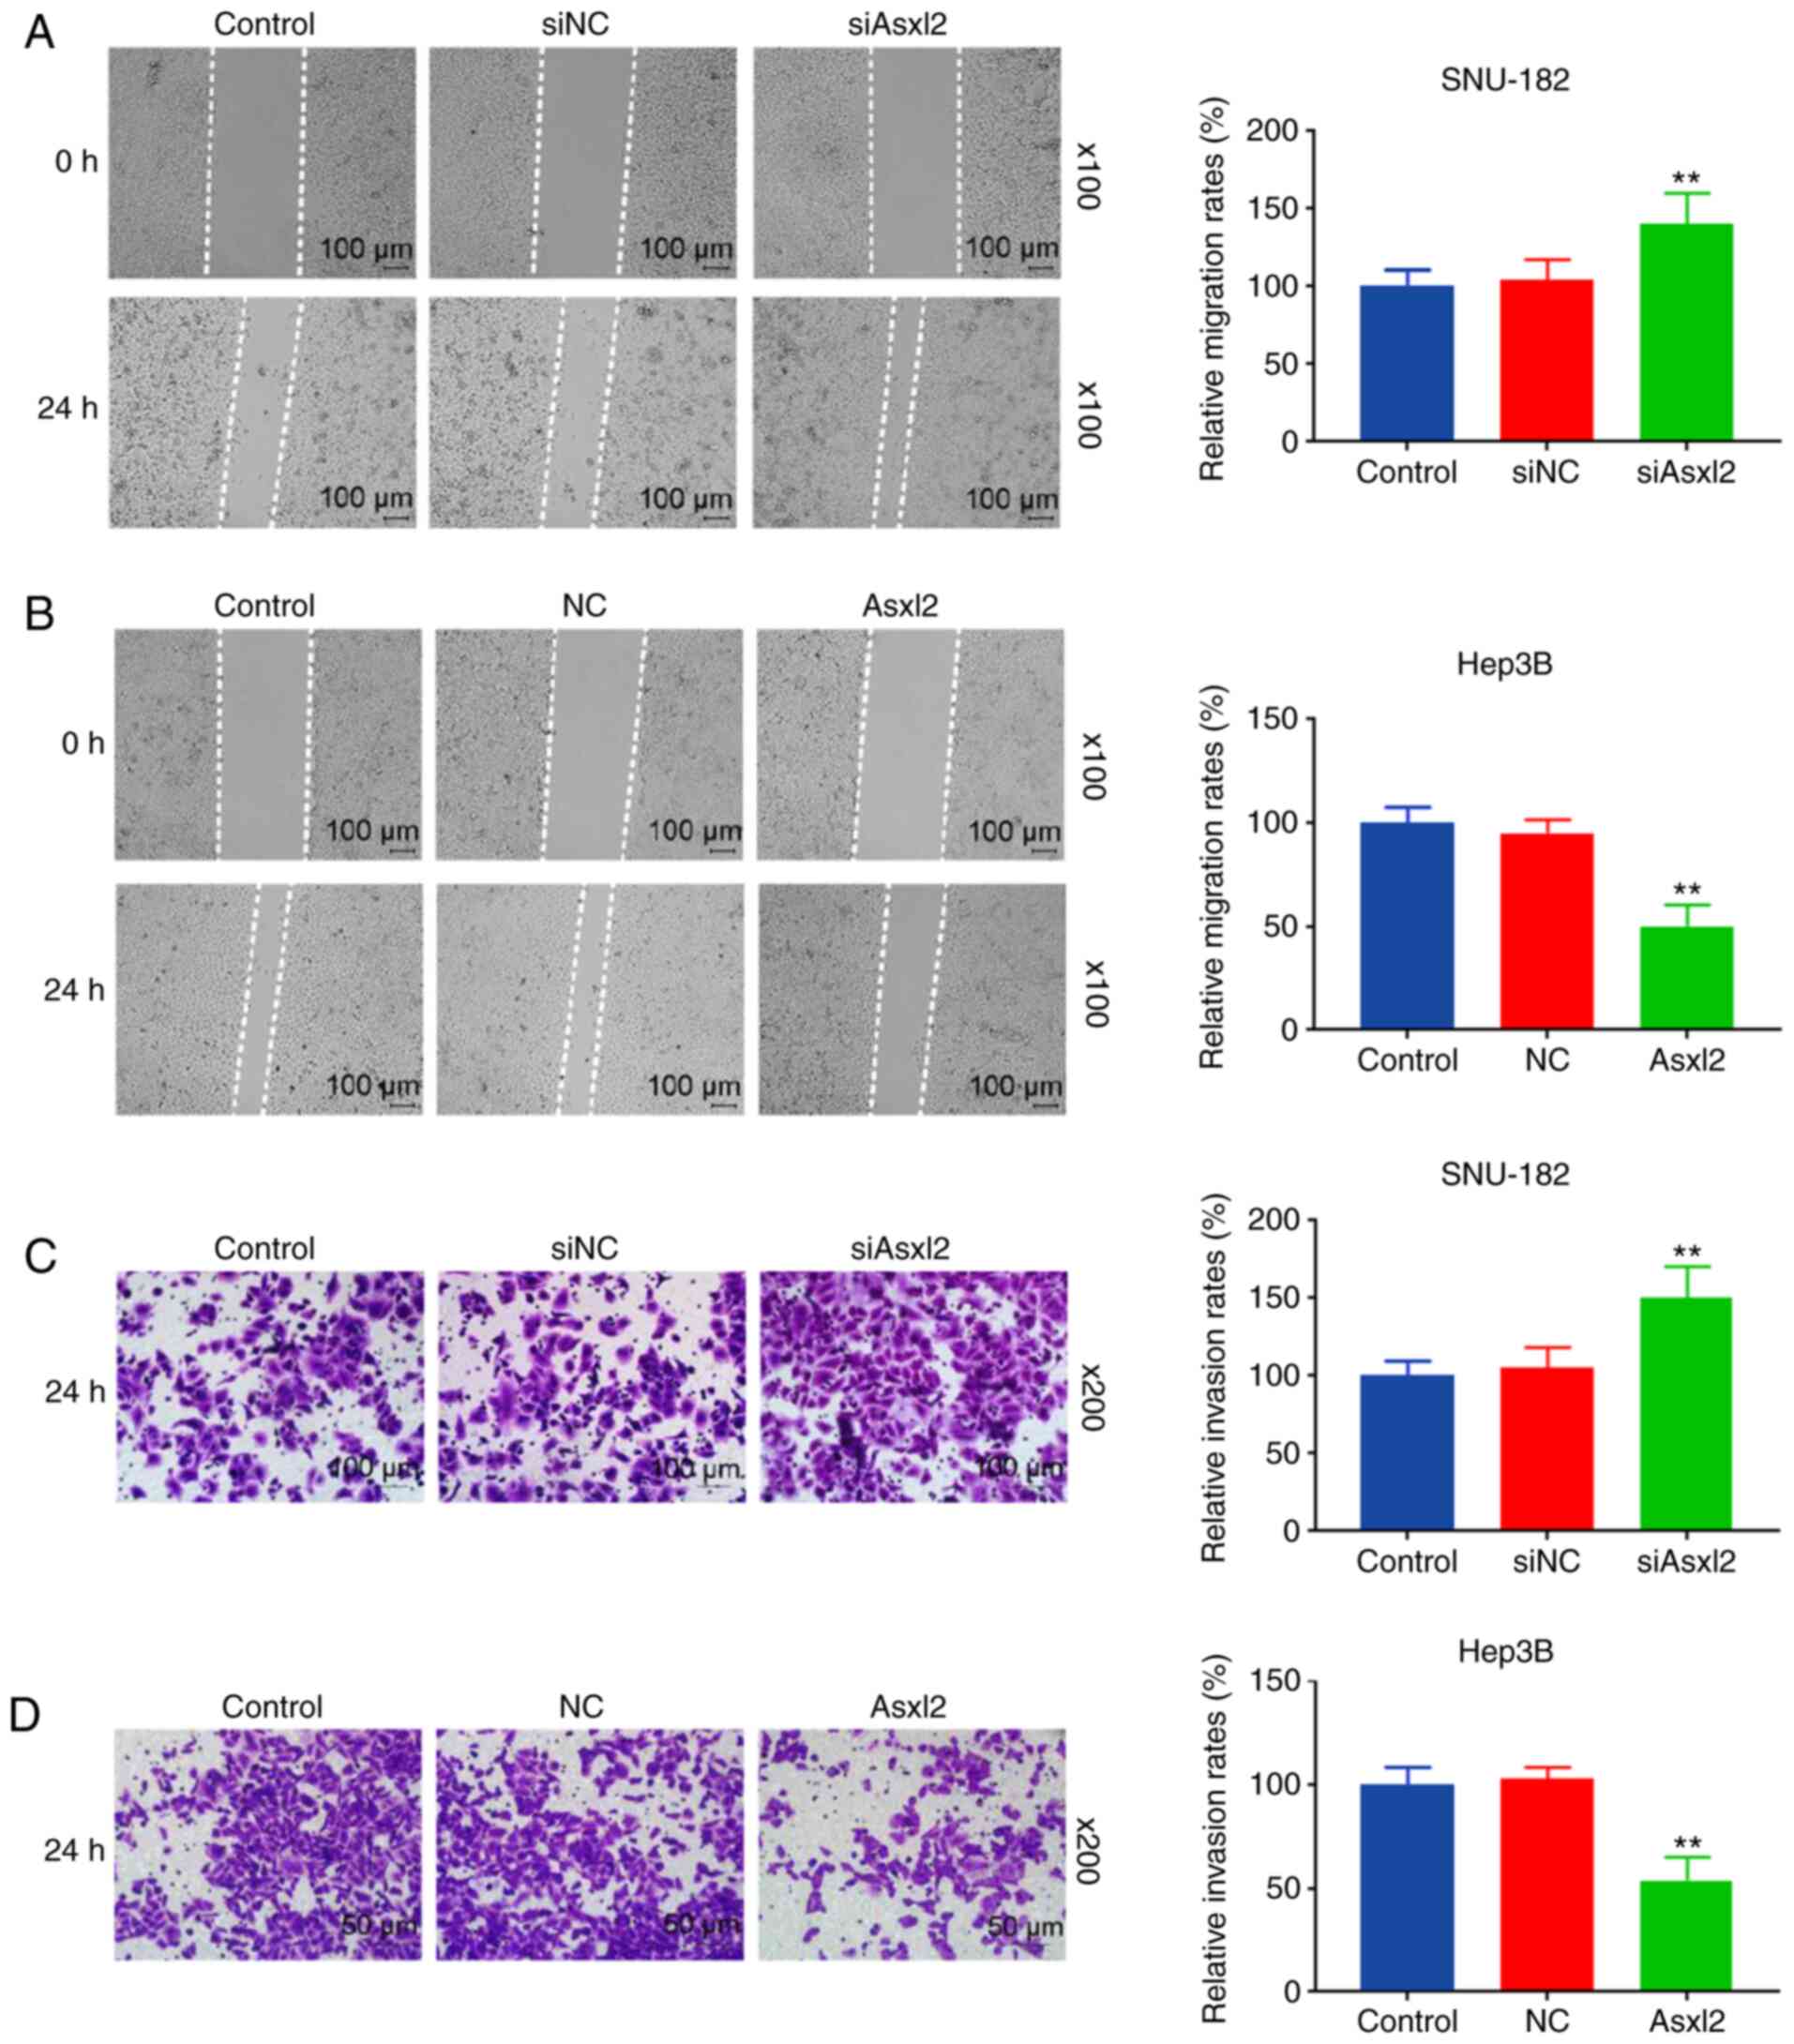
P<0.001; Fig. 5E and F). In
addition, Asxl2 knockdown promoted the migration and invasion of
the SNU-182 cells (both P<0.001; Fig. 6A and C), while Asxl2
overexpression suppressed the migration and invasion of Hep3B cells
(both P<0.001; Fig. 6B and D).
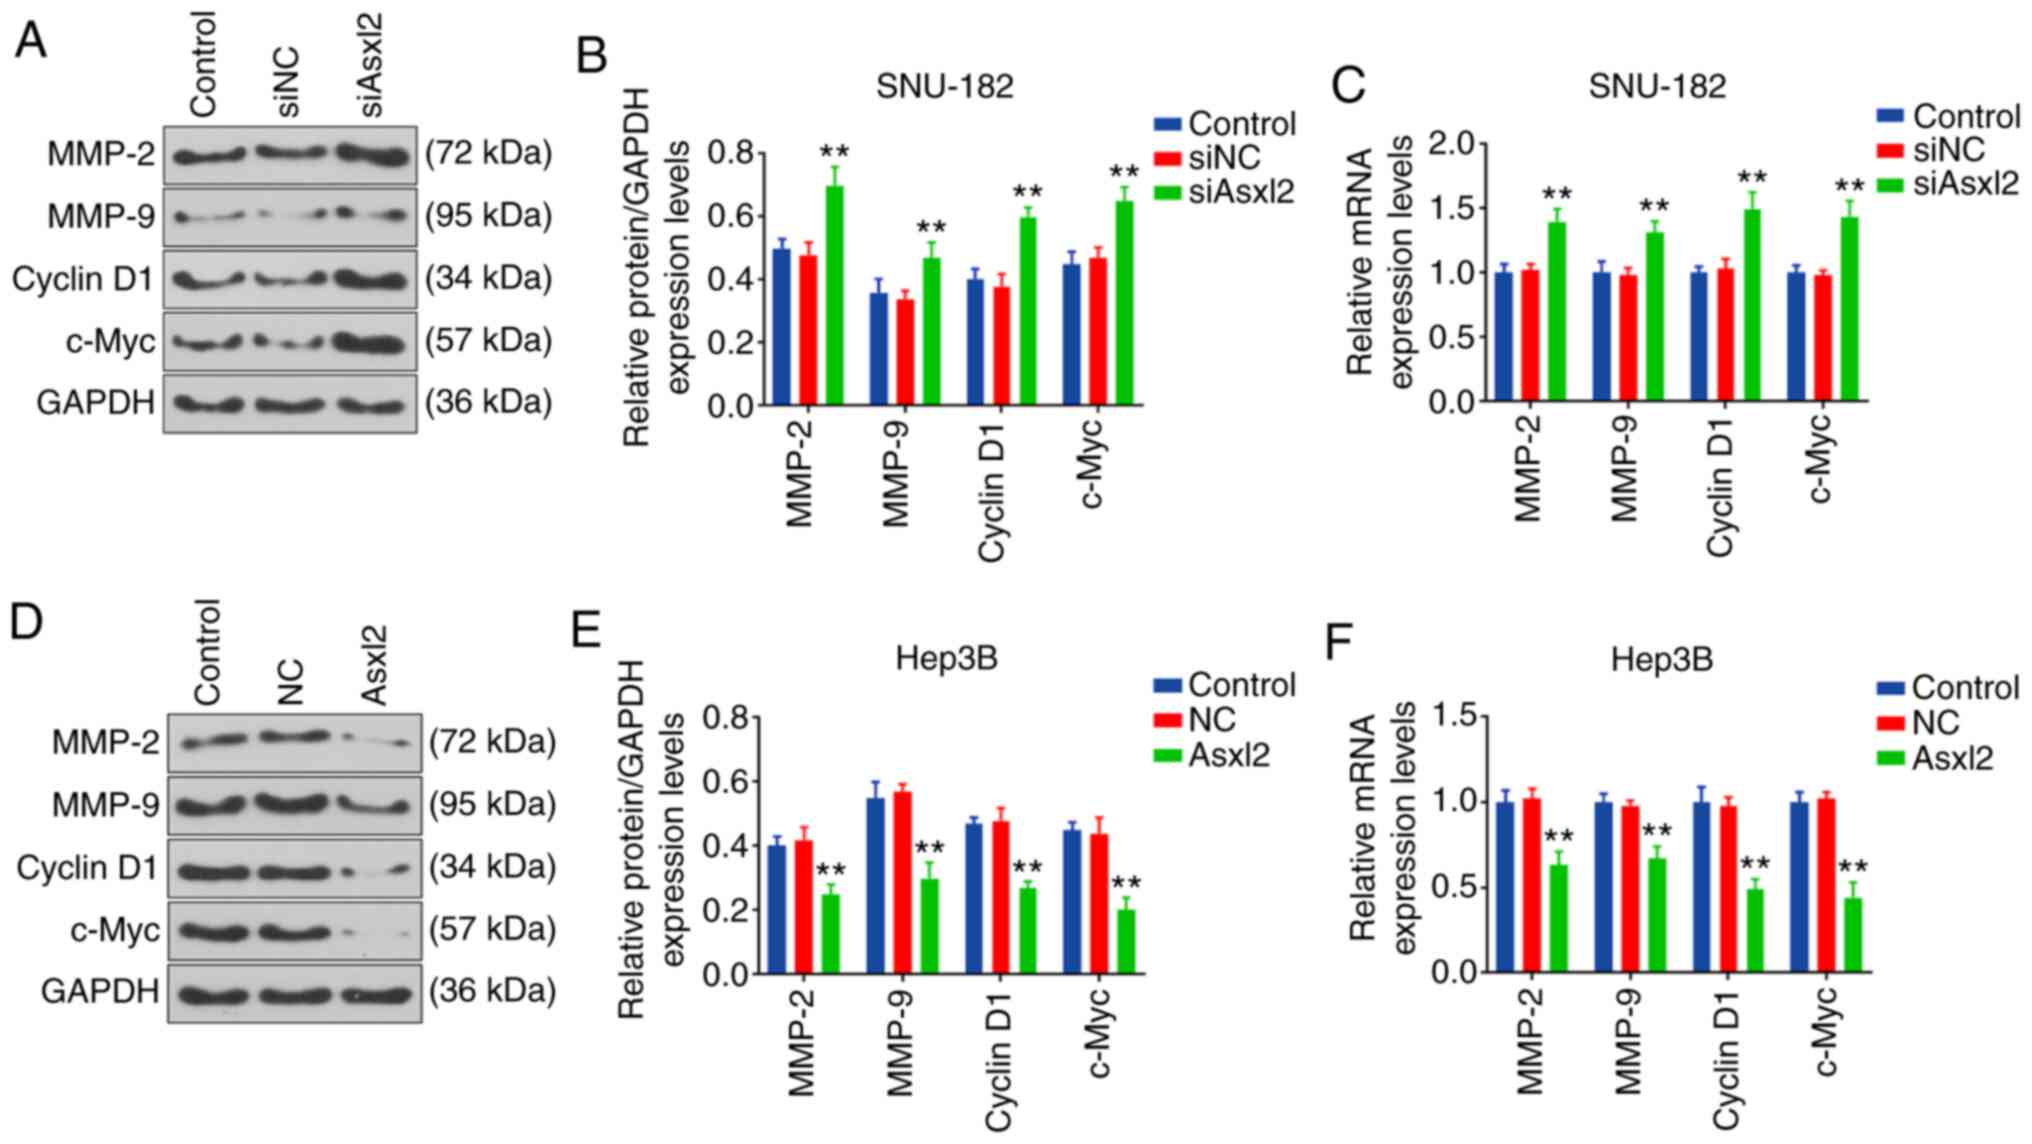
Moreover, the expression levels of proteins related to cell
metastasis and the cell cycle in SNU-182 and Hep-3B cells were
measured by WB analysis and RT-qPCR. The results revealed that the
expression levels of cell cycle- related proteins were promoted by
Asxl2 knockdown, whereas they were suppressed by Asxl2
overexpression (all P<0.001; Fig.
7).
Discussion
There is mounting evidence to indicate that diabetes
is closely related to NASH-HCC. However, little is known about the
molecular biological mechanisms of NASH-HCC developed from
diabetes. In the present study, a mouse model of NASH-HCC was
established and a series of DEGs were identified. These DEGs were
found mainly related to the molecular functions of chromosome
organization, mitotic nuclear division and chromatin modification,
and pathways of the cell cycle and MAPK. Of note, among these DEGs,
Asxl2, which is closely related to glucose and lipid metabolism,
was significantly downregulated in NASH-HCC, and regulated the
growth, migration and invasion of human HCC cells.
In the present study, NASH-HCC was first induced in
ApoE−/− mice by injecting STZ and feeding the mice a
HFD, as previously described (26). It was found that the concentration
of blood glucose was significantly increased in the STZ-HFD mice,
which was consistent with the results of a previous study showing
that STZ increased blood glucose (27). The serum levels of the hepatic
enzymes, ALT and AST, were measured to indicate liver cell damage
(28), and the serum level of TBA
was detected as an index of character cholestasis (29). Lipid profiles of TG, TC and LDL
accumulations are involved in the pathogenesis of hepatotoxicity
(30). Therefore, the present
study measured these hepatotoxicity-related parameters, and it was
found that mice in the STZ-HFD group showed significant liver
injury similar to the findings of a previous study, in which the
levels of AST, ALT and ALP were found increased in rats with
STZ-induced diabetes (31).
The expression levels of pro-inflammatory factors
(32,33) were also detected in liver tissues
and tumor tissues from mice in the STZ-HFD group, and it was found
that the expression levels of IL-6, TNF-α, GPC3 and TGF-β were
upregulated in the tumor tissues. Notably, GPC3, a heparan sulfate
proteoglycan binding to the cell membrane by
glycosylphosphatidylinositol, is hardly expressed in adults, except
in the placenta. However, GPC3 expression is specifically
upregulated in a number of tumors, including in HCC and is used in
immunotherapy (34,35). Notably, it was also found that the
collagen type 3 level was upregulated in the liver tissues of mice
in the STZ-HFD group, but was decreased in the tumor tissues. Thus,
it was considered that the pro-inflammatory response in liver
tissues and tumor tissues differed from that of the mice in the
STZ-HFD group.
The present study also performed transcriptomic
analysis to systematically analyze the differences between normal
liver tissues and NASH-HCC tissues. The data revealed significant
differences between transcriptomic patterns of normal liver and
NASH-HCC. The DGEs were mainly related to chromosome organization,
mitotic nuclear division, chromatin modification, DNA repair, mRNA
processing and chromo-some segregation. In addition, these genes
mainly participated in cell cycle, MAPK signaling pathways,
platinum drug resistance and the Fanconi anemia pathway. Notably,
the cell cycle, MAPK signaling pathways and platinum drug
resistance are all closely related to tumor development (36).
The 5 most upregulated genes and the 11 most
downregulated genes were identified in NASH-HCC in comparison with
normal tissues. Genes, such as Ubc (37), XPO1 (38) and CBX5 have been studied in other
tumors (39). HOMER1, which is
downregulated in HBV-induced HCC (40), was also identified in the present
study. Among these DEGs, Asxl2 expression was the most
downregulated in the tumor tissues and it was similarly
downregulated in human HCC cell lines. Asxl2 encodes a member of a
family of epigenetic regulators involved in the assembly of
transcription factors at specific genomic loci. A previous study
indicated that Asxl2 was necessary for maintaining steady-state
hematopoiesis (41). ASXL2
interacts with peroxisome proliferator-activated receptor (PPAR)γ
and PPAR-activated receptor during adipogenesis (42). Of note, a previous study
demonstrated that mice with Asxl2 knockout easily develop insulin
resistance and lipodystrophy, and fail to respond to a HFD
(25), suggesting that Asxl2 may
play a role in lipid metabolic comorbidities and diabetes. In the
present study, functional experiments revealed that Asxl2 regulated
the proliferation, cell cycle, migration and invasion of HCC cells.
The levels of MMPs (MMP-2 and MMP-9) are closely related to cell
metastasis (43), and cyclin D1
and c-Myc levels are related to the cell cycle (44); thus, these the expression levels
of these proteins were determined by WB analysis. The results
revealed that Asxl2 was a tumor suppressor in HCC, which is
consistent with the findings of a previous study on HSC (24). The loss of Asxl2 is associated
with increased chromatin accessibility at putative enhancers of key
leukemogenic loci during leukemogenesis (45). The deletion of Asxl2 also affects
self-renewal, differentiation and apoptosis of HSC (24). In contrast to the majority of
studies, Asxl2 has bene shown to promote the growth of breast
cancer cells by regulating ERα target gene expression (46). Therefore, it was considered that
Asxl2 acts as an epigenetic regulator and may regulate important
gene networks in various types of cancer.
It should be noted that there were also some
limitations to the present study. For example, the signaling
pathway involved in the suppressive effects of Asxl2 on the
development of NASH-HCC from diabetes was not identified, and this
needs to be addressed in future research.
In conclusion, the present study provided a
genome-wide gene expression profile of NASH-HCC. Among all the
DEGs, Asxl2, which was identified to be a tumor suppressor in HCC,
and may play an important role in the development of NASH-HCC
developed from diabetes. On the whole, the present study enhances
the understanding of the molecular mechanisms responsible for the
pathogenesis of NASH-HCC.
Abbreviations:
|
NASH-HCC
|
non-alcoholic steatohepatitis-related
hepatocellular carcinoma
|
|
STZ-HFD
|
streptozotocin and a high-fat diet
|
|
DEGs
|
differentially expressed genes
|
|
WB analysis
|
western blot analysis
|
|
HCC
|
hepatocellular carcinoma
|
|
NAFLD
|
non-alcoholic fatty liver disease
|
|
NASH
|
non-alcoholic steatohepatitis
|
|
PVDF
|
polyvinylidene difluoride
|
|
SEM
|
standard error of mean
|
|
ANOVA
|
analysis of variance
|
Acknowledgments
Not applicable.
Funding
The present study was supported by the Commission of
Science Technology of Minhang District (grant no. 2019MHZ079); the
Minhang Scientific Research Found Projects Grant (grant no.
2017MHJC02); the Shanghai Science and Technology Fund (grant no.
19142202000).
Availability of data and materials
The analyzed datasets generated during the study are
available from the corresponding author on reasonable request.
Authors' contributions
ZH and ZZ made substantial contributions to the
conception and design of the study. FT, JF, XW and QC were involved
in data acquisition, data analysis and interpretation. ZH and ZZ
drafted the article or critically revised it for important
intellectual content. All authors gave the final approval of the
final version of the manuscript to be published and all authors
agree to be accountable for all aspects of the work in ensuring
that questions related to the accuracy or integrity of the work are
appropriately investigated and resolved.
Ethics approval and consent to
participate
All procedures performed in experiments involving
human participants were in accordance with the ethical standards of
the institutional and/or national research committee and with the
1964 Helsinki declaration and its later amendments or comparable
ethical standards. The present study was approved by the Ethics
Committee of Minhang Hospital and written informed consent was
signed by each participant prior to the surgery. Animal experiments
were performed according to the guidelines of Minhang Hospital
Animal Ethics Committee. Efforts were made in consideration of
animal welfare.
Patient consent for publication
Not applicable.
Competing interests
The authors declare that they have no competing
interests.
References
|
1
|
Shariff MI, Cox IJ, Gomaa AI, Khan SA,
Gedroyc W and Taylor-Robinson SD: Hepatocellular carcinoma: Current
trends in worldwide epidemiology, risk factors, diagnosis and
therapeutics. Exp Rev Gastroenterol Hepatol. 3:353–367. 2009.
View Article : Google Scholar
|
|
2
|
Yu Y, Cai J, She Z and Li H: Insights into
the epidemiology, pathogenesis, and therapeutics of nonalcoholic
fatty liver diseases. Adv Sci (Weinch). 6:18015852019. View Article : Google Scholar
|
|
3
|
Xie G, Wang X, Huang F, Zhao A, Chen W,
Yan J, Zhang Y, Lei S, Ge K, Zheng X, et al: Dysregulated hepatic
bile acids collaboratively promote liver carcinogenesis. Int J
Cancer. 139:1764–1775. 2016. View Article : Google Scholar : PubMed/NCBI
|
|
4
|
Anstee QM, Reeves HL, Kotsiliti E, Govaere
O and Heikenwalder M: Gastroenterology HMJNr and hepatology: From
NASH to HCC: Current concepts and future challenges. Nat Rev
Gastroenterol Hepatol. 16:411–428. 2019. View Article : Google Scholar : PubMed/NCBI
|
|
5
|
van der Meer AJ, Feld JJ, Hofer H, Almasio
PL, Calvaruso V, Fernández-Rodríguez CM, Aleman S, Ganne-Carrié N,
D'Ambrosio R, Pol S, et al: Risk of cirrhosis-related complications
in patients with advanced fibrosis following hepatitis C virus
eradication. J Heptol. 66:485–493. 2017. View Article : Google Scholar
|
|
6
|
Noureddin M and Rinella ME: Nonalcoholic
fatty liver disease, diabetes, obesity, and hepatocellular
carcinoma. Clin Cancer Dis. 19:361–379. 2015.
|
|
7
|
Simon TG, King LY, Chong DQ, Nguyen LH, Ma
Y, VoPham T, Giovannucci EL, Fuchs CS, Meyerhardt JA, Corey KE, et
al: Diabetes, metabolic comorbidities, and risk of hepatocellular
carcinoma: Results from two prospective cohort studies. Hepatology.
67:1797–1806. 2018. View Article : Google Scholar :
|
|
8
|
El-Serag HB, Kanwal F, Richardson P and
Kramer J: Risk of hepatocellular carcinoma after sustained
virological response in Veterans with hepatitis C virus infection.
Hepatology. 64:130–137. 2016. View Article : Google Scholar : PubMed/NCBI
|
|
9
|
El-Shamy A, Eng FJ, Doyle EH, Klepper AL,
Sun X, Sangiovanni A, Iavarone M, Colombo M, Schwartz RE, Hoshida Y
and Branch AD: A cell culture system for distinguishing hepatitis C
viruses with and without liver cancer-related mutations in the
viral core gene. J Hepatol. 63:1323–1333. 2015. View Article : Google Scholar : PubMed/NCBI
|
|
10
|
Setiawan VW, Hernandez BY, Lu SC, Stram
DO, Wilkens LR, Marchand LL and Henderson BE: Diabetes and
racial/ethnic differences in hepatocellular carcinoma risk: The
multiethnic cohort. J Natl Cancer Inst. 106:dju3262014. View Article : Google Scholar : PubMed/NCBI
|
|
11
|
Zhang Q, Deng YL, Liu C, Huang LH, Shang
L, Chen XG, Wang LT, Du JZ, Wang Y, Wang PX, et al: Diabetes
mellitus may affect the long-term survival of hepatitis B
virus-related hepatocellular carcinoma patients after liver
transplantation. World J Gastroenterol. 22:9571–9585. 2016.
View Article : Google Scholar : PubMed/NCBI
|
|
12
|
Chiang CH, Lee LT, Hung SH, Lin WY, Hung
HF, Yang WS, Sung PK and Huang KC: Opposite association between
diabetes, dyslipidemia, and hepatocellular carcinoma mortality in
the middle-aged and elderly. Hepatology. 59:2207–2215. 2014.
View Article : Google Scholar : PubMed/NCBI
|
|
13
|
Shima T, Uto H, Ueki K, Kohgo Y, Yasui K,
Nakamura N, Nakatou T, Takamura T, Kawata S and Notsumata K:
Hepatocellular carcinoma as a leading cause of cancer-related
deaths in Japanese type 2 diabetes mellitus patients. J
Gastroenterol. 54:64–77. 2019. View Article : Google Scholar
|
|
14
|
de Oliveira S, Houseright RA, Graves AL,
Golenberg N, Korte BG, Miskolci V and Huttenlocher A: Metformin
modulates innate immune-mediated inflammation and early progression
of NAFLD-associated hepatocellular carcinoma in zebrafish. J
Hepatol. 70:710–721. 2019. View Article : Google Scholar
|
|
15
|
Ye J, Li TS, Xu G, Zhao YM, Zhang NP, Fan
J and Wu J: JCAD promotes progression of nonalcoholic
steatohepatitis to liver cancer by inhibiting LATS2 kinase
activity. Cancer Res. 77:5287–5300. 2017. View Article : Google Scholar : PubMed/NCBI
|
|
16
|
Vandekerckhove L, Vermeulen Z, Liu ZZ,
Boimvaser S, Patzak A, Segers VF and De Keulenaer GW: Neuregulin-1
attenuates development of nephropathy in a type 1 diabetes mouse
model with high cardiovascular risk. Am J Physiol Endocrinol Metab.
310:E495–E504. 2016. View Article : Google Scholar : PubMed/NCBI
|
|
17
|
Li M, Dou L, Jiao J, Lu Y, Guo HB, Man Y,
Wang S and Li J: NADPH oxidase 2-derived reactive oxygen species
are involved in dysfunction and apoptosis of pancreatic β-cells
induced by low density lipoprotein. Cell Physiol Biochem.
30:439–449. 2012. View Article : Google Scholar
|
|
18
|
Al-Malki AL, Sayed AA and Rabey HA:
Proanthocyanidin attenuation of oxidative stress and NF-κB protects
apolipoprotein E-deficient mice against diabetic nephropathy. Evid
Based Complement Alternat Med. 2013:7694092013. View Article : Google Scholar
|
|
19
|
Livak KJ and Schmittgen TD: Analysis of
relative gene expression data using real-time quantitative PCR and
the 2(-Delta Delta C(T)) method. Methods. 25:402–408. 2001.
View Article : Google Scholar
|
|
20
|
Liao Y, Smyth GK and Shi W: FeatureCounts:
An efficient general purpose program for assigning sequence reads
to genomic features. Bioinformatics. 30:923–930. 2014. View Article : Google Scholar
|
|
21
|
Robinson MD, McCarthy DJ and Smyth GK:
EdgeR: A Bioconductor package for differential expression analysis
of digital gene expression data. Bioinformatics. 26:139–140. 2010.
View Article : Google Scholar
|
|
22
|
Hughes FM, Kennis JG, Youssef MN, Lowe DW,
Shaner BE and Purves JT: The NACHT, LRR and PYD domains-containing
protein 3 (NLRP3) inflammasome mediates inflammation and voiding
dysfunction in a lipopolysaccharide-induced rat model of cystitis.
J Clin Cell Immunol. 7:3962016. View Article : Google Scholar : PubMed/NCBI
|
|
23
|
Wu J, Mao X, Cai T, Luo J and Wei L: KOBAS
server: A web-based platform for automated annotation and pathway
identification. Nucleic Acids Res. 34:W720–W724. 2006. View Article : Google Scholar : PubMed/NCBI
|
|
24
|
Li J, He F, Zhang P, Chen S, Shi H, Sun Y,
Guo Y, Yang H, Man N, Greenblatt S, et al: Loss of asxl2 leads to
myeloid malignancies in mice. Nat Commun. 8:154562017. View Article : Google Scholar : PubMed/NCBI
|
|
25
|
Izawa T, Rohatgi N, Fukunaga T, Wang QT,
Silva MJ, Gardner MJ, McDaniel ML, Abumrad NA, Semenkovich CF,
Teitelbaum SL and Zou W: ASXL2 regulates glucose, lipid, and
skeletal homeostasis. Cell Rep. 11:1625–1637. 2015. View Article : Google Scholar : PubMed/NCBI
|
|
26
|
Hanssen NM, Brouwers O, Gijbels MJ,
Wouters K, Wijnands E, Cleutjens JP, De Mey JG, Miyata T, Biessen
EA, Stehouwer CD and Schalkwijk CG: Glyoxalase 1 overexpression
does not affect atherosclerotic lesion size and severity in
ApoE−/− mice with or without diabetes. Cardiovasc Res.
104:160–170. 2014. View Article : Google Scholar : PubMed/NCBI
|
|
27
|
Huang MC, Chen LY, Chang HM, Liang XY,
Chen CK, Cheng WJ and Xu K: Decreased blood levels of oxytocin in
ketamine-dependent patients during early abstinence. Front
Psychiatry. 9:6332018. View Article : Google Scholar : PubMed/NCBI
|
|
28
|
Huang Z, Jing X, Sheng Y, Zhang J, Hao Z,
Wang Z and Ji L: (-)-Epicatechin attenuates hepatic sinusoidal
obstruction syndrome by inhibiting liver oxidative and inflammatory
injury. Redox Biol. 22:1011172019. View Article : Google Scholar : PubMed/NCBI
|
|
29
|
El-Hawary SS, Ali ZY and Younis IY:
Hepatoprotective potential of standardized ficus species in
intrahepatic cholestasis rat model: Involvement of nuclear
factor-κB, and farnesoid X receptor signaling pathways. J
Ethnopharmacol. 231:262–274. 2019. View Article : Google Scholar
|
|
30
|
Parvez MK, Al-Dosari MS, Arbab AH and
Niyazi S: The in vitro and in vivo anti-hepatotoxic, anti-hepatitis
B virus and hepatic CYP450 modulating potential of cyperus
rotundus. Saudi Pharm J. 27:558–564. 2019. View Article : Google Scholar : PubMed/NCBI
|
|
31
|
Gad-Elkareem MA, Abdelgadir EH, Badawy OM
and Kadri A: Potential antidiabetic effect of ethanolic and
aqueousethanolic extracts of leaves on streptozotocin-induced
diabetes in rats. PeerJ. 7:e64412019. View Article : Google Scholar
|
|
32
|
Kazemi A, Soltani S, Ghorabi S, Keshtkar
A, Daneshzad E, Nasri F and Mazloomi SM: Effect of probiotic and
synbiotic supplementation on inflammatory markers in health and
disease status: A systematic review and meta-analysis of clinical
trials. Clin Nutr. 39:789–819. 2019. View Article : Google Scholar : PubMed/NCBI
|
|
33
|
Azushima K, Uneda K, Wakui H, Ohki K,
Haruhara K, Kobayashi R, Haku S, Kinguchi S, Yamaji T, Minegishi S,
et al: Effects of rikkunshito on renal fibrosis and inflammation in
angiotensin II-infused mice. Sci Rep. 9:62012019. View Article : Google Scholar : PubMed/NCBI
|
|
34
|
Shimizu Y, Suzuki T, Yoshikawa T, Endo I
and Nakatsura T: Next-Generation cancer immunotherapy targeting
glypican-3. Front Oncol. 9:2482019. View Article : Google Scholar : PubMed/NCBI
|
|
35
|
Ortiz MV, Roberts SS, Bender JG, Shukla N
and Wexler LH: Immunotherapeutic targeting of GPC3 in pediatric
solid embryonal tumors. Front Oncol. 9:1082019. View Article : Google Scholar : PubMed/NCBI
|
|
36
|
Cohen JV and Sullivan RJ: Developments in
the space of new MAPK pathway inhibitors for BRAF-mutant melanoma.
Clin Cancer Res. 25:5735–5742. 2019. View Article : Google Scholar : PubMed/NCBI
|
|
37
|
Liu Y, Yang Z, Du F, Yang Q, Hou J, Yan X,
Geng Y, Zhao Y and Wang H: Molecular mechanisms of pathogenesis in
hepatocellular carcinoma revealed by RNA-sequencing. Mol Med Rep.
16:6674–6682. 2017. View Article : Google Scholar : PubMed/NCBI
|
|
38
|
Birnbaum DJ, Finetti P, Birnbaum D,
Mamessier E and Bertucci F: Expression is a poor-prognosis marker
in pancreatic adenocarcinoma. J Clin Med. 8:5962019. View Article : Google Scholar
|
|
39
|
Vad-Nielsen J, Jakobsen KR, Daugaard TF,
Thomsen R, Brügmann A, Sørensen BS and Nielsen AL: Regulatory
dissection of the CBX5 and hnRNPA1 bi-directional promoter in human
breast cancer cells reveals novel transcript variants
differentially associated with HP1α down-regulation in metastatic
cells. BMC Cancer. 16:322016. View Article : Google Scholar
|
|
40
|
Luo P, Feng X, Jing W, Zhu M, Li N, Zhou
H, Worley PF, Chai H and Tu J: Clinical and diagnostic significance
of Homer1 in hepatitis B virus-induced hepatocellular carcinoma. J
Cancer. 9:683–689. 2018. View Article : Google Scholar : PubMed/NCBI
|
|
41
|
Madan V, Han L, Hattori N, Teoh WW,
Mayakonda A, Sun QY, Ding LW, Nordin HB, Lim SL and Shyamsunder P:
ASXL2 regulates hematopoiesis in mice and its deficiency promotes
myeloid expansion. Haematologica. 103:1980–1990. 2018. View Article : Google Scholar : PubMed/NCBI
|
|
42
|
Park UH, Yoon SK, Park T, Kim EJ and Um
SJ: Additional sex comb-like (ASXL) proteins 1 and 2 play opposite
roles in adipogen-esis via reciprocal regulation of peroxisome
proliferator-activated receptor {gamma}. J Biol Chem.
286:1354–1363. 2011. View Article : Google Scholar
|
|
43
|
Hung CY, Lee CH, Chiou HL, Lin CL, Chen
PN, Lin MT, Hsieh YH and Chou MC: Praeruptorin-B inhibits
12-O-tetradecanoylphorbol-13-acetate-induced cell invasion by
targeting AKT/NF-κB via matrix metalloproteinase-2/-9 expression in
human cervical cancer cells. Cell Physiol Biochem. 52:1255–1266.
2019. View Article : Google Scholar
|
|
44
|
Chen L, Zhu D, Feng J, Zhou Y, Wang Q,
Feng H, Zhang J and Jiang J: Overexpression of HHLA2 in human clear
cell renal cell carcinoma is significantly associated with poor
survival of the patients. Cancer Cell Int. 19:1012019. View Article : Google Scholar : PubMed/NCBI
|
|
45
|
Micol JB, Pastore A, Inoue D, Duployez N,
Kim E, Lee SC, Durham BH, Chung YR, Cho H, Zhang XJ, et al: ASXL2
is essential for haematopoiesis and acts as a haploinsufficient
tumour suppressor in leukemia. Nat Commun. 8:154292017. View Article : Google Scholar : PubMed/NCBI
|
|
46
|
Park UH, Kang MR, Kim EJ, Kwon YS, Hur W,
Yoon SK, Song BJ, Park JH, Hwang JT, Jeong JC and Um SJ: ASXL2
promotes proliferation of breast cancer cells by linking ERα to
histone methylation. Oncogene. 35:3742–3752. 2016. View Article : Google Scholar
|