Introduction
Thymic epithelial cells (TECs) are key components of
the thymic stromal compartment, which creates a specialized
microenvironment for the maturation of T cell precursors into
mature, immunocompetent cells at various stages of development.
TECs are closely associated with developing thymocytes within the
thymic microenvironment, playing a crucial role in the attraction,
migration, survival, proliferation, differentiation and the
selection of thymocytes (1).
Histologically, the thymus can be divided into two
sub-compartments, the outer cortex and the inner medulla, which
hold different populations of TECs and thymocytes undergoing
discrete, stepwise maturation. TECs are largely composed of the
cortical and medullary types, and serial interactions of TECs with
thymocytes, including positive and negative selection of the T cell
repertoire, are required for thymocyte development (2).
The age-related involution of the thymus, a major
cause of the decreased production of T cells and the subsequent
loss of immune function in the elderly, is closely associated with
aging of TECs, which is linked to various mechanisms, such as the
inhibition of thymopoietic cytokine production (3). Furthermore, TECs play a pivotal role
in thymic regeneration. In particular, multiple lines of evidence
have indicated that cortical TECs (cTECs) play a key role in the
regeneration process of the damaged thymus by producing a variety
of factors (4-9). However, the molecular mechanisms
underlying thymus regeneration remain largely unknown, although
some molecules, including interleukin (IL)-7, keratinocyte growth
factor, transforming growth factor-β (TGF-β), insulin-like growth
factor-1 (IGF-1), Wnt-4 and IL-22 have been identified thus far
(10,11). An enhanced understanding of the
process of thymopoietic regulation at a molecular level,
particularly the molecular basis of TEC function, is essential for
the development and maintenance of a healthy, intact immune system.
Therefore, an effective approach is required to identify positive
or negative regulatory factors involved in TEC functioning that may
aid in developing innovative therapeutic strategies to promote
thymus regeneration, which may ultimately lead to the successful
treatment of a number of clinical conditions caused by T cell
deficiency.
Epidermal growth factor-like domain (EGFL),
consisting of 30-40 amino acid residues possessing significant
homology to epidermal growth factor (EGF), is an evolutionarily
conserved domain present in many vertebrate proteins (12-15). EGFL proteins, characterized by the
presence of single or multiple EGFL repeats, are membrane-bound or
secreted, and function in several essential cellular activities,
such as cell proliferation, differentiation, apoptosis, adhesion,
and migration (16,17). Several EGFL family members have
been identified, including EGFL2, EGFL3, EGFL5, EGFL6, EGFL7,
EGFL8, and EGFL9. Among these, EGFL2, EGFL5 and EGFL9 contain
transmembrane domains, whereas EGFL3, EGFL6, EGFL7 and EGFL8 lack
these domains, and are secreted into the extracellular environment
(17,18).
EGFL8, a newly identified member of the EGFL family,
was originally identified as a paralog of EGFL7 using a Basic Local
Alignment Search Tool (BLAST) of the mouse genome (19). The expression of EGFL8 has been
detected in osteoclasts and osteoblasts (18). Additionally, it has been reported
that the EGFL8 expression level is significantly decreased in
colorectal and gastric cancer, suggesting that EGFL8 may have a
distinct expression pattern and mechanism of action in cancer
progression (20,21). Recently, it has been demonstrated
that EGFL8 is expressed during T cell development in both TECs and
thymocytes and is involved in the suppression of thymocyte
differentiation (22,23). Additionally, the overexpression of
EGFL8 may exert negative regulatory effects on TECs through the
inhibition of thymocyte adherence to TECs and the suppression of
the expression of molecules involved in TEC function (22). This finding may facilitate the
development of therapeutic strategies for the treatment of
immune-mediated diseases associated with T cell abnormalities.
However, the precise cellular functions of EGFL8 are not fully
understood. A high throughput study may be the most effective,
available approach to characterize global changes in gene
expression to create an overall picture of cellular function.
Therefore, the aim of the present study was to identify novel EGFL8
targets among the induced differentially expressed genes (DEGs),
and to discover molecular interaction networks underlying the
global effects of EGFL8 using an integrated analysis of gene
expression profiles and networks in EGFL8-overexpressing or
-silenced cTECs. It is reported herein that EGFL8 is likely to be
involved in the regulation of the cell cycle, cell proliferation,
differentiation, apoptosis and migration, as well as in immune
responses, and may also be an important regulator of vascular
endothelial growth factor-A (VEGF-A) gene expression.
Materials and methods
Cell lines and cell culture
The generation, maintenance and functional
characterization of 427.1 mouse cTECs, which represent mouse thymic
sub-capsular cortex or thymic nurse epithelial cells, were
performed as described previously (24), and the cells were kindly provided
by The jackson Laboratory. These cell lines constitutively express
the class I antigens of the major histocompatibility complex (MHC),
and can be induced to express MHC class II antigens upon
stimulation with recombinant interferon (IFN)-γ and produce
granulocyte-macrophage colony-stimulating factor (GM-CSF) (24). cTECs were cultured and maintained
in high-glucose Dulbecco's modified Eagle's medium (DMEM; Gibco;
Thermo Fisher Scientific, Inc.) containing 10% fetal bovine serum
(FBS; Gibco; Thermo Fisher Scientific, Inc.), 2 mM glutamine
(Sigma-Aldrich; Merck KGaA), 100 U/ml penicillin (Gibco; Thermo
Fisher Scientific, Inc.), and 100 µg/ml streptomycin (Gibco;
Thermo Fisher Scientific, Inc.) at 37°C in a 5%
CO2-enriched atmosphere.
Plasmid constructs and transfection
To construct EGFL8 plasmids, full-length mouse EGFL8
complementary DNA (cDNA) was amplified with total thymic RNA using
polymerase chain reaction (PCR) with BamHI and XbaI
restriction enzymes, and cloned into a pcDNA3.1 mammalian
expression vector (Life Technologies; Thermo Fisher Scientific,
Inc.). The PCR-amplified DNA sequence was analyzed by Bionics Co.
Ltd., and the presence of any errors in the PCR product, such as
point mutations, deletions, insertions and duplications was not
detected (data not shown). The cTECs were transfected with 5
µg pcDNA3.1-EGFL8 expression constructs using Lipofectamine™
2000 reagent (Gibco; Thermo Fisher Scientific, Inc.) according to
the manufacturer's instructions. The media were changed after 4-6 h
to antibiotic-containing media and incubated at 37°C for a further
48 h.
To construct mouse EGFL8 gene knockdowns, siRNA
duplex oligos and scrambled control siRNA with an overhang of dTdT
were synthesized by Bioneer Corp. The siRNA sequences for mouse
EGFL8 were as follows: 5′-CCA GAG GAG GAU CUU UCA A-3′ (siRNA1),
5′-GGA UCU UUC AAA GAG AGU U-3′ (siRNA2). The cTECs were seeded
into 6-well microplates or a 100 mm dish and transfected with 100
pmol of siRNA using Lipofectamine™ 2000 reagent according to the
manufacturer's instructions. The media were changed after 4-6 h to
antibiotic-containing media and incubated at 37°C; the cTECs were
harvested 2 days following siRNA transfection, and EGFL8 knockdown
efficiency was confirmed by RT-PCR.
Gene microarray and expression
analysis
The effects of the overexpression or knockdown of
the mouse EGFL8 gene in cTECs on whole genome expression profiles
were investigated using a whole transcript genechip microarray
(GeneChip® Mouse Gene 1.0 ST Array; Affymetrix; Thermo
Fisher Scientific, Inc.), which has 770,317 distinct 25-mer
oligonucleotide probes that represent 28,853 well-annotated mouse
genes. Total RNA for microarray analysis was isolated using the
RNeasy Mini kit as per the manufacturer's instructions and
recommendations (Qiagen, Inc.). Briefly, cells were diced in a
mixture of 1.5 ml QG buffer (Qiagen, Inc.) and 2 ml RLT buffer
(Qiagen, Inc.). Samples were kept at room temperature until
complete dissolution and then stored at -20°C. Defrosted samples
were homogenized and supplemented with 2 ml 70% ethanol. RNA
quality was assessed using Agilent 2100 Bioanalyzer (Agilent
Technologies, Inc.) with the RNA 6000 Nano Chip (Agilent
Technologies, Inc.), and quantified using a Nanodrop 2000
Spectrophotometer (Thermo Fisher Scientific, Inc.). Biological
triplicates were obtained for each group: Mock
pcDNA3.1-vector-transfected cTECs, pcDNA3.1-EGFL8-transfected
cTECs, scrambled siRNA-transfected cTECs, and EGFL8
siRNA-transfected cTECs. The labeling and hybridization of total
RNA were performed by DNALink Incorporated (Affymetrix-authorized
service provider), according to the standard protocol. Global gene
expression analysis for each sample was performed using
GeneChip® Mouse Gene 1.0 ST Arrays (Affymetrix; Thermo
Fisher Scientific, Inc.) as per the recommended manufacturer's
protocols. Briefly, 300 ng of total RNA from each sample was
converted to double-stranded cDNA. using a random hexamer
incorporating a T7 promoter, amplified RNA (cRNA) was generated
from the double-stranded cDNA template though an in vitro
transcription reaction and purified with the Affymetrix sample
cleanup module. cDNA was regenerated through a random-primed
reverse transcription using a deoxynucleotide triphosphate (dNTP)
mixture containing deoxyuridine triphosphate (duTP) (Promega
Corporation). The cDNA was then fragmented by uracil-DNA
glycosylase (uDG) and human apurinic/apyrimidinic endonuclease-1
(APE1, also known as HAP1, REF1 and APEX1) and end-labeled using a
terminal transferase reaction incorporating a biotinylated
dideoxynucleotide (ddNTP). Fragmented end-labeled cDNA was
hybridized to the GeneChip® Mouse Gene 1.0 ST arrays for
17 h at 45°C and 60 rpm as described in the Gene Chip Whole
Transcript Sense Target Labeling Assay Manual (Affymetrix; Thermo
Fisher Scientific, Inc.).
Following hybridization, the microarrays were passed
through a wash process and marking was performed by
streptavidin-phycoerythrin using the 'GeneChip Fluidics Station
450' (Affymetrix; Thermo Fisher Scientific, Inc.). Subsequently,
the microarrays were scanned with 'GeneChip Scanner 3000 7G'
(Affymetrix; Thermo Fisher Scientific, Inc.) and images of each
sample were obtained. The quality control of these images was
performed using the program 'Affymetrix GeneChip Command Console'.
Each hybridization was a distinct biological replicate.
Cell proliferation assay
The cTECs were plated into 96-well microplates at
3×10⁴ cells/well in DMEM containing 10% FBS. The cells
were left untreated as an untreated control, or transfected with
either 5 µg pcDNA3.1-EGFL8 or 100 pmol EGFL8 siRNA2 in
antibiotic-free medium using Lipofectamine™ 2000 (Gibco; Thermo
Fisher Scientific, Inc.). A rescue experiment was also performed by
co-transfection with EGFL8 siRNA2 and pcDNA3.1-EGFL8. After the
cells were cultured for 48 h, cell proliferation was determined
using the colorimetric WST-1 conversion assay (EZ-Cytox assay kit;
Daeil Lab Service). WST-1 reagent (10 µl) was added to each
well, after which the cells were incubated for 2 h at 37°C in a
humidified atmosphere under 5% CO2. The absorbance of
the formazan dye, generated by the reaction between dehydrogenase
and WST-1 in metabolically active cells, was measured using a
microplate reader (Tecan Group Ltd.) at 450 nm according to the
manufacturer's instructions. The percentage cell viability was
calculated. Experiments were performed a minimum of 3 times.
RT-PCR
Total RNA was isolated from the cultured cells using
TRIzol reagent (Gibco; Thermo Fisher Scientific, Inc.) following
the manufacturer's instructions. The RNA quantity and quality were
assessed using a NanoDrop 2000 spectrophotometer (Thermo Fisher
Scientific, Inc.). Briefly, the samples were transferred into RNA
extraction solution (1 ml). The homogenate was then
chloroform-extracted, precipitated with isopropanol, washed with
ethanol and resuspended in 30 µl of distilled water. The RNA
concentration and purity were determined by measuring the
absorbance at 260 and 280 nm. Samples exhibited 260/280 absorbance
ratios ≥1.9. First-strand cDNA synthesis was performed by reverse
transcription using total RNA (2 µg). The reaction was
conducted in a 25 µl reaction mixture containing 0.5
µg oligo(dT) 12-18 primer (Promega Corporation), 50 mM
Tris-HCl (pH 8.3), 75 mM KCl, 3 mM MgCl2, 40 mM
dithiothreitol, 0.5 mM dNTP mixture (Promega Corporation), 10 units
RNase inhibitor (Promega Corporation) and 200 units of Moloney
murine leukemia virus reverse transcriptase (Promega Corporation).
The mixture was incubated at 37°C for 60 min, and the reaction was
terminated by heating at 70°C for 5 min. The obtained cDNA was used
as a template for PCR amplification using gene-specific primers.
The primer sequences are presented in Table I. The PCR amplification of cDNA
was performed in an automated thermal cycler (PC-320, Astec, Co.
Ltd.) in a final reaction volume of 25 µl containing the
following components: 4 µl of cDNA solution, 20 mM Tris-HCl
(pH 8.4), 50 mM KCl, 1.5 mM MgCl2, 0.1% Triton X-100,
0.2 mM dNTP mixture (Promega Corporation), 0.5 pmol of each primer
and 5 units of Taq DNA polymerase (Promega Corporation). All PCR
reactions were performed in 22 to 35 cycles at 94°C for 30 sec,
55°C for 30 sec, and 72°C for 30 sec. Amplified products were
analyzed by electrophoresis using a 2% agarose gel and visualized
by ethidium bromide staining under ultraviolet light. The band
intensities of PCR products were quantified and analyzed using an
image analysis software (Imagej, version 1.52a, National Institute
of Health). The results are expressed as ratios vs.
glyceraldehyde-3-phosphate dehydrogenase (GAPDH) mRNA amplified
from the same cDNA samples.
 | Table IPrimer sequences used for RT-PCR in
the present study. |
Table I
Primer sequences used for RT-PCR in
the present study.
| Target gene | Forward primer
sequence | Reverse primer
sequence |
|---|
| Angptl1 |
ATCCCGACTTGAAATACAACTGC |
CTGGATGATGAATGTCTGACGAG |
| CCL20 C |
GACTGTTGCCTCTCGTACA |
GAGGAGGTTCACAGCCCTTT |
| CD74 |
CGCGACCTCATCTCTAACCAT |
ACAGGTTTGGCAGATTTCGGA |
| CXCL5 |
GCATTTCTGTTGCTGTTCACGCTG |
CCTCCTTCTGGTTTTTCAGTTTAGC |
| CXCL10 |
CCAAGTGCTGCCGTCATTTTC |
GGCTCGCAGGGATGATTTCAA |
| CXCL16 |
CCTTGTCTCTTGCGTTCTTCC |
TCCAAAGTACCCTGCGGTATC |
| FasL |
TATCAAGGAGGCCCATTTTGC |
GTTTCCACTTCTAAACCATGCT |
| IGFBP-4 C |
AGCGTGCTTGCTAACTTCC |
TAGAGAACCAGACCCGGAGG |
| Irf7 |
TGCTGTTTGGAGACTGGCTAT |
TCCAAGCTCCCGGCTAAGT |
| NF-κB2 |
GGCCGGAAGACCTATCCTACT |
CTACAGACACAGCGCACACT |
| Nrp1 |
TGTAAGCTCGGAAGGGCATC |
TAACGCCTAGTGCCAGCATC |
| Thbs1 |
GCTGCCAATCATAACCAGCG |
GGTTGTTTGGCGGTGAGTTC |
| VEGF-A |
GCACATAGAGAGAATGAGCTTCC |
CTCCGCTCTGAACAAGGCT |
| GAPDH |
ACCACAGTCCATGCCATCAC |
GGCTACAGCAACAGGGTGGTG |
Western blot analysis
The cells were cultured in 100 mm dishes overnight
and incubated at 37°C in a 5% CO2-enriched atmosphere
with siRNA in antibiotic-free media according to the manufacturer's
protocol for Lipofectamine™ 2000 (Gibco; Thermo Fisher Scientific,
Inc.). The media were changed after 4-6 h to antibiotic-containing
media and incubated at 37°C for a further 48 h. The total proteins
were extracted from the cultured cells using a protein extraction
solution (Intron Biotechnology, Inc.) supplemented with protease
inhibitor mixture (Roche Applied Science). Protein concentrations
were measured using the Bradford protein assay kit (Bio-Rad
Laboratories, Inc.). A total of 25 µg of equal protein from
each sample was electrophoresed by sodium dodecyl
sulfate-polyacrylamide gel electrophoresis (SDS-PAGE) on a 8-12%
(v/v) resolving gel and electroblotted onto a polyvinylidene
fluoride membrane (Immobilon-P; EMD Millipore). After blocking for
1 h at room temperature with 3% bovine serum albumin in
Tris-buffered saline with 0.1% Tween®-20, the membrane
was incubated overnight at 4°C with primary antibodies (diluted at
1:1,000 in 5% BSA) against B-cell lymphoma (Bcl)-2 (sc-7382, Santa
Cruz Biotechnology, Inc.), Bcl-xL (2764, Cell Signaling Technology,
Inc.), cyclin-dependent kinase 1 (CDK1) (sc-54, Santa Cruz
Biotechnology, Inc.), CDK6 (sc-177, Santa Cruz Biotechnology,
Inc.), CDK4 (2906, Cell Signaling Technology, Inc.) and cyclin D1
(2922, Cell Signaling Technology, Inc.), and β-actin (sc-47778,
Santa Cruz Biotechnology, Inc.). The blots were then incubated with
peroxidase-conjugated goat anti-mouse and anti-rabbit secondary
antibodies (7076 and 7074, respectively, Cell Signaling Technology)
diluted at 1:10,000 in 3% BSA for 1 h at room temperature.
Immunoreactivity was detected by the enhanced chemiluminescent
substrate kit (Pierce; Thermo Fisher Scientific, Inc.), and images
were captured using a LAS-3000 imaging system (Fujifilm) and the
band intensities of blot products were quantified and analyzed
using Imagej software, version 1.52a.
Microarray data analysis
The intensity values of CEL files were normalized to
remove bias between the arrays, using the Robust Multi-array
Average (RMA) algorithm implemented in the Affymetrix Expression
Console software (v1.3.1) (25).
Normalized data were imported into the programming software 'R'
(v3.0.2) and overall signal distributions of each array were
compared using the Bioconductor Project to verify normalization of
the data (26). Thereafter, data
were log2-transformed, and differentially expressed genes (DEGs)
that exhibited a >2-fold difference between the average signal
values of the control and treatment groups were selected manually.
Additionally, 'R' was used for the statistical analyses (t-test) on
selected DEGs data and genes with P<0.05 were extracted as
significant DEGs for further analysis (26). To classify the co-expression of
gene groups with similar expression patterns, hierarchical
clustering analysis was performed using the Multi Experiment Viewer
(v4.4) (27). Finally, using the
web-based tool Database for Annotation, Visualization, and
Integrated Discovery (DAVID), DEGs were functionally annotated and
classified based on the information of gene function, such as OMIM
disease, Gene Ontology (GO), Kyoto Encyclopedia of Genes and
Genomes (KEGG) pathway, and BioCarta databases to elucidate the
regulatory networks in which they are involved (28). Fisher's exact test was performed
to assess the relevance of the found pathways and determine the
significance of the associations of genes to pathways.
Pathway analysis
Pathway Studio software (v7.1; Ariadne Genomics,
Inc.) was used to define the cellular networks and interactions
among genes expressed in the microarray experiment. This software
contains >100,000 regulations, interactions, modifications, and
cell process events between proteins and small molecules. An
automated text-mining tool, MedScan, enabled the generation of
pathways from multiple sources, including the PubMed database and
online public sources, such as full text journal and proprietary
data sets (literature, experimental, and electronic notebooks)
(29). This text information was
then converted to biological relationships and imported into the
ResNet Mammalian knowledge databases. Thereafter, these
associations were used for hypothesis testing, verification and
elucidating biological function. Additionally, the gene expression
values were visualized and the status in the context of protein
interaction networks and pathways were analyzed using Pathway
Studio. Gene name were imported into Pathway Studio to identify the
cellular processes that were influenced by EGFL8 overexpression or
silencing. In the analysis, each identified cellular process was
manually curated to identify validated data using the relevant
PubMed/Medline hyper-linked abstracts.
Statistical analysis
All data are presented as the means ± standard
deviation (SD) of at least 3 independent experiments. For
validation experiments using RT-PCR and western blot analysis,
control and sample groups were compared using a one-way analysis of
variance (ANOVA) followed by a Tukey's post hoc test. A value of
P<0.05 was considered to indicate a statistically significant
difference.
Results
Modulation of cell proliferation induced
by EGFL8 in cTECs
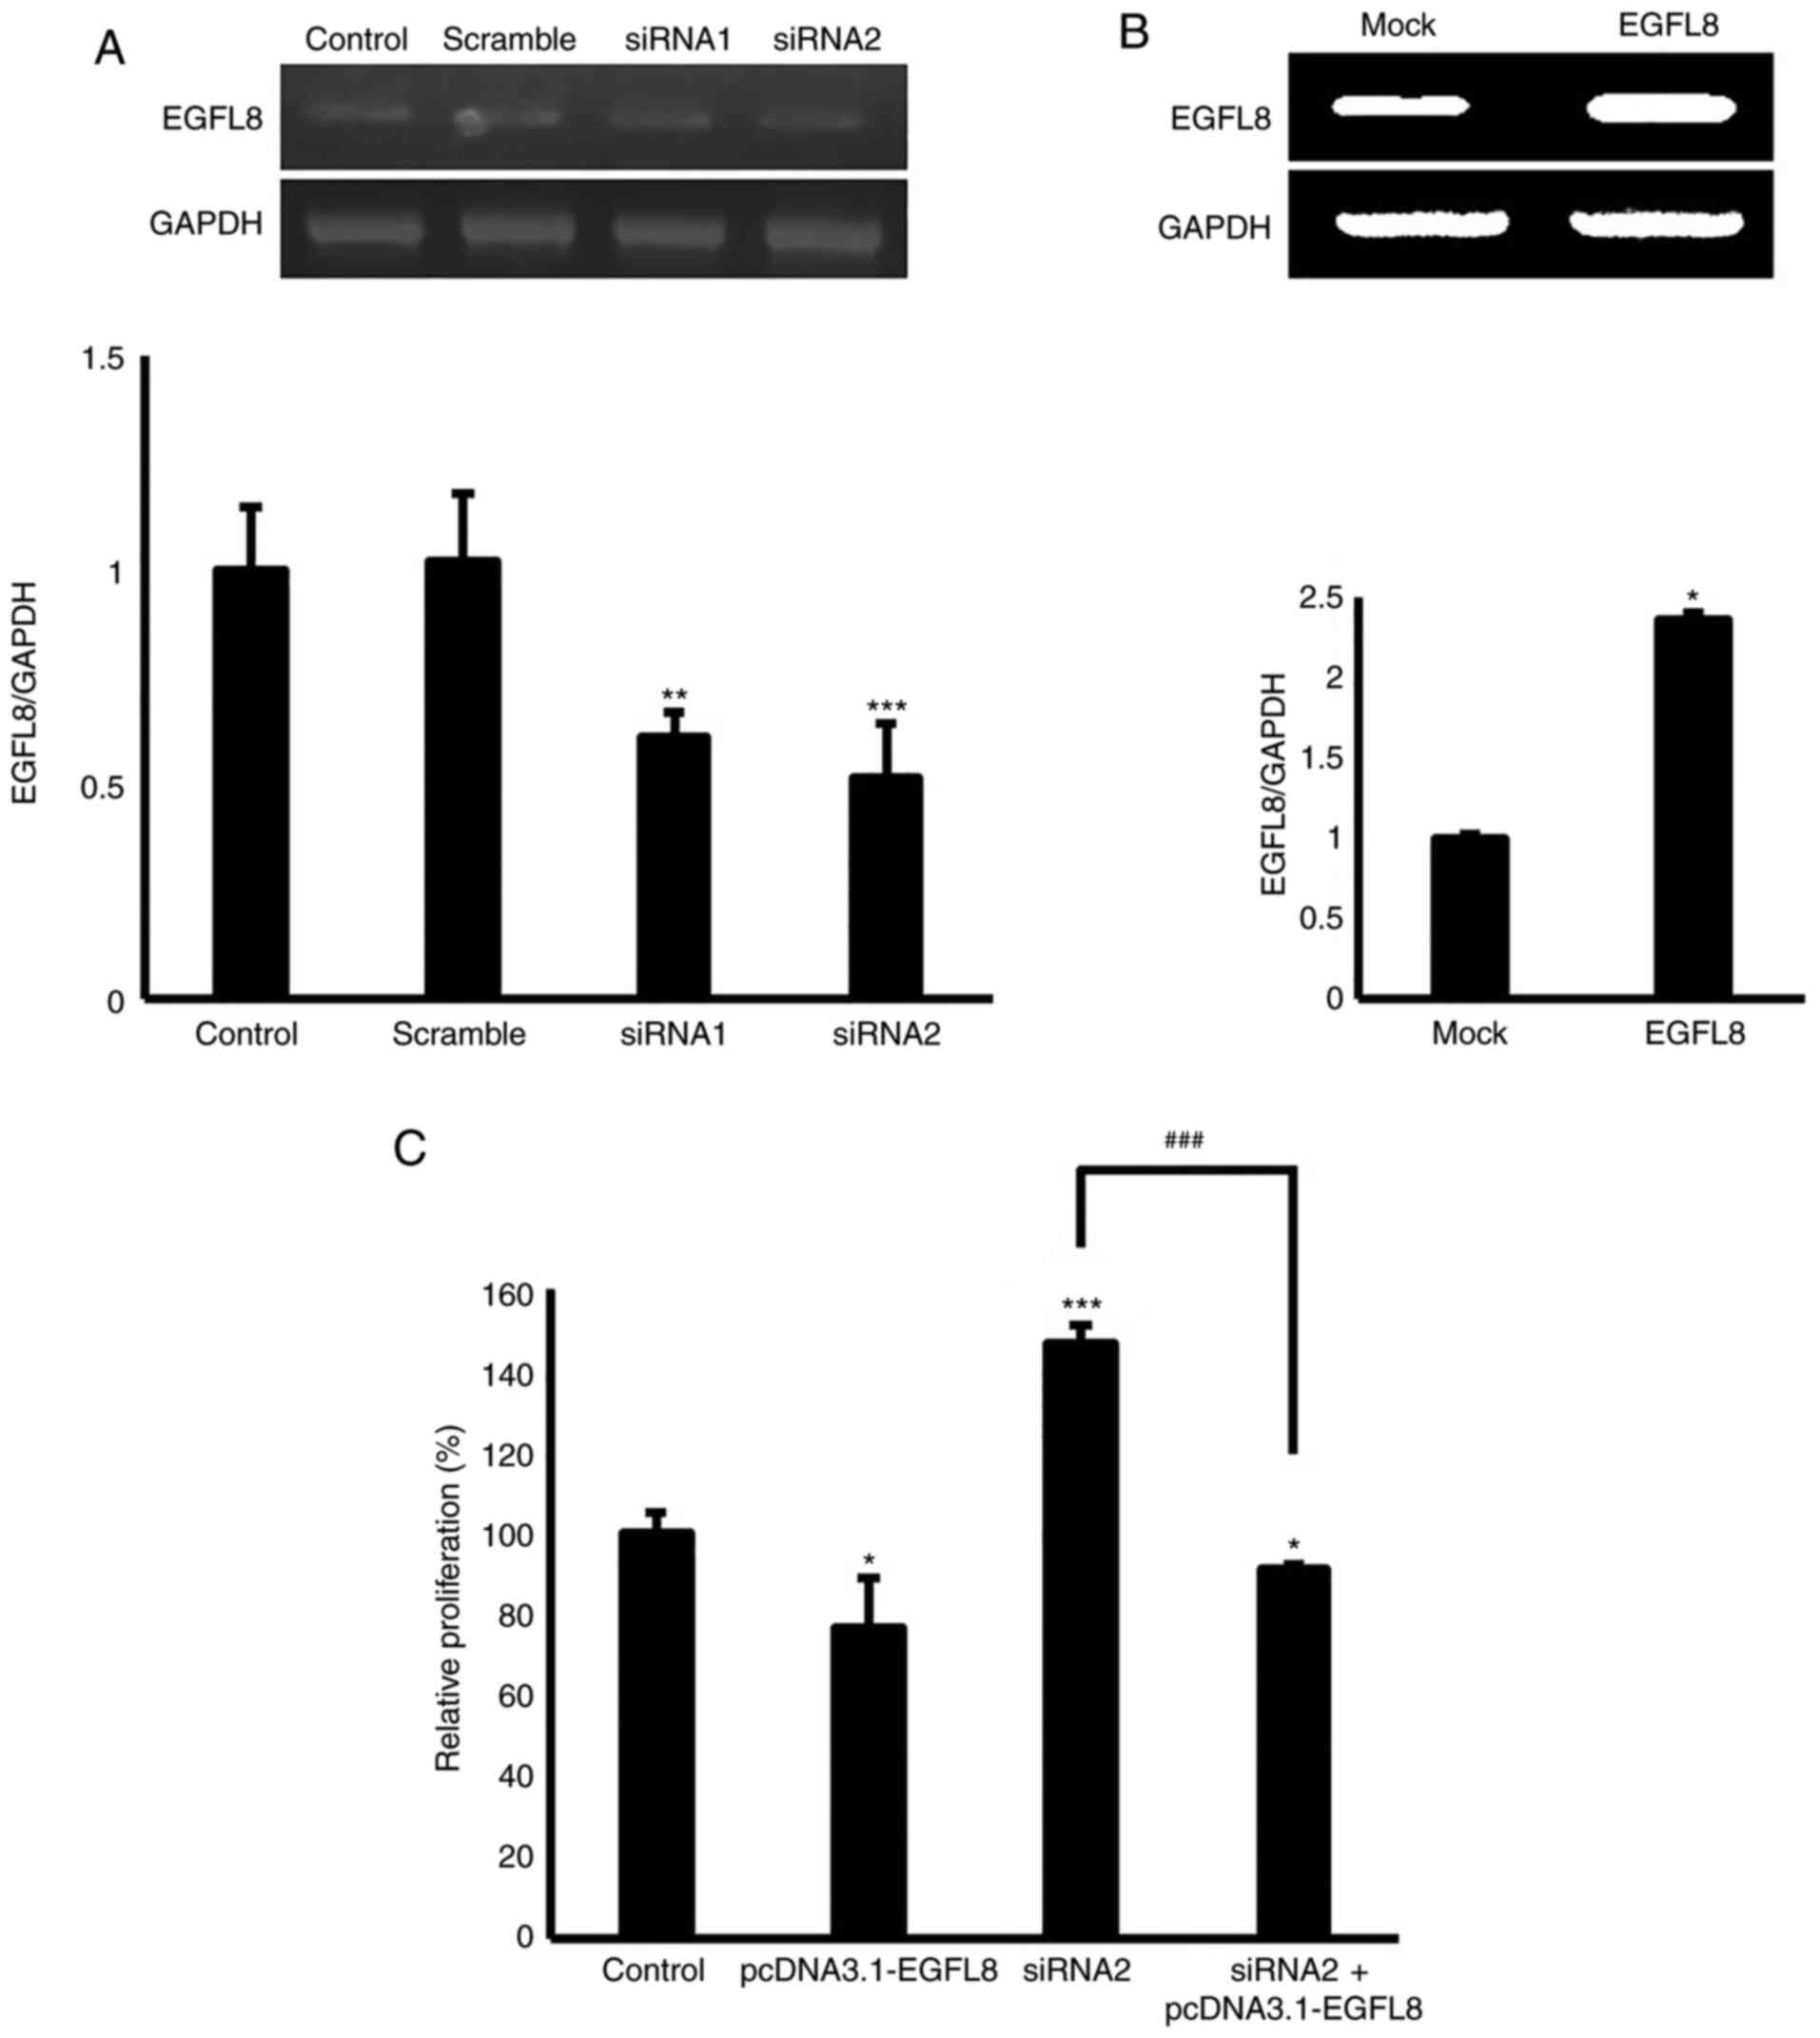
To verify efficient EGFL8 transfection and
knockdown, cTECs transfected with pcDNA3.1-EGFL8 or EGFL8 siRNA
were analyzed by RT-PCR. EGFL8 mRNA expression was analyzed in
EGFL8-overexpressing and -silenced cTECs (Fig. 1A and B). To evaluate the
regulatory effects of EGFL8 on cell proliferation, cTECs stably
transfected with EGFL8 expression vector or EGFL8 siRNA were
cultured for 48 h. As shown in Fig.
1C, cell viability was determined in EGFL8-overexpressing and
-silenced cTECs and compared with that of the controls. EGFL8
overexpression reduced cell proliferation, whereas EGFL8 knockdown
enhanced cell proliferation (Fig.
1C). Furthermore, it was demonstrated that cTECs were
successfully 'rescued' from EGFL8 siRNA-mediated cell proliferation
when co-transfected with siRNA and plasmid containing the EGFL8
gene, verifying the selectivity and specificity of the knockdown
and overexpression of the EGFL8 gene (Fig. 1C).
Identification of DEGs induced by EGFL8
overexpression or silencing
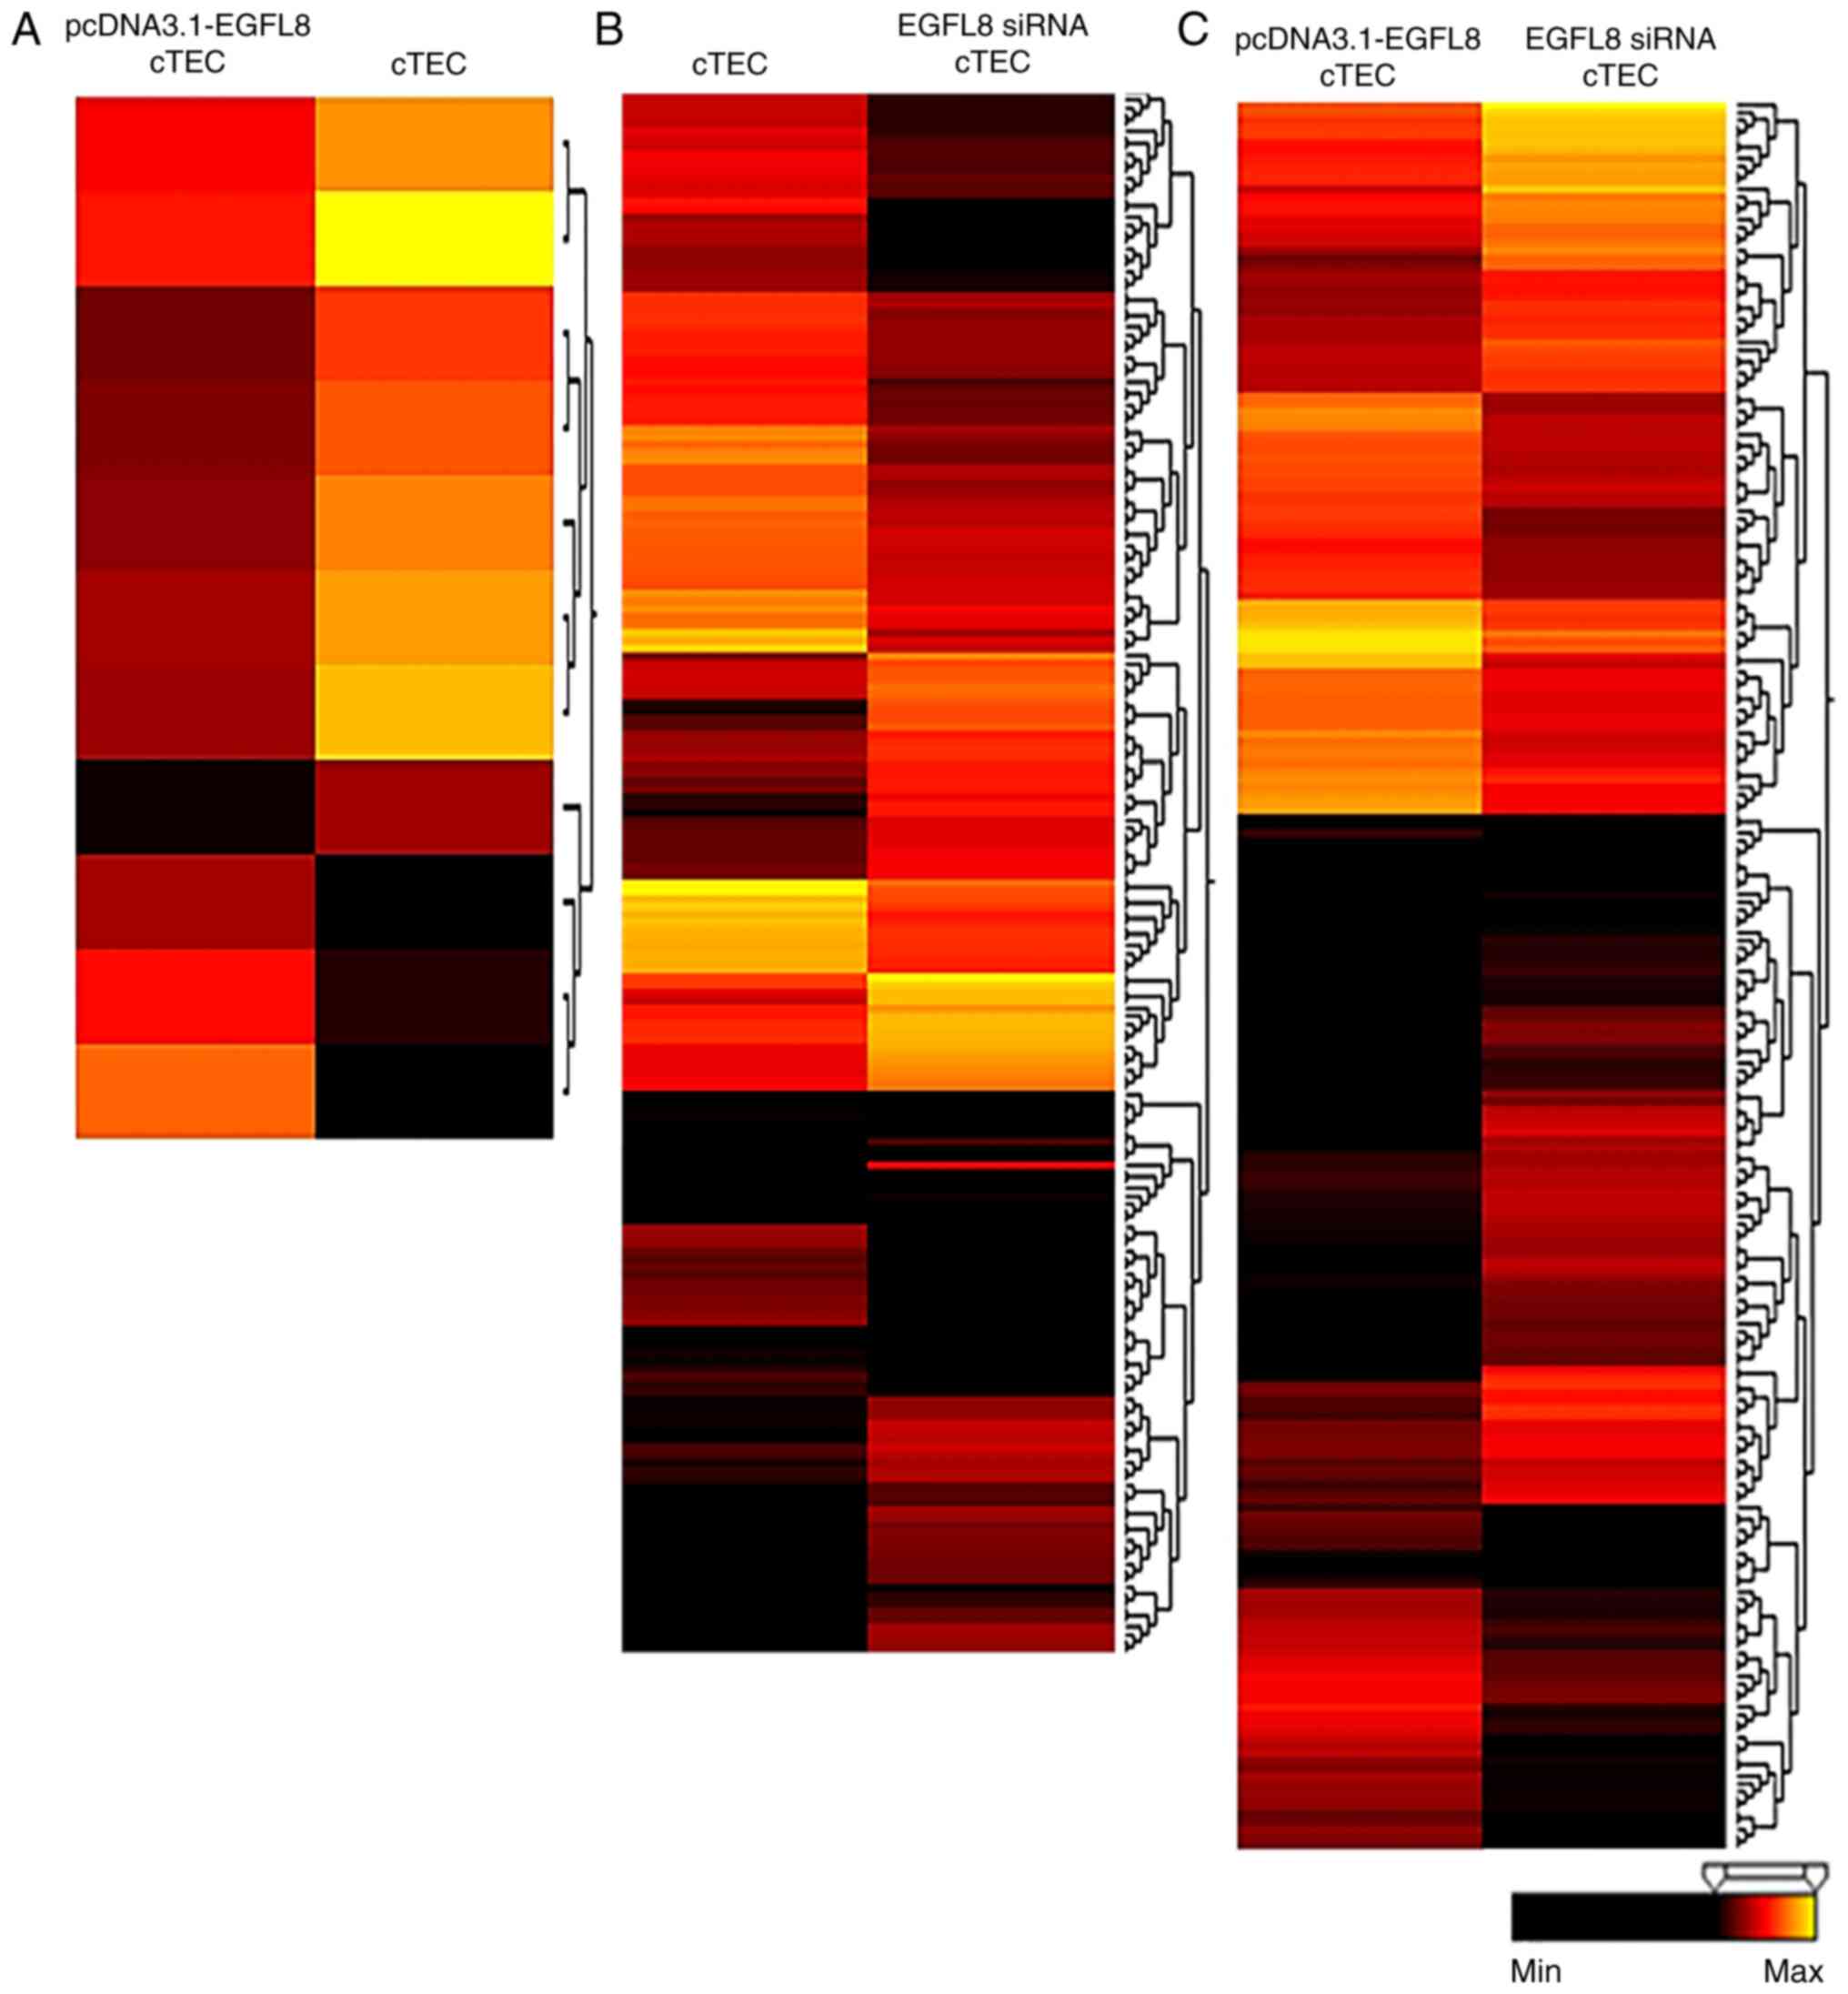
Microarray analysis was used to determine the gene
expression profiles of EGFL8-overexpressing and -silenced cTECs.
RNAs obtained from the pcDNA3.1-EGFL8-, EGFL8 siRNA-transfected
cells, and the mock vector- and scrambled siRNA-transfected cells
were amplified, fragmented, labeled and hybridized to Affymetrix
GeneChip microarrays containing 28,853 gene-level probe sets. From
28,853 probe sets on the GeneChip® Mouse Gene 1.0 ST
arrays, 43 genes (>2-fold change, P<0.05) were differentially
expressed in the cTECs overexpressing EGFL8 compared to the control
cells (Table II). A hierarchical
clustering analysis revealed that 10 of these genes were
upregulated and 33 were downregulated (Fig. 2A and Table II). Additionally, 390 genes
(>2-fold change, P<0.05) were differentially expressed in the
EGFL8-silenced cTECs compared to the control cells (Table II). A hierarchical clustering
analysis revealed that 192 of these genes were upregulated and 198
were downregulated (Fig. 2B and
Table II). Furthermore, 458
genes (>2-fold change, P<0.05) were differentially expressed
in the EGFL8-silenced cTECs compared to the EGFL8-overexpressing
cells (Table II). A hierarchical
clustering analysis showed that 289 of these genes were upregulated
and 169 were downregulated (Fig.
2C and Table II).
| Table IIHierarchical clustering analysis of
differentially expressed genes profile of epidermal growth
factor-like domain 8-overexpressing and -silenced cortical thymic
epithelial cells. |
Table II
Hierarchical clustering analysis of
differentially expressed genes profile of epidermal growth
factor-like domain 8-overexpressing and -silenced cortical thymic
epithelial cells.
| Cell group | Upregulation | Downregulation | Total probes |
|---|
| pcDNA3.1 EGFL8 vs.
mock | 10 | 33 | 43 |
| EGFL8 siRNA vs.
scramble | 192 | 198 | 390 |
| pcDNA3.1 EGFL8 vs.
EGFL8 siRNA | 289 | 169 | 458 |
GO analysis of DEGs induced by EGFL8
overexpression or silencing
To investigate the biological significance of DEGs
induced by EGFL8 overexpression or silencing in cTECs, KEGG pathway
analysis was performed. A total of 8 significantly enriched
pathways associated with the DEGs were identified. Among the
enriched pathways in the upregulated and downregulated DEGs,
cytokine-cytokine interaction, focal adhesion, axon guidance, p53
signaling, endocytosis, pathways in cancer, steroid biosynthesis
and terpenoid backbone biosynthesis of TECs were annotated
(P<0.05; Table III).
| Table IIIKyoto Encyclopedia of Genes and
Genomes enrichment analysis of biological pathways. |
Table III
Kyoto Encyclopedia of Genes and
Genomes enrichment analysis of biological pathways.
| KEGG analysis | Expression | Enriched gene | Gene
description | Fold change | P-value |
|---|
| Cytokine-cytokine
receptor interaction | Upregulated | Cxcl10 | Chemokine (C-X-C
motif) ligand 10 | 3.753 | 0.009 |
| Cxcl16 | Chemokine (C-X-C
motif) ligand 16 | 2.86 | |
| Cxcl5 | Chemokine (C-X-C
motif) ligand 5 | 2.813 | |
| Vegfa | Vascular
endothelial growth factor-A | 2.741 | |
| Osmr | Oncostatin M
receptor | 2.643 | |
| Fas | Fas (TNF receptor
super family member 6) | 2.506 | |
| Inhbe | Inhibin beta E | 2.2 | |
| Downregulated | Pdgfc | Platelet-derived
growth factor, C polypeptide | 2.082 | |
| Inhba | Inhibin beta-A | 2.535 | |
| Figf | c-fos induced
growth factor | 2.644 | |
| Met | MET
proto-oncogene | 2.676 | |
| Cxcl12 | Chemokine (C-X-C
motif) ligand 12 | 2.705 | |
| Il18rap | Interleukin 18
receptor accessory protein | 2.822 | |
| Focal adhesion | Upregulated | Vegfa | Vascular
endothelial growth factor-A | 2.741 | 0.005 |
| Fyn | Fyn
proto-oncogene | 2.066 | |
| Ccnd2 | Cyclin D2 | 2.012 | |
| Downregulated | Ccnd1 | Cyclin D1 | 3.138 | |
| Pdgfc | Platelet-derived
growth factor, C polypeptide | 2.607 | |
| Col3a1 | Collagen, Type III,
alpha 1 | 2.353 | |
| Thbs1 | Thrombospondin
1 | 2.042 | |
| Igf1r | Insulin-like growth
factor 1 receptor | 2.082 | |
| Cav2 | Caveolin 2 | 2.368 | |
| Cav1 | Caveolin 1,
caveolae protein | 2.676 | |
| Figf | c-fos induced
growth factor | 2.644 | |
| Met | MET
proto-oncogene | 2.676 | |
| Axon guidance | Upregulated | Rnd1 | Rho family GTPase
1 | 2.477 | 0.003 |
| Fyn |
Fynproto-oncogene | 2.066 | |
| Downregulated | Sema7a | Sema domain,
Semaphorin 7A | 2.040 | |
| Sema3c | Sema domain,
Semaphorin 3C | 2.098 | |
| Sema3e | Sema domain,
Semaphorin 3E | 2.139 | |
| Met | MET
proto-oncogene | 2.676 | |
| Cxcl12 | Chemokine (C-X-C
motif) ligand 12 | 2.705 | |
| Epha4 | EPH receptor
A4 | 2.861 | |
| Nrp1 | Neuropilin 1 | 3.669 | |
| Sema3d | Sema domain,
Semaphorin 3D | 4.986 | |
| p53 signaling
pathway | Upregulated | Gadd45a | Growth arrest and
DNA-damage-inducible 45 alpha | 4.074 | 0.02 |
| Fas | Fas (TNF receptor
super family member 6) | 2.506 | |
| Sesn2 | Sestrin 2 | 2.338 | |
| Ccnd2 | Cyclin D2 | 2.012 | |
| Downregulated | Ccnd1 | Cyclin D1 | 2.042 | |
| Thbs1 | Thrombospondin
1 | 2.334 | |
| Endocytosis | Upregulated | Pip5k1b |
Phosphatidylinositol-4-phosphate 5-kinase,
type 1 beta | 2.208 | 0.039 |
| H2-K1 | Histocompatibility
2, K1, K region | 2.1 | |
| H2-Q6 | Histocompatibility
2, Q region locus 6 | 2.05 | |
| Downregulated | Igfl1r | Insulin like growth
factor 1 receptor | 2.368 | |
| Adrb2 | Adrenergic
receptor, beta 2 | 2.481 | |
| Hspa1a | Heat shock protein
1A | 2.572 | |
| Ehd2 | EH domain
containing 2 | 2.607 | |
| Met | MET
proto-oncogene | 2.676 | |
| Tfrc | Transferrin
receptor | 2.736 | |
| Ldlr | Low density
liproprotein receptor | 4.541 | |
| Pathways in
cancer | Upregulated | Fgf21 | Fibroblast growth
factor 21 | 3.138 | 0.002 |
| Nos2 | Nitric oxide
synthase 2, inducible | 3.097 | |
| Vegfa | Vascular
endothelial growth factor-A | 2.741 | |
| Rb1 | Retinoblastoma
1 | 2.607 | |
| Fas | Fas (TNF receptor
superfamily member 6) | 2.506 | |
| Nfkb2 | Nuclear factor of
kappa light polypeptide gene enhancer in B-cells 2, p49/p100 | 2.478 | |
| Fzd4 | Frizzled homolog 4
(Drosophila) | 2.368 | |
| Mitf |
Microphthalmia-associated transcription
factor | 2.353 | |
| Brca2 | Breast cancer
2 | 2.238 | |
| Stat1 | Signal transducer
and activator of transcription 1 | 2.171 | |
| Downregulated | Ccdn1 | Cyclin D1 | 2.042 | |
| Jup | Junction
plakoglobin | 2.14 | |
| Igf1r | Insulin like growth
factor 1 receptor | 2.368 | |
| Bmp4 | Bone morphogenetic
protein 4 | 2.637 | |
| Figf | c-fos-induced
growth factor | 2.644 | |
| Met | MET
proto-oncogene | 2.676 | |
| Fos | Fos
proto-oncogene | 3.391 | |
| Steroid
biosynthesis | Upregulated | Soat2 | Sterol
O-acyltransferase 2 | 3.395 | 0.000 |
| Downregulated | Sqle | Squalene
epoxidase | 2.040 | |
| Fdft1 |
Farnesyl-diphosphate farnesyltransferase
1 | 2.182 | |
| Hsd17b7 | Hydroxysteroid
17-beta dehydrogenase 7 | 2.468 | |
| Dhcr7 |
7-dehydrocholesterol reductase | 2.520 | |
| Nsdhl | NAD(P) dependent
steroid dehydrogenase-like | 2.917 | |
| Cyp51 | Cytochrome P450,
family 51 | 3.040 | |
| Dhcr24 |
24-Dehydrocholesterol reductase | 3.383 | |
| Terpenoid backbone
biosynthesis | Upregulated | - | - | - | 0.000 |
| Downregulated | Hmgcr |
3-Hydroxy-3-methylglutaryl-CoA
reductase | 2.002 | |
| Acat2 | Acetl-CoA
acetyltransferase 2 | 2.257 | |
| Mvd | Mevalonate
(diphospho) decarboxylase | 2.732 | |
| Idi1 |
Isopentenyl-diphosphate delta isomerase
1 | 3.507 | |
| Hmgcs1 |
3-Hydroxy-3-methylglutaryl-CoA synthase
1 | 3.797 | |
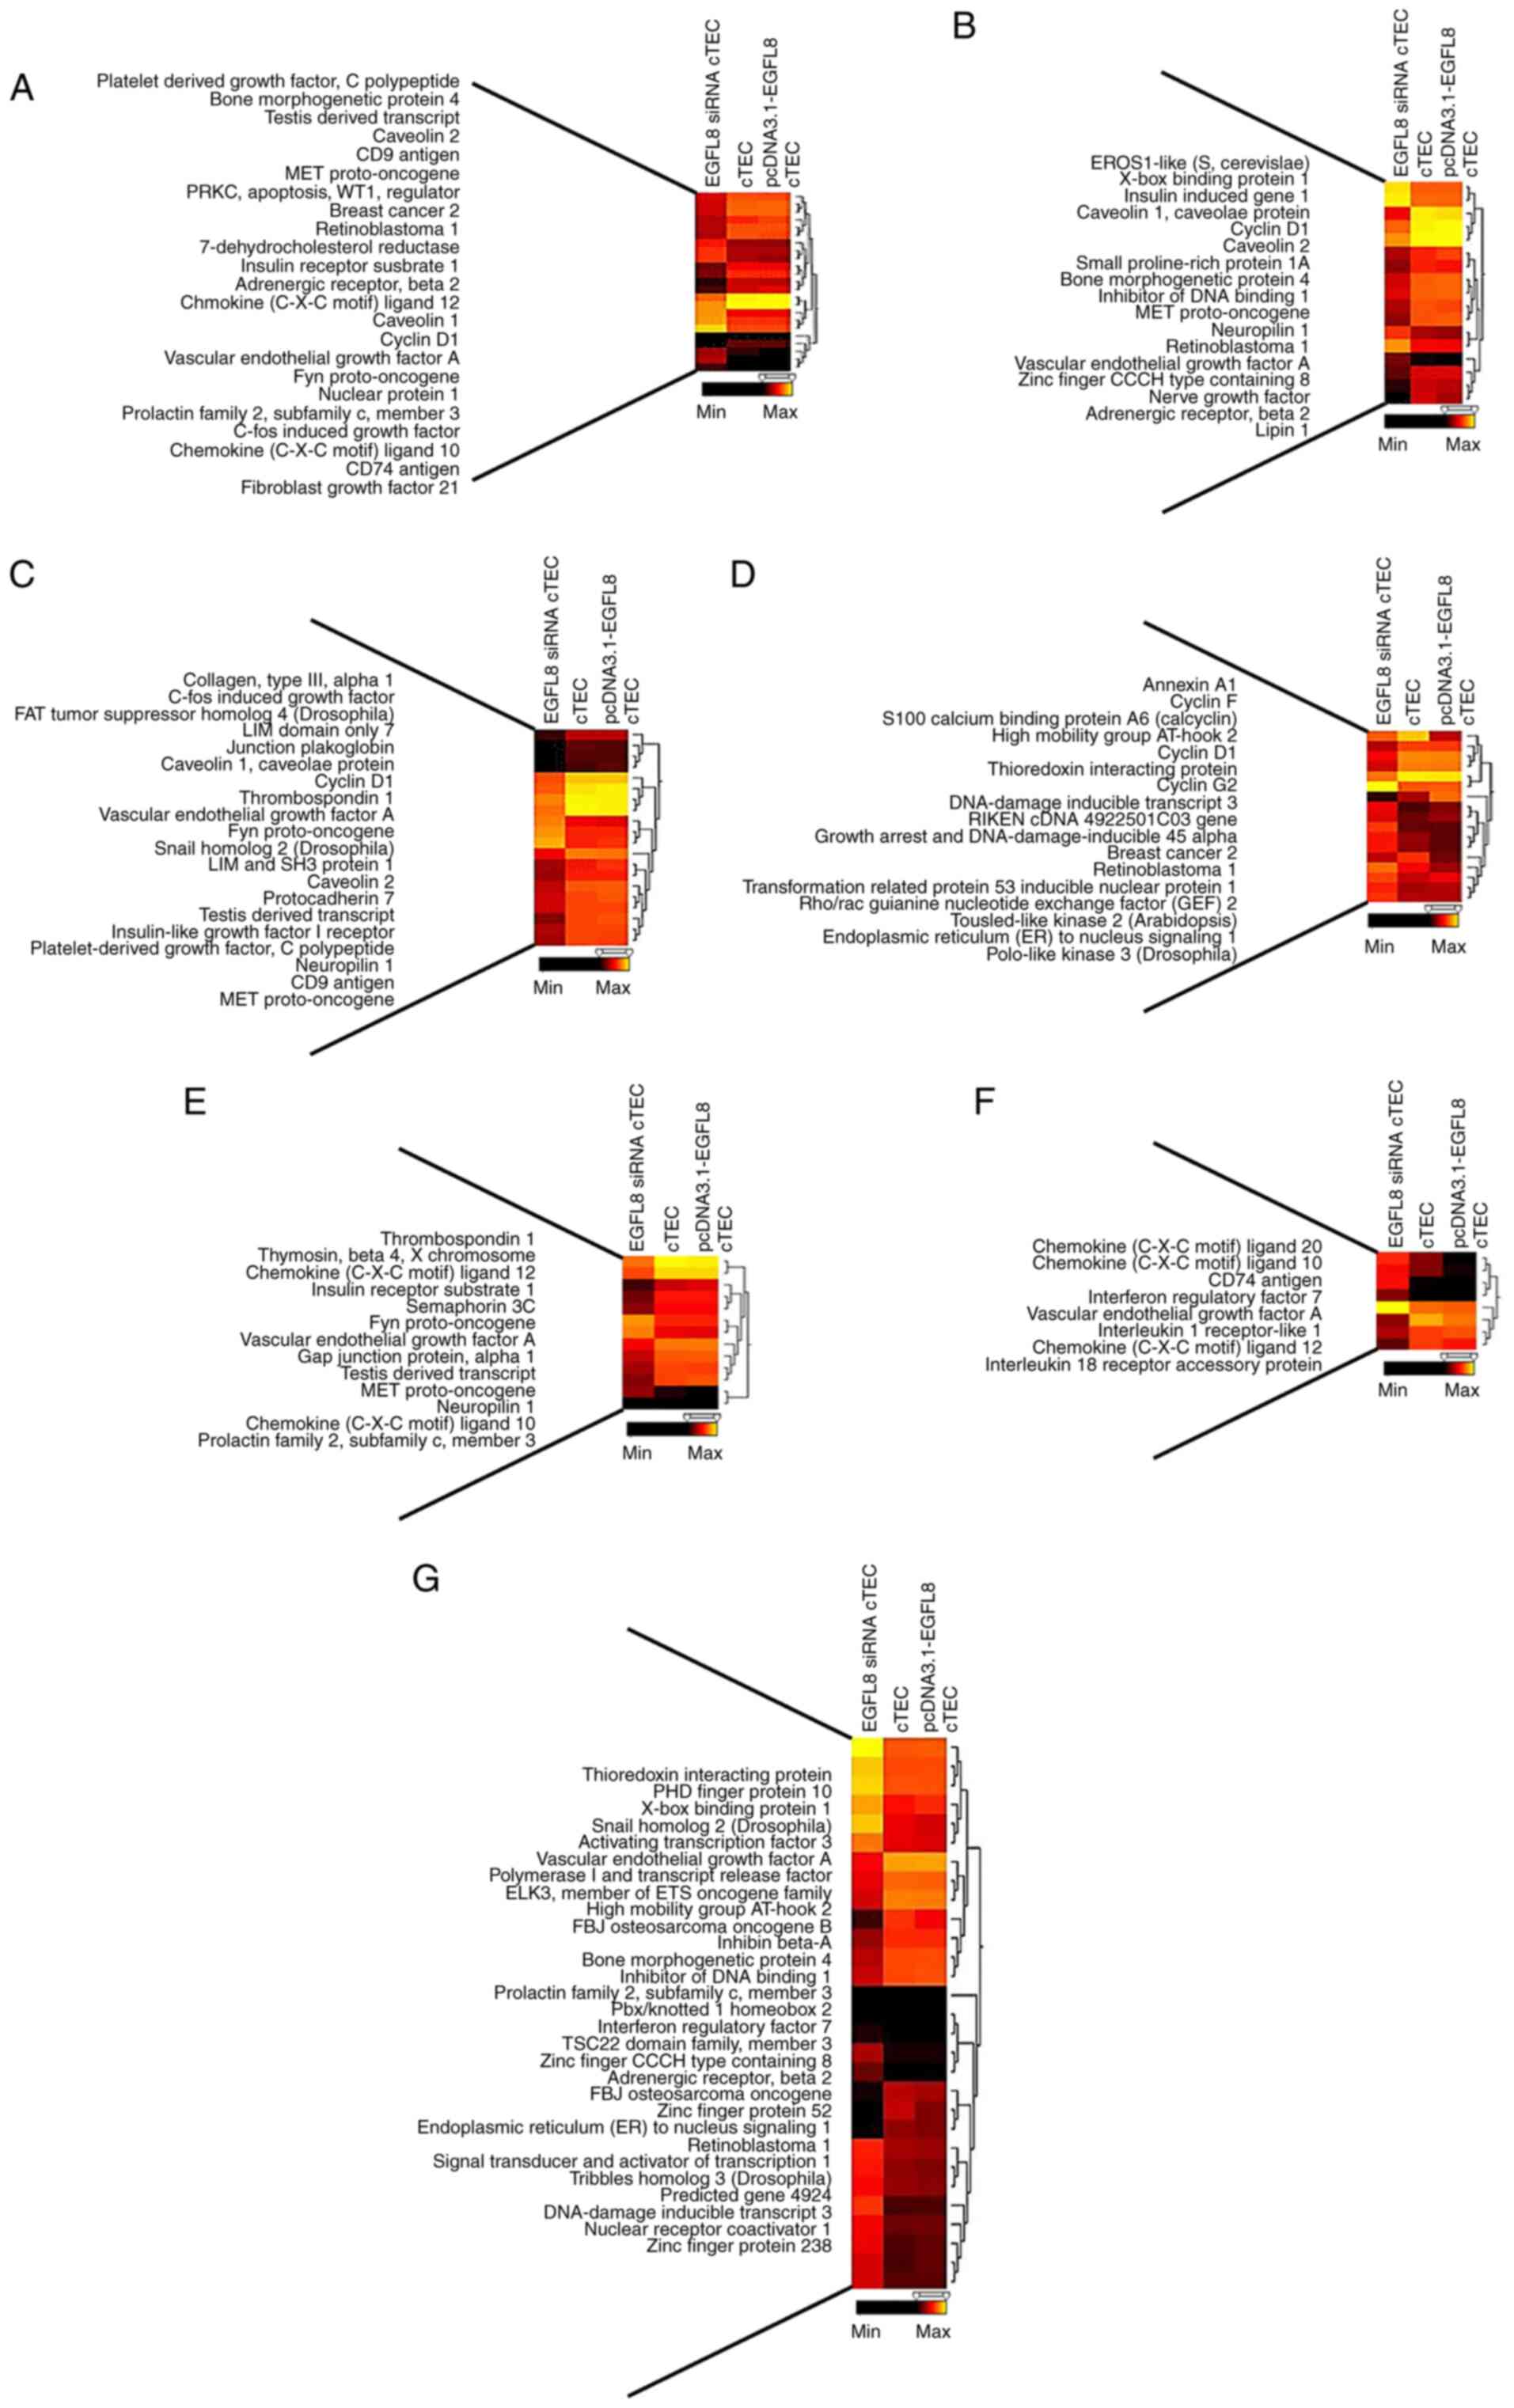
Furthermore, genes were categorized based on the GO
analysis, illustrated in Fig. 3.
The functions of DEGs were characterized using GO terms. GO was was
utilized to investigate the nature of the EGFL8-associated genes
identified by microarray data analyses. Fisher's exact test with
P<0.05 and gene frequency (gene count assigned to an annotation
term) of >2% was set as the threshold to select over-represented
GO biological processes. Enrichment in the processes of cell
proliferation, differentiation, adhesion, cycle and migration, as
well as in the regulation of immune responses and transcription was
noted.
Validation of DEGs induced by EGFL8
knockdown
To confirm the results of microarray analysis, the
expression patterns of genes associated with cell proliferation
were evaluated in EGFL8 siRNA-transfected cTECs. The FasL, CXCL10
and CXCL16 genes were selected on the basis of their potential role
in cell proliferation and adhesion. As shown in Fig. 4, EGFL8 knockdown upregulated the
expression levels of FasL, CXCL5, CXCL10, CXCL16 and CCL20, whereas
it downregulated those of Nrp1 in cTECs.
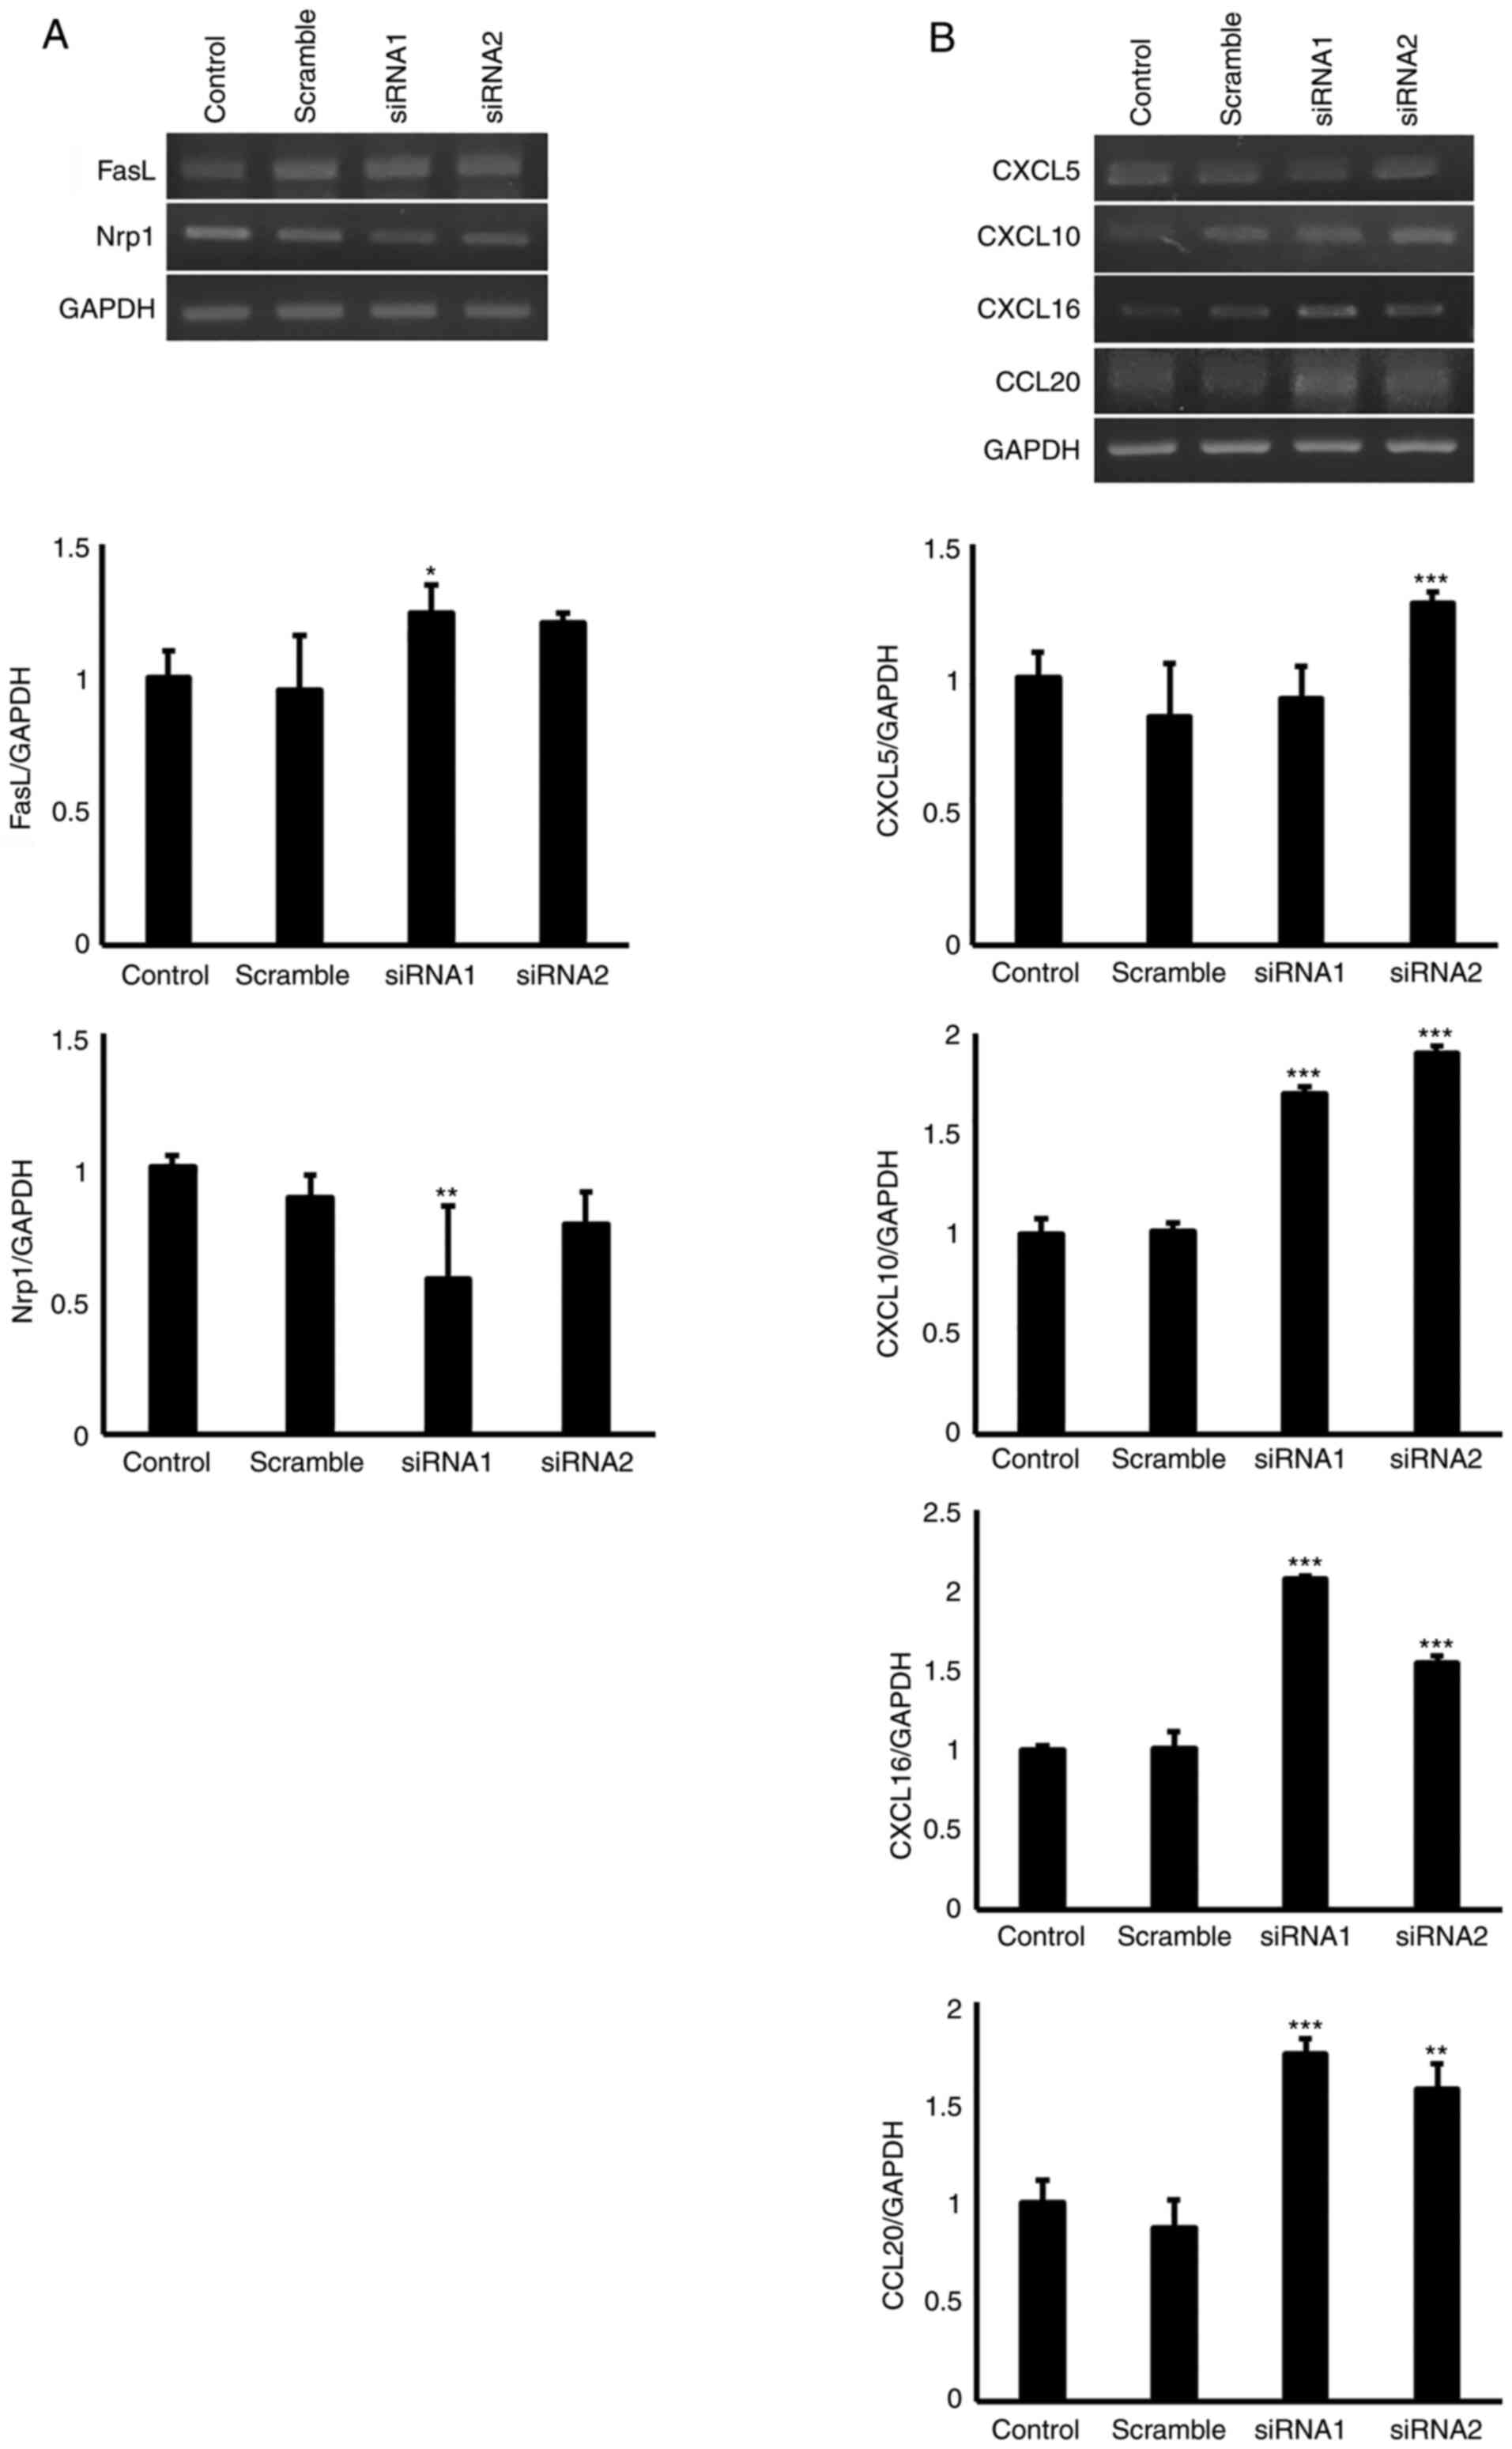 | Figure 4Mouse cTECs were transfected with
EGFL8 siRNA; EGFL8 knockdown increased the expression of (A) FasL
and Nrp1 and (B) CXCL5, CXCL10, CXCL16 and CCL20. Data were
analyzed using one-way ANOVA. *P<0.05,
**P<0.01, ***P<0.001. cTECs, cortical
thymic epithelial cells; EGFL8, epidermal growth factor-like domain
8; FasL, Fas ligand; Nrp1, neuropilin-1; CXCL, C-X-C motif
chemokine ligand; CCL20, chemokine ligand 20. |
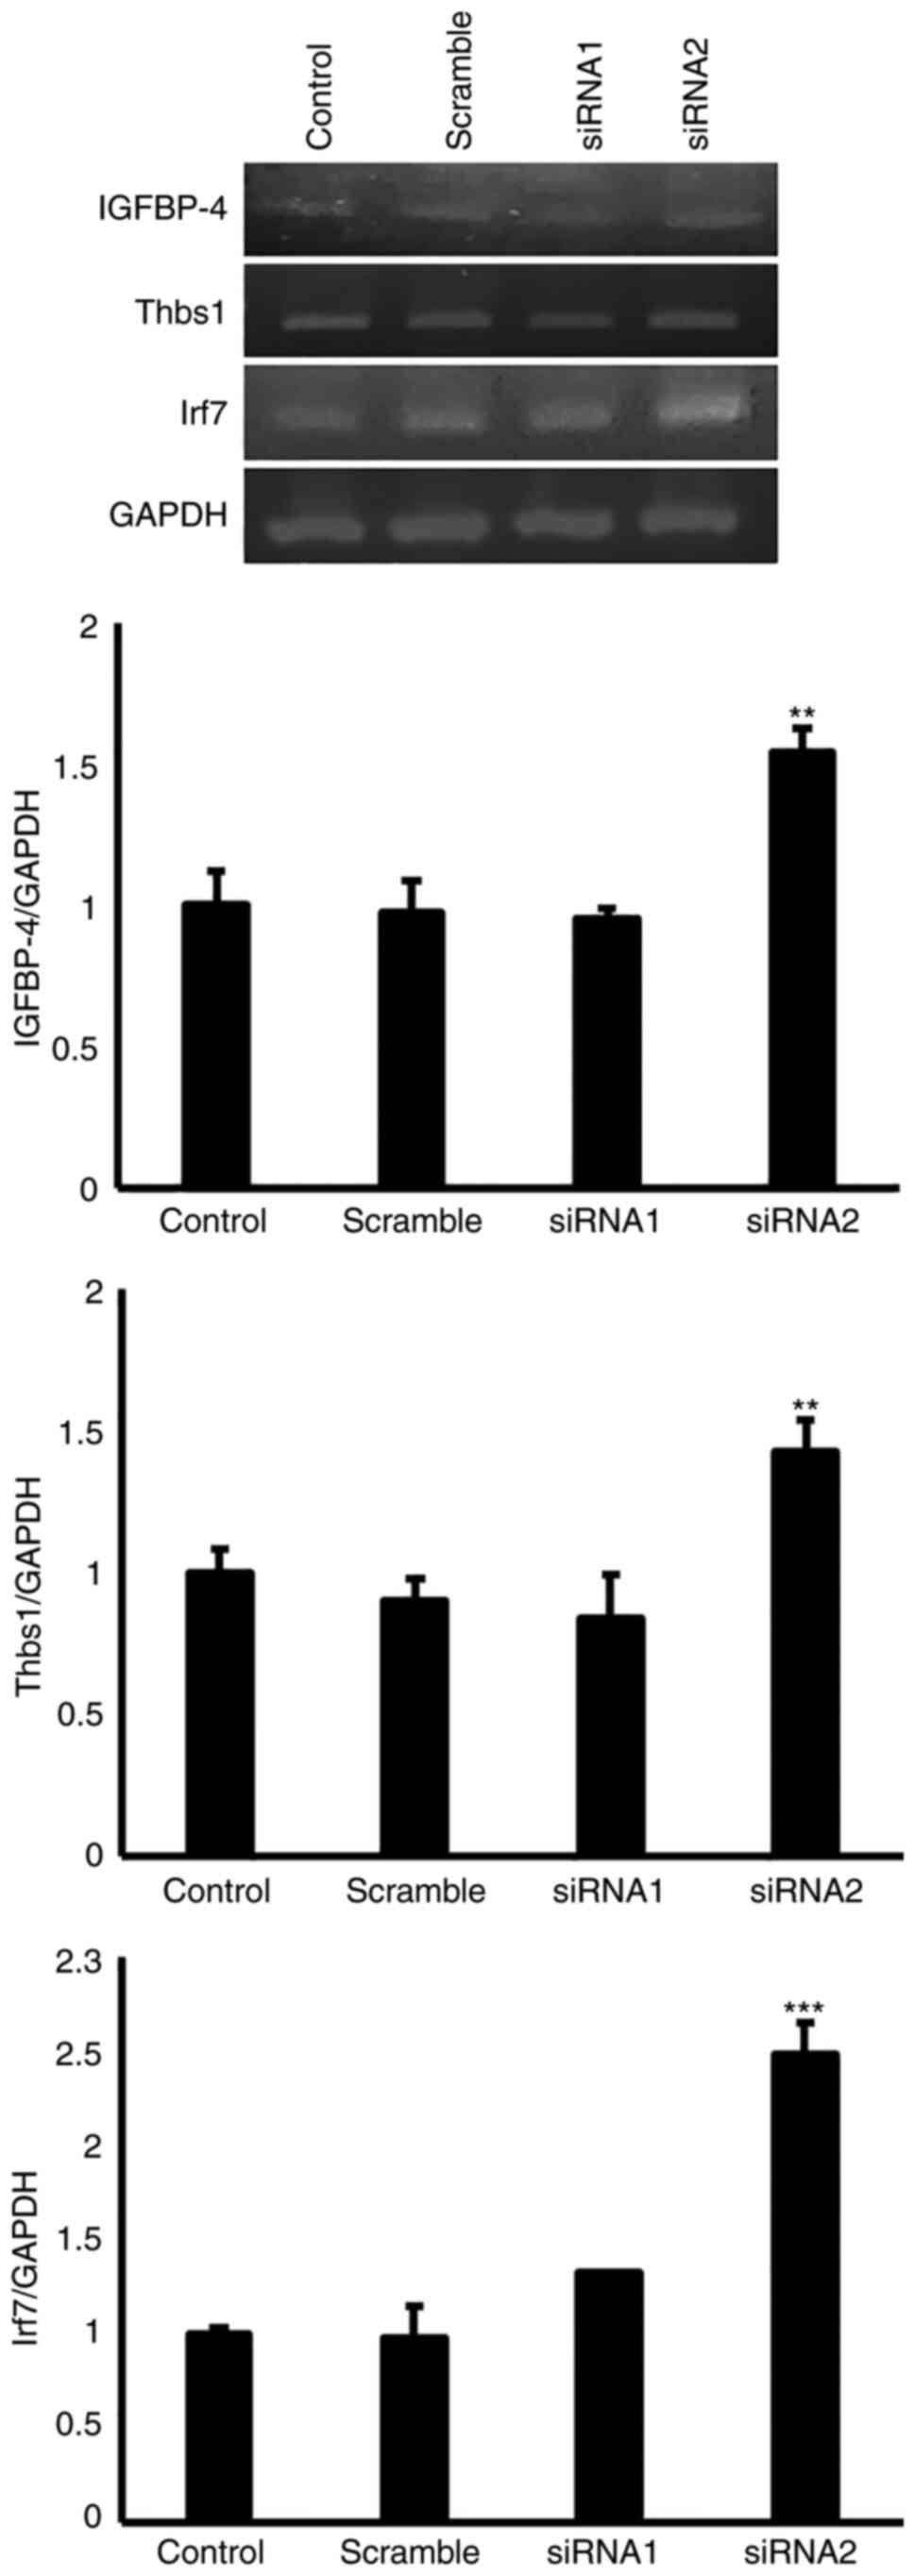
In the present study, the potential role of EGFL8 in
angiogenesis was evaluated. As shown in Fig. 5, EGFL8 knockdown reduced the
expression levels of Angptl, whereas it augmented those of VEGF-A,
CD74 and NF-κB2 in the cTECs. Furthermore, it was found that EGFL8
knockdown promoted the gene expression of IGFBP-4, Thbs1 and Irf7
in cTECs (Fig. 6).
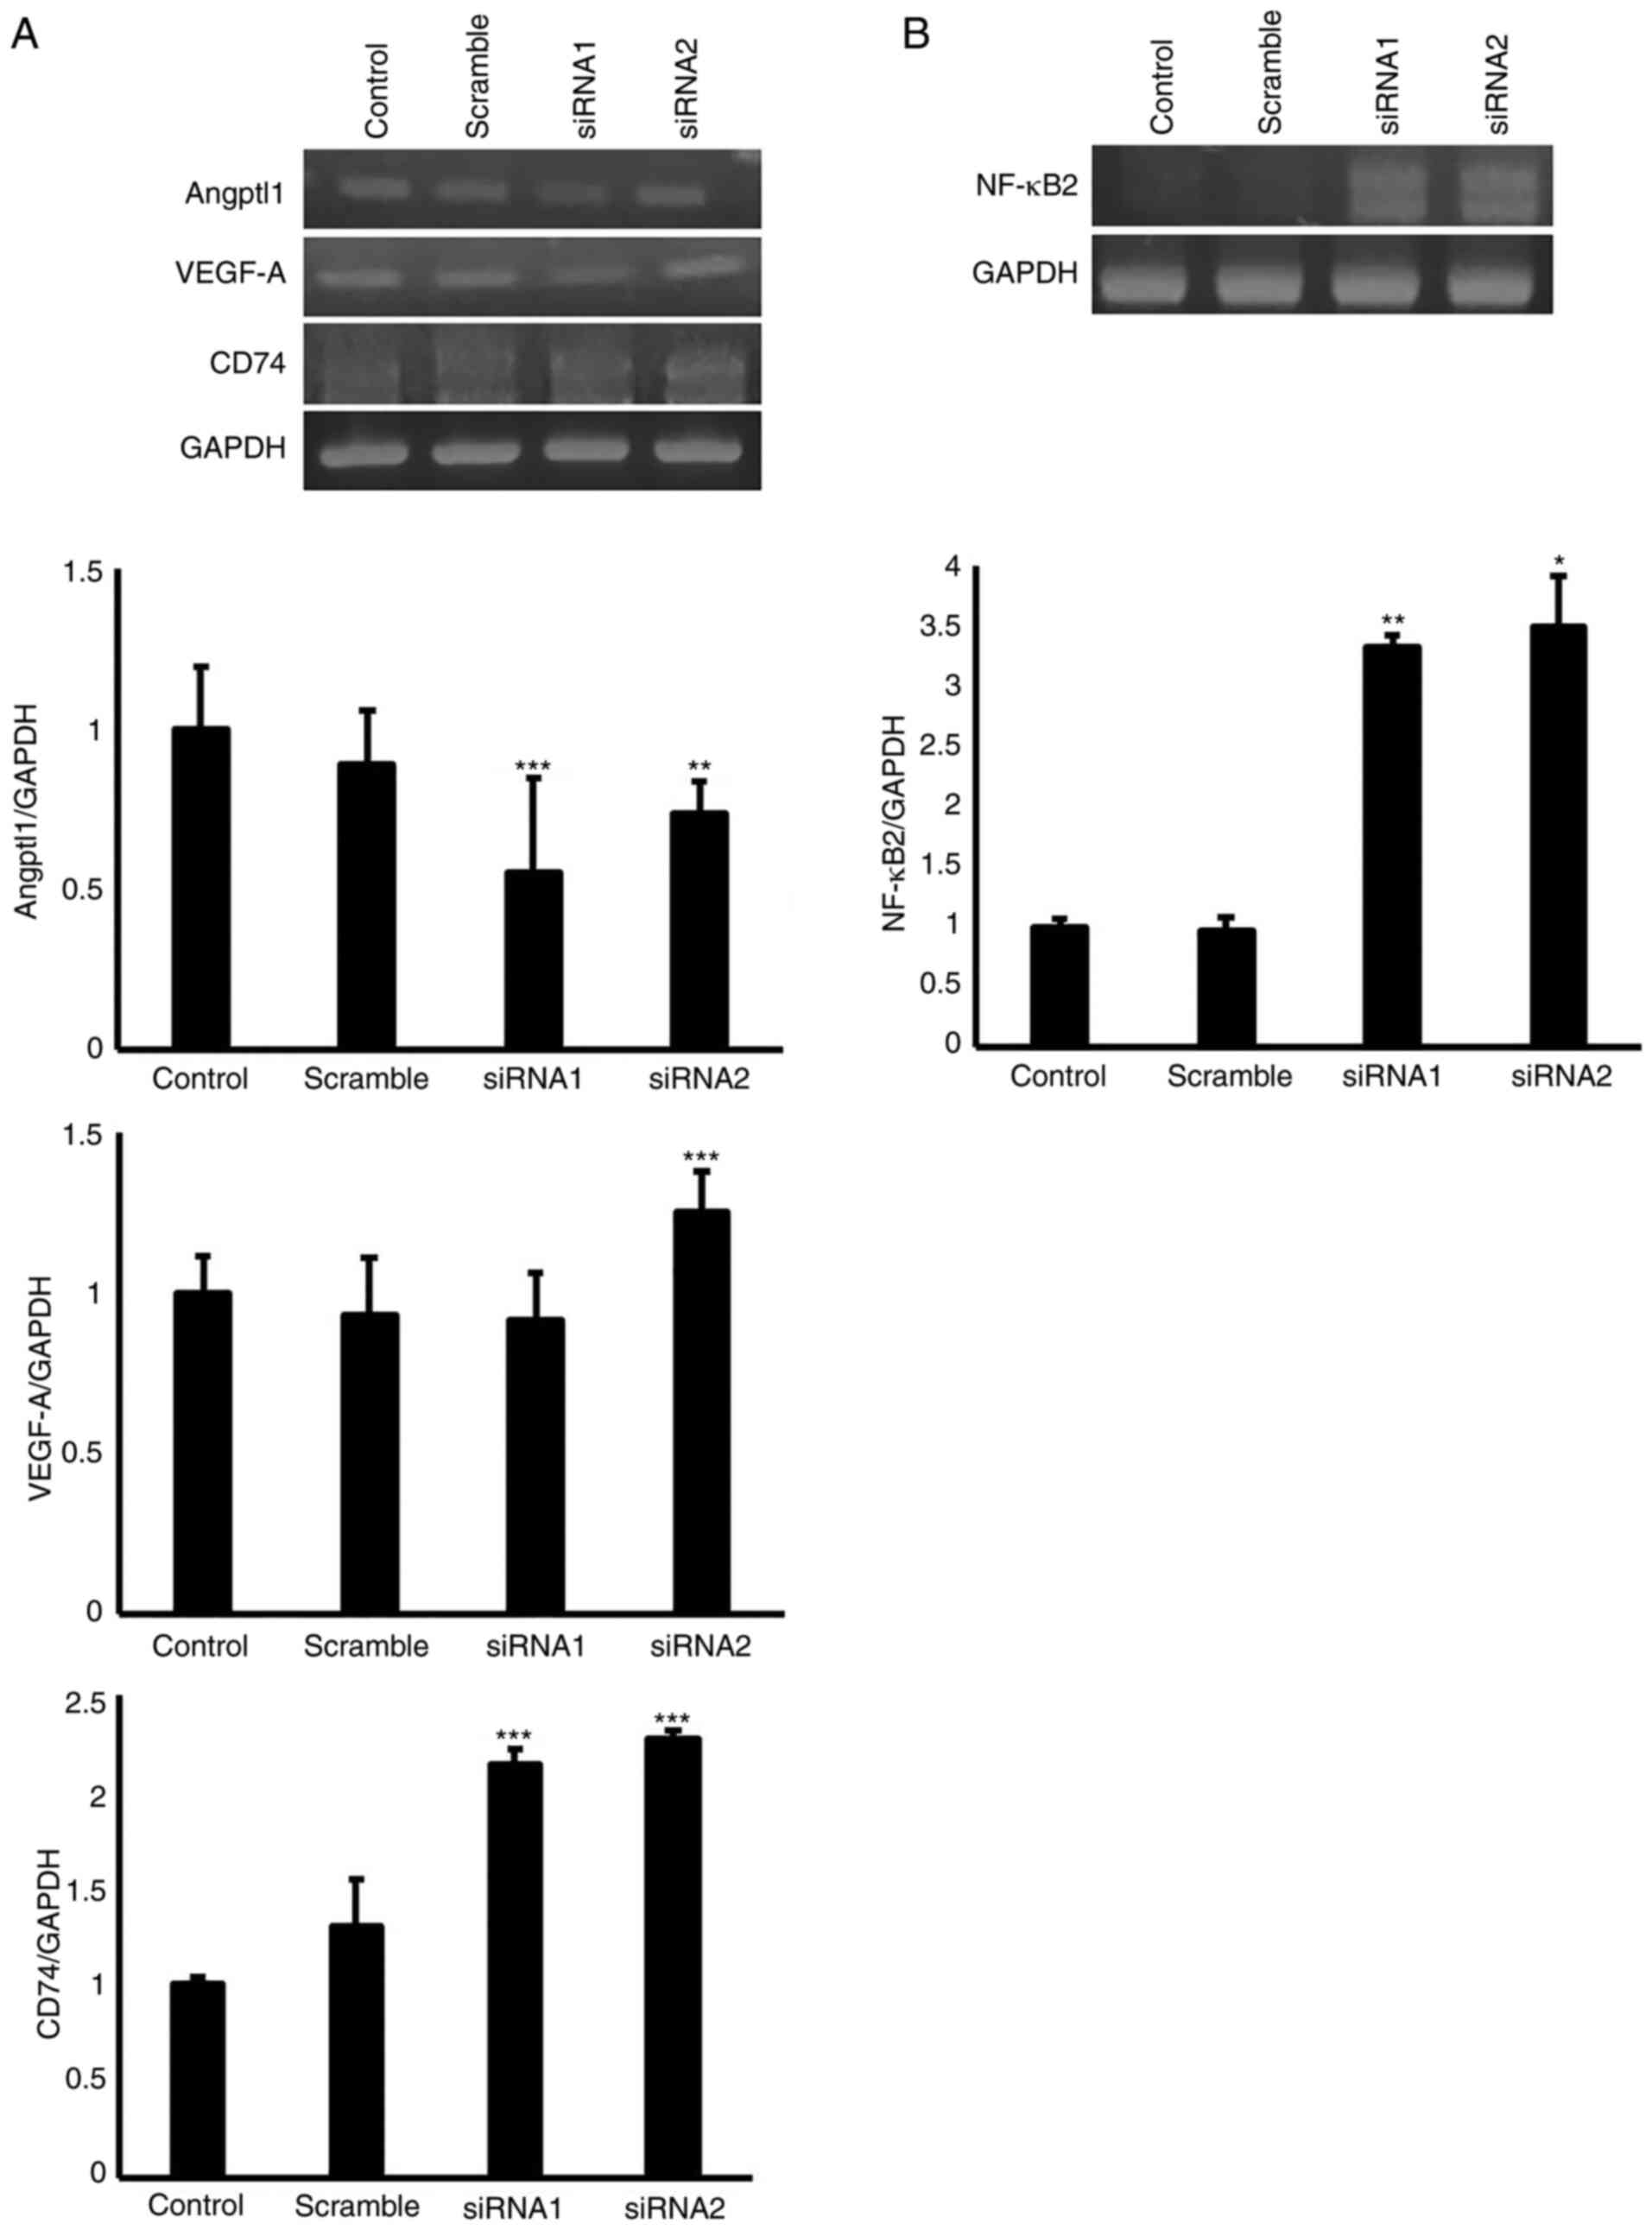 | Figure 5Mouse cTECs were transfected with
EGFL8 siRNA; EGFL8 knockdown (A) suppressed the gene expression of
Angptl1 but augmented that of VEGF-A, CD74, and (B) nuclear factor
κB subunit 2 (NF-κB2). Data were analyzed using one-way ANOVA.
*P<0.05, **P<0.01,
***P<0.001. cTECs, cortical thymic epithelial cells;
EGFL8, epidermal growth factor-like domain 8; Angptl1,
angiopoietin-like 1; VEGF-A, vascular endothelial growth factor-A;
CD74, cluster differentiation 74; NF-κB2, nuclear factor κB subunit
2. |
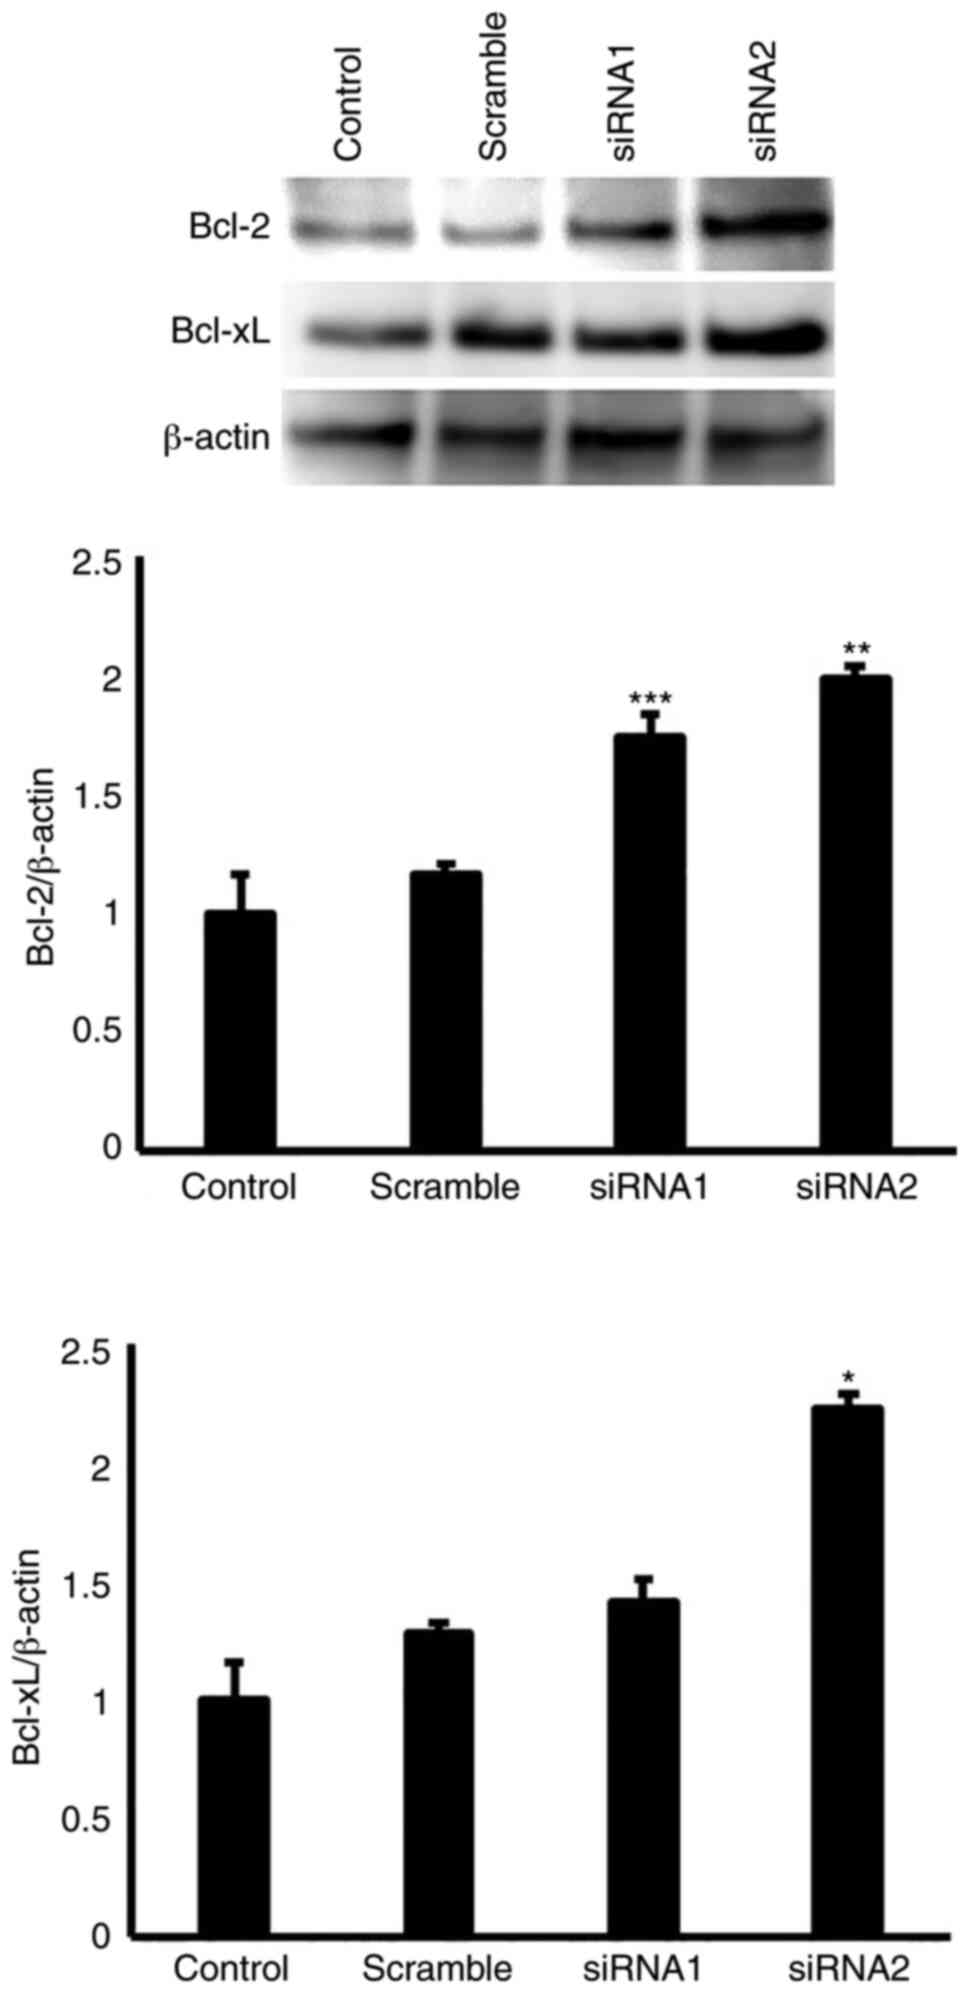
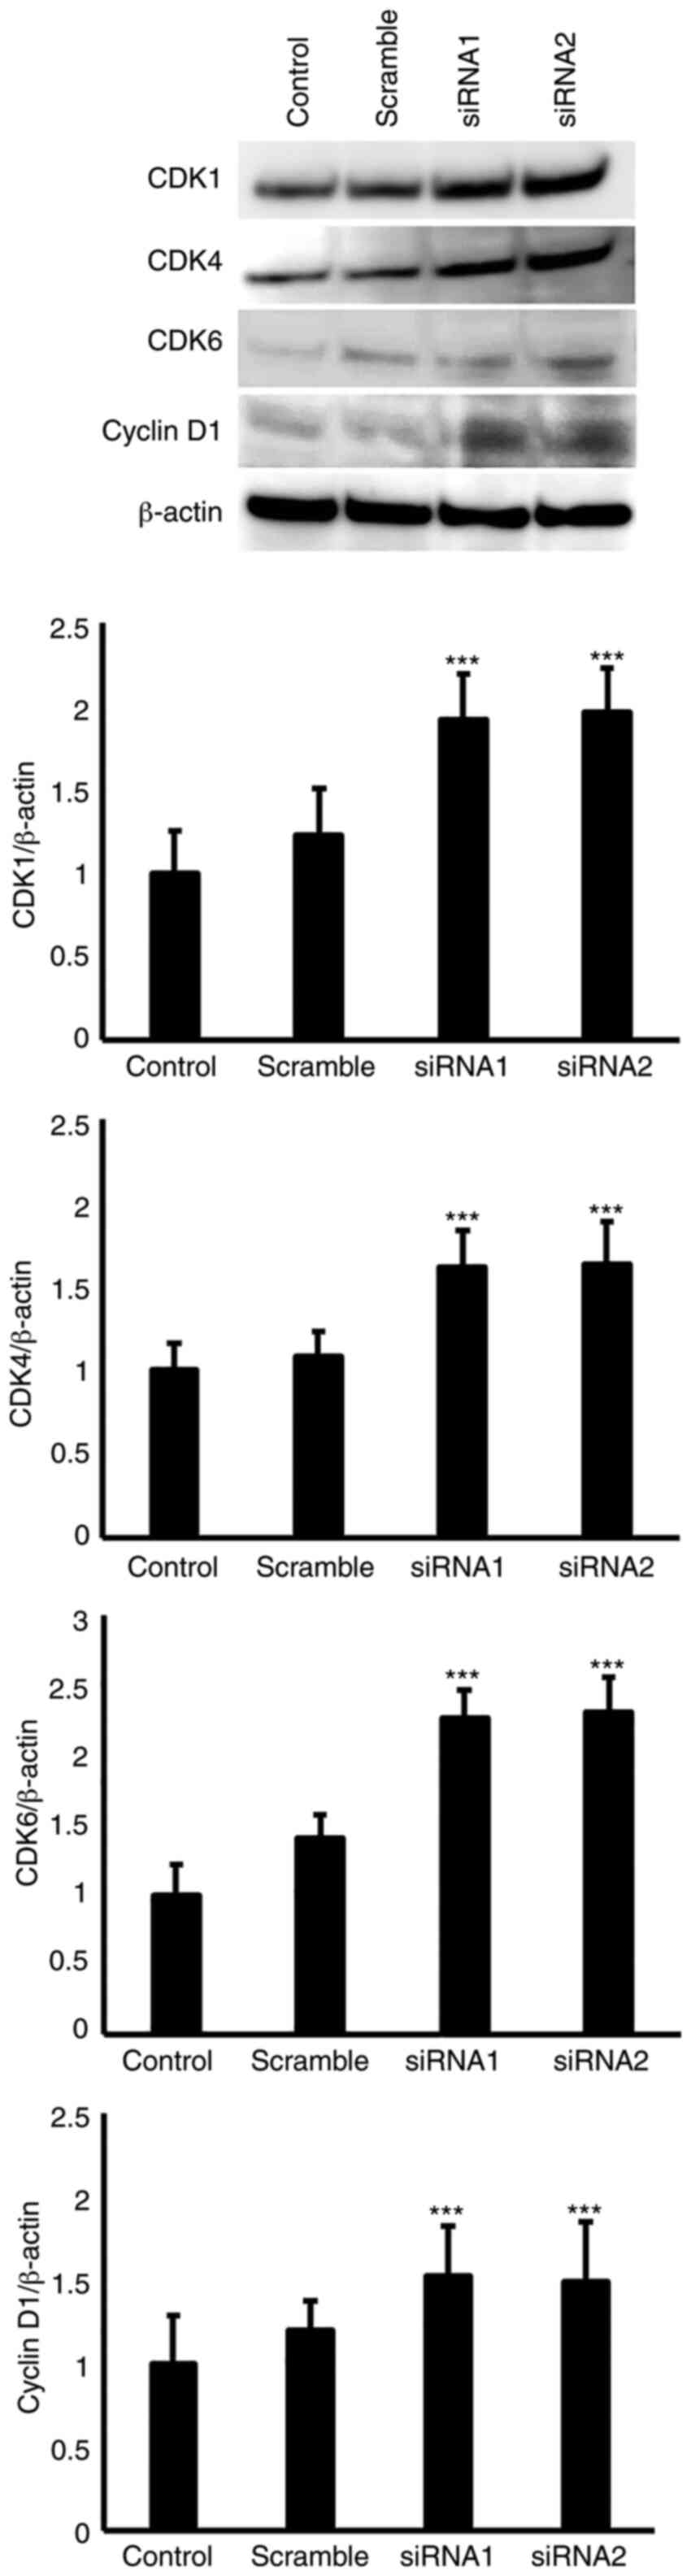
To determine the effects of EGFL8 on the expression
of apoptosis- and cell cycle-related proteins, EGFL8 siRNAs were
stably transfected into cTECs. Differential protein expression
levels of Bcl-2, Bcl-xL, CDK1, CDK4, CDK6 and cyclin D1 were
observed for the EGFL8-silenced cTECs. As shown in Fig. 7, EGFL8 knockdown increased the
expression of apoptosis-related molecules, Bcl-2 and Bcl-xL in the
cTECs. Additionally, EGFL8 knockdown enhanced the expression of the
key cell cycle regulatory molecules, CDK1, CDK4, CDK6 and cyclin D1
proteins in the cTECs (Fig.
8).
Interaction network analysis of DEGs
induced by EGFL8 overexpression or silencing in cTECs
To further investigate the key pathways utilized by
the identified DEGs, the analysis of multi-genic pathways depicting
possible molecular interactions that define biologic activities
based on related sets of DEGs was performed and visualized using
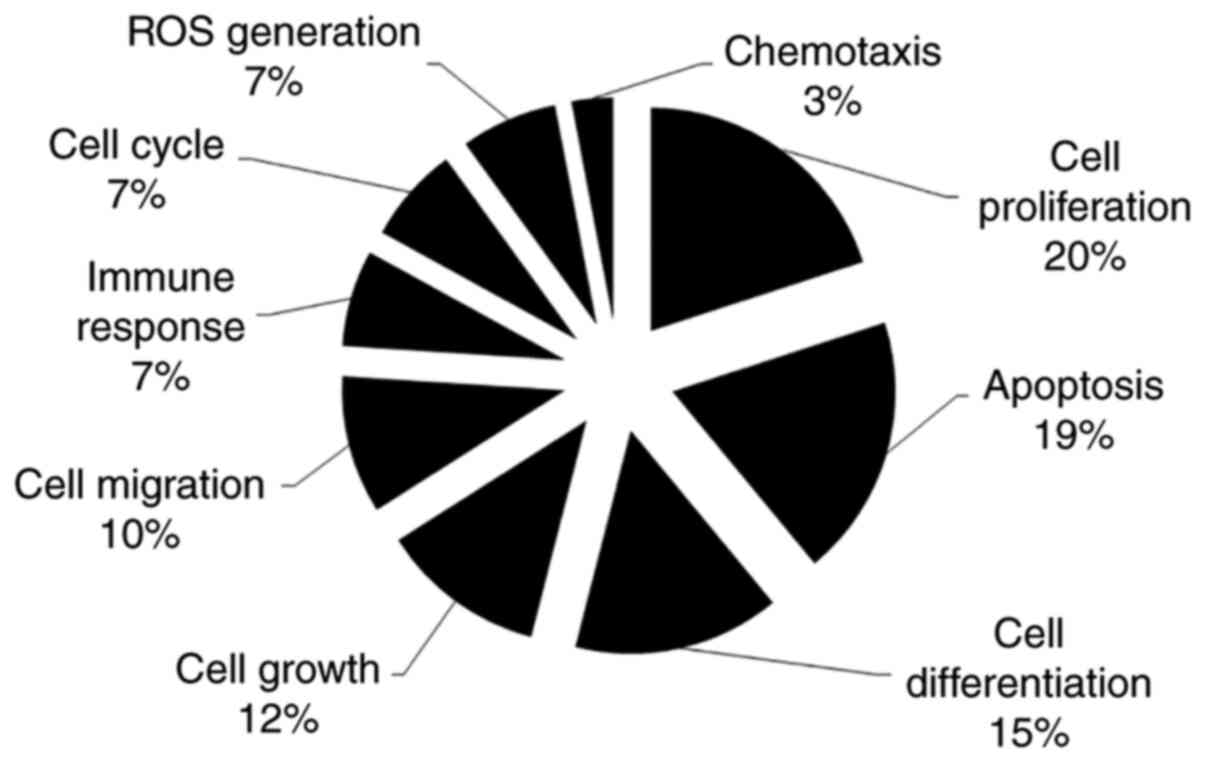
Pathway Studio software. In-depth literature mining with Pathway
Studio revealed that a high percentage of the EGFL8-associated
genes are involved in cell proliferation (20%), apoptosis (19%),
differentiation (15%), growth (12%), migration (10%), immune
response (7%), cell cycle (7%), reactive oxygen species (ROS)
generation (7%) and chemotaxis (3%) (Fig. 9). These are biological processes
that regulate crucial cellular functions, and whose deregulation is
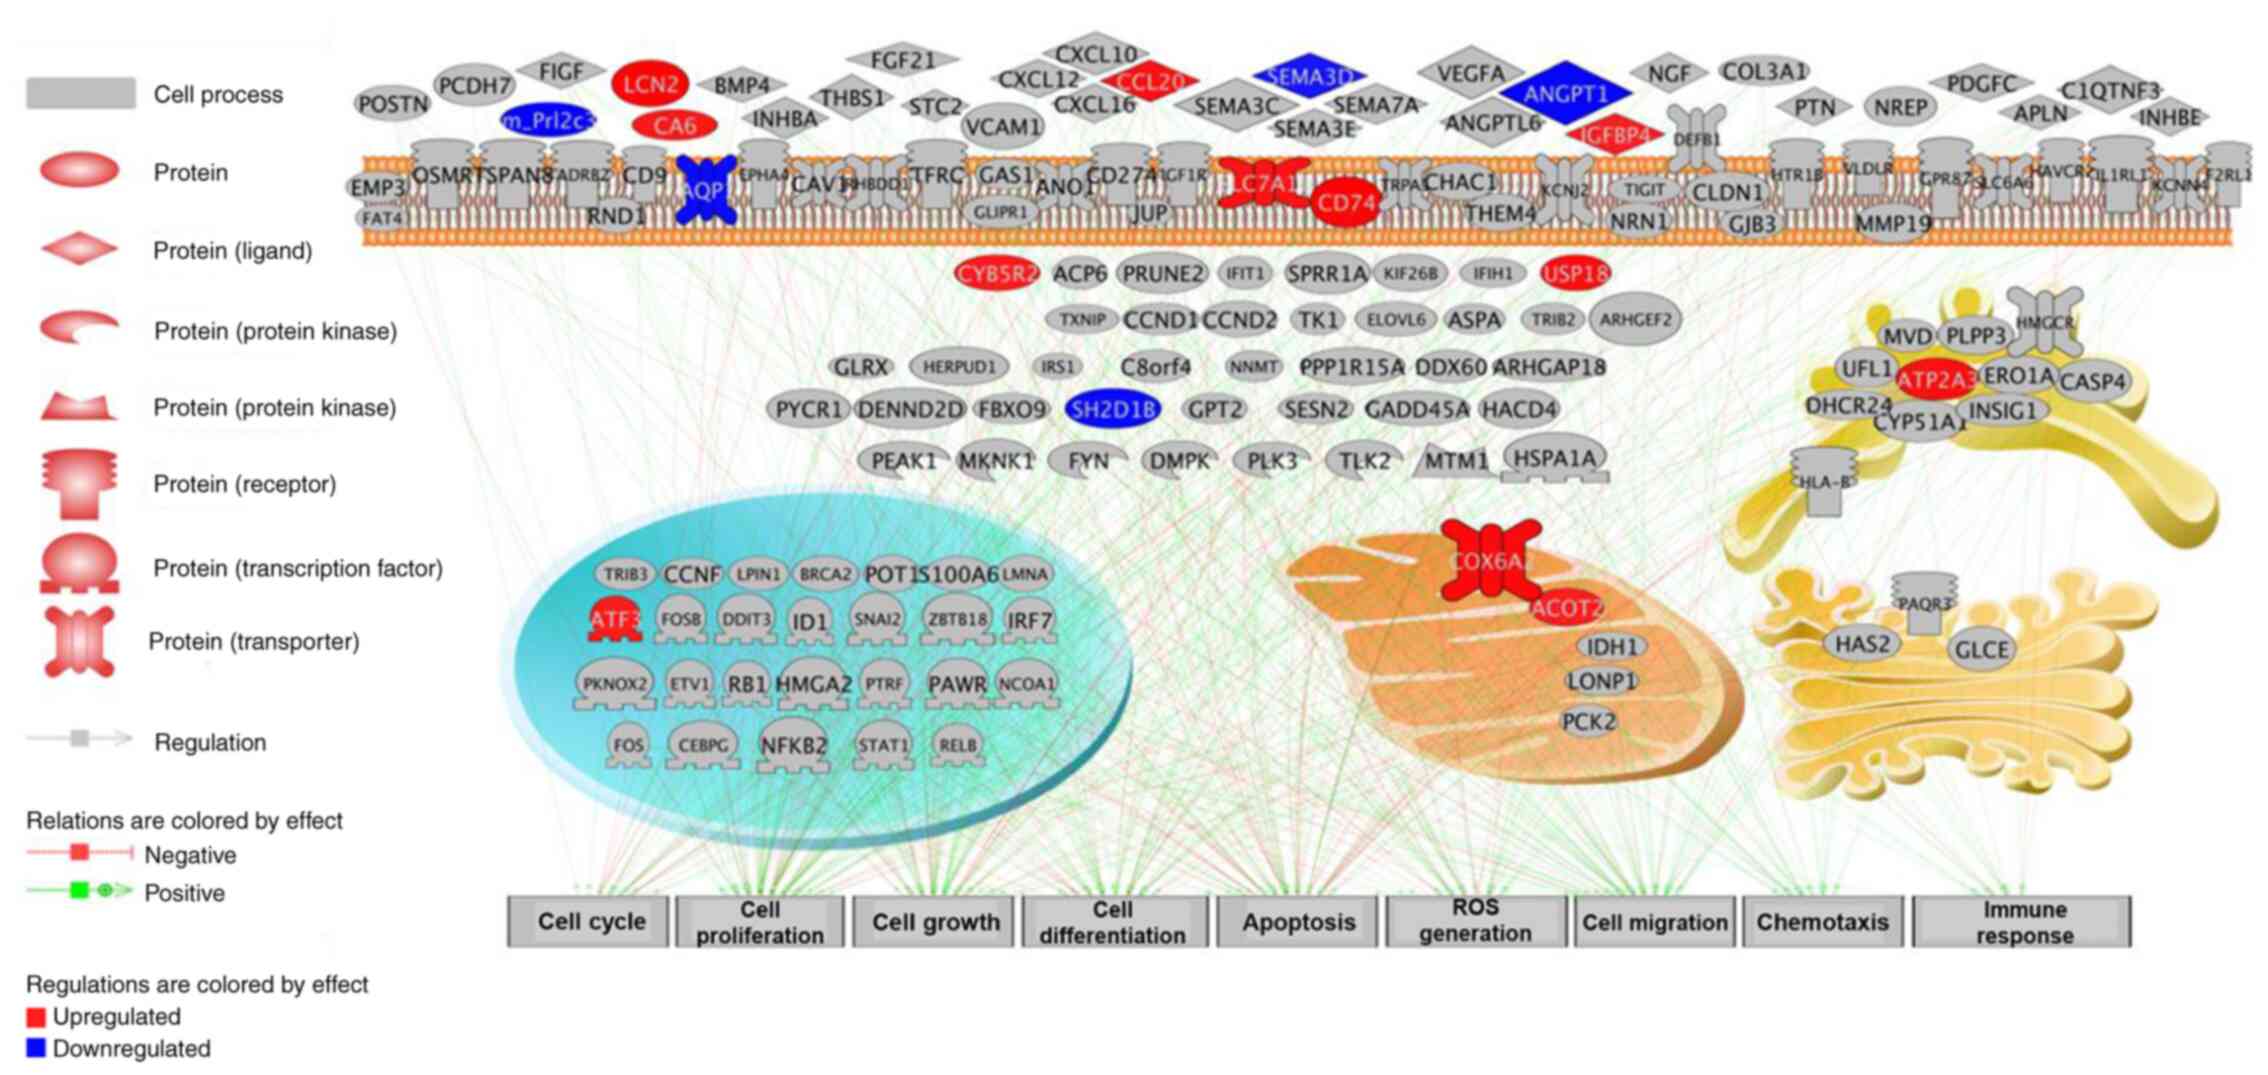
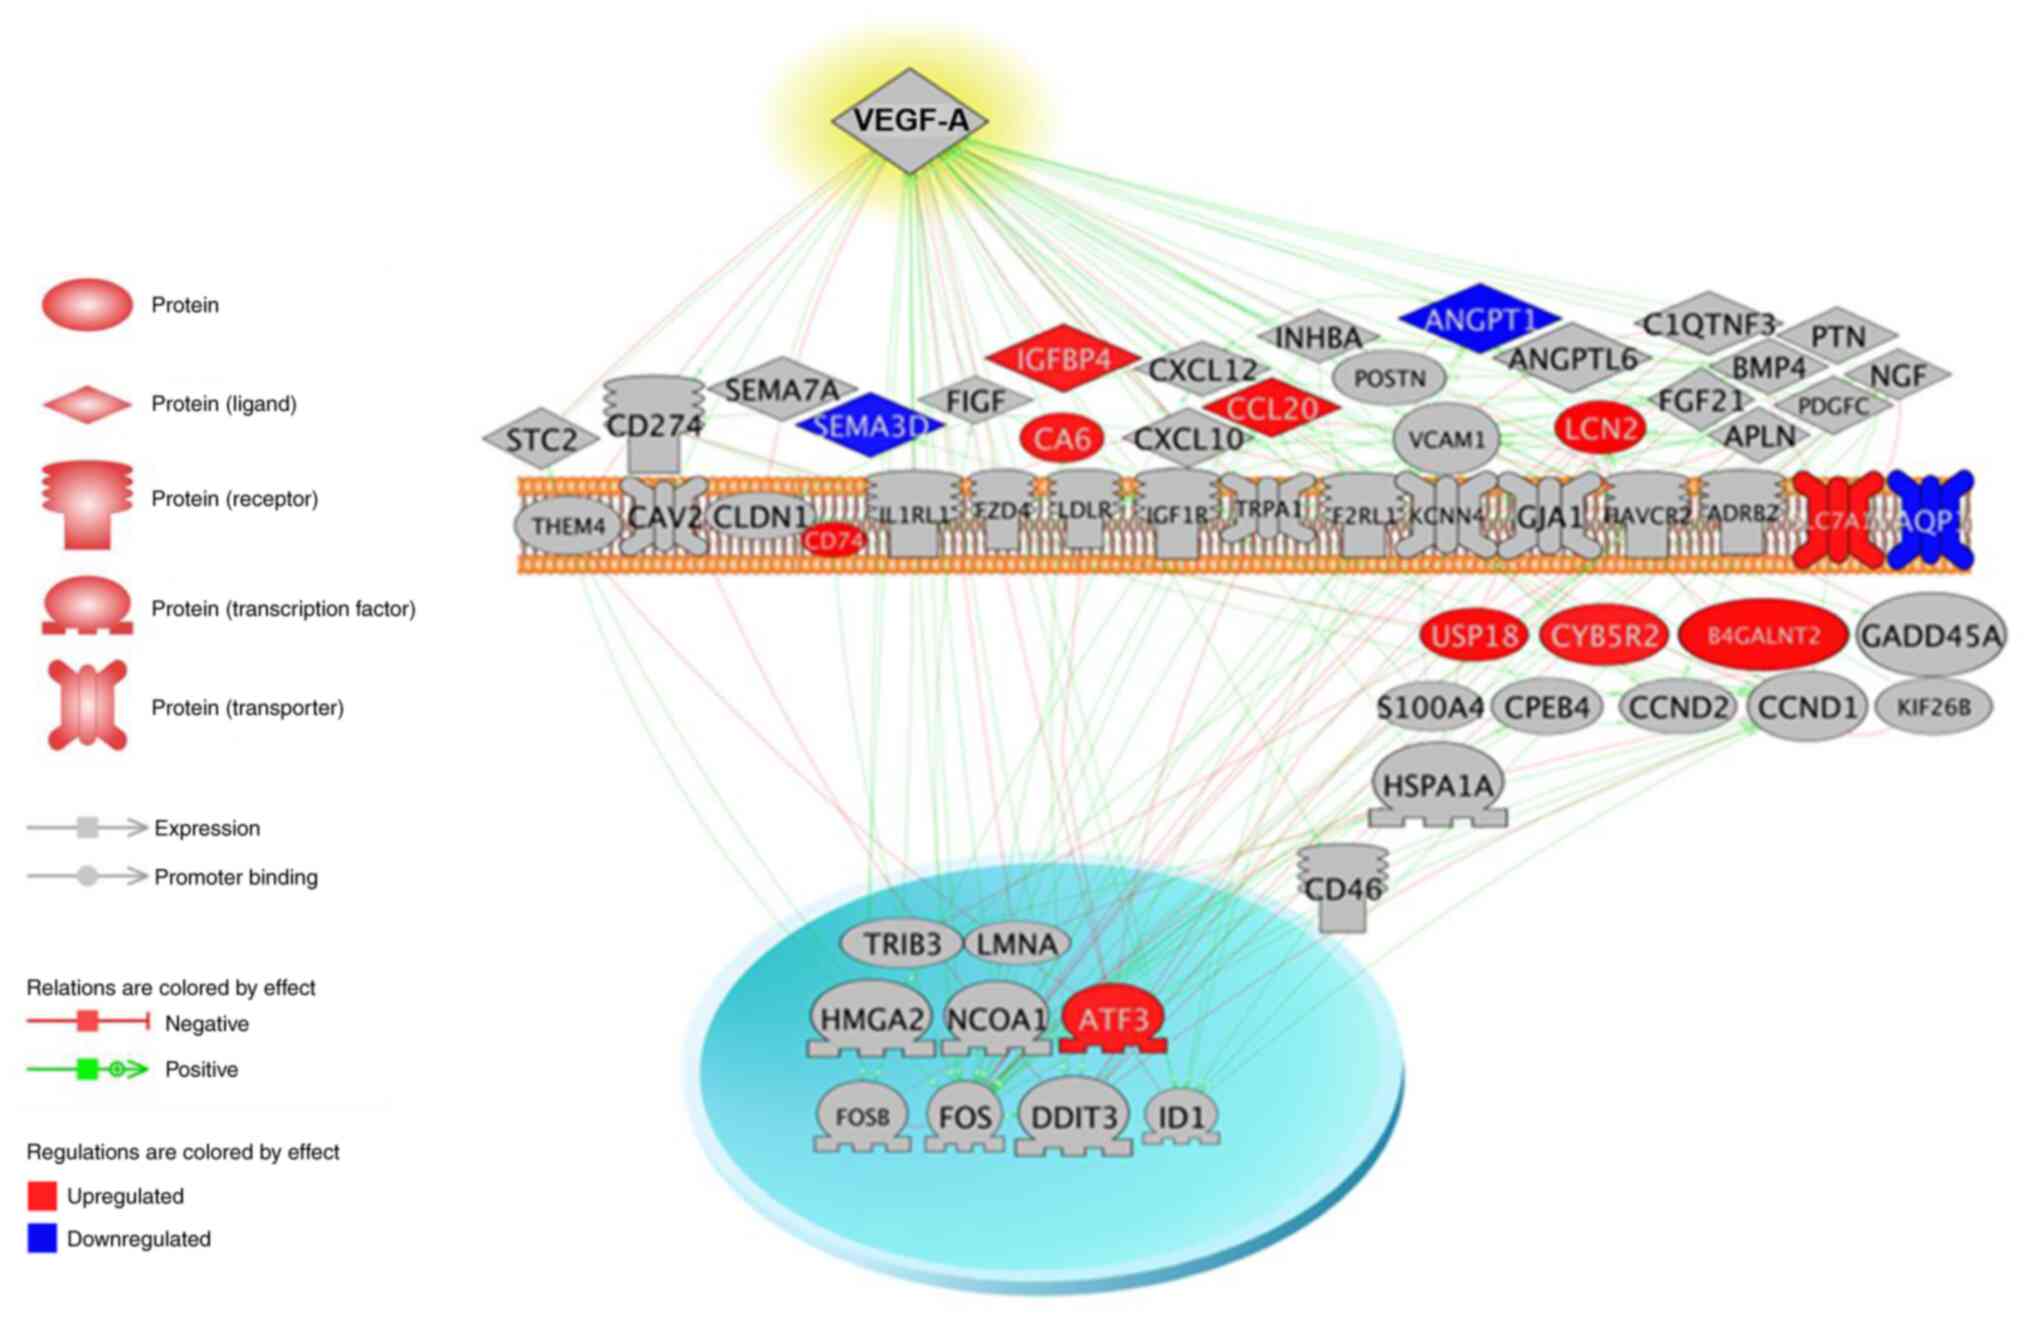
commonly observed in diseases. Biological networks of all known
associations and potential interactions between the DEGs are shown
in Fig. 10. A possible gene
network using the 344 genes mapped by the algorithms 'expression'
and 'regulation' to filter the associations from 458 total genes
that were differentially expressed between the EGFL8-overexpressing
and -silenced cTECs was identified. The associations of the mapped
DEGs were linked to each other based on previously published
literature. DEGs that share associations were displayed in the
network and unlinked genes were excluded from it (Fig. 10). Pathway analysis depicted the
expression pattern of upregulated and downregulated genes in
EGFL8-overexpressing or -silenced cTECs. In the extracellular
region, the expression of CCL20, IGFBP4, lipocalin 2 (LCN2) and
carbonic anhydrase VI (CA6) was upregulated, whereas that of
Sema3D, Angpt1 and prolactin family 2 subfamily c member 3 (Prl2c3)
was downregulated (Fig. 10). In
the plasma membrane, the expression of CD74 and solute carrier
family 7 member 11 (SLC7A11) was upregulated, whereas that of
aquaporin 1 (AQP1) was downregulated (Fig. 10). In the cytoplasmic region, the
expression of cytochrome b5 reductase 2 (CYB5R2) and ubiquitin
specific peptidase 18 (uSP18) was upregulated, whereas that of SH2
domain-containing protein 1B (SH2D1B) was downregulated (Fig. 10). In the nuclear region, the
expression of activating transcription factor 3 (ATF3) was
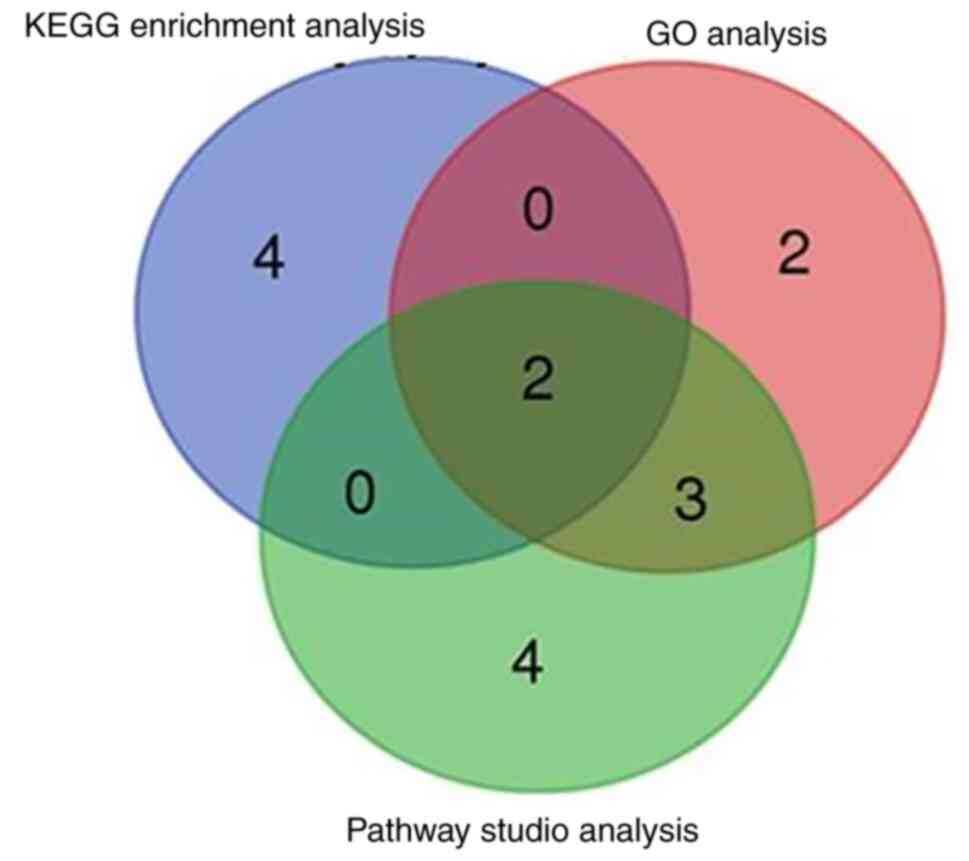
upregulated (Fig. 10). KEGG, GO
and Pathway Studio analyses of DEGs associated with EGFL8
modulation in cTECs revealed 2 overlaps of enriched pathways
involved in the cell cycle regulation and immune responses
(Fig. 11).
In a second analysis, 'network connectivity' was
examined to identify genes that are highly linked to the proteins
regulated by EGFL8 (i.e., to identify a common node). As a result,
49 genes were found to be nodes having a connectivity >1,000.
The nodes having connectivity a >4,000 are listed in Table IV. Notably, VEGF-A, was
determined to be the node with the highest degree of connectivity
(15,004) between the EGFL8-associated genes (Fig. 12).
| Table IVEpidermal growth factor-like domain
8-associated gene network connectivity. Top 11 nodes with more than
4000 connectivity. |
Table IV
Epidermal growth factor-like domain
8-associated gene network connectivity. Top 11 nodes with more than
4000 connectivity.
| Gene name | Gene symbol | Connectivity |
|---|
| Vascular
endothelial growth factor-A | VEGF-A | 15,004 |
| Cyclin D1 | CCND1 | 6,846 |
| FBJ murine
osteosarcoma viral oncogene homolog | FOS | 6,527 |
| Heat shock protein
family A (Hsp70) member 1A | HSPA1A | 6,480 |
| Nerve growth
factor | NGF | 5,940 |
| Vascular cell
adhesion molecule 1 | VCAM1 | 4,869 |
| C-X-C motif
chemokine ligand 12 | CXCL12 | 4,860 |
| Caveolin 1 | CAV1 | 4,702 |
| Signal transducer
and activator of transcription 1 | STAT1 | 4,401 |
| Insulin like growth
factor 1 receptor | IGF1R | 4,140 |
| C-X-C motif
chemokine ligand 10 | CXCL10 | 4,080 |
Discussion
cTECs play a central role in physiological T cell
development and thymopoiesis during regeneration from thymic
involution, which leads to T cell depletion (4,30).
In the present study, microarray analysis was applied to identify
candidate genes responsible for EGFL8-regulated cellular functions
in TECs using the gain- and loss-of function mutations of EGFL8.
The findings of this study corroborate the hypothesis that EGFL8
can serve as a key molecule regulating several fundamental
functions of cTECs, such as cell proliferation and signaling.
The results presented in the present study
identified genes that are differentially expressed based on
statistical evaluations of the manipulation of EGFL8 expression
levels in cTECs. Notably, the present study provided direct
evidence for the involvement of EGFL8 in the inhibition of TEC
proliferation. The mechanisms underlying the suppressed cell
proliferation induced by EGFL8 may be attributed to the inhibition
of cell cycle progression and induction of apoptosis as EGFL8
knockdown elevated expression levels of important cell cycle
regulatory molecules, such as CDK1, CDK4, CDK6 and cyclin D1.
Additionally, the expression of the anti-apoptotic genes, Bcl-2 and
Bcl-xL, was increased. Furthermore, the present study demonstrated
that EGFL8 significantly modulated the expression of genes related
to the following: i) Regulatory factors of T cell development, such
as, FasL, Nrp1, IGFBP-4 and Thbs1; ii) T cell chemotactic
migration, such as CCL20, CXCL5, CXCL10 and CXCL16; iii) Important
transcription factors, such as Irf7 and NF-κB2; and iv) Angiogenic
factors, such as Angptl1, ANGPT1, CD74 and VEGF-A.
TECs express a variety of proteins that regulate T
cell survival, proliferation and maturation in the thymus. Among
these, FasL (CD95L/APO-1L), a TNF family member, plays a functional
role in the proliferation of activated T cells. The cross-linking
of FasL in CD8+ T cells is required for maximal cellular
proliferation in vivo (31). In the present study, the silencing
of EGFL8 gene expression with EGFL8-specific siRNA upregulated the
expression level of FasL in cTECs. A previous study demonstrawted
that EGFL8 significantly inhibited the expression of IL-7 in TECs
(22). FasL plays a direct
regulatory role through IL-7 activation, which increases its
efficacy to induce proliferation of sub-optimally activated T cells
(32). Thus, it was hypothesized
that the EGFL8-induced changes in FasL expression levels in cTECs
may be implicated in the regulation of proliferation of T cell
precursors.
Nrp1 is a non-tyrosine kinase trans-membrane
glycoprotein and is a high-affinity receptors for semaphorins on
the cell membrane (33).
Semaphorin signaling plays an important role in focal adhesion
assembly/disassembly and induces cytoskeletal remodeling, thereby
affecting cell shape, attachment to the extracellular matrix, cell
motility, and cell migration (34,35). Sema3D and Nrp1 are expressed in
the thymus, and Sema7A is expressed by thymocytes, predominantly in
immature CD4+CD8+ and mature
CD4−CD8− subsets (36,37). It has been reported that the
expression of Nrp1 increases with age and Nrp1 may play a
significant role in the regulation of thymic involution (35,37). However, the exact role of Nrp1 in
the thymus function requires further investigation.
Chemokines, the largest family of cytokines in human
immunophysiology, are involved in recruiting lymphocytes,
neutrophils, and macrophages during an immune response, thereby
functioning as signaling proteins of the immune system (38). CXCL10 (IP-10), a small
pro-inflammatory chemotactic polypeptide, is associated with
recruiting T cell precursors to the thymus (39). CXCL16 promotes lymphocyte adhesion
to epithelial cells through integrin-mediated signaling (40). The chemokine ligand CCL20 is
expressed in various types of epithelial cells, including TECs
(41). CC chemokine receptor 6
(CCR6), the specific chemokine receptor of CCL20, is expressed by T
cells, and the CCL20/CCR6 axis is involved in the migration of
CCR6+ T cells (42).
Additionally, there is evidence to suggest that CXCL5 is linked to
immune cell recruitment (43). A
previous study using CXCL5-deficient mice demonstrated that the
expression levels of NF-κB, mitogen-activated protein kinase (MAPK)
and intercellular adhesion molecule-1 (ICAM-1) were reduced in the
lungs during exposure to secondhand smoke (43). In the present study, it was
demonstrated that EGFL8 knockdown upregulated the expression of
CXCL5. In a previous study, it was demonstrated that EGFL8
significantly inhibited the adhesion of thymocytes to TECs through
the attenuation of ICAM-1 expression therein (22). Hence, it is possible that EGFL8
inhibits the adhesion of thymocytes to TECs by downregulating the
expression of chemokines, including CXCL5, which in turn leads to
diminished production of ICAM-1 in TECs. Overall, the current
results indicate that EGFL8 knockdown augments the expression of
CXCL5, CXCL10, CXCL16 and CCL20. This suggests the important role
of EGFL8 in cTECs for the recruitment of T cell precursors to the
thymus and for TEC-thymocyte interactions via attenuation of
chemokine production.
The results of the present study demonstrating that
the expression of Angptl1 was decreased in EGFL8-silenced TECs, and
vice versa for VEGF-A, CD74, and NF-κB2 suggest that EGFL8 affects
angiogenesis by modulating the expression of Angptl1, VEGF-A, CD74
and NF-κB2. Angptl1 (also known as angioarrestin), a key
anti-angiogenic protein, is essential for the regulation of VEGF-A,
which is a key signaling protein that stimulates vasculogenesis and
angiogenesis (44). CD74 is an
integral membrane protein that functions as an MHC class II
chaperone, and an accessory-signaling molecule with a distinct role
in angiogenesis and inflammation by binding to the pro-inflammatory
cytokine, macrophage migration-inhibitory factor (45,46). NF-κB is a pleiotropic
transcription factor present in the majority of cell types and is
the endpoint of a series of signal transduction events that are
initiated by numerous stimuli related to inflammation, immunity,
cell differentiation, growth, adhesion, apoptosis and
tumorigenesis. It has been shown that NF-κB2 is involved in the
upregulation of VEGF mRNA (47).
IGFBP-4 binds and titrates IGF-2 away from the IGF
receptor, thereby inhibiting IGF-2 signaling, which reduces
apoptosis via the activation of the phosphoinositide
3-kinase/protein kinase B (PI3K/Akt) and MAPK pathways (48). Thbs1 has been suggested to
participate in TEC-thymocyte interaction, which is involved in the
differentiation of thymocytes into mature T cells (49). Irf7 is essential for the
development of TECs and maintenance of thymic architecture through
interferon α/β receptor subunit 1 (IFNAR1) and signal transducer
and activator of transcription 1 (STAT1) signaling (50). The results of the present study
suggest that EGFL8 may be involved in several fundamental processes
of cTECs, including survival, proliferation, and adhesion by
regulating the expression of IGFBP-4, Irf7 and Thbs1.
The interaction network analysis performed using
Pathway Studio software also mapped signaling pathways associated
with cell cycle, proliferation, growth, differentiation, and
migration, as well as apoptosis, ROS generation, chemotaxis and
immune response, supporting the results of KEGG and GO analyses.
Overall, the results of the present study demonstrated that DEGs
induced by elevated or silenced EGFL8 expression in cTECs play a
role in cell proliferation, apoptosis, differentiation, growth,
migration and immune response, which are critical to the physiology
of cTECs. Moreover, pathway analysis revealed the putative network
of DEGs and their localization within the cell. This analysis
demonstrated that DEGs of cell surface receptors in the plasma
membrane, signal transduction molecules in the cytosol,
transcription factors in the nucleus, and DEGs of the extracellular
fluid may lead to the discovery of unique signaling molecular
mechanisms underlying EGFL8 function.
Microarray data permits the cataloging of a
multitude of genes that are differentially expressed, and
identifies nodes that are highly linked to the proteins regulated
by EGFL8. Notably, a salient feature of the present study was that
VEGF-A exhibited the highest degree of connectivity among all nodes
in the gene network analysis of DEGs induced by EGFL8 and Angpt1
also exhibited a high degree of connectivity (1,867 connectivity).
VEGF-A is the most well-characterized member of the VEGF family,
being the most potent stimulator of angiogenic processes. ANGPT1
exhibits potent vascular protective effects and can repress
VEGF-induced angiogenesis (51,52).
These results were supported by DEG analysis in
which VEGF-A expression was upregulated in EGFL8-silenced TECs and
downregulated in EGFL8-overexpressing TECs, whereas Angpt1
expression was downregulated in EGFL8-silenced TECs and upregulated
in EGFL8-overexpressing TECs. These findings provide compelling
evidence that EGFL8 may play an important anti-angiogenic role.
However, it is necessary to define the expression and function of
EGFL8 in various processes of angiogenesis or vasculogenesis.
The activity of EGFL8 through autocrine or paracrine
mechanism in TECs and other cell types remains uncertain. However,
structural analysis of the EGFL8 protein predicted that it is
secretory (18). In a previous
study by the authors, to investigate the functional role of EGFL8
in TECs, TECs were transfected with an EGFL8-expressing vector to
overexpress EGFL8 protein and with an EGFL8 siRNA to knockdown
EGFL8 expression (22).
EGFL8-silenced TECs exhibited a significant increase in the number
of adherent thymocytes by enhancing the expression of ICAM-1, while
the overexpression of EGFL8 inhibited the adherence of TECs to
thymocytes by suppressing ICAM-1 expression (22). Furthermore, in vitro
co-culture experiments revealed that EGFL8 knockdown facilitated
the maturation of thymocytes to CD4+ and CD8+
single-positive populations (22). These regulatory effects of EGFL8
in T cell development were further confirmed by the results that
EGFL8 knockdown enhanced the expression of genes involved in
thymopoiesis, such as IL-7, GM-CSF, and thymus-expressed chemokine
(TECK). These data indicate that EGFL8 exerts inhibitory effects on
TECs and thymocytes, suggesting that EGFL8 is a secreted protein
and possibly modulates gene expression via a paracrine, autocrine
or both mechanism(s). In addition, it was reported that, in an
in vitro study, recombinant EGFL8 (rEGFL8) protein inhibited
thymocyte proliferation and induced apoptosis and, in an in
vivo study, rEGFL8 injection into mice resulted in a decreased
thymic mass, and total number of thymocytes (23).
In conclusion, the ability to manipulate the
activity of TECs is important for deciphering the underlying
mechanisms governing T cell development, and developing approaches
to regenerate the thymus after thymic involution induced by age,
ablative therapies, or viral infection to boost new T cell
production. The present study demonstrated that EGFL8 inhibited the
proliferation of cTECs and provides new insight into its underlying
molecular mechanisms. Furthermore, gene expression profiling of
cTECs by the overexpression or silencing of EGFL8 led us to
identify molecular signatures associated with the function of EGFL8
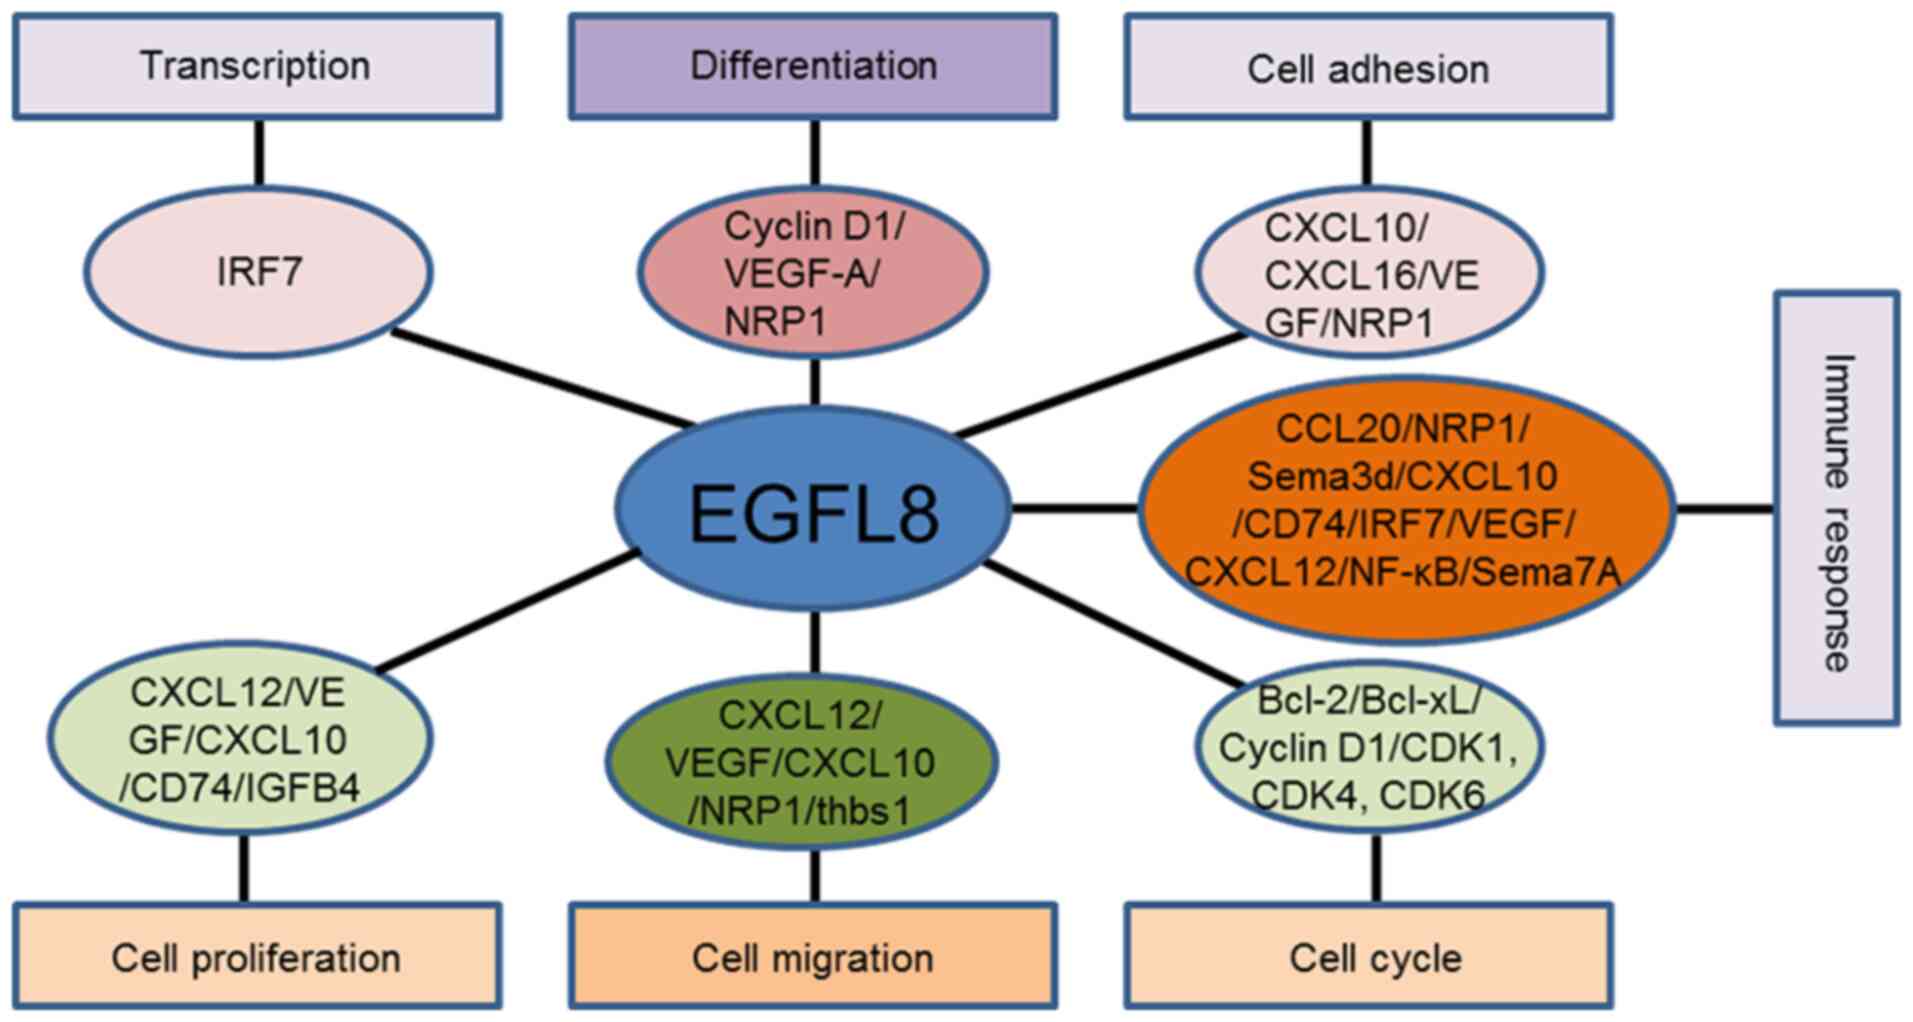
gene. The microarray results suggested that EGFL8 may be implicated
in diverse cellular processes in cTECs (Fig. 13). A strong associatoin was found
between EGFL8-associated genes and diverse physiological processes,
including cell cycle, proliferation, growth, migration, and
differentiation, as well as apoptosis, ROS generation, chemotaxis,
and immune responses. Additionally, VEGF-A acts as a pivotal hub
among genes connected with EGFL8. Therefore, the data obtained from
the present study strongly suggests that EGFL8 functions as a
regulator of various important physiologic processes in cTECs, and
during angiogenesis. Further studies on the roles of the identified
genes are necessary to understand the molecular mechanisms
underlying EGFL8-mediated cell behavior.
Funding
The present study was supported by the National
Research Foundation of Korea (NRF) grant funded by the Korean
government (MEST) (no. 2020R1A2C1004529).
Availability of data and materials
The datasets used and/or analyzed during the current
study are available from the corresponding author on reasonable
request.
Authors' contributions
YSL, DYL, YM and SY contributed to the conception
and design of the study. YSL, DYL, HYK, YO and SH performed all
experiments and verified the analytical data. YM contributed to the
interpretation of the results. SY supervised the experiments in
discussion with YSL, DYL, YO and SH. YSL, DYL and SY wrote the
manuscript. YSL contributed to the revision of the manuscript. All
authors discussed the final results and approved the final
manuscript.
Ethics approval and consent to
participate
Not applicable.
Patient consent for publication
Not applicable.
Competing interests
The authors declare that they have no competing
interests.
Acknowledgments
Not applicable.
References
|
1
|
Hun M, Barsanti M, Wong K, Ramshaw J,
Werkmeister J and Chidgey AP: Native thymic extracellular matrix
improves in vivo thymic organoid T cell output, and drives in vitro
thymic epithelial cell differentiation. Biomaterials. 118:1–15.
2017. View Article : Google Scholar
|
|
2
|
Tajima A, Pradhan I, Trucco M and Fan Y:
Restoration of thymus function with bioengineered thymus organoids.
Curr Stem Cell Rep. 2:128–139. 2016. View Article : Google Scholar : PubMed/NCBI
|
|
3
|
Andrew D and Aspinall R: Age-Associated
thymic atrophy is linked to a decline in IL-7 production. Exp
Gerontol. 37:455–463. 2002. View Article : Google Scholar : PubMed/NCBI
|
|
4
|
Yoon S, Yoo YH, Kim BS and Kim JJ:
Ultrastructural alterations of the cortical epithelial cells of the
rat thymus after cyclophosphamide treatment. Histol Histopathol.
12:401–413. 1997.PubMed/NCBI
|
|
5
|
Yoon S, Lee HW, Baek SY, Kim BS, Kim JB
and Lee SA: upregulation of TrkA neurotrophin receptor expression
in the thymic subcapsular, paraseptal, perivascular, and cortical
epithelial cells during thymus regeneration. Histochem Cell Biol.
119:55–68. 2003. View Article : Google Scholar : PubMed/NCBI
|
|
6
|
Lee HW, Kim BS, Kim HJ, Lee CW, Yoo HJ,
Kim JB and Yoon S: Upregulation of receptor activator of nuclear
factor-kappaB ligand expression in the thymic subcapsular,
paraseptal, perivascular, and medullary epithelial cells during
thymus regeneration. Histochem Cell Biol. 123:491–500. 2005.
View Article : Google Scholar : PubMed/NCBI
|
|
7
|
Lee HW, Kim SM, Shim NR, Bae SK, Jung IG,
Kwak JY, Kim BS, Kim JB, Moon JO, Chung JS and Yoon S: Expression
of nerve growth factor is upregulated in the rat thymic epithelial
cells during thymus regeneration following acute thymic involution.
Regul Pept. 141:86–95. 2007. View Article : Google Scholar : PubMed/NCBI
|
|
8
|
Park HJ, Kim MN, Kim JG, Bae YH, Bae MK,
Wee HJ, Kim TW, Kim BS, Kim JB, Bae SK and Yoon S: Up-Regulation of
VEGF expression by NGF that enhances reparative angiogenesis during
thymic regeneration in adult rat. Biochim Biophys Acta.
1773:1462–1472. 2007. View Article : Google Scholar : PubMed/NCBI
|
|
9
|
Kim YM, Kim HK, Kim HJ, Lee HW, JU SA,
Choi BK, Kwon BS, Kim BS, Kim JB, Lim YT and Yoon S: Expression of
4-1BB and 4-1BBL in thymocytes during thymus regeneration. Exp Mol
Med. 41:896–911. 2009. View Article : Google Scholar : PubMed/NCBI
|
|
10
|
Awong G, LaMotte-Mohs R and
Zúñiga-Pflücker JC: Key players for T-cell regeneration. Curr Opin
Hematol. 17:327–332. 2010. View Article : Google Scholar : PubMed/NCBI
|
|
11
|
Boehm T and Swann JB: Thymus involution
and regeneration: Two sides of the same coin? Nat Rev Immunol.
13:831–838. 2013. View
Article : Google Scholar : PubMed/NCBI
|
|
12
|
Downing AK, Knott V, Werner JM, Cardy CM,
Campbell ID and Handford PA: Solution structure of a pair of
calcium-binding epidermal growth factor-like domains: Implications
for the marfan syndrome and other genetic disorders. Cell.
85:597–605. 1996. View Article : Google Scholar : PubMed/NCBI
|
|
13
|
Hohenester E and Engel J: Domain structure
and organisation in extracellular matrix proteins. Matrix Biol.
21:115–128. 2002. View Article : Google Scholar : PubMed/NCBI
|
|
14
|
Takahama Y: Journey through the thymus:
Stromal guides for T-cell development and selection. Nat Rev
Immunol. 6:127–135. 2006. View
Article : Google Scholar : PubMed/NCBI
|
|
15
|
Koeppe JR, Beach MA, Baerga-Ortiz A, Kerns
SJ and Komives EA: Mutations in the fourth EGF-like domain affect
thrombomodulin-induced changes in the active site of thrombin.
Biochemistry. 47:10933–10939. 2008. View Article : Google Scholar : PubMed/NCBI
|
|
16
|
Singh AB and Harris RC: Autocrine,
paracrine and juxtacrine signaling by EGFR ligands. Cell Signal.
17:1183–1193. 2005. View Article : Google Scholar : PubMed/NCBI
|
|
17
|
Chim SM, Tickner J, Chow ST, Kuek V, Guo
B, Zhang G, Rosen V, Erber W and Xu J: Angiogenic factors in bone
local environment. Cytokine Growth Factor Rev. 24:297–310. 2013.
View Article : Google Scholar : PubMed/NCBI
|
|
18
|
Chim SM, Qin A, Tickner J, Pavlos N, Davey
T, Wang H, Guo Y, Zheng MH and Xu J: EGFL6 promotes endothelial
cell migration and angiogenesis through the activation of
extracellular signal-regulated kinase. J Biol Chem.
286:22035–22046. 2011. View Article : Google Scholar : PubMed/NCBI
|
|
19
|
Fitch MJ, Campagnolo L, Kuhnert F and
Stuhlmann H: Egfl7, a novel epidermal growth factor-domain gene
expressed in endothelial cells. Dev Dyn. 230:316–324. 2004.
View Article : Google Scholar : PubMed/NCBI
|
|
20
|
Wu F, Shirahata A, Sakuraba K, Kitamura Y,
Goto T, Saito M, Ishibashi K, Kigawa G, Nemoto H, Sanada Y and Hibi
K: Down-Regulation of EGFL8: A novel biomarker for advanced gastric
cancer. Anticancer Res. 31:3377–3380. 2011.PubMed/NCBI
|
|
21
|
Wu F, Shirahata A, Sakuraba K, Kitamura Y,
Goto T, Saito M, Ishibashi K, Kigawa G, Nemoto H, Sanada Y and Hibi
K: Down-Regulation of EGFL8: A novel prognostic biomarker for
patients with colorectal cancer. Anticancer Res. 31:2249–2254.
2011.PubMed/NCBI
|
|
22
|
Choi HJ, Yoon TD, Muhammad I, Jeong MH,
Lee J, Baek SY, Kim BS and Yoon S: Regulatory role of mouse
epidermal growth factor-like protein 8 in thymic epithelial cells.
Biochem Biophys Res Commun. 425:250–255. 2012. View Article : Google Scholar : PubMed/NCBI
|
|
23
|
Subhan F, Yoon TD, Choi HJ, Muhammad I,
Lee J, Hong C, Oh SO, Baek SY, Kim BS and Yoon S: Epidermal growth
factor-like domain 8 inhibits the survival and proliferation of
mouse thymocytes. Int J Mol Med. 32:952–958. 2013. View Article : Google Scholar : PubMed/NCBI
|
|
24
|
Faas SJ, Rothstein JL, Kreider BL, Rovera
G and Knowles BB: Phenotypically diverse mouse thymic stromal cell
lines which induce proliferation and differentiation of
hematopoietic cells. Eur J Immunol. 23:1201–1214. 1993. View Article : Google Scholar : PubMed/NCBI
|
|
25
|
Irizarry RA, Hobbs B, Collin F,
Beazer-Barclay YD, Antonellis KJ, Scherf U and Speed TP:
Exploration, normalization, and summaries of high density
oligonucleotide array probe level data. Biostatistics. 4:249–264.
2003. View Article : Google Scholar : PubMed/NCBI
|
|
26
|
Gentleman RC, Carey VJ, Bates DM, Bolstad
B, Dettling M, Dudoit S, Ellis B, Gautier L, Ge Y, Gentry J, et al:
Bioconductor: Open software development for computational biology
and bioinformatics. Genome Biol. 5:R802004. View Article : Google Scholar : PubMed/NCBI
|
|
27
|
Eisen MB, Spellman PT, Brown PO and
Botstein D: Cluster analysis and display of genome-wide expression
patterns. Proc Natl Acad Sci USA. 95:14863–14868. 1998. View Article : Google Scholar : PubMed/NCBI
|
|
28
|
Sherman BT, Huang da W, Tan Q, Guo Y, Bour
S, Liu D, Stephens R, Baseler MW, Lane HC and Lempicki RA: DAVID
Knowledgebase: A gene-centered database integrating heterogeneous
gene annotation resources to facilitate high-throughput gene
functional analysis. BMC Bioinformatics. 8:4262007. View Article : Google Scholar : PubMed/NCBI
|
|
29
|
Yuryev A, Mulyukov Z, Kotelnikova E,
Maslov S, Egorov S, Nikitin A, Daraselia N and Mazo I: Automatic
pathway building in biological association networks. BMC
Bioinformatics. 7:1712006. View Article : Google Scholar : PubMed/NCBI
|
|
30
|
Shakib S, Desanti GE, Jenkinson WE,
Parnell SM, Jenkinson EJ and Anderson G: Checkpoints in the
development of thymic cortical epithelial cells. J Immunol.
182:130–137. 2009. View Article : Google Scholar
|
|
31
|
Suzuki I, Martin S, Boursalian TE, Beers C
and Fink PJ: Fas ligand costimulates the in vivo proliferation of
CD81+ T Cells. Immunol. 165:5537–5543. 2000. View Article : Google Scholar
|
|
32
|
Rethi B, Vivar N, Sammicheli S, Fluur C,
Ruffin N, Atlas A, Rajnavolgyi E and Chiodi F: Priming of T cells
to fas-mediated proliferative signals by interleukin-7. Blood.
112:1195–1204. 2008. View Article : Google Scholar : PubMed/NCBI
|
|
33
|
Geretti E, Shimizu A and Klagsbrun M:
Neuropilin structure governs VEGF and semaphorin binding and
regulates angiogenesis. Angiogenesis. 11:31–39. 2008. View Article : Google Scholar : PubMed/NCBI
|
|
34
|
Sakurai A, Doçi CL and Gutkind JS:
Semaphorin signaling in angiogenesis, lymphangiogenesis and cancer.
Cell Res. 22:23–32. 2012. View Article : Google Scholar :
|
|
35
|
Takahashi K, Ishida M, Hirokawa K and
Takahashi H: Expression of the semaphorins sema 3D and sema 3F in
the developing parathyroid and thymus. Dev Dyn. 237:1699–1708.
2008. View Article : Google Scholar : PubMed/NCBI
|
|
36
|
Mine T, Harada K, Matsumoto T, Yamana H,
Shirouzu K, Itoh K and Yamada A: CDw108 expression during T-cell
development. Tissue Antigens. 55:429–436. 2000. View Article : Google Scholar : PubMed/NCBI
|
|
37
|
Corbel C, Lemarchandel V, Thomas-Vaslin V,
Pelus AS, Agboton C and Roméo PH: Neuropilin 1 and CD25
co-regulation during early murine thymic differentiation. Dev Comp
Immunol. 31:1082–1094. 2007. View Article : Google Scholar : PubMed/NCBI
|
|
38
|
Olson TS and Ley K: Chemokines and
chemokine receptors in leukocyte trafficking. Am J Physiol Regul
Integr Comp Physiol. 283:R7–R28. 2002. View Article : Google Scholar : PubMed/NCBI
|
|
39
|
Ying S, O'Connor B, Ratoff J, Meng Q,
Mallett K, Cousins D, Robinson D, Zhang G, Zhao J, Lee TH and
Corrigan C: Thymic stromal lymphopoietin expression is increased in
asthmatic airways and correlates with expression of Th2-attracting
chemokines and disease severity. J Immunol. 174:8183–8190. 2005.
View Article : Google Scholar : PubMed/NCBI
|
|
40
|
Heydtmann M, Lalor PF, Eksteen JA,
Hübscher SG, Briskin M and Adams DH: CXC chemokine ligand 16
promotes integrin-mediated adhesion of liver-infiltrating
lymphocytes to cholangiocytes and hepatocytes within the inflamed
human liver1. Immunol. 174:1055–1062. 2005. View Article : Google Scholar
|
|
41
|
Cowan JE, Baik S, McCarthy NI, Parnell SM,
White AJ, Jenkinson WE and Anderson G: Aire controls the
recirculation of murine Foxp3+ regulatory T-cells back
to the thymus. Eur J Immunol. 48:844–854. 2018. View Article : Google Scholar :
|
|
42
|
Rivino L, Gruarin P, Häringer B,
Steinfelder S, Lozza L, Steckel B, Weick A, Sugliano E, Jarrossay
D, Kühl AA, et al: CCR6 is expressed on an IL-10-producing,
autoreactive memory T cell population with context-dependent
regulatory function. J Exp Med. 207:565–577. 2010. View Article : Google Scholar : PubMed/NCBI
|
|
43
|
Balamayooran G, Batra S, Cai S, Mei J,
Worthen GS, Penn AL and Jeyaseelan S: Role of CXCL5 in leukocyte
recruitment to the lungs during secondhand smoke exposure. Am J
Respir Cell Mol Biol. 47:104–111. 2012. View Article : Google Scholar : PubMed/NCBI
|
|
44
|
Yan Q, Jiang L, Liu M, Yu D, Zhang Y, Li
Y, Fang S, Li Y, Zhu YH, Yuan YF and Guan XY: ANGPTL1 interacts
with integrin α1β1 to suppress HCC angiogenesis and metastasis by
inhibiting jAK2/STAT3 signaling. Cancer Res. 77:5831–5845. 2017.
View Article : Google Scholar : PubMed/NCBI
|
|
45
|
Leng L, Metz CN, Fang Y, Xu J, Donnelly S,
Baugh J, Delohery T, Chen Y, Mitchell RA and Bucala R: MIF signal
transduction initiated by binding to CD74. J Exp Med.
197:1467–1476. 2003. View Article : Google Scholar : PubMed/NCBI
|
|
46
|
Abu El-Asrar AM, Ahmad A, Siddiquei MM, De
Zutter A, Allegaert E, Gikandi PW, De Hertogh G, Van Damme J,
Opdenakker G and Struyf S: The proinflammatory and proangiogenic
macrophage migration inhibitory factor is a potential regulator in
proliferative diabetic retinopathy. Front Immunol. 10:27522019.
View Article : Google Scholar : PubMed/NCBI
|
|
47
|
Shibata A, Nagaya T, Imai T, Funahashi H,
Nakao A and Seo H: Inhibition of NF-kappaB activity decreases the
VEGF mRNA expression in MDA-MB-231 breast cancer cells. Breast
Cancer Res Treat. 73:237–243. 2002. View Article : Google Scholar : PubMed/NCBI
|
|
48
|
Laursen LS, Overgaard MT, Søe R, Boldt HB,
Sottrup-jensen L, Giudice LC, Conover CA and Oxvig C:
Pregnancy-Associated plasma protein-A (PAPP-A) cleaves insulin-like
growth factor binding protein (IGFBP)-5 independent of IGF:
Implications for the mechanism of IGFBP-4 proteolysis by PAPP-A.
FEBS Lett. 504:36–40. 2001. View Article : Google Scholar : PubMed/NCBI
|
|
49
|
Vacca A, Di Marcotullio L, Giannini G,
Farina M, Scarpa S, Stoppacciaro A, Calce A, Maroder M, Frati L,
Screpanti I and Gulino A: Thrombospondin-1 is a mediator of the
neurotypic differentiation induced by EGF in thymic epithelial
cells. Exp Cell Res. 248:79–86. 1999. View Article : Google Scholar : PubMed/NCBI
|
|
50
|
Otero DC, Baker DP and David M:
IRF7-Dependent IFN-β production in response to RANKL promotes
medullary thymic epithelial cell development. J Immunol.
190:3289–3298. 2013. View Article : Google Scholar : PubMed/NCBI
|
|
51
|
Chinoy MR, Graybill MM, Miller SA, Lang CM
and Kauffman GL: Angiopoietin-1 and VEGF in vascular development
and angiogenesis in hypoplastic lungs. Am J Physiol Lung Cell Mol
Physiol. 283:L60–L66. 2002. View Article : Google Scholar : PubMed/NCBI
|
|
52
|
Fagiani E1, Lorentz P, Kopfstein L and
Christofori G: Angiopoietin-1 and -2 exert antagonistic functions
in tumor angiogenesis, yet both induce lymphangiogenesis. Cancer
Res. 71:5717–5727. 2011. View Article : Google Scholar : PubMed/NCBI
|