Introduction
Ferroptosis is the process of iron
(Fe2+)-dependent programmed cell death, characterized by
Fe2+-dependent lipid peroxidation, restricted
metabolism, the decline of mitochondrial membrane potential (MMP)
and the accumulation of intracellular reactive oxygen species (ROS)
(1-4). A reduced glutathione peroxidase 4
(GPX4) activity (5) is a potent
activator of ferroptosis. GPX4 is a crucial regulator of
ferroptosis (6), and the
inhibition of the function of GPX4 leads to the
Fe2+-dependent formation of toxic lipid ROS, resulting
in the induction of ferroptosis (7). Fe2+ emits electrons that
generate excessive ROS, and Fe2+-dependent lipid
oxygenase can promote the oxidation of polyunsaturated fatty acids
(PUFAs). Ferritin heavy chain 1 (FTH1) can reverse ferroptosis by
regulating iron storage and plays a vital role in proper
Fe2+ management required for cell growth and function
(8).
FTH1 is a 21-kDa subunit of the ferritin complex,
has complementary Fe2+ modulating functions, and forms
triple and quadruple pores. FTH1 is primarily regulated at a
post-transcriptional level in response to intracellular
Fe2+ concentrations. It can trap Fe2+ ions in
the cell, and convert them to Fe3+, reducing ROS
production (9-11). Thus, FTH1 is essential for
maintaining Fe2+ homeostasis and preventing
Fe2+ overload (12).
Fe2+ release and ferritin degradation are associated
with cell dysfunction through the process of ferritinophagy,
causing ROS formation and lipid peroxidation by releasing iron at
sufficient levels, triggering ferroptosis (13). In previous studies, the authors
demonstrated that was involved in ferroptosis in in vivo and
in vitro models of Parkinson's disease (PD) (14,15). Therefore, it is of considerable
interest to explore the upstream molecules targeting FTH1.
PD is a chronic neurodegenerative disease. It is
associated with a reduction in the neurotransmitter dopamine (DA)
in the striatum (in particular, the putamen nucleus) characterized
by the loss of tyrosine hydroxylase (TH)-positive nigrostriatal
dopaminergic neurons in the substantia nigra (SN). Moreover, the
excessive deposition of labile iron in the substantia nigra compact
(SNc) has also become a PD pathological mark (16). Iron accumulated in the
dopaminergic area of patients with PD is 70% higher compared with
that of healthy individuals (17). The pathogenic changes observed in
PD, including nigral iron elevation, mitochondriopathy, glutathione
depletion, lipid peroxidation and increased ROS generation are
closely associated with ferroptosis (13). However, the underlying mechanisms
of ferroptosis in PD remain to be determined.
Ferroptosis, an iron-dependent cell death pathway,
has recently been identified to play a role in the early stages of
PD (15,18). Fe2+ is a potent
reducing agent that can generate hydroxyl radicals and cause
dopamine oxidation, which can act to further increase the oxidative
environment of the SN and contribute to dopaminergic neuron loss
(19). Genetic disorders that
cause Fe2+ homeostasis in the brain often lead to the
development of PD, suggesting that elevated Fe2+ levels
contribute to the pathology of the disease (20,21). Moreover, mutations in several
proteins related to Fe2+ intake and export are also
associated with PD. For example, a mutation in the transferrin
protein, a crucial protein for neuronal Fe2+ absorption,
is associated with increased PD susceptibility (22,23). This finding suggests that
dysregulated Fe2+ homeostasis in PD contributes to the
pathogenesis of the disease. As such, investigating the association
between Fe2+ management and the occurrence of
ferroptosis may lead to a better understanding of the progression
of PD.
MicroRNAs (miRNAs/miRs) are endogenously expressed
22-nucleotide non-coding RNAs. They regulate gene expression
following transcription through base pairing with complementary
sequences within the 3′-UTR of mRNAs (24-27). Previous studies have indicated
that miRNAs play a vital role in the pathogenesis of PD, including
dopaminergic neuron degeneration and Fe2+ regulation
(28-30). However, few studies have
investigated the mechanisms through which miRNAs regulate
ferroptosis in PD by targeting proteins related to Fe2+
management.
In the present study, in vivo and in
vitro models of 6-hydroxydopamine (6-OHDA)-induced PD were used
to investigate the role of miRNAs in ferroptosis, and to examine
the association between FTH1 and the occurrence of ferroptosis in
PD. The findings presented herein identify FTH1 as a potential
biomarker in PD and further suggest the potential of FTH1 to act as
a therapeutic target for the treatment of this chronic
neurodegenerative disease.
Materials and methods
Animals and materials
A total of 48 male Sprague-Dawley rats (weighing,
180-220 g; 6-8 weeks of age) were purchased from the Animal Center
of Guangzhou University of Chinese Medicine (Guangzhou, China). All
animal procedures were approved by the Ethics Committee of
Guangzhou University of Chinese Medicine and followed the
regulations of the National Institute of Health Guide for the Care
and Use of Laboratory Animals. All animals were acclimated for 7
days prior to surgery and were housed in a standard animal room
(humidity, 50-70%; temperature, 21-25Δ°C) with a 12-h light-dark
cycle and ad libitum access to food and water.
In vivo model of PD
PD was established in the rats as previously
described (15). Briefly, the
rats were anesthetized (100 mg/kg ketamine and 10 mg/kg xylazine,
intraperitoneal injection) and placed in a stereotaxic apparatus
with the skull flat. An intracerebral injection of 6-OHDA (cat. no.
H116; Sigma-Aldrich; Merck KGaA; 32 mg of 6-OHDA in a total of 4 ml
in 0.02% ascorbic acid saline solution (concentrations of 8 mg/ml
6-OHDA) was performed at 2 sites in the right SN pars compacta
(SNpc) and ventral tegmental area (VTA): Anteroposterior (A/P)=−4.9
mm; mediolateral (M/L)=−1.9 mm; dorsoventral (D/V)=−7.5 mm; and
anteroposterior (A/P)=−4.9 mm; mediolateral (M/L)=−1.1 mm;
dorsoventral (D/V)=8.0 mm. During the surgery, body temperature was
maintained at ~36.5°C using a heating pad. All rats received
meticulous post-operative care.
Intracerebral injection of mimic and
inhibitor
A total of 24 rats were randomly assigned to 4
groups (6 rats/group) as follows: The control (saline), model
(6-OHDA), mimic (6-OHDA + miR-335), or inhibitor (6-OHDA + miR-335
inhibitor). The control group was intracerebrally injected with
saline, while the model group, the mimic group, and the inhibitor
group received intracerebral injections of 6-OHDA. On post-surgery
day 29, the mimic group and the inhibitor group received
intracerebral injections of rno-miR-335 mimic (100 pmol/rat;
micrON™ miRNA agomir; 5′-UCA AGA GCA AUA ACG AAA AAU GU-3′) or
rno-miR-335 inhibitor (200 pmol/rat; micrOFF™ miRNA antagomir;
5′-ACA UUU UUC GUU AUU GCU CUU GA-3′) into the right SNpc:
Anteroposterior (A/P)=-4.9 mm, mediolateral (M/L)=−1.9 mm,
dorsoventral (D/V)=−7.5 mm). Both products were obtained from
Guangzhou RiboBio Co., Ltd.
Behavioral test
On post-surgery days 0, 28 and 30, the animals were
subjected to the spontaneous rotation test. Apomorphine (APO, 0.5
mg/kg; cat. no. 017-18321; Wako Pure Chemical Industries, Ltd.) was
injected intraperitoneally. The rats were placed on a circular
platform (50 cm in diameter). Rotational speed was recorded for
overall 30 min. Rotations were counted manually 10 min after the
APO injection. The striatal dopamine receptors can be
super-sensitized due to a marked decrease in striatal dopamine
concentration by 6-OHDA injection. Therefore, apomorphine, which is
a dopamine receptor agonist, injected into the peripheral tissues,
can induce the rats to exhibit rotational behavior to the left. A
rotation was defined as a complete full-body turn (360°) towards
the left side of the rat with one hind-paw as center and without
switching head direction. If the rat turns to the right side, this
did not count. Rats that turned >7 times/min were considered to
have developed PD in this model (31,32).
In vitro model of PD and
transfection
PC12 cells were purchased from ATCC (cat. no.
CRL-1721) and cultured in RPMI-1640 medium (cat. no. C11875500BT;
Gibco; Thermo Fisher Scientific, Inc.) containing 10% fetal bovine
serum (cat. no. 10270-106; Gibco; Thermo Fisher Scientific, Inc.).
The model group was established by stimulating the cells with
6-OHDA (50 µM) for 24 h. Erastin (cat. no. HY-15763, 1
µM), ferrostatin-1 (Fer-1; cat. no. HY-100579, 2.5
µM), and deferoxamine (DFO; cat. no. HY-B0988, 25 µM)
were purchased from MedChemExpress. The cells were cultured in
6-well plates at 37°C in an incubator (5% CO2). Cells in
the logarithmic growth phase were transfected for 24 h with either
negative control siRNA (siRNA NC), FTH1 siRNA (siRNA-FTH1-1,
siRNA-FTH1-2, siRNA-FTH1-3; 100 nM), negative control miRNA
inhibitor (inhibitor NC), negative control miRNA mimic (mimic NC),
miR-335 inhibitor (inhibitor), or miR-335 mimic (mimic)
(GenePharma, Inc.). Transfections were carried out using
Lipofectamine 3000 (cat. no. L3000015, Thermo Fisher Scientific,
Inc.) according to the manufacturer's guidelines. After 24 h,
western blot analysis was performed to select the most efficient
siRNA-FTH1 sequence.
MTS assay
PC12 cells were inoculated in 96-well plates and 3
complex wells. Following induction with various concentrations of
6-OHDA (0, 10, 50 and 250 µM), 20 µl MTS solution
(cat. no. G5421; Promega Corporation) mixed with 100 µl
RPMI-1640 medium was added to each well at 2 time points (12 and 24
h). Cells were then transferred to a 5% CO2 incubator at
37°C for 1 h. An automated microplate reader was used to detect the
absorbance (490 nm) to determine cell proliferation.
Candidate miRNA selection
The miRNA candidates potentially regulating FTH1
expression were selected from a list created by a bioinformatics
search of three web-based algorithms: TargetScan (http://www.targetscan.org/), miRDB (http://www.mirdb.org/), and PicTar (http://www.pictar.org/). The parameters were set
according to previous studies (33-35).
Total RNA extraction and RT-qPCR
For RT-qPCR, 12 rats were randomly classified into 2
groups (6 rats/group): The control (saline) and model (6-OHDA).
Carbon dioxide asphyxiation was performed to sacrifice the animals.
A total of 11 rats (one rat from the model group that did not reach
the modeling standard was excluded from the experiment) were placed
in a transparent and airtight chamber (40×20×20 cm) and gassed with
carbon dioxide at a rate of 30% of the chamber volume per minute.
The tissues were collected after the animal death was ensured by
observing the movement, heartbeat and respiration. DNA-free RNA was
obtained from SN tissue or PC12 cells using the Total RNA
Extraction kit (cat. no. LS1040; Promega Corporation), and 500 ng
of total RNA were reverse transcribed using the PrimeScript RT
reagent kit (cat. no. RR600A, Takara Bio, Inc.) according to the
manufacturer's protocol, at 37°C for 15 mins and 85°C for 30 sec.
qPCR was performed in triplicate with TB Green Premix Ex Taq II
(cat. no. RR820A, Takara Bio, Inc.) using a Light Cycler 480
SYBR-Green I Master Mix (Roche Diagnostics, GmbH). The
amplification process was as follows: Denaturation at 95°C for 30
sec, followed by 40 cycles of denaturation at 95°C for 5 sec,
annealing at 60°C for 30 sec and extension at 50°C for 30 sec. The
U6 gene was used for the normalization of miRNA expression. The
primers for qPCR were as follows: miR-335 RT primer, 5′-GTC GTA TCC
AGT GCA GGG TCC GAG GTA TTC GCA CTG ATA CGA CAC ATT T-3′; forward,
5′-CGG CGC TCA AGA GCA ATA ACG AA-3′ and reverse, 5′-ATC CAG TGC
AGG GTC CGA GG-3′; U6 RT primer 5′-GTC GTA TCC AGT GCA GGG TCC GAG
GTA TTC GCA CTG GAT ACG ACA AA A TA-3′; forward, 5′ AGA GAA GAT TAG
CAT GGC CCC TG-3′ and reverse, 5′-ATC CAG TGC AGG GTC CGA GG-3′.
Relative expression levels were analyzed using the
2−ΔΔCq method (36).
Western blot analysis
Cellular and SN tissue protein were incubated in
RIPA buffer (cat. no. R0278; Sigma-Aldrich; Merck KGaA) for 1 h,
then centrifuged at 12, 000 × g for 15 min at 4°C. The extracted
total proteins were eluted into EP tubes, and the concentration was
measured using the bicinchoninic acid (BCA) assay (cat. no. 23225,
Thermo Fisher Scientific, Inc.). Protein samples were separated on
a 10% SDS-PAGE gel and transferred to polyvinylidene difluoride
(PVDF) membranes (EMD Millipore). Membranes were blocked for 1 h at
room temperature with 5% BSA with antibodies for tyrosine
hydroxylase (TH) (1:1,000; cat. no. AB152, EMD Millipore), GPX4
(1:1,000; cat. no. ab125066, Abcam), FTH1 (1:1,000; cat. no.
ab183781, Abcam) and β-tubulin (1:1,000; cat. no. 2146S, Cell
Signaling Technology, Inc.) overnight at 4°C. The following day,
the membranes were incubated in the presence of goat anti-rabbit
secondary antibody (1:1,000; cat. no. 7074S, Cell Signaling
Technology, Inc.) for 2 h at room temperature. Bands were observed
with Protein Simple FluorChem E. Data were analyzed using ImageJ
software (version 1.52a; National Institutes of Health).
Immunohistochemistry (IHC)
A total of 12 rats were randomly divided into 2
groups (6 rats/group): The control (saline) and model (6-OHDA). On
post-surgery day 28, a total of 11 rats (1 rat from the model group
that did not reach the modeling standard was excluded from the
experiment) were anesthetized with 100 mg/kg ketamine and 10 mg/kg
xylazine intraperitoneally. The cardiac aorta injection, blood
washing and brain tissue fixation were performed using normal cold
saline and 4% paraformaldehyde solution. Frozen sections
(20-µm-thick) were subjected to antigen retrieval under high
pressure using a heated citrate buffer. Immunohistochemical
staining was performed using Histostain-Plus kits (cat. no.
SP-0022, BIOSS) according to the manufacturer's protocol. Tissues
were incubated in the presence of primary antibodies against TH
(1:250; cat. no. AB152, EMD Millipore), GPX4 (1:250; cat. no.
ab125066, Abcam) and FTH1 (1:250; cat. no. ab183781, Abcam) at 4°C
overnight. After washing, the sections were incubated with
secondary antibody (cat. no. ab6721; horseradish
peroxidase-conjugated goat anti-rabbit; 1:5,000; Abcam). Then,
diaminobenzidine (DAB) (cat. no. C02-04001; BIOSS) was added, and
controlled color development was performed under a light microscope
(Olympus, Japan) for strictly controlled amounts of time. Tissues
were counter-stained with hematoxylin (cat. no. BA4097, BaSO
Biotech) for 10 sec at room temperature, dehydrated gradually with
ethanol and coverslipped. Proteins of interest were quantified and
analyzed using ImageJ software (version 1.52a; National Institutes
of Health). The threshold feature in the menu of ImageJ software
was used to count immune cells. Each immune cell was quantified
using three IHC images, and the upper, middle, lower, left and
right parts of each IHC image were selected.
Cellular iron concentration assay
The cellular iron concentration level was detected
using a Quantichrom Iron Assay kit (cat. no. DIFE-250, BioAssay
Systems). PC12 cells were cultured in 96-well plates and
transfected with miR-335 mimic, miR-335 inhibitor, miR-335 NC, or
siRNA-FTH1, and stimulated with 6-OHDA for 24 h. Following the
manufacturer's protocol, 50 µl of standards or samples
containing 106 cells were mixed with 200 µl
Quantichrom Working Reagent in a 96-well plate and incubated at
room temperature overnight. The optical density (OD) was measured
at a wavelength of 590 nm using a microplate reader (BioTek
Instruments, Inc.).
MMP assay
MMP was detected by JC-1 staining (Beijing Solarbio
Science & Technology Co., Ltd.). Briefly, the PC12 cells were
cultured in 6-well plates, then washed with PBS. Cells were
incubated with JC-1 stain (0.5 ml) at 37°C for 20 min. A
fluorescence microscope (Olympus Corporation) was used to visualize
MMP.
Intracellular ferrous ion imaging
Intracellular ferrous ion distribution was assessed
using a FeRhoNox-1 staining kit (Goryo Chemical, Inc.). PC12 cells
(5×10⁴/well) were seeded in a 24-well microplate
overnight. Following transfection with miR-335 mimic, miR-335
inhibitor, miR-335 NC, or siRNA-FTH1, and stimulation with 6-OHDA
(50 µM) for 24 h, the cell culture medium was removed. The
cells were then incubated with 1 µM FeRhoNox-1 at 37°C for 1
h. After washing with PBS 3 times, Fe2+ distribution was
imaged using a Cytation 5™ Cell Imaging Multi-Mode Reader (BioTek
Instruments, Inc.).
Lipid peroxidation generation
detection
PC12 cells (1×10⁵/well) were seeded in
6-well plates overnight, and the cells were treated as follows:
PC12 cells were transfected with miR-335 mimic, miR-335 inhibitor,
miR-335 NC, or siRNA-FTH1, respectively, and then stimulated with
6-OHDA (50 µM) for 24 h; PC12 cells were treated with
Erastin (cat. no. HY-15763, MedChem Express), Fer-1 (cat. no.
HY-100579, MedChem Express), DFO (cat. no. HY-B0988, MedChem
Express) or Z-VAD-FMK (cat. no. HY-16658B MedChem Express) for 24
h, respectively, and then stimulated with 6-OHDA (50 µM) for
24 h. The cells were incubated with 10 µM C11-BODIPY
(581/591; cat. no. D3861, Thermo Fisher Scientific, Inc.) for 30
min at 37°C, then washed with PBS 3 times. Cells were harvested
with trypsin (cat. no. 15050-065, Gibco; Thermo Fisher Scientific,
Inc.), suspended in fresh medium, and analyzed using a CytoFLEX
flow cytometer (Beckman Coulter, Inc.). Fluorescence was measured
by acquiring green (484/510 nm). The butadienyl portion of
C11-BODIPY581/591 was oxidized, resulting in the 510 nm
fluorescence emission peak. The data were analyzed using FlowJo v10
software.
Cellular ROS detection
Cells were cultured in 6-well plates, and then
collected into tubes. Buffer (10X, provided with the kit) and
ddH2O were mixed at a ratio of 1:9 gently and thoroughly
to yield 1X buffer. Cells were resuspended with 1 ml 1x buffer and
were stained with 25 µM DCFDA (cat. no. ab113851; Abcam) in
the dark at 37°C for 30 min, then analyzed using a CytoFLEX flow
cytometer (Beckman Coulter, Inc.; 535 nm).
Dual luciferase reporter system
assay
Dual luciferase reporter (DLR) experiments were
performed on the PC12 cells. miR-335 and negative control mimic
were purchased from GenePharma Co., Ltd. First, pLUc-FTH1-wild-type
(WT) and pLUc-FTH1-mutant (MUT) plasmids (cat. nos. U6885-02 and
U6886-02, respectively; Shenzhen Huaan Ping Kang Bio Technology,
Inc.) were constructed. Cells were transfected using either WT (200
ng) or MUT (200 ng) constructs, with the miR-335 inhibitor (100
nM), miR-335 mimic (100 nM), mimic negative control (100 nM) or
inhibitor negative control (100 nM). At 24 h following
transfection, the DLR assay kit (E2920; Promega Corporation) was
utilized to detect luminescence, according to the manufacturer's
protocol. The absorbance values of sea cucumber luciferase served
as an internal reference to perform normalized statistical
calculations.
Statistical analysis
All experiments were carried out 3 times. Data
analysis was performed using GraphPad Prism 8 (GraphPad Software,
Inc.). Student's t-tests were used to determine the difference
between the 2 groups for the behavioral data, immunohistochemistry,
RT-qPCR, MTS assay and western blot analysis data (PC12 cells
induced with gradient 6-OHDA and transfected with FTH1 siRNA).
One-way ANOVA followed by post hoc Tukey's multiple comparison
tests were used to analyze the difference between groups in the
remaining western blot analysis data, cellular iron concentration
assays, MMP, cell ROS detection and DLR assay data. Data are
presented as the means ± SEM. P<0.05 was considered to indicate
a statistically significant difference.
Results
TH, GPX4 and FTH1 expression levels are
downregulated following 6-OHDA induction in rats
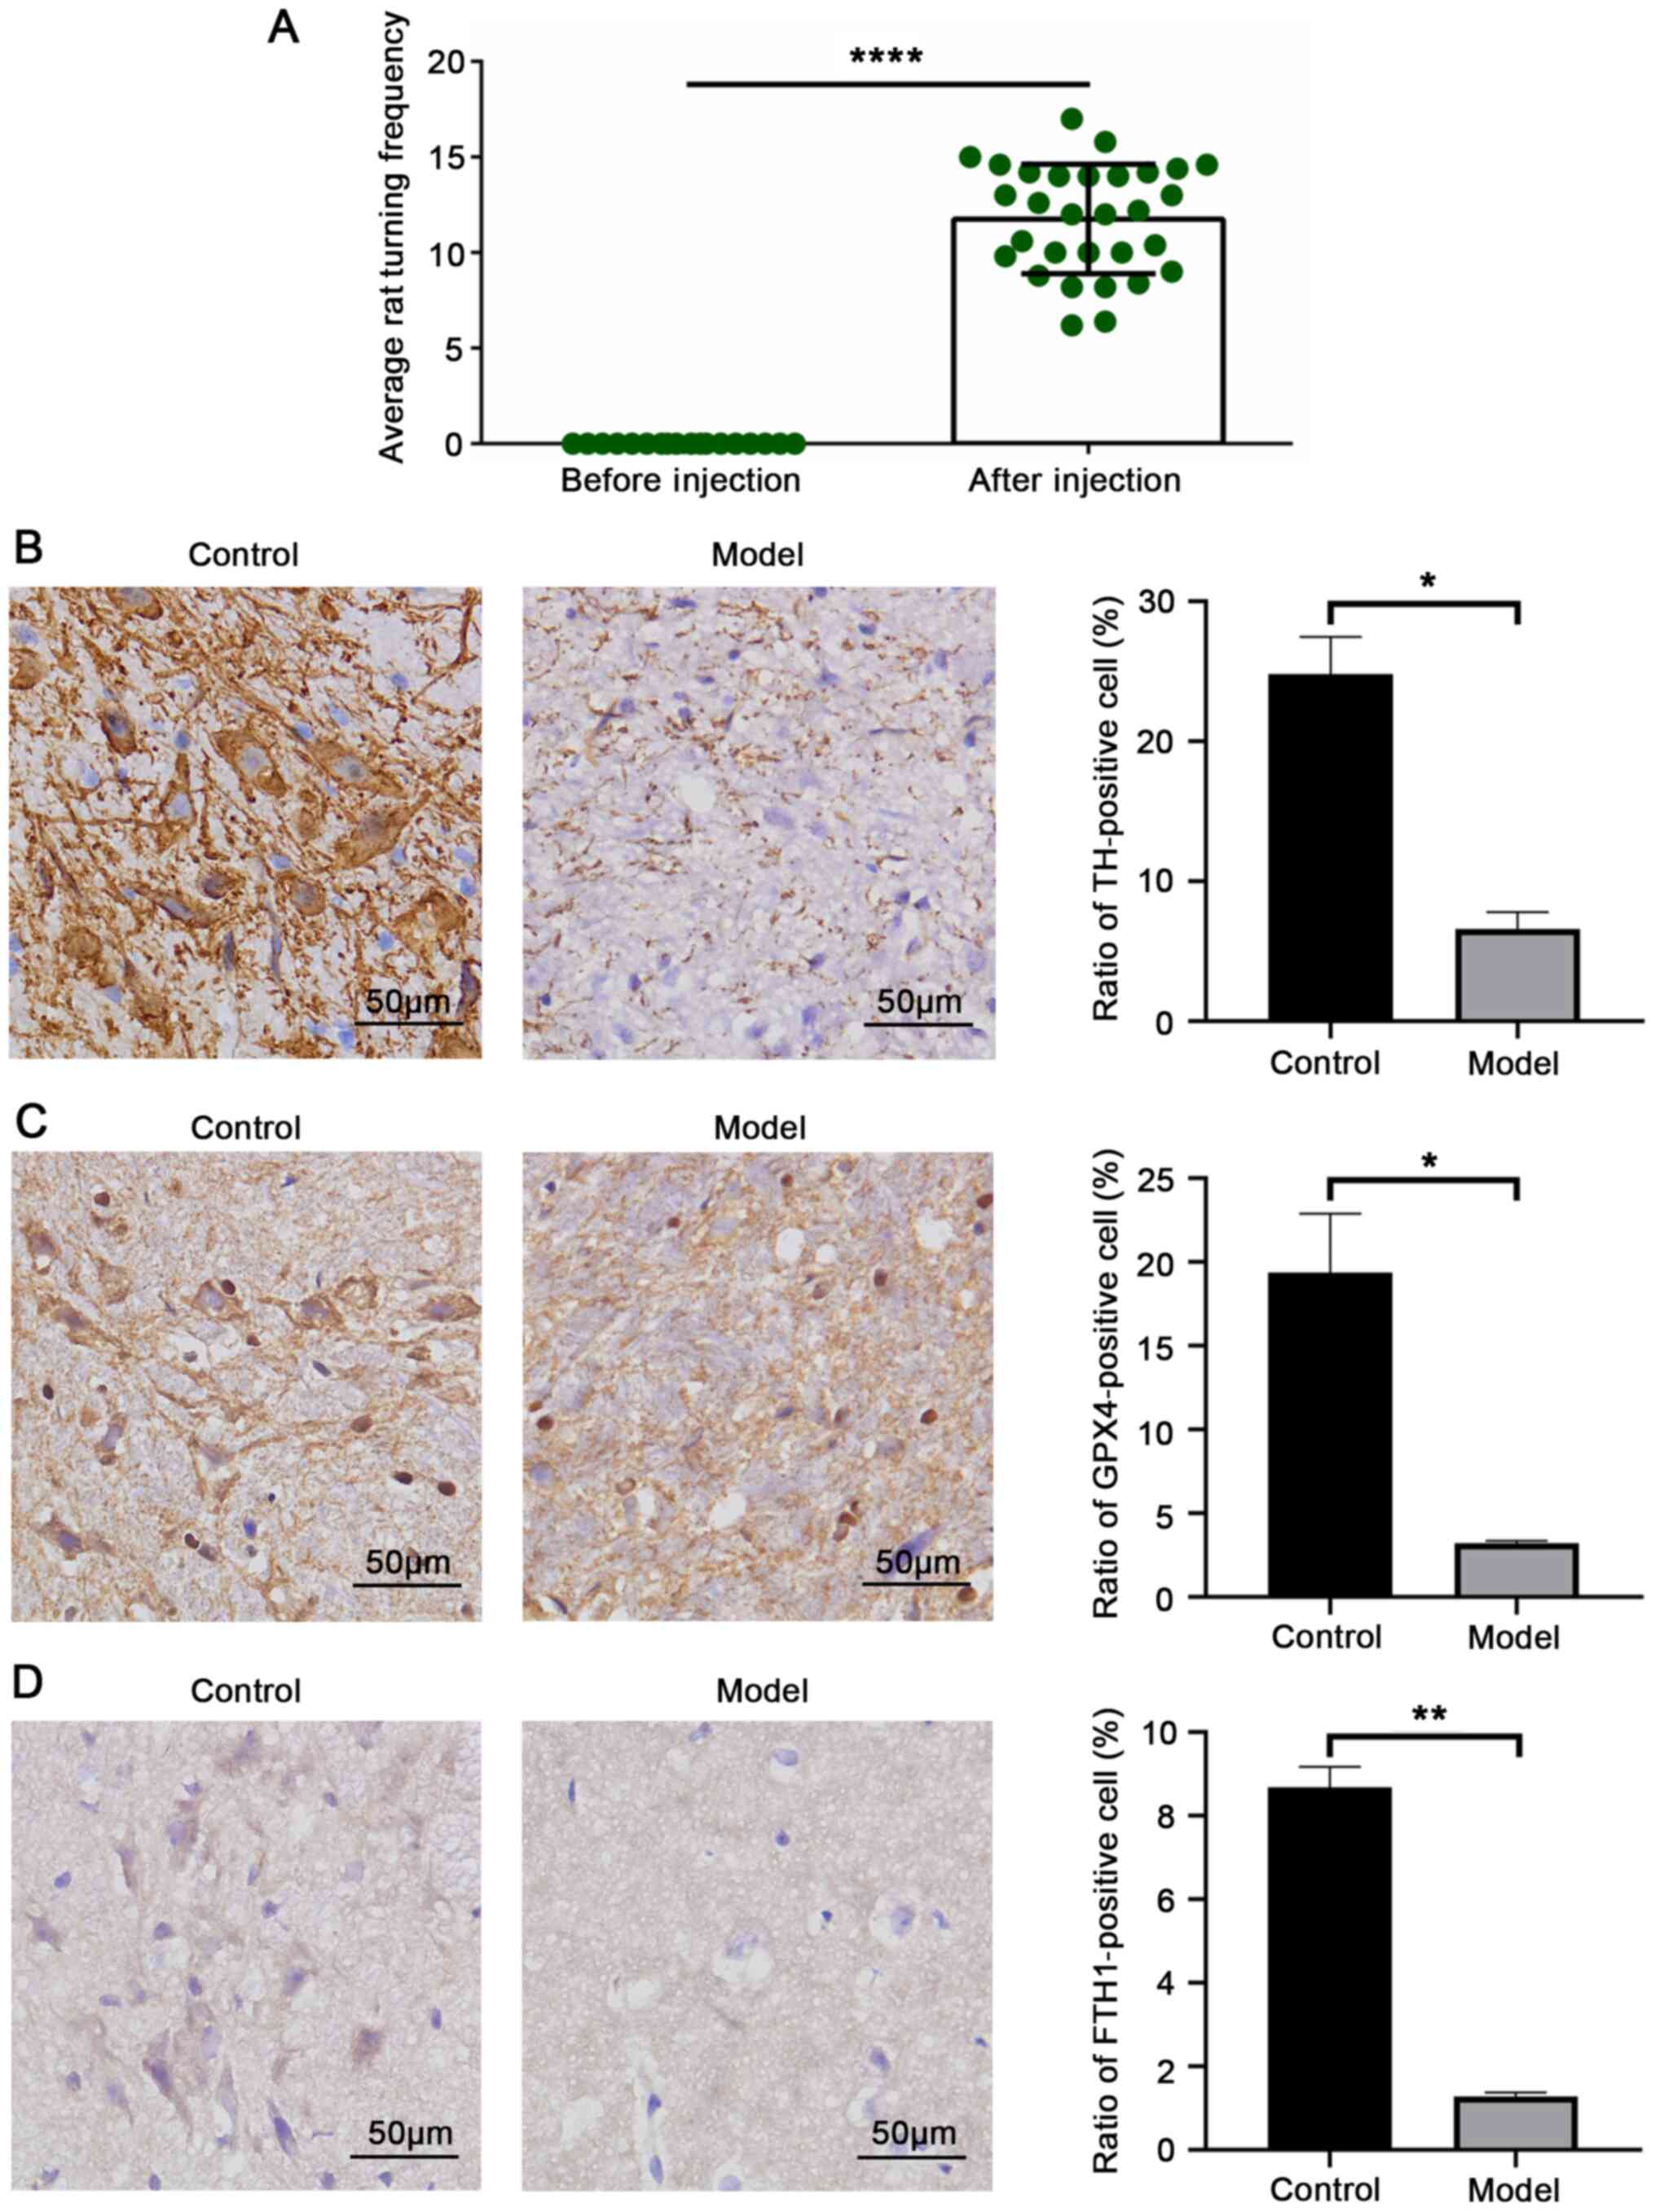
The successful establishment of the rat model of PD
was assessed by performing behavioral testing on post-surgery day
28. A total of 28 rats demonstrated >7 turns/min, and 2 rats
that did not reach the modeling standard were not included in the
subsequent experiments (P<0.0001; Fig. 1A). Brain tissue was harvested,
and immunohistochemistry was performed to detect PD-associated
pathology and ferroptosis. TH is a protein marker of dopaminergic
neurons in the nervous system (37). On day 28, the model rats
exhibited a markedly reduced TH expression in the SN, demonstrating
a significant loss of dopaminergic neurons (P=0.0125; Fig. 1B). GPX4 is a vital marker protein
of ferroptosis. The results revealed that rats exposed to 6-OHDA
exhibited a reduced expression of GPX4 and FTH1, demonstrating that
FTH1 expression was negatively associated with the level of
ferroptosis and revealing a positive association between
ferroptosis and PD in the model rats (GPX4, P=0.0229; FTH1,
P=0.0023; Fig. 1C and D).
Therefore, it is useful to explore the upstream molecules that may
target FTH1 to regulate ferroptosis in PD.
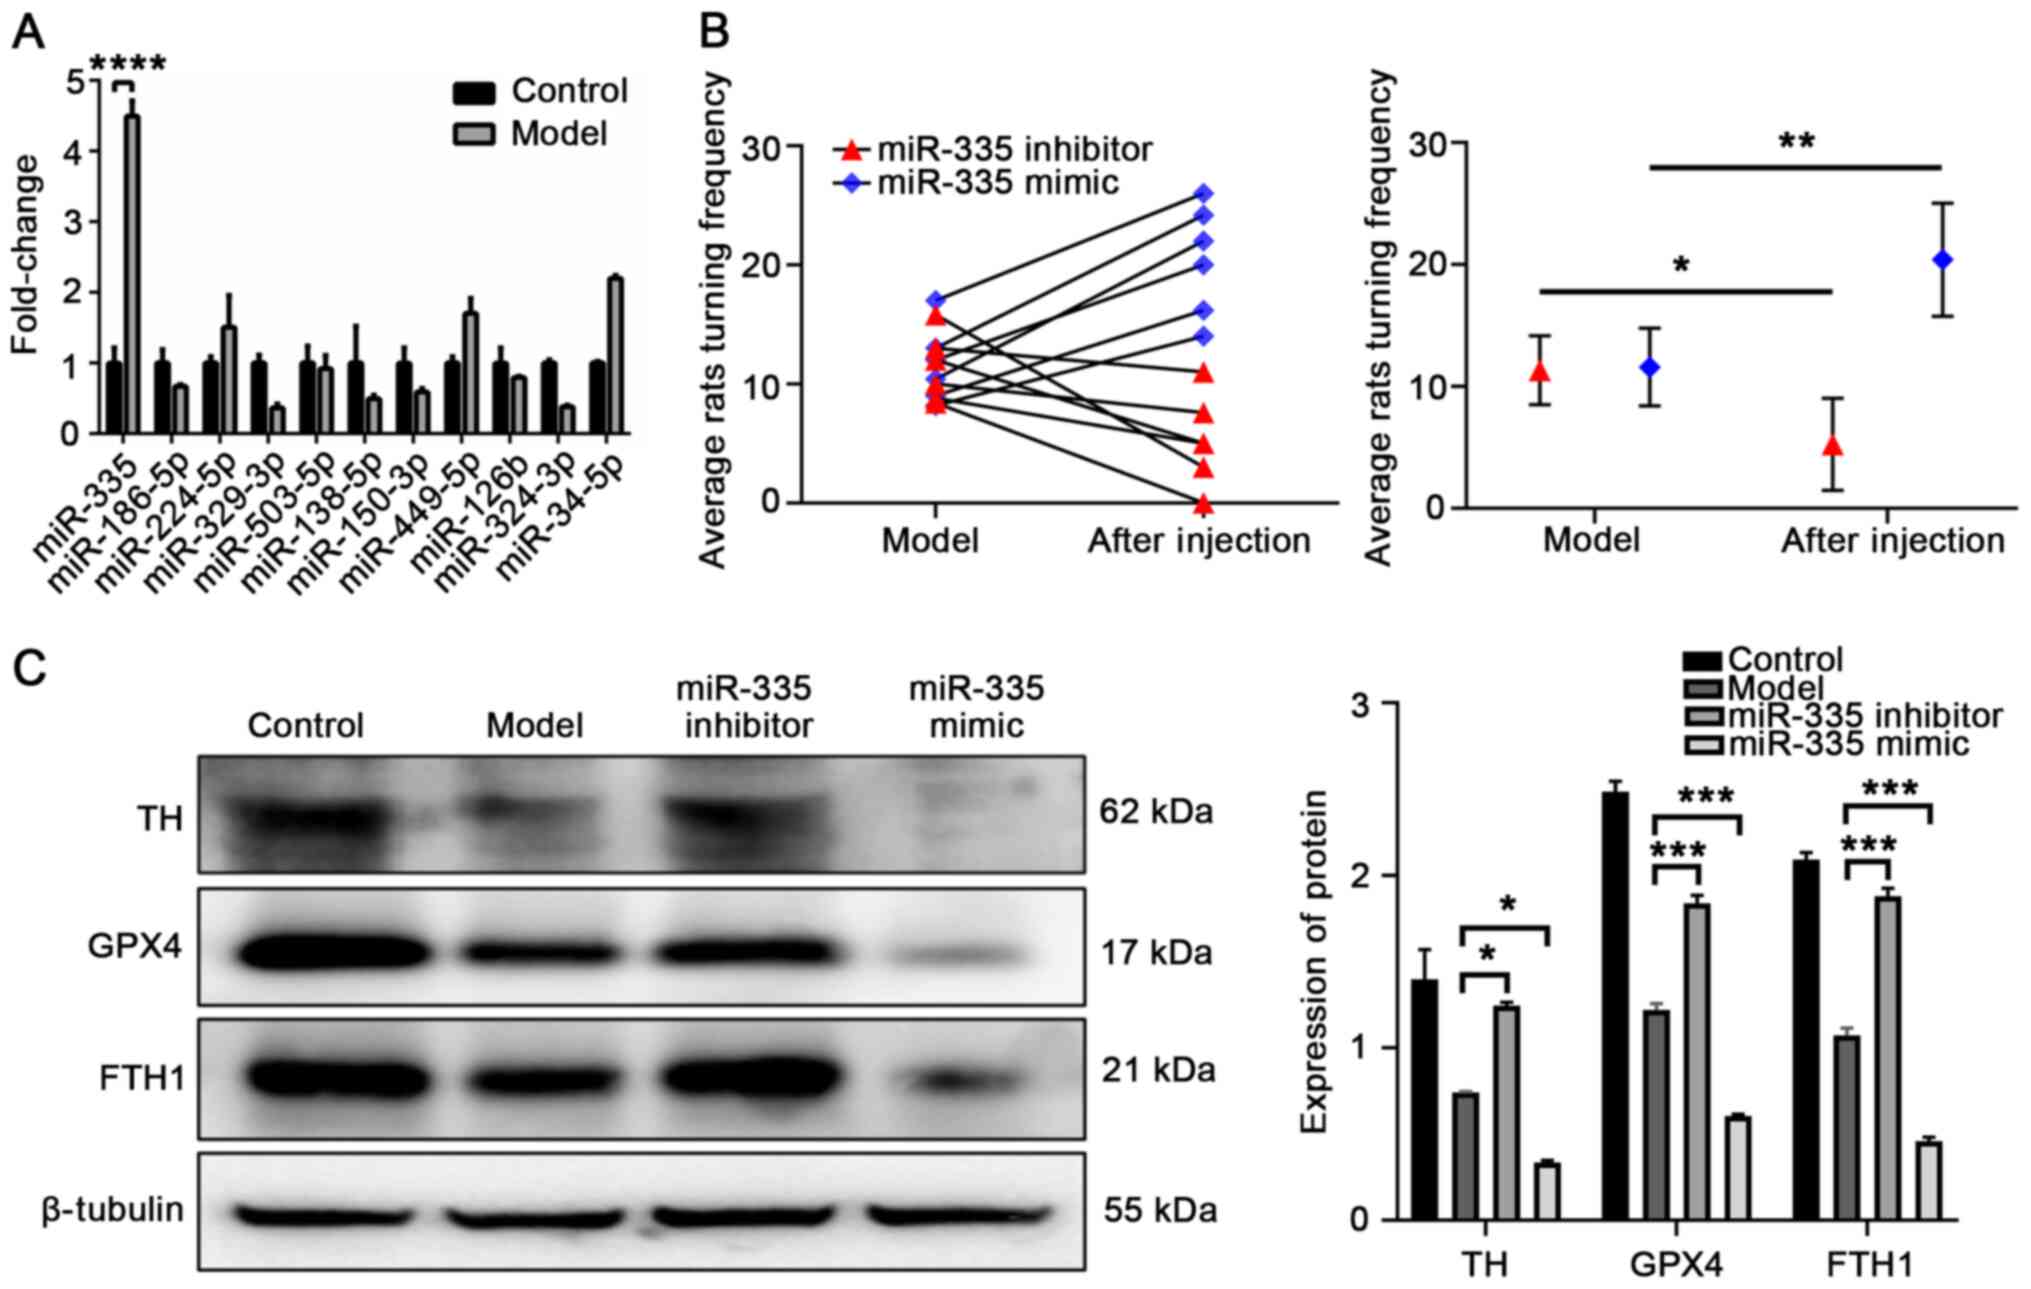
miR-335 is upregulated in PD and promotes
ferroptosis and PD pathology
The target miRNAs of FTH1 were predicted using three
prediction algorithms online: TargetScan (http://www.targetscan.org/), miRDB (http://www.mirdb.org/), and PicTar (http://www.pictar.org/). The parameters were set
according to previous studies (35-37). The differential expression of all
miRNAs predicted by 3 prediction algorithms in the the SN of
control and model rats were validated by RT-qPCR. The expression of
miR-335 was significantly higher in the model rats (P<0.0001;
Fig. 2A). To verify the damaging
effects of miR-335 in the model rats, the rats were infected with
either miR-335 mimic or miR-335 inhibitor on day 29. The results of
the behavioral analysis revealed that the rotations in the mimic
group significantly increased (P=0.0033 compared to the model
group; Fig. 2B), while those in
the inhibitor group significantly decreased (P=0.0103 compared to
the model group; Fig. 2B). These
results indicated that miR-335 exacerbated the behavioral deficits
in rats with PD. Western blot analysis was then used to detect the
effects of miR-335 on the degree of PD pathology and ferroptosis in
the SN of rats. miR-335 mimic significantly exacerbated PD injury
and promoted ferroptosis compared to the model group by decreasing
TH and GPX4 expression (TH, P=0.0329; GPX4, P=0.0005; Fig. 2C), and FTH1 expression was also
markedly downregulated (P=0.0004; Fig. 2C). These results indicated that
miR-335 promoted PD pathology and ferroptosis, and decreased FTH1
protein expression in PD rats. Moreover, there was a negative
association between miR-335 and FTH1, suggesting that miR-335 may
negatively regulate the expression of FTH1 in vivo.
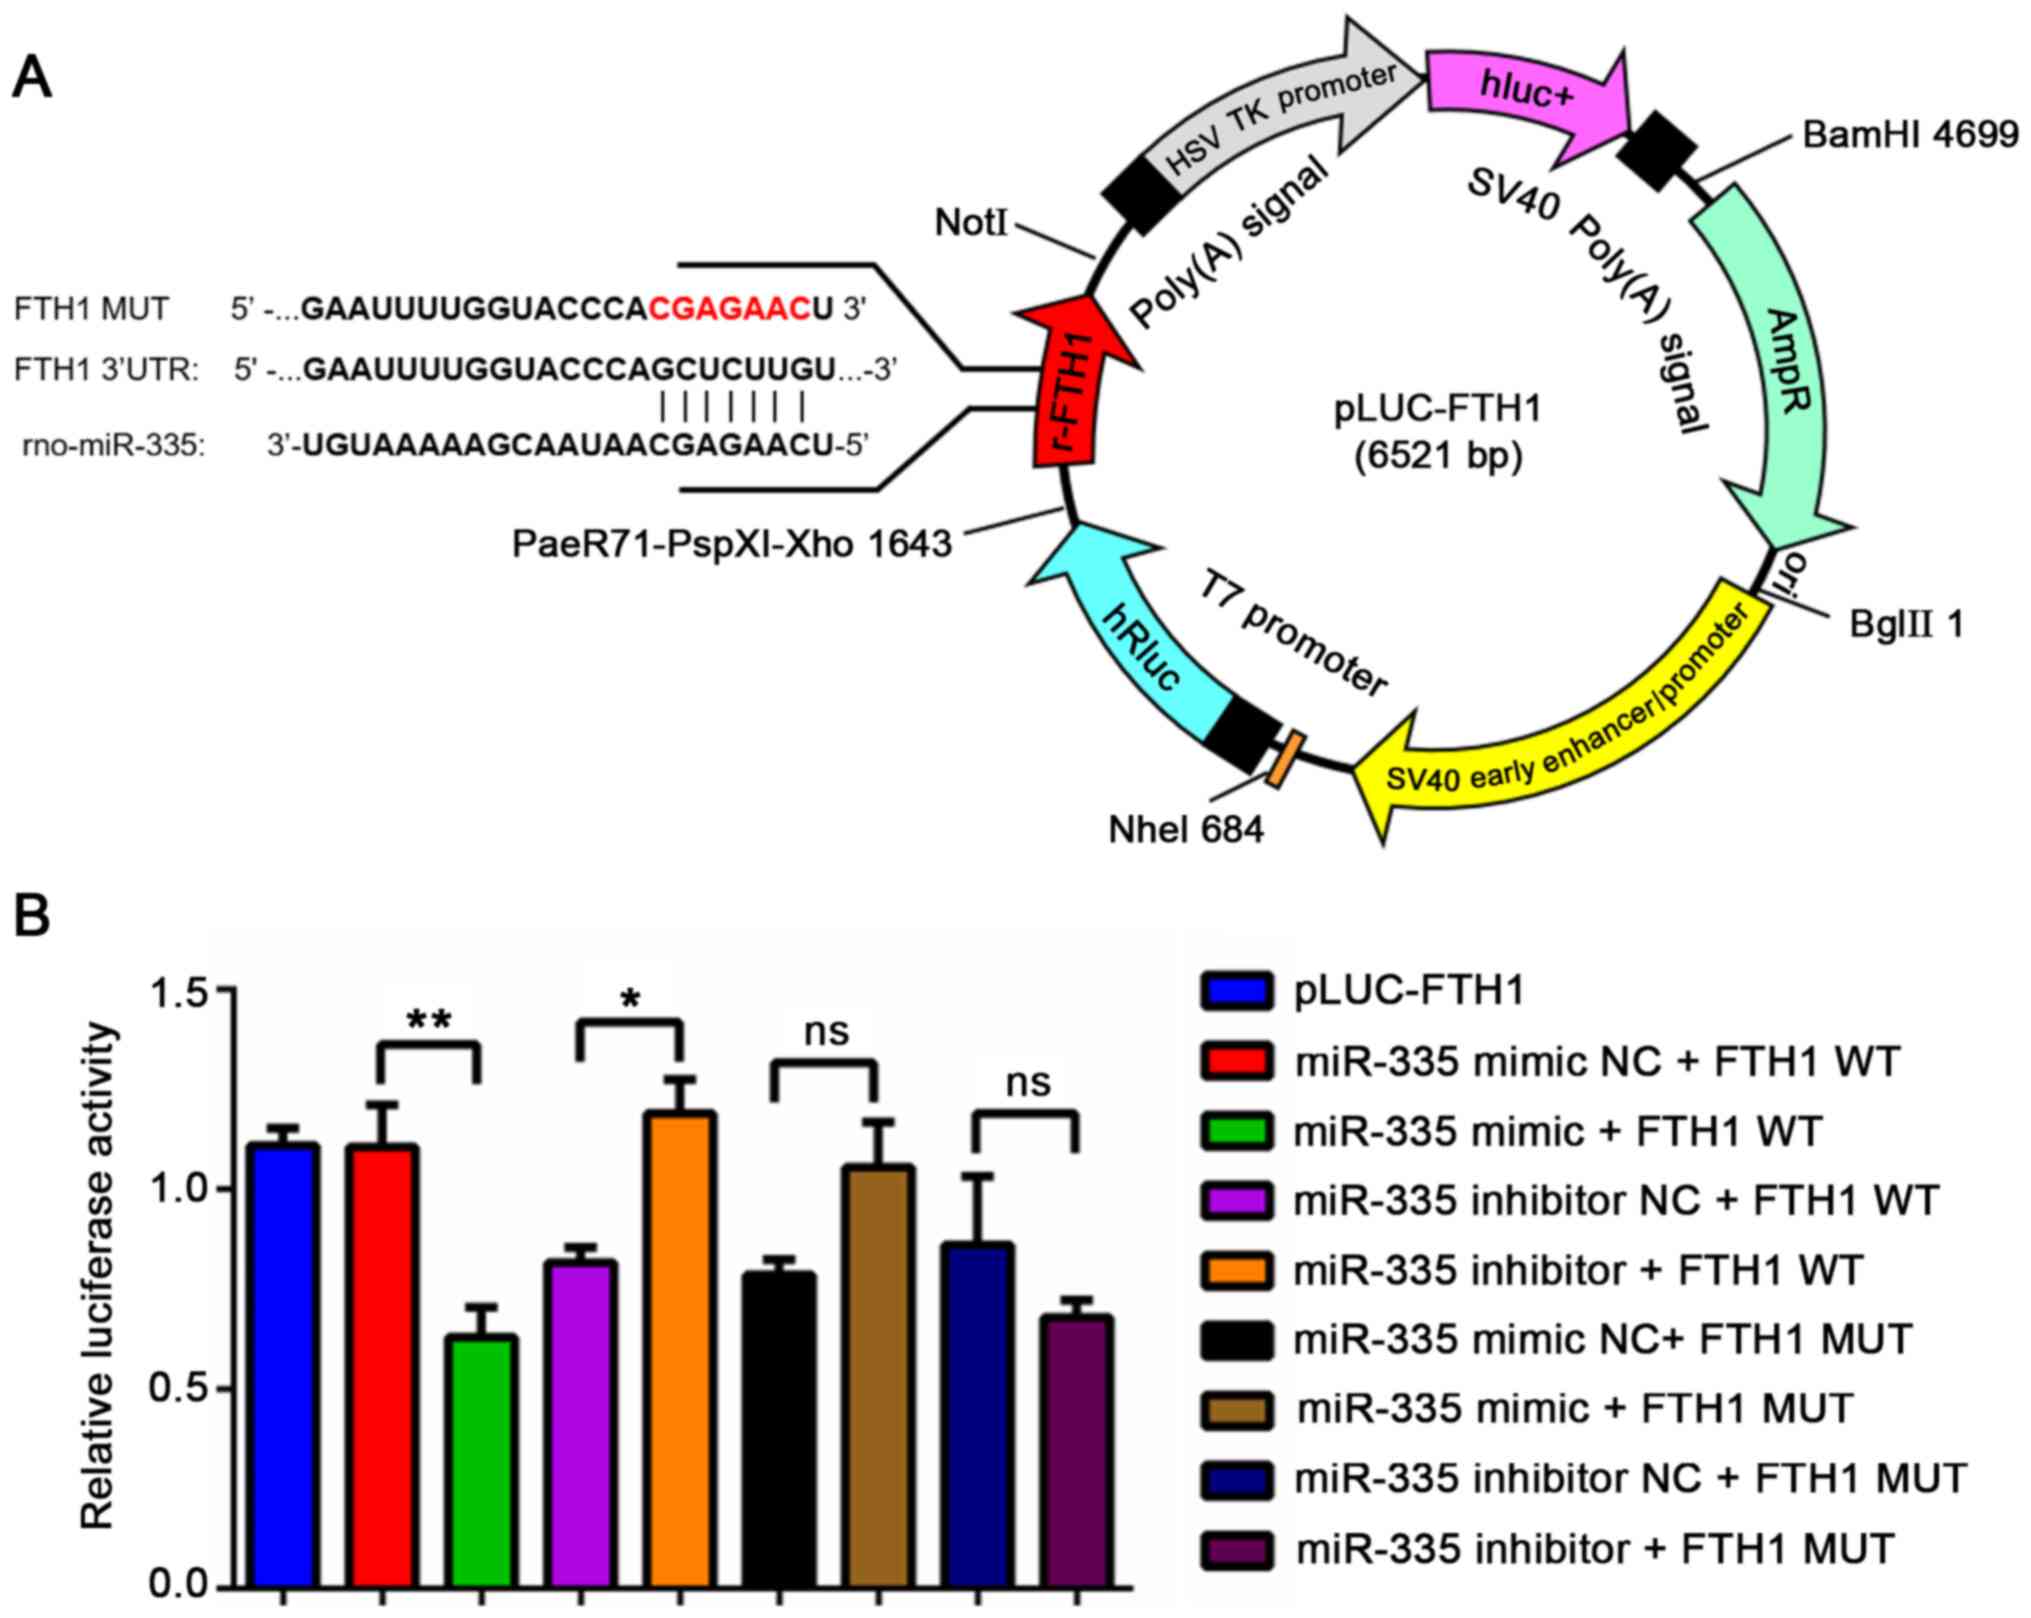
miR-335 targets the 3′UTR of FTH1
mRNA
Based on these results, miR-335 was predicted to
regulate FTH1. The present study then investigated whether miR-335
functions by binding with the 3′UTR of FTH1 mRNA. The binding site
between miR-335 and FTH1 was predicted using TargetScan, and the
plasmid profile is illustrated in Fig. 3A. A DLR assay was then conducted
to demonstrate their interaction and determined an inhibitory
effect of miR-335 mimic on the luciferase activity of WT FTH1 (FTH1
WT) after 24 h of transfection. Compared with the miR-335 mimic NC
+ FTH1 WT group, the relative luciferase activity of the miR-335
mimic + FTH1 WT group was significantly decreased (P=0.0088,
Fig. 3B); compared with the
miR-335 inhibitor NC + FTH1 WT group, the relative luciferase
activity of the miR-335 inhibitor + FTH1 WT group was significantly
increased (Fig. 3B, P=0.0387);
there was no statistically significant difference between each
group, following co-transfection with the FTH1-MUT plasmid
(Fig. 3B, P<0.05). These
results demonstrate that miR-335 targets the 3′UTR of FTH1
mRNA.
Expression of TH, GPX4 and FTH1 is
decreased in 6-OHDA-stimulated cells
Cell activity assays were performed to explore the
optimal 6-OHDA induction time and concentration to model PD in
vitro. As shown in Fig. 4A,
PC12 cells were exposed to 6-OHDA at a range of concentrations
(0-250 µM) over a period of time (12-24 h). Cell viability
was found to be reduced in a concentration- and time-dependent
manner. The transient exposure of the PC12 cells to 50 µM of
6-OHDA for 24 h led to a 50% decrease in cell viability
(P<0.0001). Thus, this protocol was adopted for use in
subsequent experiments.
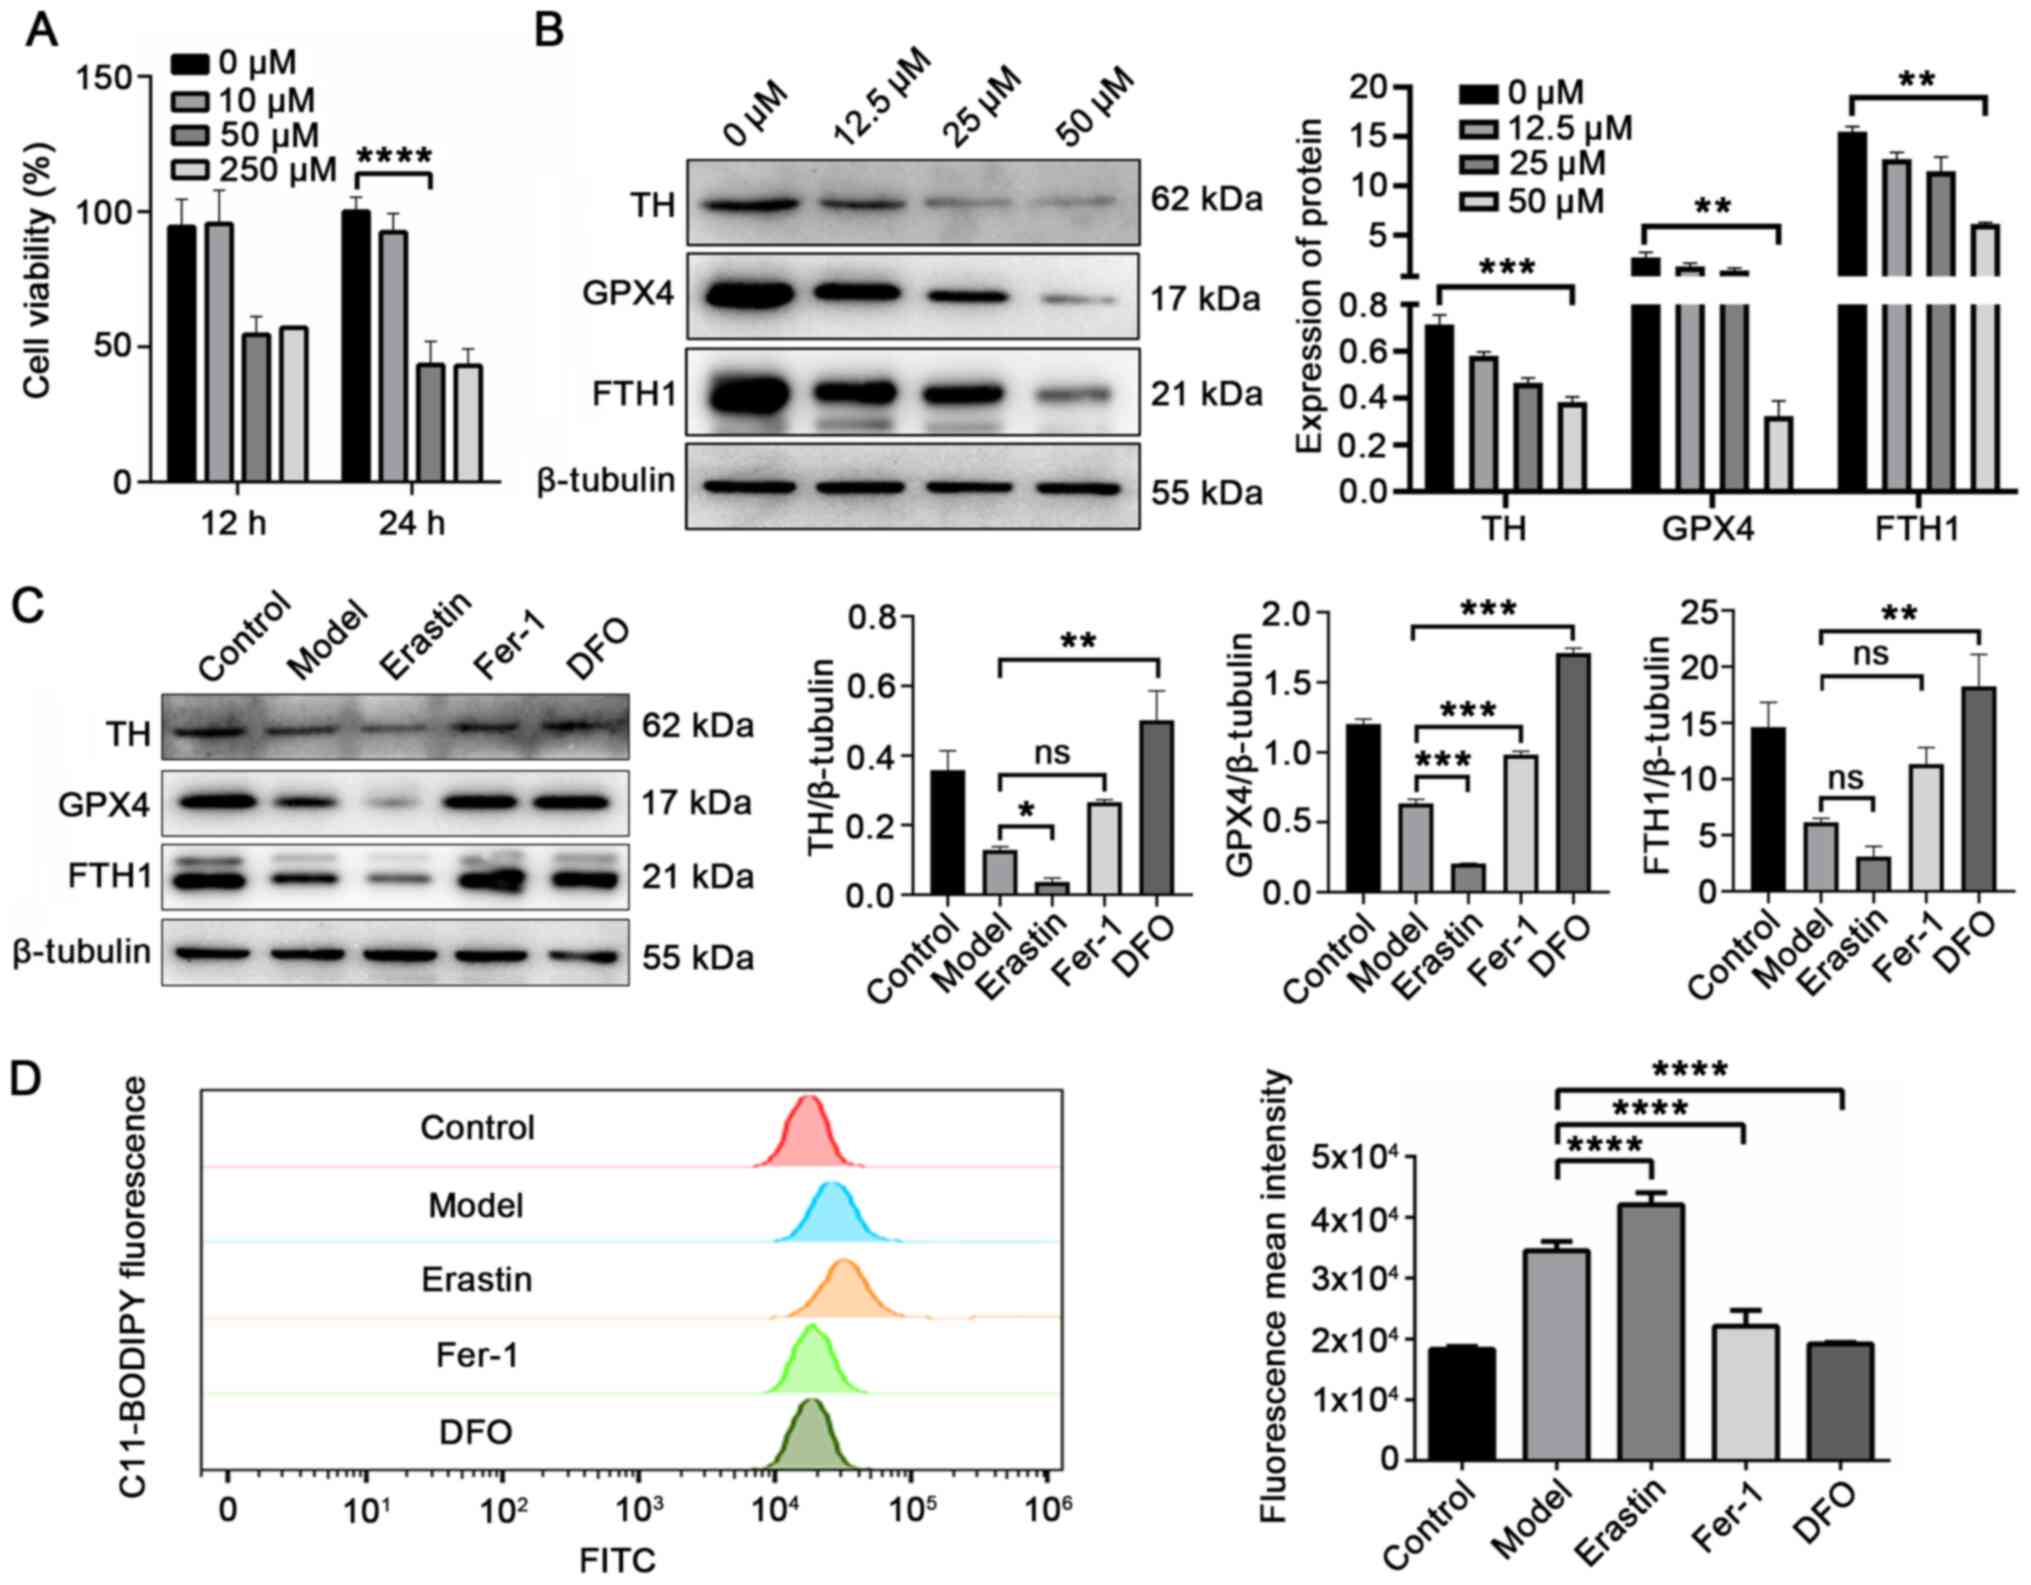 | Figure 4FTH1 expression is negatively
associated with ferroptosis, and ferroptosis is positively
associated with PD pathology. (A) Cell viability was significantly
reduced to approximately 50% following induction with 50 µM
6-OHDA for 24 h. (B) Expression of TH, GPX4 and FTH1 was inversely
proportional to 6-OHDA from 0 to 50 µM. (C) 6-OHDA-stimulted
cells, further treated with the ferroptosis inducer, erastin (1
µM), exhibited a reduced expression of TH, GPX4 and FTH1.
The ferroptosis inhibitors, Fer-1 (2.5 µM) and DFO (25
µM), increased these expression levels. (D) Fluorescent
C11-BODIPY staining and FACS analysis were used to evaluate the
formation of lipid peroxides in model cells and 6-OHDA-stimulted
cells co-treated with erastin (ferroptosis inducer), Fer-1
(ferroptosis inhibitor) and DFO (iron chelator).
*P<0.05, **P<0.01,
***P<0.001 and ****P<0.0001 vs. model
group; ns, not significant. PD, Parkinson's disease; FTH1, ferritin
heavy chain 1; 6-OHDA, 6-hydroxydopamine; Fer-1, ferrostatin-1;
DFO, deferoxamine. |
The present study then investigated whether the
expression patterns of GPX4 and FTH1 were similar in the cell model
to those of the rats with PD. Western blot analysis was used to
detect the expression of TH, GPX4 and FTH1 in PC12 cells following
stimulation with 6-OHDA. With the increasing 6-OHDA concentration,
the expression of TH, GPX4 and FTH1 gradually decreased (Fig. 4B). These results demonstrated
that with the onset of injury, the expression of TH, GPX4 and FTH1
was downregulated, which corresponds to the results obtained in the
animal experiments.
Subsequently, the effect sof inducer or inhibitor of
ferroptosis and inhibitors of other cell death mechanisms (such as
apoptosis) on 6-OHDA-stimulated cells were investigated. The
effects of the ferroptosis inducer, erastin, and the inhibitors,
Fer-1 and DFO, on the expression of TH, GPX4 and FTH1 were
investigated in 6-OHDA-stimulated cells. As shown in Fig. 4C, erastin treatment aggravated
the effects of 6-OHDA. Compared with the model group, the
expression of TH, GPX4 and FTH1 was significantly downregulated in
the erastin group (cells stimulated with 6-OHDA and erastin). These
effects were attenuated by the ferroptosis inhibitor, Fer-1, and
the iron chelator, DFO (38).
The level of lipid peroxides was increased by 21.9% in the erastin
group (P=0.0015) and decreased by 35.9% (P<0.0001) and 44.4%
(P<0.0001) in the Fer-1 group and DFO group compared with model
group (Fig. 4D). Moreover, the
level of lipid peroxidation, and the expression levels of TH, GPX4
and FTH1 were not affected by the apoptosis inhibitor, Z-VAD-FMK,
compared with the model group (Fig.
S1; P>0.05). These results suggested that 6-OHDA induced
some degree of ferroptotic death and ferroptosis was the main cell
death mechanism of the 6-OHDA-induced cell models. FTH1 degradation
accompanied the process of ferroptosis.
Taken together, the in vivo (Figs. 1 and 2) and in vitro (Fig. 4) results indicated that FTH1
expression was negatively associated with ferroptosis, and that
ferroptosis was positively associated with PD pathology.
miR-335 increases ferroptosis and
aggravates PD injury in 6-OHDA-stimulated cells
To determine the expression of miR-335 in
6-OHDA-stimulated cells, RT-qPCR was performed in 6-OHDA-stimulated
cells. The results revealed that miR-335 was highly expressed in
6-OHDA-stimulated cells (P<0.0001; Fig. 5A). The present study then
determined whether miR-335 promotes ferroptosis in PD in
vitro. The 6-OHDA-stimulated cells were transfected with
miR-335. The inhibition of GPX4 function leads to the
Fe2+-dependent formation of toxic lipid ROS, resulting
in the induction of ferroptosis (8). Therefore, the expression of GPX4,
the level of Fe2+, lipid peroxidation, cellular ROS and
MMP were measured as indicators of ferroptosis. Western blot
analysis was performed to detect the regulatory effects of miR-335
on GPX4, FTH1 and PD pathology in 6-OHDA-stimulated cells. As shown
in Fig. 5B, miR-335 mimic
significantly exacerbated PD pathology, and reduced GPX4 and FTH1
expression compared with the model group (TH, P=0.1439; GPX4,
P=0.0322; FTH1, P=0.0002). The cellular iron concentration results
revealed that Fe2+ increased by 21.1% in the mimic group
compared with the model group (P=0.0413, Fig. 5C). In addition, the results of
ferrous ion imaging confirmed that miR-335 further led to the
accumulation of Fe2+ in 6-OHDA-stimulated cells
(Fig. S2). Moreover, compared
with the model group, both lipid peroxidation and the ROS level
increased significantly in the mimic group (P=0.0312, Fig. 5D; P<0.0001, Fig. 5E). Mitochondrial dysfunction is
an important indicator of ferroptosis. Further detection of
mitochondrial dysfunction was performed by JC-1 staining. When the
MMP was high, JC-1 accumulated in the mitochondria matrix and
formed a polymer; when MMP was low, it formed a monomer. As shown
in Fig. 5F, MMP was
significantly reduced in the mimic group (P=0.0426). These results
indicated that miR-335 inhibited the expression of GPX4 and FTH1,
thereby increasing the level of Fe2+. The
Fe2+-dependent accumulation of lipid ROS led to the
mitochondrial dysfunction, which downregulated the level of MMP,
resulting in ferroptosis and PD aggravation.
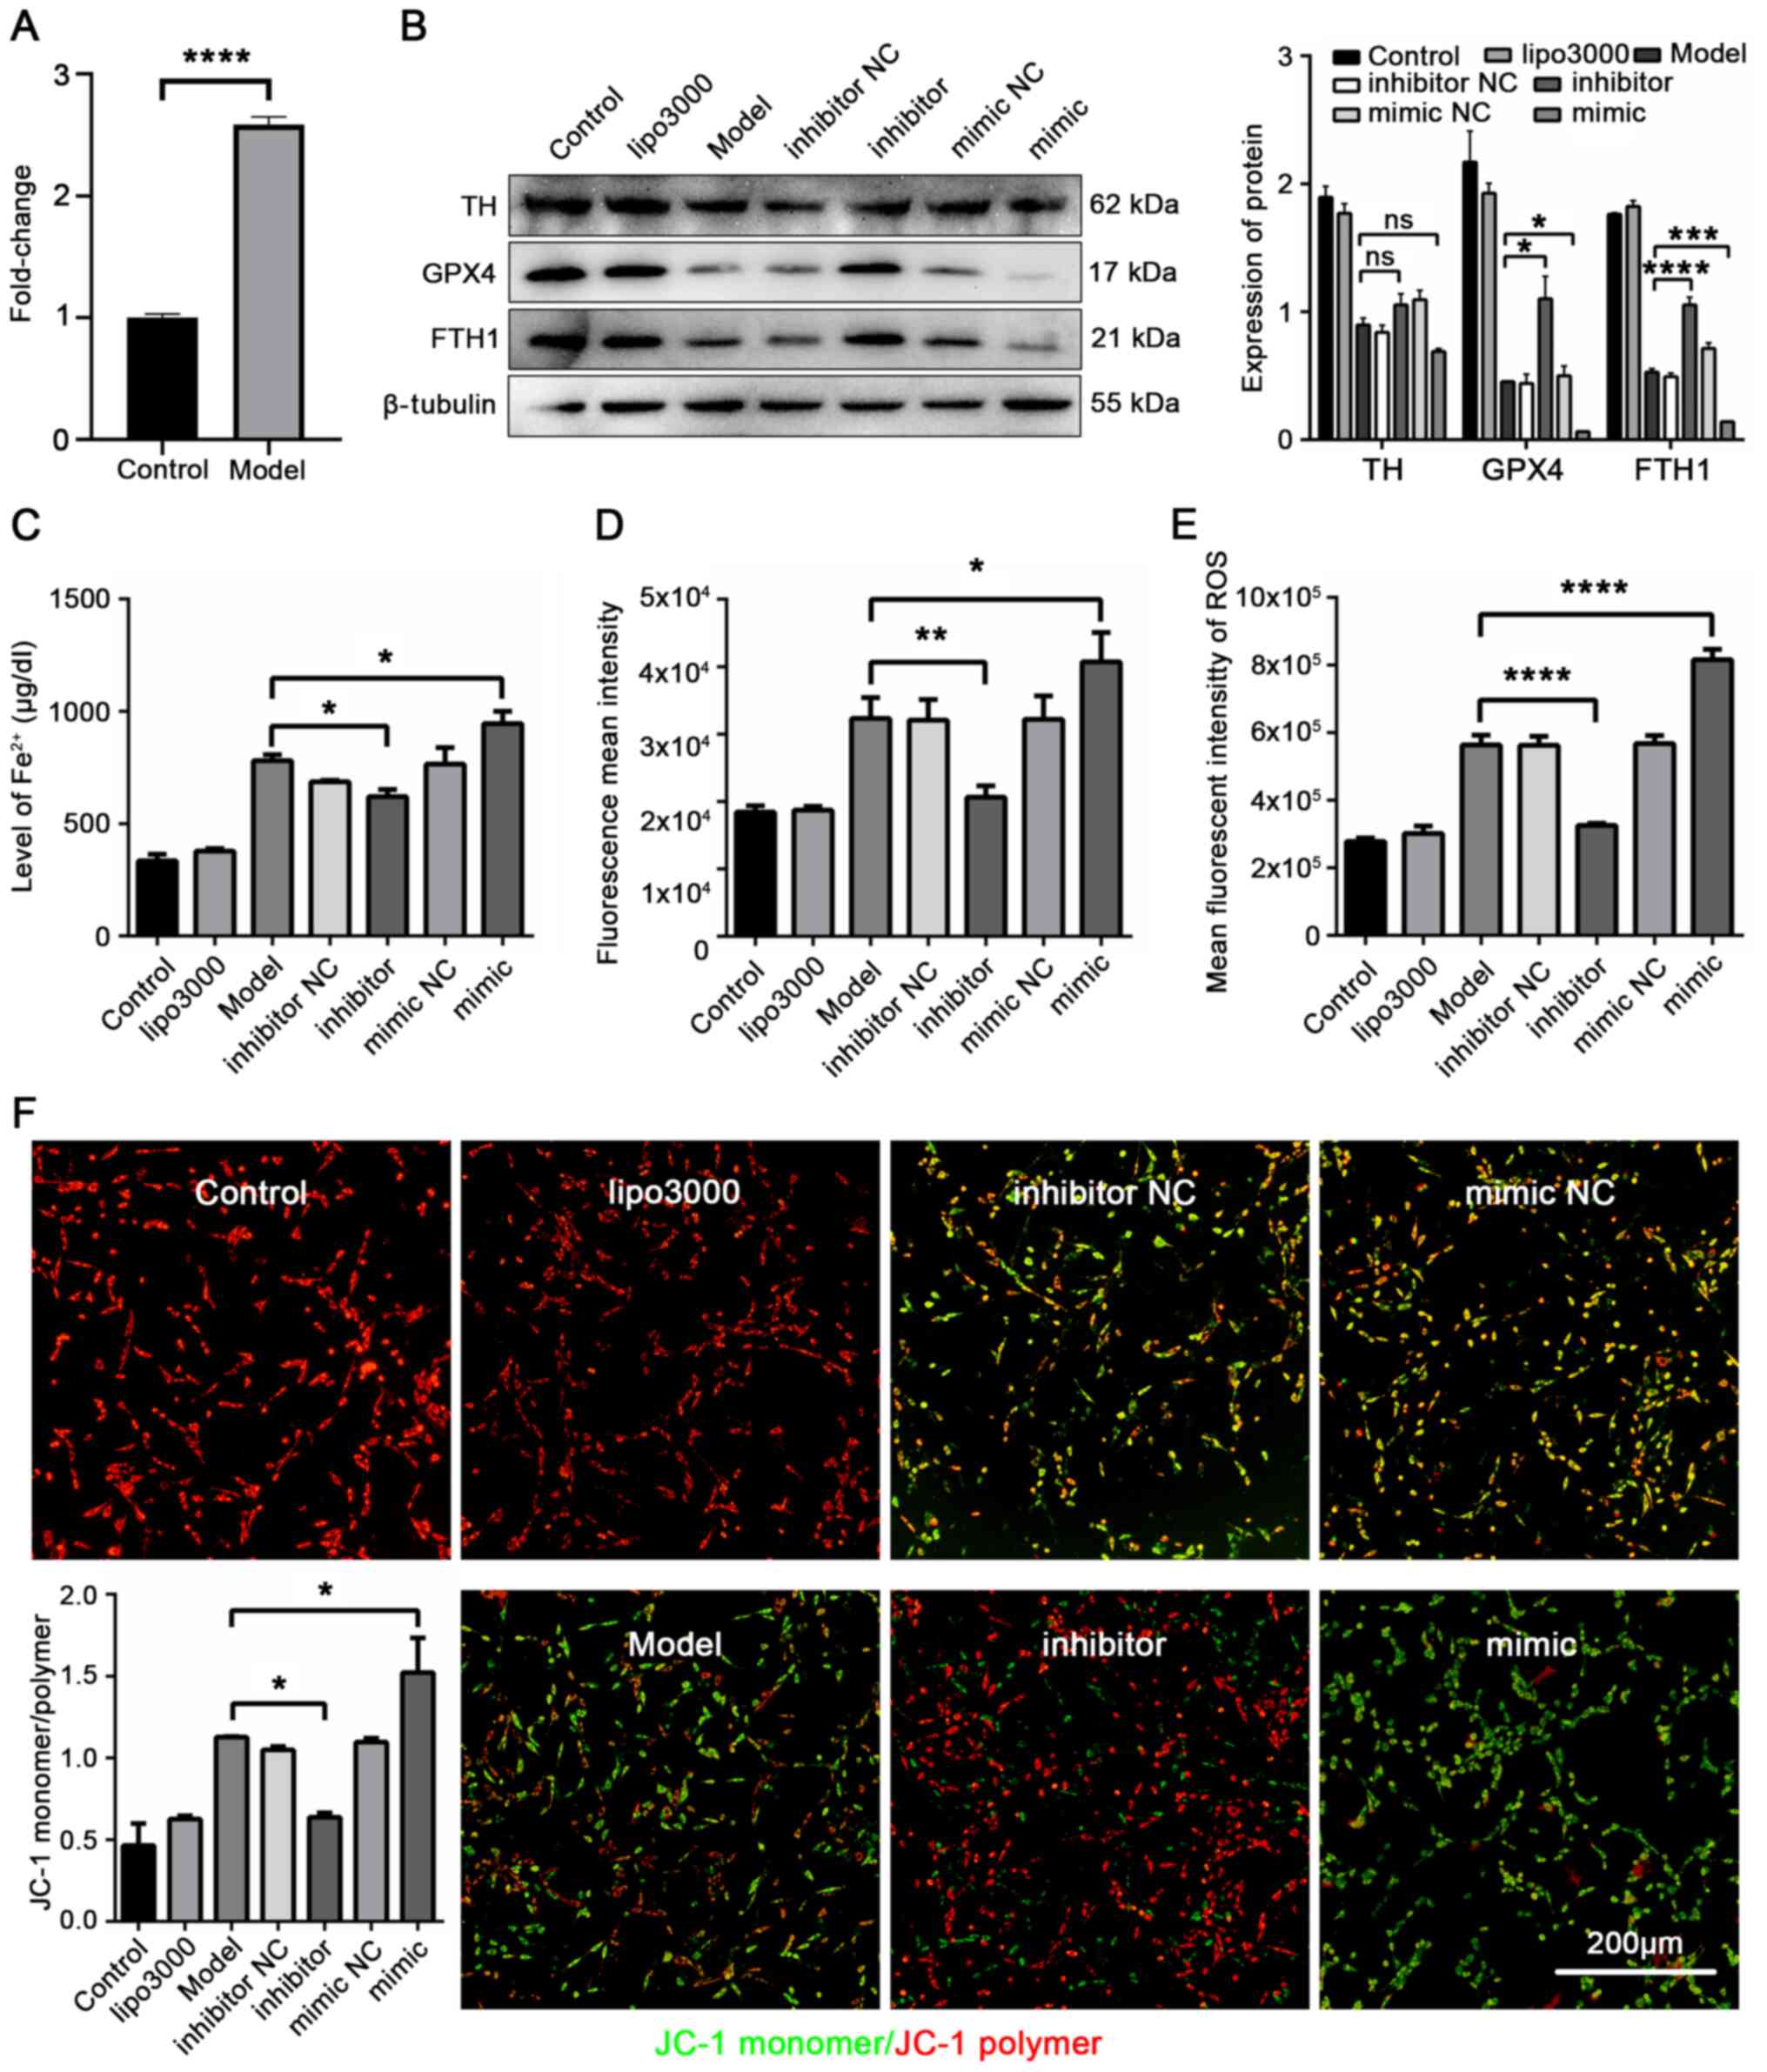 | Figure 5miR-335 promotes ferroptosis and
reduces the expression of TH, GPX4 and FTH1 in 6-OHDA-stimulated
cells. (A) Expression of miR-335 in 6-OHDA induced cells was
markedly increased. (B) Expression of TH, GPX4 and FTH1 in PD cells
was reduced by miR-335 mimic. (C) miR-335 increased the iron
concentration in 6-OHDA-stimulated cells. (D) miR-335 increased
lipid peroxidation in 6-OHDA-stimulated cells. (E) miR-335
significantly increased ROS levels in 6-OHDA-stimulated cells. (F)
miR-335 downregulated MMP in 6-OHDA-stimulated cells.
*P<0.05, **P<0.01,
***P<0.001 and ****P<0.0001 vs. model
group; ns, not significant. Scale bar, 200 µm. Parkinson's
disease; TH, tyrosine hydroxylase; GPX4, glutathione peroxidase 4;
FTH1, ferritin heavy chain 1; 6-OHDA, 6-hydroxydopamine. |
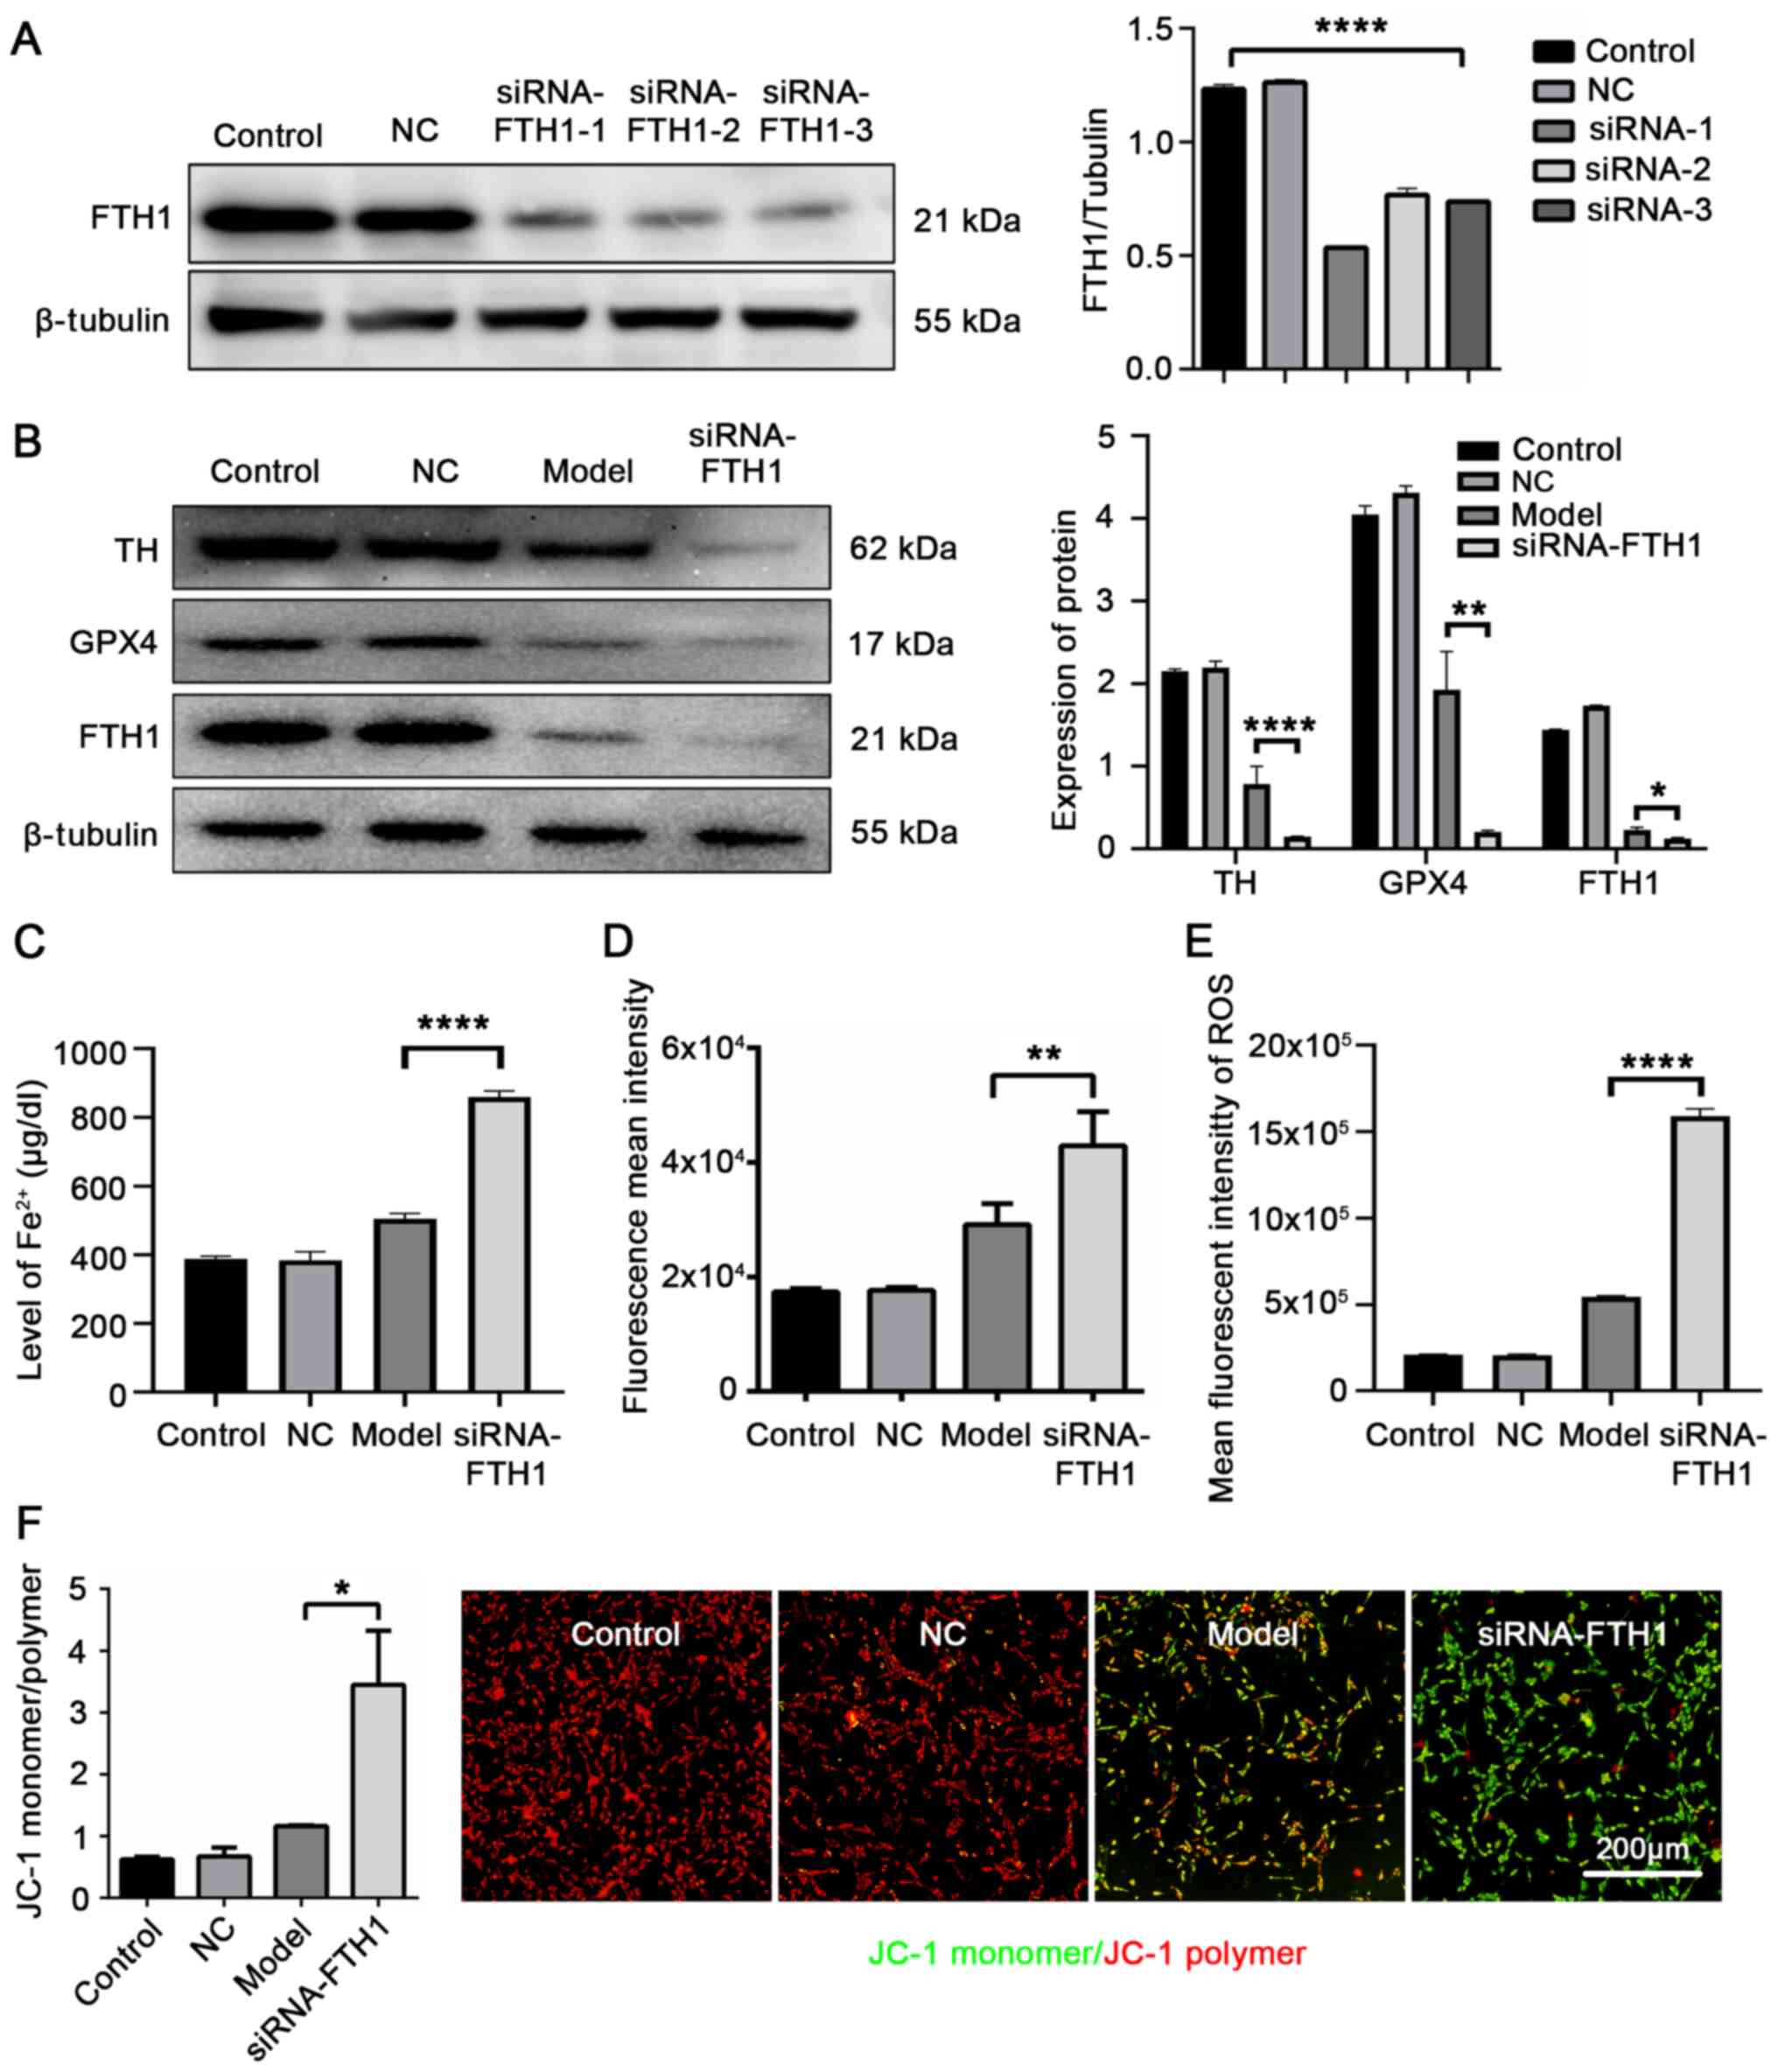
FTH1 silencing increases ferroptosis and
further exacerbates PD pathology
To further verify the role of FTH1 in PD pathology
and ferroptosis in vitro, RNA interference (RNAi) was
performed in 6-OHDA-stimulated cells to silence the expression of
FTH1. siRNA-FTH1-1 was the most efficient sequence for silencing
(Fig. 6A). Following
transfection, the model and siRNA-FTH1 groups were stimulated with
6-OHDA. As shown in Fig. 6B, the
TH and GPX4 expression levels were further decreased in the
FTH1-siRNA-transfected 6-OHDA-stimulated cells (P<0.0001;
P=0.0071 vs. model group). The analysis of the cellular iron
concentration revealed that the Fe2+ concentration was
increased by si-FTH1 (P<0.0001; Fig. 6C). The ferrous ion imaging
results also confirmed that si-FTH1 led to the further accumulation
of Fe2+ in the 6-OHDA-stimulated cells (Fig. S3). Moreover, lipid peroxidation
and cellular ROS levels were increased by si-FTH1 compared with the
model group (P=0.0061, Fig. 6D;
P<0.0001, Fig. 6E). JC-1
staining indicated that MMP was decreased by si-FTH1 compared with
the model group (P=0.0227, Fig.
6F). These data provide further evidence that FTH1 plays a
crucial role in PD pathology and ferroptosis. FTH1 degradation
released a large amount of Fe2+, which led to the
accumulation of toxic lipid peroxides and ROS to damage the
mitochondria. The decline in the MMP level was the manifestation of
mitochondrial dysfunction.
Discussion
The present study used 6-OHDA-induced rat and cell
models to simulate the pathology of mid-late stage PD, in order to
explore the role of miRNA in the Fe2+ regulation of
ferroptosis. The major findings were the following: i) In both the
rat and cell models of PD, FTH1 expression was negatively
associated with ferroptosis, and there was a positive association
between ferroptosis and PD pathology; ii) miR-335 expression was
increased in the rat model of PD, and targeted the 3′UTR of FTH1
mRNA; iii) the exacerbation of ferroptosis, promoted by miR-335,
increased the Fe2+ concentration by inhibiting FTH1
expression in PD. The results also identified a novel role of
miR-335 to directly target FTH1, acting as an essential regulator
for the ferroptosis signaling pathway in PD.
One of the pivotal results of the present study was
that FTH1 expression was negatively associated with the level of
ferroptosis in PD. In the present study, GPX4 and TH expression was
decreased in the model group compared with the control group. The
expression of TH, GPX4 and FTH1 in the 6-OHDA-stimulated cells was
not affected by the apoptosis inhibitor, Z-VAD-FMK (Fig. S1A). The level of ferroptosis and
PD pathology was increased using siRNA against FTH1, indicating
that decreasing FTH1 expression can promote ferroptosis and
dopaminergic neuron loss in PD. In a previous study, the authors
demonstrated that FTH1 linked ferritinophagy to ferroptosis in a
model of 6-OHDA-induced PD (14). The function of FTH1 is mainly to
store Fe2+ in eukaryotic cells in a soluble and
non-toxic form, thereby preventing ferroptosis (39,40). The results of the present study
are in accordance with those of previous studies identifying a
protective role for FTH1 in Fe2+ storage and ferroptosis
in PD (13,15). Moreover, GPX4 expression was
significantly reduced in neurons of the SN in the PD-affected brain
(41). Therefore, the present
study suggests that FTH1 plays a crucial role in reducing
ferroptosis and alleviating dopaminergic neuron damage in PD.
Another important finding of the present study was
that miR-335 promoted ferroptosis by inhibiting FTH1 expression in
in vitro and in vivo PD models. Previously, it was
unclear how miRNA regulates the level of ferroptosis in response to
PD. In the present study, the results of RT-qPCR and DLR assay
demonstrated that miR-335 specifically targets FTH1. The results of
western blot analysis, cellular iron concentration assay, cellular
ROS detection and MMP assays revealed that miR-335 aggravated
ferroptosis and PD injury by inhibiting FTH1 expression. These
results support the finding that miRNAs act as crucial mediators of
ferroptosis in PD by regulating protein translation (42-45). The findings of the present study
provide new insight into the therapeutic potential of inhibiting
miR-335 to increase the expression of FTH1, reduce Fe2+
concentration, and ultimately prevent ferroptosis in PD.
The results have important clinical implications.
Firstly, miR-335 could be a potential biomarker in the diagnosis of
PD and may represent a novel therapeutic target. However, clinical
trials are required to further elucidate and validate this
potential. Secondly, there are few therapies available for the
treatment of PD using small molecules. The gold standard treatment
currently used in patients with PD is orally-administered levodopa
(L-dopa). However, L-dopa produces adverse drug reactions including
dyskinesias and involuntary movement (46), resulting in increased financial
and psychological burden for patients with PD. Molecular therapy
currently presents a unique effect on neoplastic diseases, but is
not generally used in PD. The results of the present study
identified a potential therapy which may be used to protect against
PD progression by inhibiting the expression of miR-335.
In conclusion, the present study demonstrates an
important mechanism wherein miR-335 promotes ferroptosis in PD by
inhibiting FTH1 expression in vitro and in vivo.
These results provide a novel therapeutic approach for the
treatment of PD, based on the regulation of the
miR-335-FTH1-ferroptosis signaling pathway.
Supplementary Data
Availability of data and materials
The data and materials produced during the study can
be obtained from the corresponding authors on reasonable
request.
Authors' contributions
XLi performed most of the experiments, analyzed data
and wrote most of the manuscript. WS designed the animal
experiments and contributed to the manuscript. ZL contributed to
the manuscript, assisted in the design of in vitro
experiments, analyzed data and provided the reagents. YT
contributed to the conception of the study and provided the
reagents and materials. XLiu, SY, ZH, YJ, CZ and XH assisted with
the in vivo experiments. MZ and DC conceived, designed and
supervised the study. All authors read and approved the final
manuscript.
Ethics approval and consent to
participate
All animal experiments were approved by the
Experimental Animal Care and Use Committee of Guangzhou University
of Traditional Chinese medicine, and conducted in accordance with
the guidelines for the care and use of experimental animals of the
National Institutes of Health of the United States.
Patient consent for publication
Not applicable.
Competing interests
The authors declare no competing interests.
Acknowledgments
Not applicable.
References
|
1
|
Lei P, Bai T and Sun Y: Mechanisms of
ferroptosis and relations with regulated cell death: A review.
Front Physiol. 10:1392019. View Article : Google Scholar : PubMed/NCBI
|
|
2
|
Muhoberac BB, Baraibar MA and Vidal R:
Iron loading-induced aggregation and reduction of iron
incorporation in hetero- polymeric ferritin containing a mutant
light chain that causes neurodegeneration. Biochim Biophys Acta.
1812:544–548. 2011. View Article : Google Scholar
|
|
3
|
Yang WS, SriRamaratnam R, Welsch ME,
Shimada K, Skouta R, Viswanathan VS, Cheah JH, Clemons PA, Shamji
AF, Clish CB, et al: Regulation of ferroptotic cancer cell death by
GPX4. Cell. 156:317–331. 2014. View Article : Google Scholar : PubMed/NCBI
|
|
4
|
Yang WS and Stockwell BR: Ferroptosis:
Death by lipid peroxidation. Trends Cell Biol. 26:165–176. 2016.
View Article : Google Scholar :
|
|
5
|
Maiorino M, Conrad M and Ursini F: GPx4,
lipid peroxidation, and cell death: Discoveries, rediscoveries, and
open issues. Antioxid Redox Signal. 29:61–74. 2018. View Article : Google Scholar
|
|
6
|
Seibt TM, Proneth B and Conrad M: Role of
GPX4 in ferroptosis and its pharmacological implication. Free Radic
Biol Med. 133:144–152. 2019. View Article : Google Scholar
|
|
7
|
Forcina GC and Dixon SJ: GPX4 at the
crossroads of lipid homeostasis and ferroptosis. Proteomics.
19:e18003112019. View Article : Google Scholar : PubMed/NCBI
|
|
8
|
Xie Y, Hou W, Song X, Yu Y, Huang J, Sun
X, Kang R and Tang D: Ferroptosis: Process and function. Cell Death
Differ. 23:369–379. 2016. View Article : Google Scholar : PubMed/NCBI
|
|
9
|
Knovich MA, Storey JA, Coffman LG, Torti
SV and Torti FM: Ferritin for the clinician. Blood Rev. 23:95–104.
2009. View Article : Google Scholar :
|
|
10
|
Liu NQ, De Marchi T, Timmermans AM,
Beekhof R, Trapman-Jansen AM, Foekens R, Look MP, van Deurzen CH,
Span PN, Sweep FC, et al: Ferritin heavy chain in triple negative
breast cancer: A favorable prognostic marker that relates to a
cluster of differentiation 8 positive (CD8+) effector
T-cell response. Mol Cell Proteomics. 13:1814–1827. 2014.
View Article : Google Scholar : PubMed/NCBI
|
|
11
|
Shpyleva SI, Tryndyak VP, Kovalchuk O,
Starlard-Davenport A, Chekhun VF, Beland FA and Pogribny IP: Role
of ferritin alterations in human breast cancer cells. Breast Cancer
Res Treat. 126:63–71. 2011. View Article : Google Scholar
|
|
12
|
Sammarco MC, Ditch S, Banerjee A and
Grabczyk E: Ferritin L and H subunits are differentially regulated
on a post-transcriptional level. J Biol Chem. 283:4578–4587. 2008.
View Article : Google Scholar
|
|
13
|
Van Do B, Gouel F, Jonneaux A, Timmerman
K, Gelé P, Pétrault M, Bastide M, Laloux C, Moreau C, Bordet R, et
al: Ferroptosis, a newly characterized form of cell death in
Parkinson's disease that is regulated by PKC. Neurobiol Dis.
94:169–178. 2016. View Article : Google Scholar
|
|
14
|
Tian Y, Lu J, Hao X, Li H, Zhang G, Liu X,
Li X, Zhao C, Kuang W, Chen D and Zhu M: FTH1 inhibits ferroptosis
through ferritinophagy in the 6-OHDA model of Parkinson's disease.
Neurotherapeutics. 17:1796–1812. 2020. View Article : Google Scholar : PubMed/NCBI
|
|
15
|
Lu J, Liu X, Tian Y, Li H, Ren Z, Liang S,
Zhang G, Zhao C, Li X, Wang T, et al: Moxibustion exerts a
neuroprotective effect through antiferroptosis in Parkinson's
disease. Evid Based Complement Alternat Med. 2019:27354922019.
View Article : Google Scholar : PubMed/NCBI
|
|
16
|
Moreau C, Duce JA, Rascol O, Devedjian JC,
Berg D, Dexter D, Cabantchik ZI, Bush AI and Devos D; FAIRPARK-II
study group: Iron as a therapeutic target for Parkinson's disease.
Mov Disord. 33:568–574. 2018. View Article : Google Scholar : PubMed/NCBI
|
|
17
|
Bonn D: Pumping iron in Parkinson's
disease. Lancet. 347:16141996. View Article : Google Scholar : PubMed/NCBI
|
|
18
|
Guiney SJ, Adlard PA, Bush AI, Finkelstein
DI and Ayton S: Ferroptosis and cell death mechanisms in
Parkinson's disease. Neurochem Int. 104:34–48. 2017. View Article : Google Scholar : PubMed/NCBI
|
|
19
|
Biliński T, Krawiec Z, Liczmański A and
Litwińska J: Is hydroxyl radical generated by the fenton reaction
in vivo? Biochem Biophys Res Commun. 130:533–539. 1985. View Article : Google Scholar
|
|
20
|
Costello DJ, Walsh SL, Harrington HJ and
Walsh CH: Concurrent hereditary haemochromatosis and idiopathic
Parkinson's disease: A case report series. J Neurol Neurosurg
Psychiatry. 75:631–633. 2004. View Article : Google Scholar : PubMed/NCBI
|
|
21
|
Miyajima H, Takahashi Y and Kono S:
Aceruloplasminemia, an inherited disorder of iron metabolism.
Biometals. 16:205–213. 2003. View Article : Google Scholar : PubMed/NCBI
|
|
22
|
Borie C, Gasparini F, Verpillat P, Bonnet
AM, Agid Y, Hetet G, Brice A, Dürr A and Grandchamp B; French
Parkinson's disease genetic study group: Association study between
iron-related genes polymorphisms and Parkinson's disease. J Neurol.
249:801–804. 2002. View Article : Google Scholar : PubMed/NCBI
|
|
23
|
Rhodes SL, Buchanan DD, Ahmed I, Taylor
KD, Loriot MA, Sinsheimer JS, Bronstein JM, Elbaz A, Mellick GD,
Rotter JI and Ritz B: Pooled analysis of iron-related genes in
Parkinson's disease: Association with transferrin. Neurobiol Dis.
62:172–178. 2014. View Article : Google Scholar
|
|
24
|
Ambros V: The functions of animal
microRNAs. Nature. 431:350–355. 2004. View Article : Google Scholar : PubMed/NCBI
|
|
25
|
Bartel DP: MicroRNAs: Genomics,
biogenesis, mechanism, and function. Cell. 116:281–297. 2004.
View Article : Google Scholar : PubMed/NCBI
|
|
26
|
Bartel DP: MicroRNAs: Target recognition
and regulatory functions. Cell. 136:215–233. 2009. View Article : Google Scholar : PubMed/NCBI
|
|
27
|
Bartel DP: Metazoan MicroRNAs. Cell.
173:20–51. 2018. View Article : Google Scholar : PubMed/NCBI
|
|
28
|
Su Y, Deng MF, Xiong W, Xie AJ, Guo J,
Liang ZH, Hu B, Chen JG, Zhu X, Man HY, et al:
MicroRNA-26a/death-associated protein kinase 1 signaling induces
synucleinopathy and dopaminergic neuron degeneration in Parkinson's
disease. Biol Psychiatry. 85:769–781. 2019. View Article : Google Scholar : PubMed/NCBI
|
|
29
|
Jin L, Wan W, Wang L, Wang C, Xiao J,
Zhang F, Zhao J, Wang J, Zhan C and Zhong C: Elevated
microRNA-520d-5p in the serum of patients with Parkinson's disease,
possibly through regulation of cereloplasmin expression. Neurosci
Lett. 687:88–93. 2018. View Article : Google Scholar : PubMed/NCBI
|
|
30
|
Asci R, Vallefuoco F, Andolfo I, Bruno M,
De Falco L and Iolascon A: Trasferrin receptor 2 gene regulation by
microRNA 221 in SH-SY5Y cells treated with MPP+ as Parkinson's
disease cellular model. Neurosci Res. 77:121–127. 2013. View Article : Google Scholar : PubMed/NCBI
|
|
31
|
Rothblat DS, Schroeder JA and Schneider
JS: Tyrosine hydroxylase and dopamine transporter expression in
residual dopaminergic neurons: Potential contributors to
spontaneous recovery from experimental Parkinsonism. J Neurosci
Res. 65:254–266. 2001. View Article : Google Scholar : PubMed/NCBI
|
|
32
|
Deumens R, Blokland A and Prickaerts J:
Modeling Parkinson's disease in rats: An evaluation of 6-OHDA
lesions of the nigrostriatal pathway. Exp Neurol. 175:303–317.
2002. View Article : Google Scholar : PubMed/NCBI
|
|
33
|
Li Z, Lan X, Han R, Wang J, Huang Y, Sun
J, Guo W and Chen H: miR-2478 inhibits TGFβ1 expression by
targeting the transcriptional activation region downstream of the
TGFβ1 promoter in dairy goats. Sci Rep. 7:426272017. View Article : Google Scholar
|
|
34
|
Lee SJ, Jeong JH, Kang SH, Kang J, Kim EA,
Lee J, Jung JH, Park HY and Chae YS: MicroRNA-137 inhibits cancer
progression by targeting Del-1 in triple-negative breast cancer
cells. Int J Mol Sci. 20:61622019. View Article : Google Scholar
|
|
35
|
He H, Chen K, Wang F, Zhao L, Wan X, Wang
L and Mo Z: miR-204-5p promotes the adipogenic differentiation of
human adipose-derived mesenchymal stem cells by modulating DVL3
expression and suppressing Wnt/β-catenin signaling. Int J Mol Med.
35:1587–1595. 2015. View Article : Google Scholar : PubMed/NCBI
|
|
36
|
Livak KJ and Schmittgen TD: Analysis of
relative gene expression data using real-time quantitative PCR and
the 2(-Delta Delta C(T)) method. Methods. 25:402–408. 2001.
View Article : Google Scholar
|
|
37
|
Grayson M: Parkinson's disease. Nature.
538:S12016. View
Article : Google Scholar : PubMed/NCBI
|
|
38
|
Dixon SJ, Lemberg KM, Lamprecht MR, Skouta
R, Zaitsev EM, Gleason CE, Patel DN, Bauer AJ, Cantley AM, Yang WS,
et al: Ferroptosis: An iron-dependent form of nonapoptotic cell
death. Cell. 149:1060–1072. 2012. View Article : Google Scholar : PubMed/NCBI
|
|
39
|
Jiang H, Wang J, Rogers J and Xie J: Brain
iron metabolism dysfunction in Parkinson's disease. Mol Neurobiol.
54:3078–3101. 2017. View Article : Google Scholar
|
|
40
|
Powers KM, Smith-Weller T, Franklin GM,
Longstreth WT Jr, Swanson PD and Checkoway H: Dietary fats,
cholesterol and iron as risk factors for Parkinson's disease.
Parkinsonism Relat Disord. 15:47–52. 2009. View Article : Google Scholar :
|
|
41
|
Bellinger FP, Raman AV, Rueli RH,
Bellinger MT, Dewing AS, Seale LA, Andres MA, Uyehara-Lock JH,
White LR, Ross GW and Berry MJ: Changes in selenoprotein P in
substantia nigra and putamen in Parkinson's disease. J Parkinsons
Dis. 2:115–126. 2012. View Article : Google Scholar : PubMed/NCBI
|
|
42
|
Angelopoulou E, Paudel YN and Piperi C:
miR-124 and Parkinson's disease: A biomarker with therapeutic
potential. Pharmacol Res. 150:1045152019. View Article : Google Scholar : PubMed/NCBI
|
|
43
|
De Gregorio R: Pulcrano S, De Sanctis C,
Volpicelli F, Guatteo E, von Oerthel L, Latagliata EC, Esposito R,
Piscitelli RM, Perrone-Capano C, et al miR-34b/c regulates wnt1 and
enhances mesencephalic dopaminergic neuron differentiation. Stem
Cell Rep. 10:1237–1250. 2018. View Article : Google Scholar
|
|
44
|
Luo M, Wu L, Zhang K, Wang H, Zhang T,
Gutierrez L, O'Connell D, Zhang P, Li Y, Gao T, et al: miR-137
regulates ferroptosis by targeting glutamine transporter SLC1A5 in
melanoma. Cell Death Differ. 25:1457–1472. 2018. View Article : Google Scholar : PubMed/NCBI
|
|
45
|
Sangokoya C, Doss JF and Chi JT:
Iron-responsive miR-485-3p regulates cellular iron homeostasis by
targeting ferroportin. PLoS Genet. 9:e10034082013. View Article : Google Scholar : PubMed/NCBI
|
|
46
|
Poewe W, Bergmann L, Kukreja P, Robieson
WZ and Antonini A: Levodopa-carbidopa intestinal gel monotherapy:
GLORIA registry demographics, efficacy, and safety. J Parkinsons
Dis. 9:531–541. 2019. View Article : Google Scholar : PubMed/NCBI
|