Introduction
Colorectal cancer is one of the most frequently
diagnosed malignancies, characterized by unfavorable morbidity and
mortality rates (1). Despite
advancements in treatment strategies, including surgical resection,
chemotherapy, radiotherapy, targeted therapy and immunotherapy, the
overall survival (OS) time of patients with colorectal cancer has
not been markedly prolonged (2–4).
Postoperative recurrence and metastasis of colorectal cancer have
been considered as the main causes of death (5). Thus, there is an urgent requirement
to actively search for reliable molecules involved in the
pathogenesis of colorectal cancer.
It has been widely accepted that long-term effects
of environmental factors and genetic inheritance could contribute
to colorectal cancer progression (6). Extensive research findings have
shown that the multi-level regulation of protein coding genes by
non-coding RNA (ncRNA) may be associated with colorectal cancer
progression (7–9). The Encyclopedia of DNA elements
project launched in 2003 has found that nearly 65% of genes are
transcribed into ncRNAs (7–9).
Long ncRNA (lncRNA; >200 bp), a class of ncRNAs, accounts for
>80% of all ncRNAs (7–9).
LncRNAs have a variety of biological functions and are widely
involved in various cellular activities (10). It has been confirmed that LBX2
antisense RNA1 (LBX2-AS1), which is located on 2p13.1, may drive
the progression of several cancers, including esophageal squamous
cell carcinoma (11), lung
carcinoma (12), gastric
carcinoma (13) and liver cancer
(14), by binding with various
microRNAs (miRNAs/miRs) such as miR-219a-2-3p, miR-4685-5p,
miR-491-5p and miR-4766-5p. Nonetheless, the role and regulatory
mechanisms of LBX2-AS1 in colorectal cancer remain to be
elucidated.
Recent studies have shown that a number of
transcription factors are abnormally expressed in tumors and
participate in the induction of lncRNA expression (15–17). Furthermore, lncRNA can serve as
competing endogenous RNAs to block the effect of miRNA on mRNA,
thereby indirectly enhancing the stability of mRNA and increasing
the expression of mRNA (18–20). The present study aimed to
investigate the role and regulatory mechanism of LBX2-AS1 in
colorectal cancer.
Materials and methods
Tissue specimens
Overall, 145 colorectal cancer tissues and
corresponding adjacent normal tissues were gathered from the
Affiliated Huai'an No. 1 People's Hospital of Nanjing Medical
University (Huai'an, China) between January 2014 and July 2015.
None of the patients had been treated with chemotherapy or
radiotherapy prior to operation. All specimens were confirmed by at
least two pathologists as colorectal cancer. Normal colorectal
mucosa epithelium tissues >5 cm from the edge of the tumor were
obtained as adjacent normal controls. Complete clinical information
was collected and all patients were followed up for >60 months.
Among them, 10 cases of colorectal cancer tissue specimens and
corresponding adjacent normal tissues were used for microarray
analysis (Shanghai OE Biotech Co., Ltd.). Differentially expressed
genes were visualized into a heatmap via the R language package
(version 3.4.1) (21). This
study strictly followed the Declaration of Helsinki and acquired
the approval of the ethics committee of the Affiliated Huai'an No.
1 People's Hospital of Nanjing Medical University (approval no.
2014059). All participants provided signed informed consent.
Bioinformatics analysis
LBX2-AS1, ETS transcription factor ELK1 (ELK1) and
S100A11 expression levels were evaluated in colorectal cancer
tissues and normal tissues in The Cancer Genome Atlas (TCGA)/The
Genotype-Tissue Expression (GTEx) database using the GEPIA tool
(http://gepia2.cancer-pku.cn/) (22). Using this tool, the differences
in LBX2-AS1 or S100A11 expression among different stages (TNM
stages I-III and IV) were also assessed in colorectal cancer
samples (22). Overall and
disease-free survival analyses were performed between high and low
LBX2-AS1 expression groups using the GEPIA tool (22). Transcription factors that could
bind to the promoter of LBX2-AS1 were predicted through
comprehensive analysis of the JASPAR (http://jaspar.genereg.net) (23) and PROMO (http://alggen.lsi.upc.es/cgi-bin/promo_v3/promo/promoinit.cgi?dirDB=TF_8.3)
databases (24). Subcellular
locations of LBX2-AS1 were predicted via the lncATLAS (http://lncatlas.crg.eu/) (25) and lncLocator (http://www.csbio.sjtu.edu.cn/bioinf/lncLocator/)
databases (26). The starBase
version 3.0 (http://starbase.sysu.edu.cn/) database (27) was employed to predict target
miRNAs of LBX2-AS1. The correlation between hsa-miR-491-5p and
LBX2-AS1 expression was determined using Pearson's correlation in
the starBase database. Differentially expressed genes (DEGs) with
|log2fold-change|>1 and P<0.05 were analyzed between
colorectal cancer and normal tissues in TCGA database, which were
visualized into heatmap and volcano plots using the R language
package (version 3.4.1) (21).
From the UALCAN database (http://ualcan.path.uab.edu/), S100A11 expression was
detected in colorectal cancer and normal tissues using data from
the Clinical Proteomic Tumor Analysis Consortium (CPTAC) dataset
(28). Furthermore, S100A11
expression was determined in a pan-cancer analysis using the GEPIA
tool (22).
Cell culture
Human normal colorectal mucosa FHC cell line, three
colon cancer cell lines (including LoVo, SW620 and HCT116) and one
colorectal cancer cell line HT29 that were authenticated by STR
profiling were acquired from American Type Culture Collection
(ATCC). Cells were grown in RPMI-1640 medium (HyClone; Cytiva) with
10% FBS (HyClone; Cytiva), 100 U/ml penicillin and 100 µg/ml
streptomycin at 37°C and 5% CO2 in a humidified
incubator.
Reverse transcription-quantitative PCR
(RT-qPCR)
RNA extraction from cells or tissues was carried out
using TRIzol® reagent (Invitrogen; Thermo Fisher
Scientific, Inc.). RNA concentration and OD value of 2 µl
RNA solution were determined using a NanoDrop™ 2000 ultra-micro
spectrophotometer (NanoDrop Technologies; Thermo Fisher Scientific,
Inc.). Reverse transcription was performed using PrimeScript RT
Reagent kit (Takara Biotechnology Co., Ltd.) at 37°C for 45 min and
at 85°C for 5 min. GAPDH was regarded as an internal reference.
qPCR was performed using SYBR Premix EX Taq II (Takara Bio, Inc.)
and the ABI 7900 fluorescence quantitative PCR instrument (Applied
Biosystems; Thermo Fisher Scientific, Inc.). The thermocycling
conditions were as follows: 94°C for 2 min; 40 cycles of 94°C for
15 sec and 60°C for 45 sec. Primer sequences are listed in Table I. The expression levels of
LBX2-AS1, ELK1 and S100A11 were normalized to GAPDH, while
miR-491-5p expression was normalized to U6. Relative expression
levels were determined using the 2−ΔΔCq method (29).
 | Table IPrimer sequences for reverse
transcription-quantitative PCR. |
Table I
Primer sequences for reverse
transcription-quantitative PCR.
| Genes | Primer sequences
(5′→3′) |
|---|
| LBX2-AS1 | F:
ATAGCTCATGTCCTGTCCTTC |
| R:
ACTTCCTTGTTGCCGATATC |
| ELK1 | F:
TTGTGTCCTACCCAGAGGTTG |
| R:
GCTATGGCCGAGGTTACAGA |
| miR-491-5p | F:
GGAGTGGGGAACCCTTCC |
| R:
GTGCAGGGTCCGAGGT |
| S100A11 | F:
GCGGGAAGGATGGAAACAACA |
| R:
TCATCATGCGGTCAAGGACAC |
| GAPDH | F:
GGAGCGAGATCCCTCCAAAAT |
| R:
GGCTGTTGTCATACTTCTCATGG |
| U6 | F:
GGCAGATCAATGTTTCCACAGA |
| R:
CAGTACCGACAACTGAGAGGA |
Transfection
SW620 and HT29 cells (3.0×10⁵) were
incubated in a 6-well plate for 24 h. Then, 2 µg small
interfering RNAs (siRNAs) targeting ELK1
(5′-AACCACCCGCCACTCTTCCT-3′; Shanghai GenePharma Co., Ltd.) and
LBX2-AS1 (5′-CCAUUAAUUCAGCAAACAUUCCUTT-3′; Shanghai GenePharma Co.,
Ltd.) and corresponding scramble siRNA controls
(5′-UUCUCCGAACGUGUCACGUTT-3′; Shanghai GenePharma Co., Ltd.) were
separately transfected into each well via PowerFect™ In Vitro siRNA
Transfection Reagent (SignaGen Laboratories). A total of 2
µg pcDNA3.1-ELK1, pcDNA3.1-LBX2-AS1 plasmids and
corresponding empty vectors (Shanghai GenePharma Co., Ltd.), which
were used as controls, were added to each well via
Lipofectamine® 2000 (Invitrogen; Thermo Fisher
Scientific, Inc.). Furthermore, 50 nM miR-491-5p mimics
(5′-AGUGGGGAACCCUUCCAUGAGG-3′; Shanghai GenePharma Co., Ltd.) and
mimic negative controls (NCs; 5′-CAGCUGGUUGAAGGGGACCAAA-3′;
Shanghai GenePharma Co., Ltd.) were transfected into cells. After
transfection for 48 h at room temperature, RT-qPCR was performed to
validate transfection efficacy.
RNA immunoprecipitation (RIP) assay
RIP was performed using RNA Binding Protein
Immunoprecipitation kit (EMD Millipore). SW620 and HT29 cells were
lysed using RIP lysis buffer (Beyotime Institute of Biotechnology).
The lysate was centrifuged at 12,000 × g for 30 min at 4°C, and the
supernatant was incubated with magnetic beads coated with anti-IgG
antibody (cat. no. ab109489; Abcam) overnight at 4°C, followed by
digestion with proteinase K buffer. The beads were washed three
times with the washing buffer (50 mM Tris-HCl, 300 mM NaCl pH 7.4,
1 mM MgCl2, 0.1% NP-40). The immunoprecipitation RNA was
extracted using TRIzol® (Beyotime Institute of
Biotechnology) and analyzed via RT-qPCR.
Dual-luciferase reporter assay
Luciferase reporter vector (Shanghai GenePharma Co.,
Ltd.) with the LBX2-AS1 promoter -2,500 kb ~ +245 bp full sequence
and LBX2-AS1 promoter deletion plasmids were transfected into 293T
cells (ATCC) using Lipofectamine® 2000 (Invitrogen;
Thermo Fisher Scientific, Inc.). The fluorescence signal was
monitored after 24 h of transfection. LBX2-AS1 wild-type
(LBX2-AS1-wt) and mutant (LBX2-AS1-mut), S100A11 wild-type
(S100A11-wt) and mutant (S100A11-mut) sequences were inserted into
the pmirGLO vector (Promega Corporation). Mutant sequences were
generated using a Hieff Mut™ Site-Directed Mutagenesis kit (cat.
no. 11003ES10; Shanghai Yeasen Biotechnology Co., Ltd.). miR-491-5p
mimics/controls were co-transfected with LBX2-AS1-wt/LBX2-AS1-mut
or S100A11-wt/S100A11-mut using Lipofectamine 2000. After 48 h, the
cells were collected and luciferase activity was determined using a
Dual-Luciferase Reporter Assay System (Beyotime Institute of
Biotechnology). These results were standardized in line with
Renilla luciferase activity.
Cell counting kit-8 (CCK-8) assay
SW620 and HT29 cells (2.5×10⁴) were
seeded into a 96-well plate for 2–3 h. Then, 10 µl CCK-8
reagent (Beyotime Institute of Biotechnology) was added to the
corresponding wells. Cells were taken out 24, 48, 72 and 96 h after
inoculation, and the absorbance was tested at 450 nm utilizing an
automatic microplate reader (Bio-Rad Laboratories, Inc.).
Clone formation assay
SW620 and HT29 cells were seeded into a 6-well plate
(3,000 cells/well). Then, 2.5 ml complete medium (HyClone; Cytiva)
was added to each well and cells were cultured for 10–14 days.
After discarding the supernatant, the cells were fixed with 4%
paraformaldehyde at room temperature for 15 min and stained with 2%
crystal violet staining solution at room temperature for 10 min.
Finally, the colony number was counted. A colony was defined as
consisting of at least 50 cells.
Flow cytometry assay
SW620 and HT29 cell apoptosis assay was carried out
using an Annexin V-APC/PI apoptosis detection kit (Nanjing KeyGen
Biotech Co., Ltd.) in the dark, according to the manufacturer's
instructions. Early and late apoptotic cells were detected using a
BD Accuri™ C6 Plus Flow Cytometer (BD Biosciences) at an excitation
wavelength of 488 nm. The results were analyzed using FlowJo
software (version 10.6.2; FlowJo LLC).
ELISA
Caspase-3 and caspase-9 levels in SW620 and HT29
cells were examined using caspase-3 (cat. no. ab39401; Abcam) and
caspase-9 (cat. no. ab65608; Abcam) ELISA kits.
Wound healing assay
Serum-starved SW620 and HT29 cells were seeded onto
a 6-well plate (5×10⁵ cells/well) overnight. Cells were
incubated at 37°C until they reached 100% confluence. A
200-µl tip was used to scratch the plate. After removing the
scratched cells, the 6-well plate was placed in a 5% CO2
incubator at 37°C. The images were observed under a light
microscope (magnification, x100; Olympus Corporation) at 0 and 48
h. The migratory rate was measured by quantifying the total
distance that cells migrated from the edge of the wound towards the
center of the wound.
Transwell assay
Transwell inserts (Costar; Corning, Inc.) were
incubated with 50 µl diluted Matrigel (BD Biosciences) at
37°C for 1 h. Cells (1×10⁵) were seeded onto the upper
chamber of the Transwell insert with 600 µl medium without
FBS. In the lower chamber of the Transwell plate, 600 µl
medium with 10% FBS was added. After 48 h at 37°C, the invaded
cells were fixed with 4% paraformaldehyde at room temperature for
15 min and stained with 2% crystal violet staining solution at room
temperature for 10 min. These results were investigated under an
inverted microscope (magnification, ×200). The non-invaded cells
were wiped off and the number of cells passing through the Matrigel
was counted. Cells in five random fields were counted using ImageJ
software (version 1.8.0; National Institutes of Health).
Western blotting
SW620 and HT29 cells or tissues were lysed using
RIPA lysis buffer (cat. no. P0013B; Beyotime Institute of
Biotechnology) on ice. Protein concentration was detected using a
BCA detection kit (cat. no. P0009; Beyotime Institute of
Biotechnology). Protein samples (20 µg) were subjected to
10% SDS-PAGE, and subsequently transferred onto PVDF membranes. The
membrane was then blocked with 5% skimmed milk powder blocking
solution at room temperature for 2 h, followed by incubation
overnight at 4°C with primary antibodies against N-cadherin
(1:1,000; cat. no. ab76057; Abcam), vimentin (1:1,000; cat. no.
5741; Cell Signaling Technology, Inc.), S100A11 (1:1,000; cat. no.
ab180593; Abcam), GAPDH (1:1,000; cat. no. ab181602, Abcam).
Subsequently, membranes were incubated with secondary antibodies
(1:1,000; cat. no. ab97080; Abcam) at room temperature for 1 h. The
blots were visualized by an ECL kit (KGP1121; KeyGen Biotech Co.,
Ltd.). The optical density was measured with ImageJ software
(version 1.8.0; National Institutes of Health).
Subcellular fractionation assay
According to the manufacturer's instructions, the
cellular cytoplasmic and nuclei fractions were isolated using the
Cytoplasmic & Nuclear RNA Purification kit (cat. no. 37400;
Norgen Biotek Corp.). Cytoplasmic and nuclear LBX2-AS1 levels were
detected via RT-qPCR.
Statistical analysis
SPSS 23.0 software (IBM Corp.) and GraphPad Prism
8.0 (GraphPad Software, Inc.) were used for statistical analyses.
All data are presented as the mean ± standard deviation from at
least three repeats. Comparisons between normal tissues and tumor
tissues were analyzed using a paired Student's t-test. Other
comparisons between two groups were analyzed using an unpaired
Student's t-test. One-way ANOVA followed by post hoc Tukey's test
was utilized to assess the differences between multiple groups. The
differences in clinicopathological parameters between high and low
LBX2-AS1 expression samples were analyzed using a Chi-squared test.
Univariate and multivariate Cox regression analyses were conducted
to analyze the association between LBX2-AS1 and patient prognosis.
For survival analysis, 145 patients with colorectal cancer were
stratified into high- and low-expression groups based on the median
value of LBX2-AS1 expression. Kaplan-Meier survival curve and
log-rank test were performed to assess the differences and OS and
disease-free survival (DFS) time between high- and low-expression
groups. A receiver operating characteristic (ROC) curve was plotted
to validate the diagnostic efficacy of LBX2-AS1. P<0.05 was
considered to indicate a statistically significant difference.
Results
LBX2-AS1 is a promising diagnostic and
prognostic marker for patients with colorectal cancer
According to the microarray profile, LBX2-AS1
expression was higher in colorectal cancer tissues compared with
that in normal tissues (Fig.
1A). Using the GEPIA database, it was found that there was a
distinct difference in LBX2-AS1 expression between colorectal
cancer tissues (n=349) and normal tissues (n=275), as presented in
Fig. 1B. Moreover, LBX2-AS1
expression was upregulated among different clinical stages
(Fig. 1C). In total, 145
patients with colorectal cancer were included in the present study.
The results of RT-qPCR showed that LBX2-AS1 was significantly
upregulated in colorectal cancer tissues (Fig. 1D). Furthermore, the differences
in its expression between stage I-II and III-IV were determined. As
shown in Fig. 1E, expression of
LBX2-AS1 was higher at stage III-IV compared with stage I-II,
indicating that it was associated with the severity of colorectal
cancer. Also, compared with the human normal colorectal mucosa FHC
cell line, LBX2-AS1 was significantly elevated in the four
colorectal cancer cell lines (Fig.
1F). The ROC results suggested that LBX2-AS1 could possess a
useful diagnostic function for the cohort of patients with
colorectal cancer included in the present study (Fig. 1G). High LBX2-AS1 expression had a
positive association with poorer OS (Fig. 1H), but not DFS (Fig. 1I), using data from TCGA database.
The 145 patients with colorectal cancer from the present study were
separated into high- and low-expression groups based on the cutoff
of LBX2-AS1 expression. Consistently, high expression of LBX2-AS1
suggested shorter OS time (Fig.
1J) and poorer DFS (Fig.
1K). The association between LBX2-AS1 expression and
clinicopathological features of patients with colorectal cancer was
then calculated. Significant associations between the expression of
LBX2-AS1 with lymph node metastasis and TNM stage were found, and
are presented in Table II.
After multivariate Cox regression analysis, LBX2-AS1 expression was
found to be a potential independent prognostic factor for
colorectal cancer (Table III).
The aforementioned results suggested that LBX2-AS1 was elevated
both in colorectal cancer tissues and cells, and could be a
potential diagnostic and prognostic biomarker for patients with
colorectal cancer.
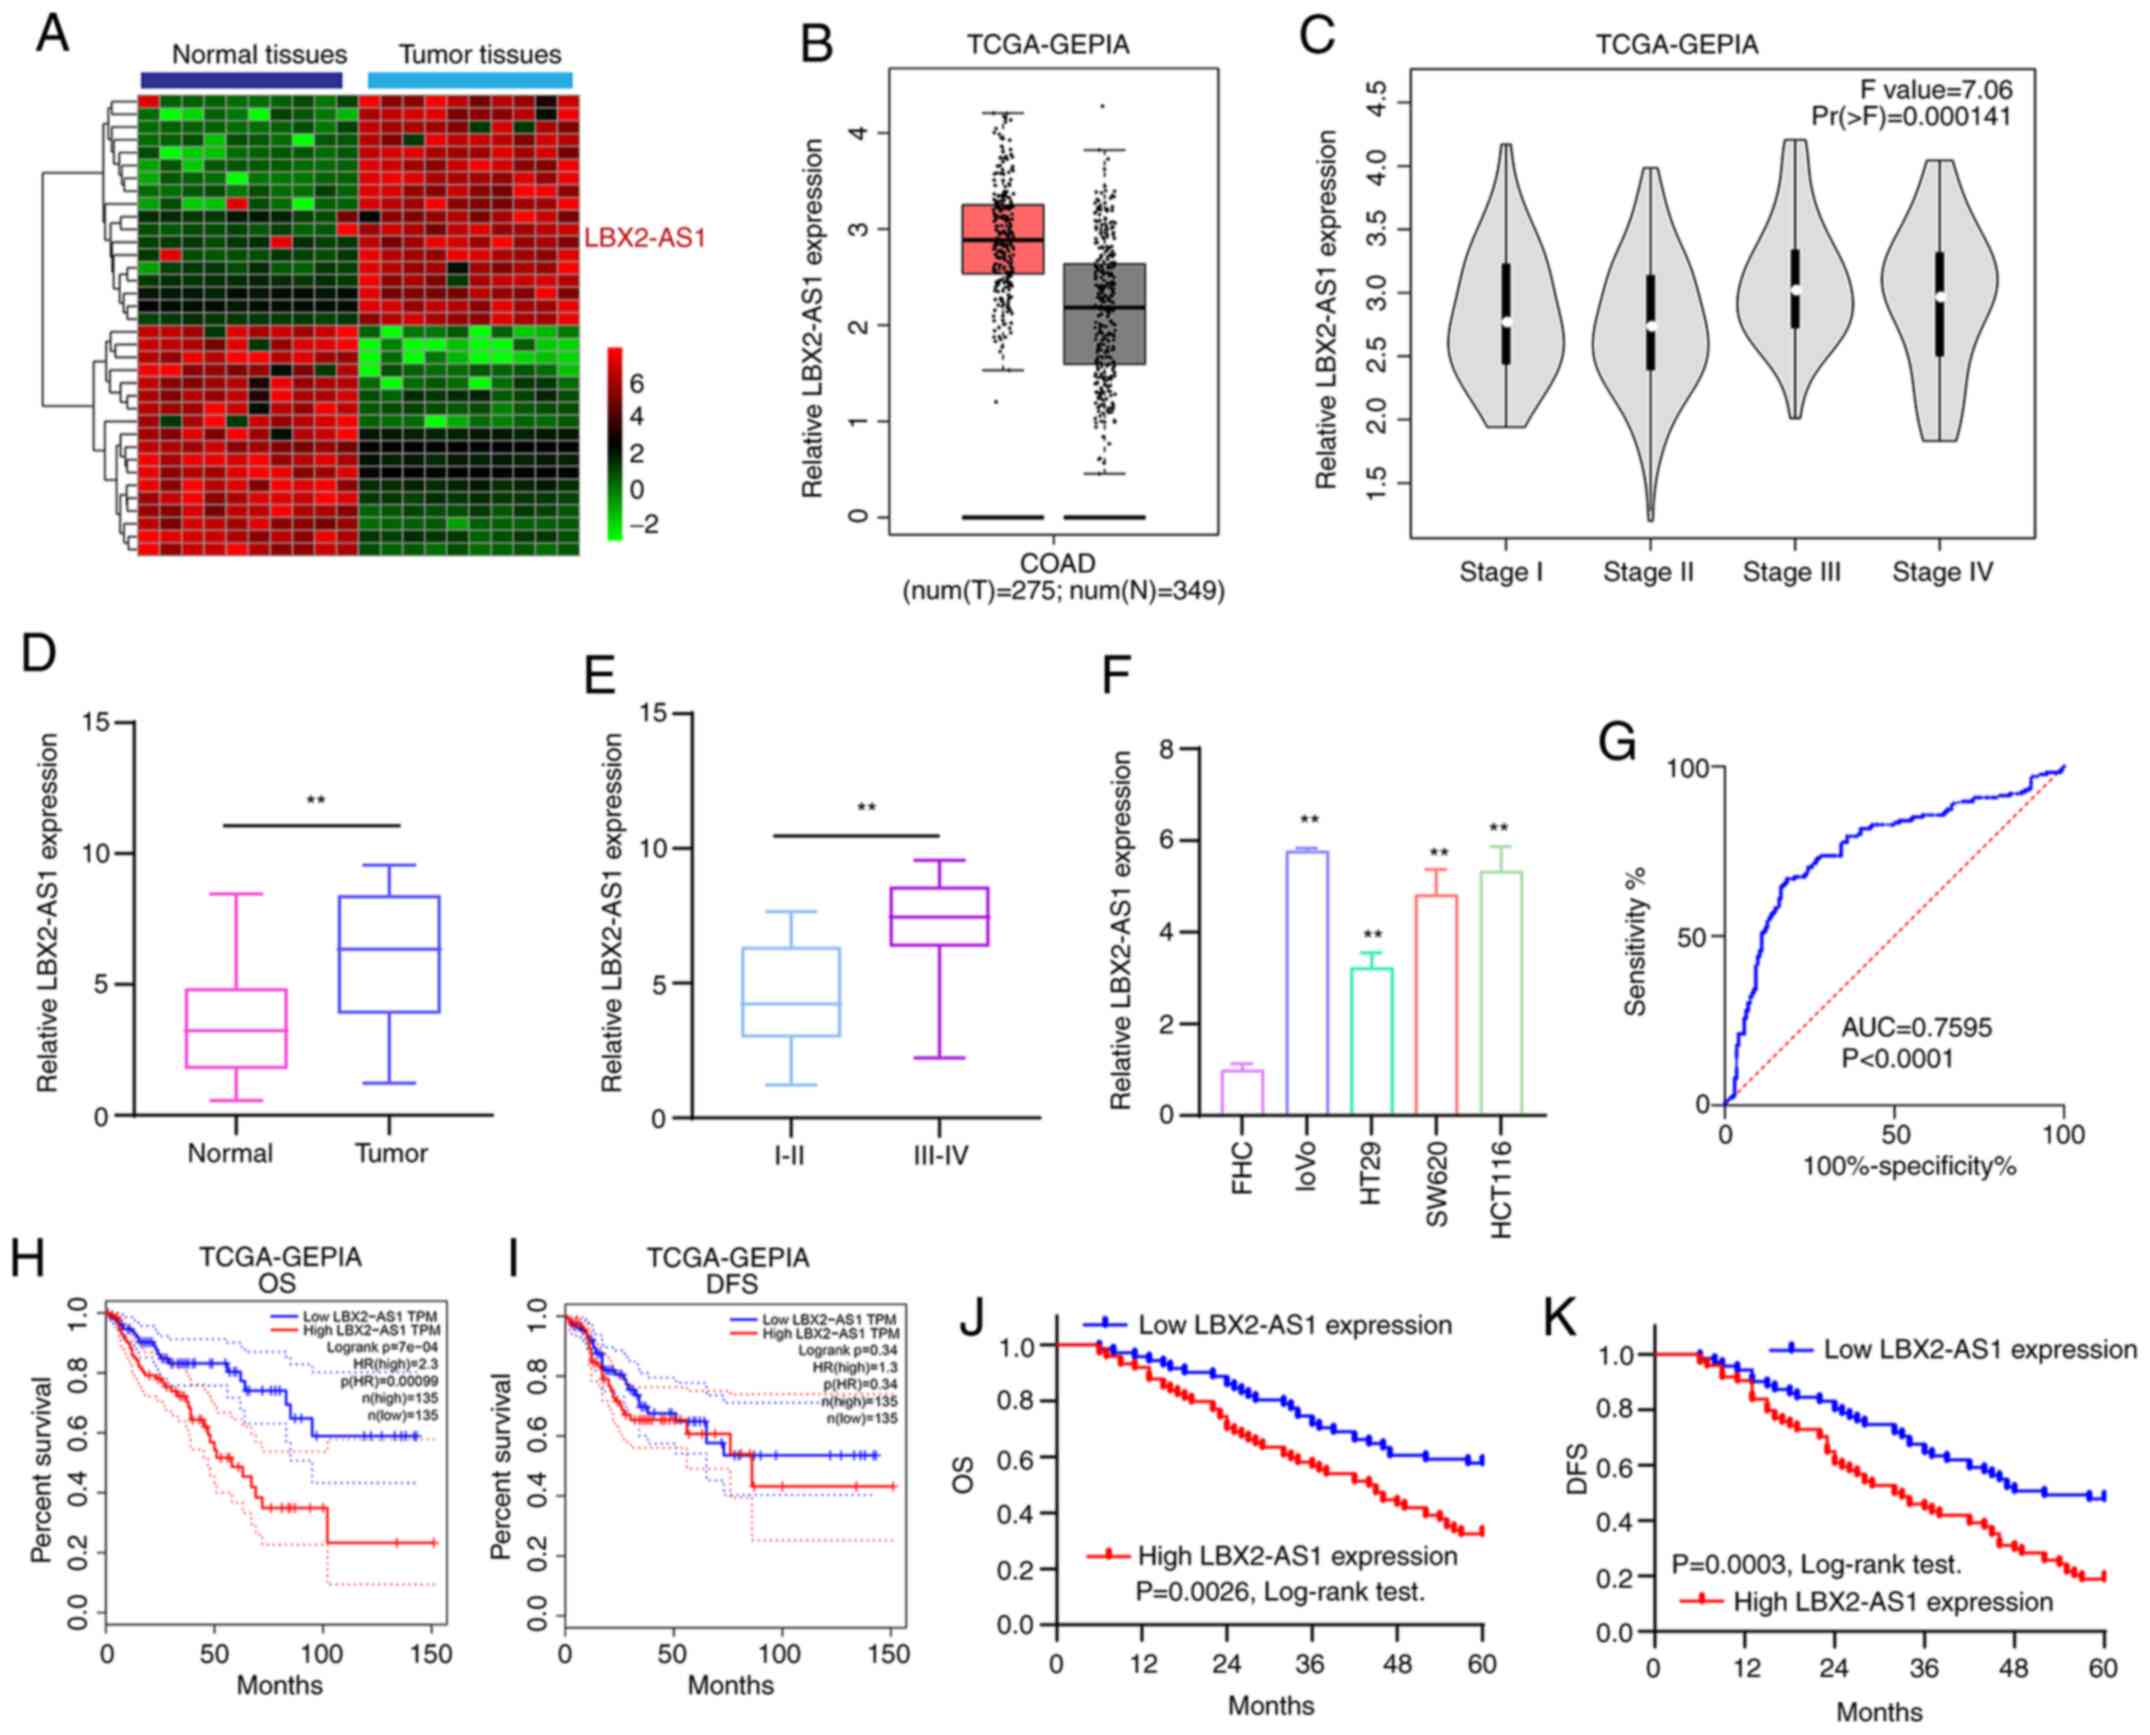 | Figure 1High LBX2-AS1 expression is a
promising diagnostic and prognostic biomarker for patients with
colorectal cancer. (A) Heatmap depicting aberrantly expressed
lncRNAs between 10 pairs of colorectal cancer specimens and normal
specimens. Red, upregulation; green, downregulation. (B) The
difference in expression pattern of LBX2-AS1 between colorectal
cancer samples and normal samples from TCGA database. (C) The
difference in LBX2-AS1 expression among different clinical stages
of colorectal cancer from TCGA database. (D) Box plots showing the
expression levels of LBX2-AS1 between colorectal cancer and normal
tissues from a total of 145 colorectal cancer cohort according to
RT-qPCR. (E) Box plots showing the difference in LBX2-AS1
expression between stage III-IV and I-II. **P<0.01.
(F) RT-qPCR results demonstrated high LBX2-AS1 expression in
colorectal cancer cell lines. **P<0.01 vs. FHC cells.
(G) AUC of receiver operating characteristic curve was 0.7595 and
P<0.0001, indicating a high sensitivity and accuracy of LBX2-AS1
for colorectal cancer diagnosis. In TCGA database, LBX2-AS1
expression was associated with (H) OS, but not (I) DFS. (J and K)
Among 145 patients with colorectal cancer, LBX2-AS1 expression had
a positive association with poorer OS and DFS. LBX2-AS1, LBX2
antisense RNA 1; lncRNA, long non-coding RNA; TCGA, The Cancer
Genome Atlas; RT-qPCR, reverse transcription-quantitative PCR; AUC,
area under the curve; OS, overall survival; DFS, disease-free
survival; GEPIA, Gene Expression Profiling Interactive
Analysis. |
| Table IIAssociation between LBX2-AS1
expression and clinicopathological features of patients with
colorectal cancer. |
Table II
Association between LBX2-AS1
expression and clinicopathological features of patients with
colorectal cancer.
| Parameters | Total, n | LBX2-AS1
expression, n
| P-value |
|---|
| High | Low |
|---|
| Sex | | | | 0.949 |
| Male | 78 | 40 | 38 | |
| Female | 67 | 34 | 33 | |
| Age, years | | | | 0.737 |
| <60 | 71 | 37 | 34 | |
| ≥60 | 75 | 37 | 38 | |
| Tumor size, cm | | | | 0.207 |
| <5 | 92 | 43 | 49 | |
| ≥5 | 52 | 30 | 22 | |
| Lymph node
metastasis | | | | 0.011a |
| Negative | 109 | 49 | 60 | |
| Positive | 36 | 25 | 11 | |
| TNM stage | | | | 0.028a |
| I-II | 102 | 46 | 56 | |
| III-IV | 43 | 28 | 15 | |
| Table IIIMultivariate Cox regression analysis
of clinicopathological features and LBX2-AS1 expression in the
prognosis of patients with colorectal cancer. |
Table III
Multivariate Cox regression analysis
of clinicopathological features and LBX2-AS1 expression in the
prognosis of patients with colorectal cancer.
A, Overall survival
|
|---|
| Variables | HR | 95% CI | P-value |
|---|
| Sex | 1.223 | 0.643–2.173 | 0.361 |
| Age, years | 1.462 | 0.783–2.018 | 0.218 |
| Tumor size, cm | 1.656 | 0.827–2.218 | 0.187 |
| Lymph node
metastasis | 3.017 | 1.216–4.775 | 0.021a |
| TNM stage | 2.896 | 1.385–4.452 | 0.027a |
| LBX2-AS1
expression | 3.163 | 1.375–4.882 | 0.015a |
|
B, Disease-free
survival
|
| Variables | HR | 95% CI | P-value |
|
| Sex | 1.364 | 0.732–2.018 | 0.168 |
| Age, years | 1.271 | 0.832–2.217 | 0.185 |
| Tumor size, cm | 1.327 | 0.562–2.326 | 0.125 |
| Lymph node
metastasis | 3.256 | 1.317–4.882 | 0.009b |
| TNM stage | 3.017 | 1.462–4.776 | 0.011a |
| LBX2-AS1
expression | 3.325 | 1.426–5.127 | 0.003b |
Transcription factor ELK1 mediates the
upregulation of LBX2-AS1 in colorectal cancer cells
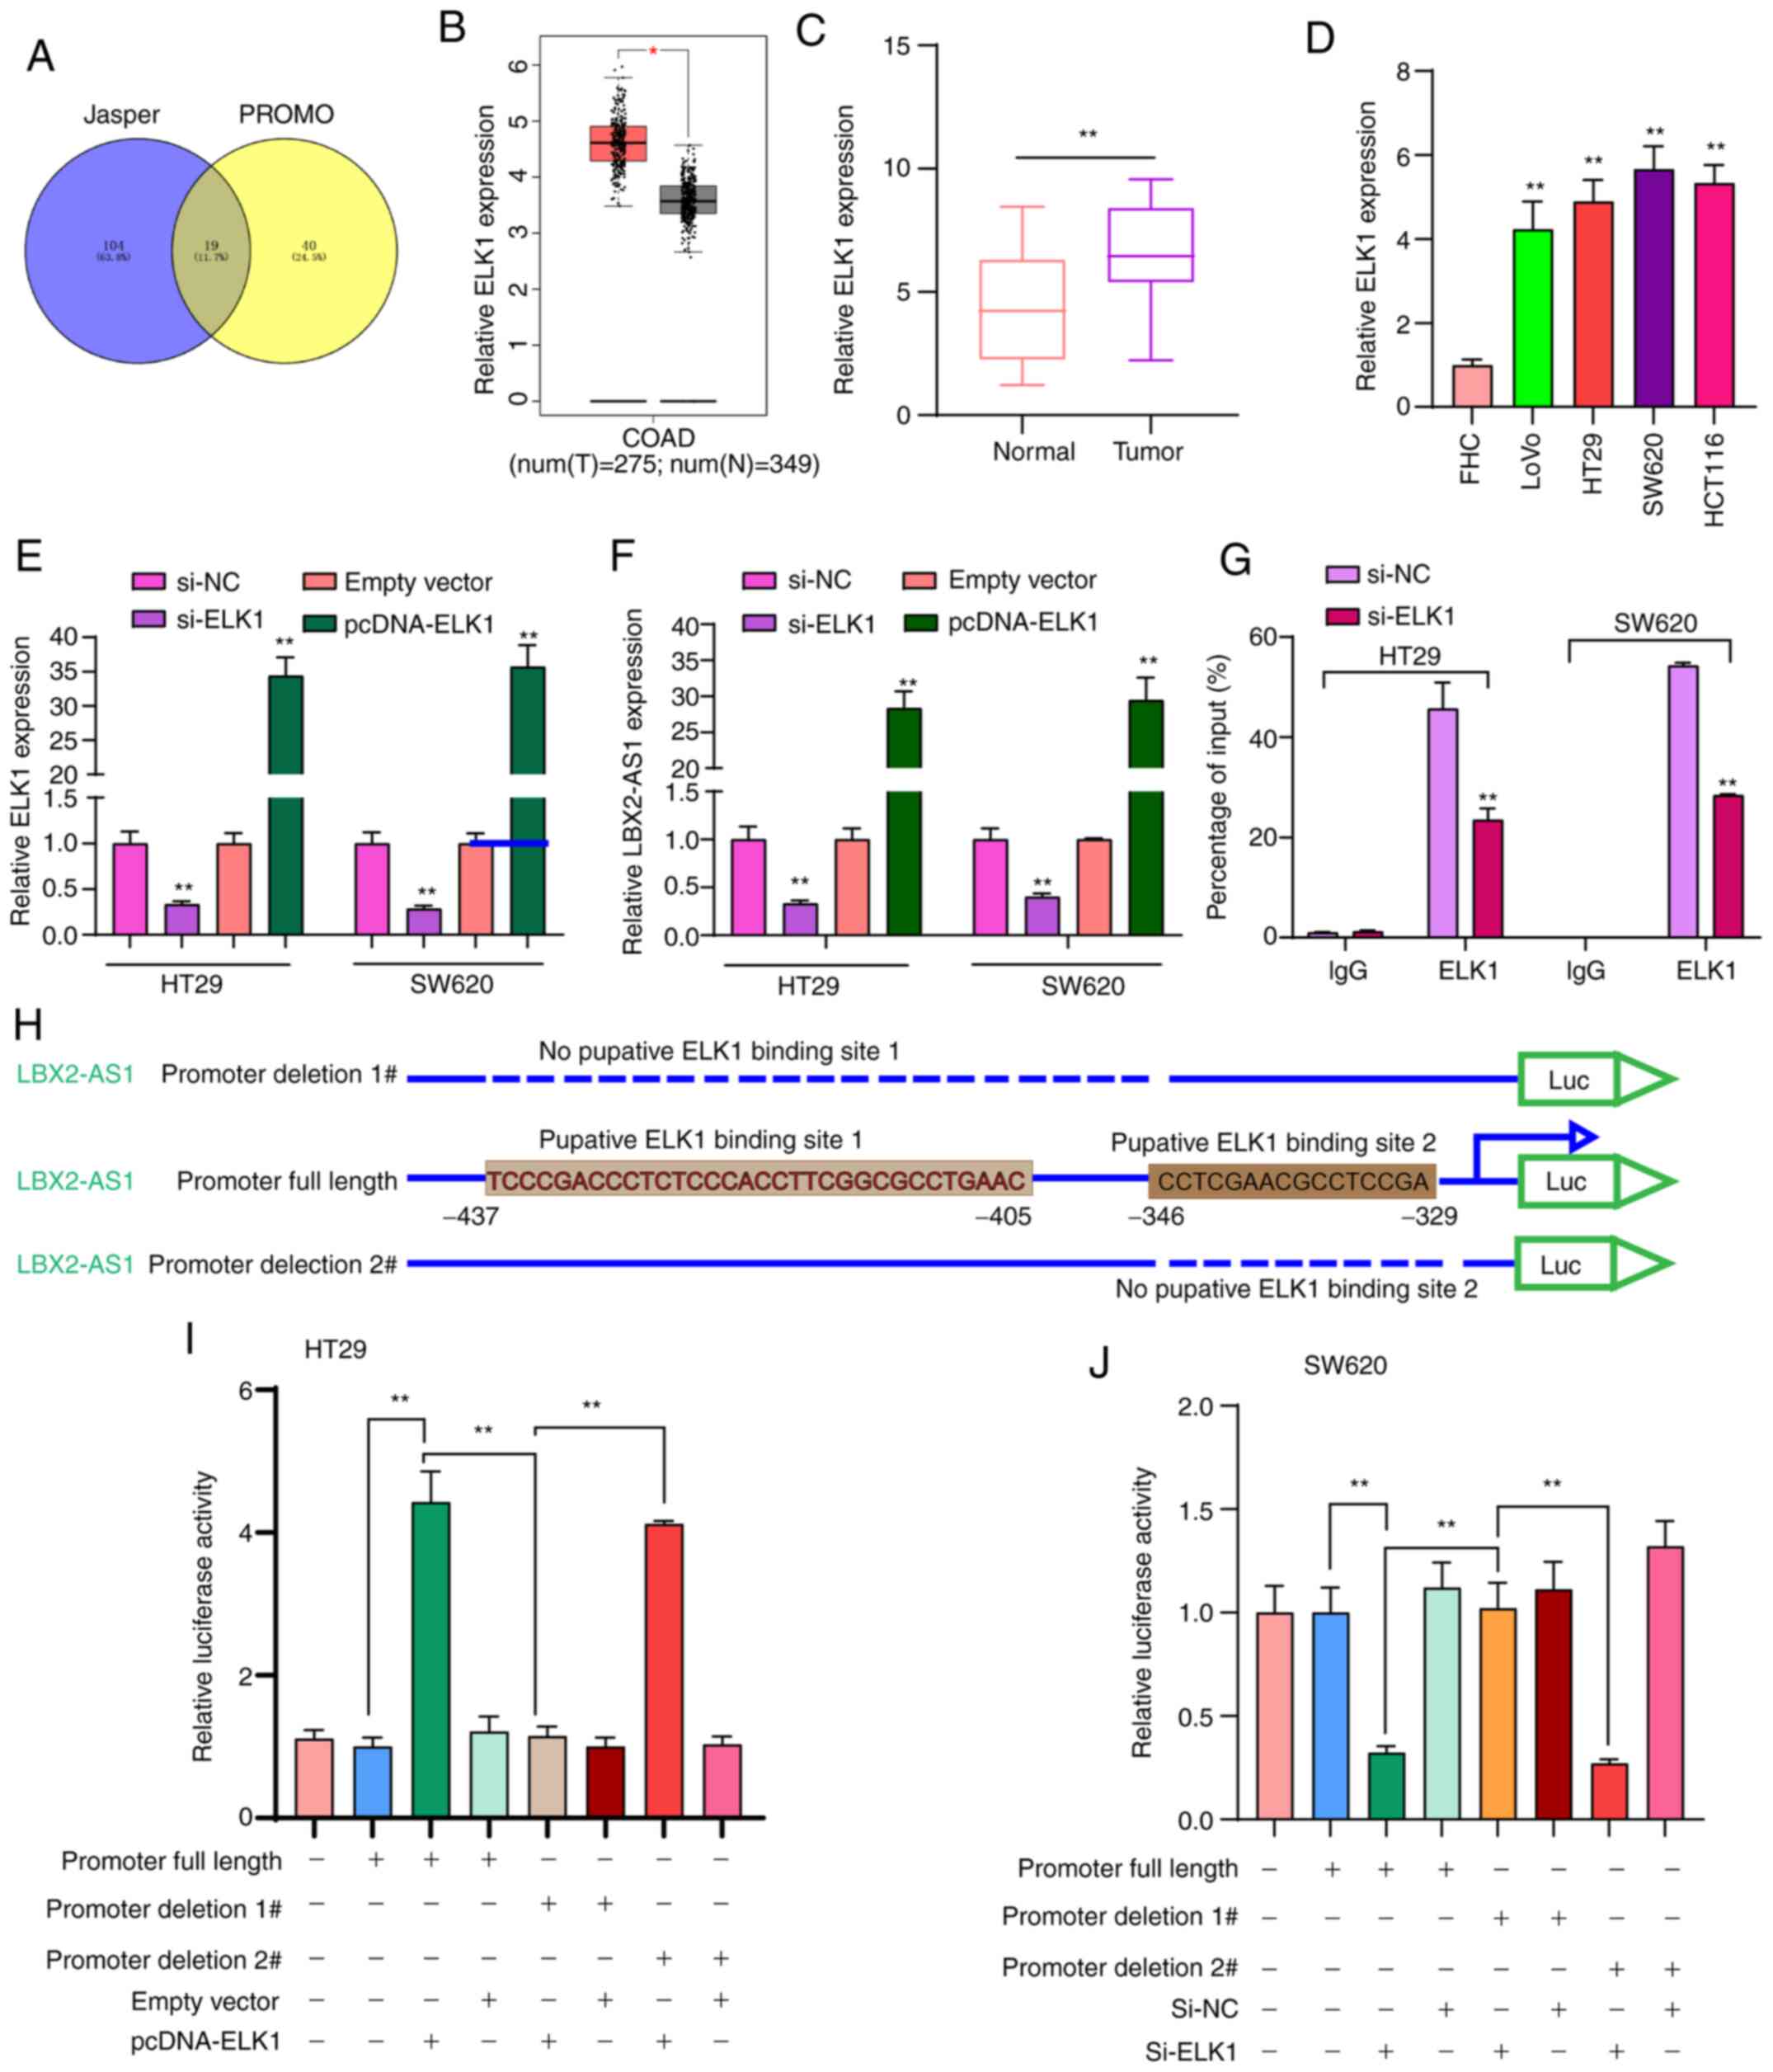
To thoroughly explore the molecular mechanisms
regarding the upregulation of LBX2-AS1 in colorectal cancer, 19
transcription factors that could bind to the promoter of LBX2-AS1
were predicted (Fig. 2A). Among
them, ELK1 was upregulated in colorectal cancer samples in
comparison with normal samples using TCGA database (Fig. 2B). In the patients with
colorectal cancer included in the present study, ELK1 expression
was significantly higher in colorectal cancer tissues in comparison
with normal tissues (Fig. 2C).
Moreover, higher ELK1 expression was found in colorectal cancer
cells compared with in FHC cells (Fig. 2D). To observe whether ELK1 could
mediate the expression of LBX2-AS1, two colorectal cancer cell
lines, HT29 and SW620, which were chosen as they exhibited the
lowest expression of LBX2-AS1 (Fig.
1F), were transfected with si-ELK1 and pcDNA-ELK1 (Fig. 2E). LBX2-AS1 expression was
significantly downregulated in colorectal cancer cells transfected
with si-ELK1 compared with those transfected with the si-NC.
LBX2-AS1 expression was significantly higher in colorectal cancer
cells transfected with pcDNA-ELK1 compared with the empty vector
group (Fig. 2F). The RIP assay
demonstrated that ELK1 could directly bind to the promoter region
of LBX2-AS1 (Fig. 2G). As
presented in Fig. 2H, the
dual-luciferase reporter assay demonstrated that two binding sites
(site 1, -437 ~ -405; site 2, -346 ~ -329) on the promoter region
of LBX2-AS1 could be involved in transcriptional activation of
ELK1. As expected, relative luciferase activity was significantly
increased in colorectal cancer cells transfected with pcDNA-ELK1
compared with the empty vector group (Fig. 2I). After deletion of binding site
2 of LBX2-AS1, relative luciferase activity was also significantly
increased in colorectal cancer cells transfected with pcDNA-ELK1
compared with the empty vector group. However, after deletion of
binding site 1 of LBX2-AS1, pcDNA-ELK1 did not change the
luciferase activity compared with the empty vector group (Fig. 2I). Furthermore, it was found that
relative luciferase activity was significantly decreased in
colorectal cancer cells transfected with si-ELK1 compared with
si-NC group (Fig. 2J). These
findings revealed that ELK1 could induce LBX2-AS1 upregulation in
colorectal cancer cells.
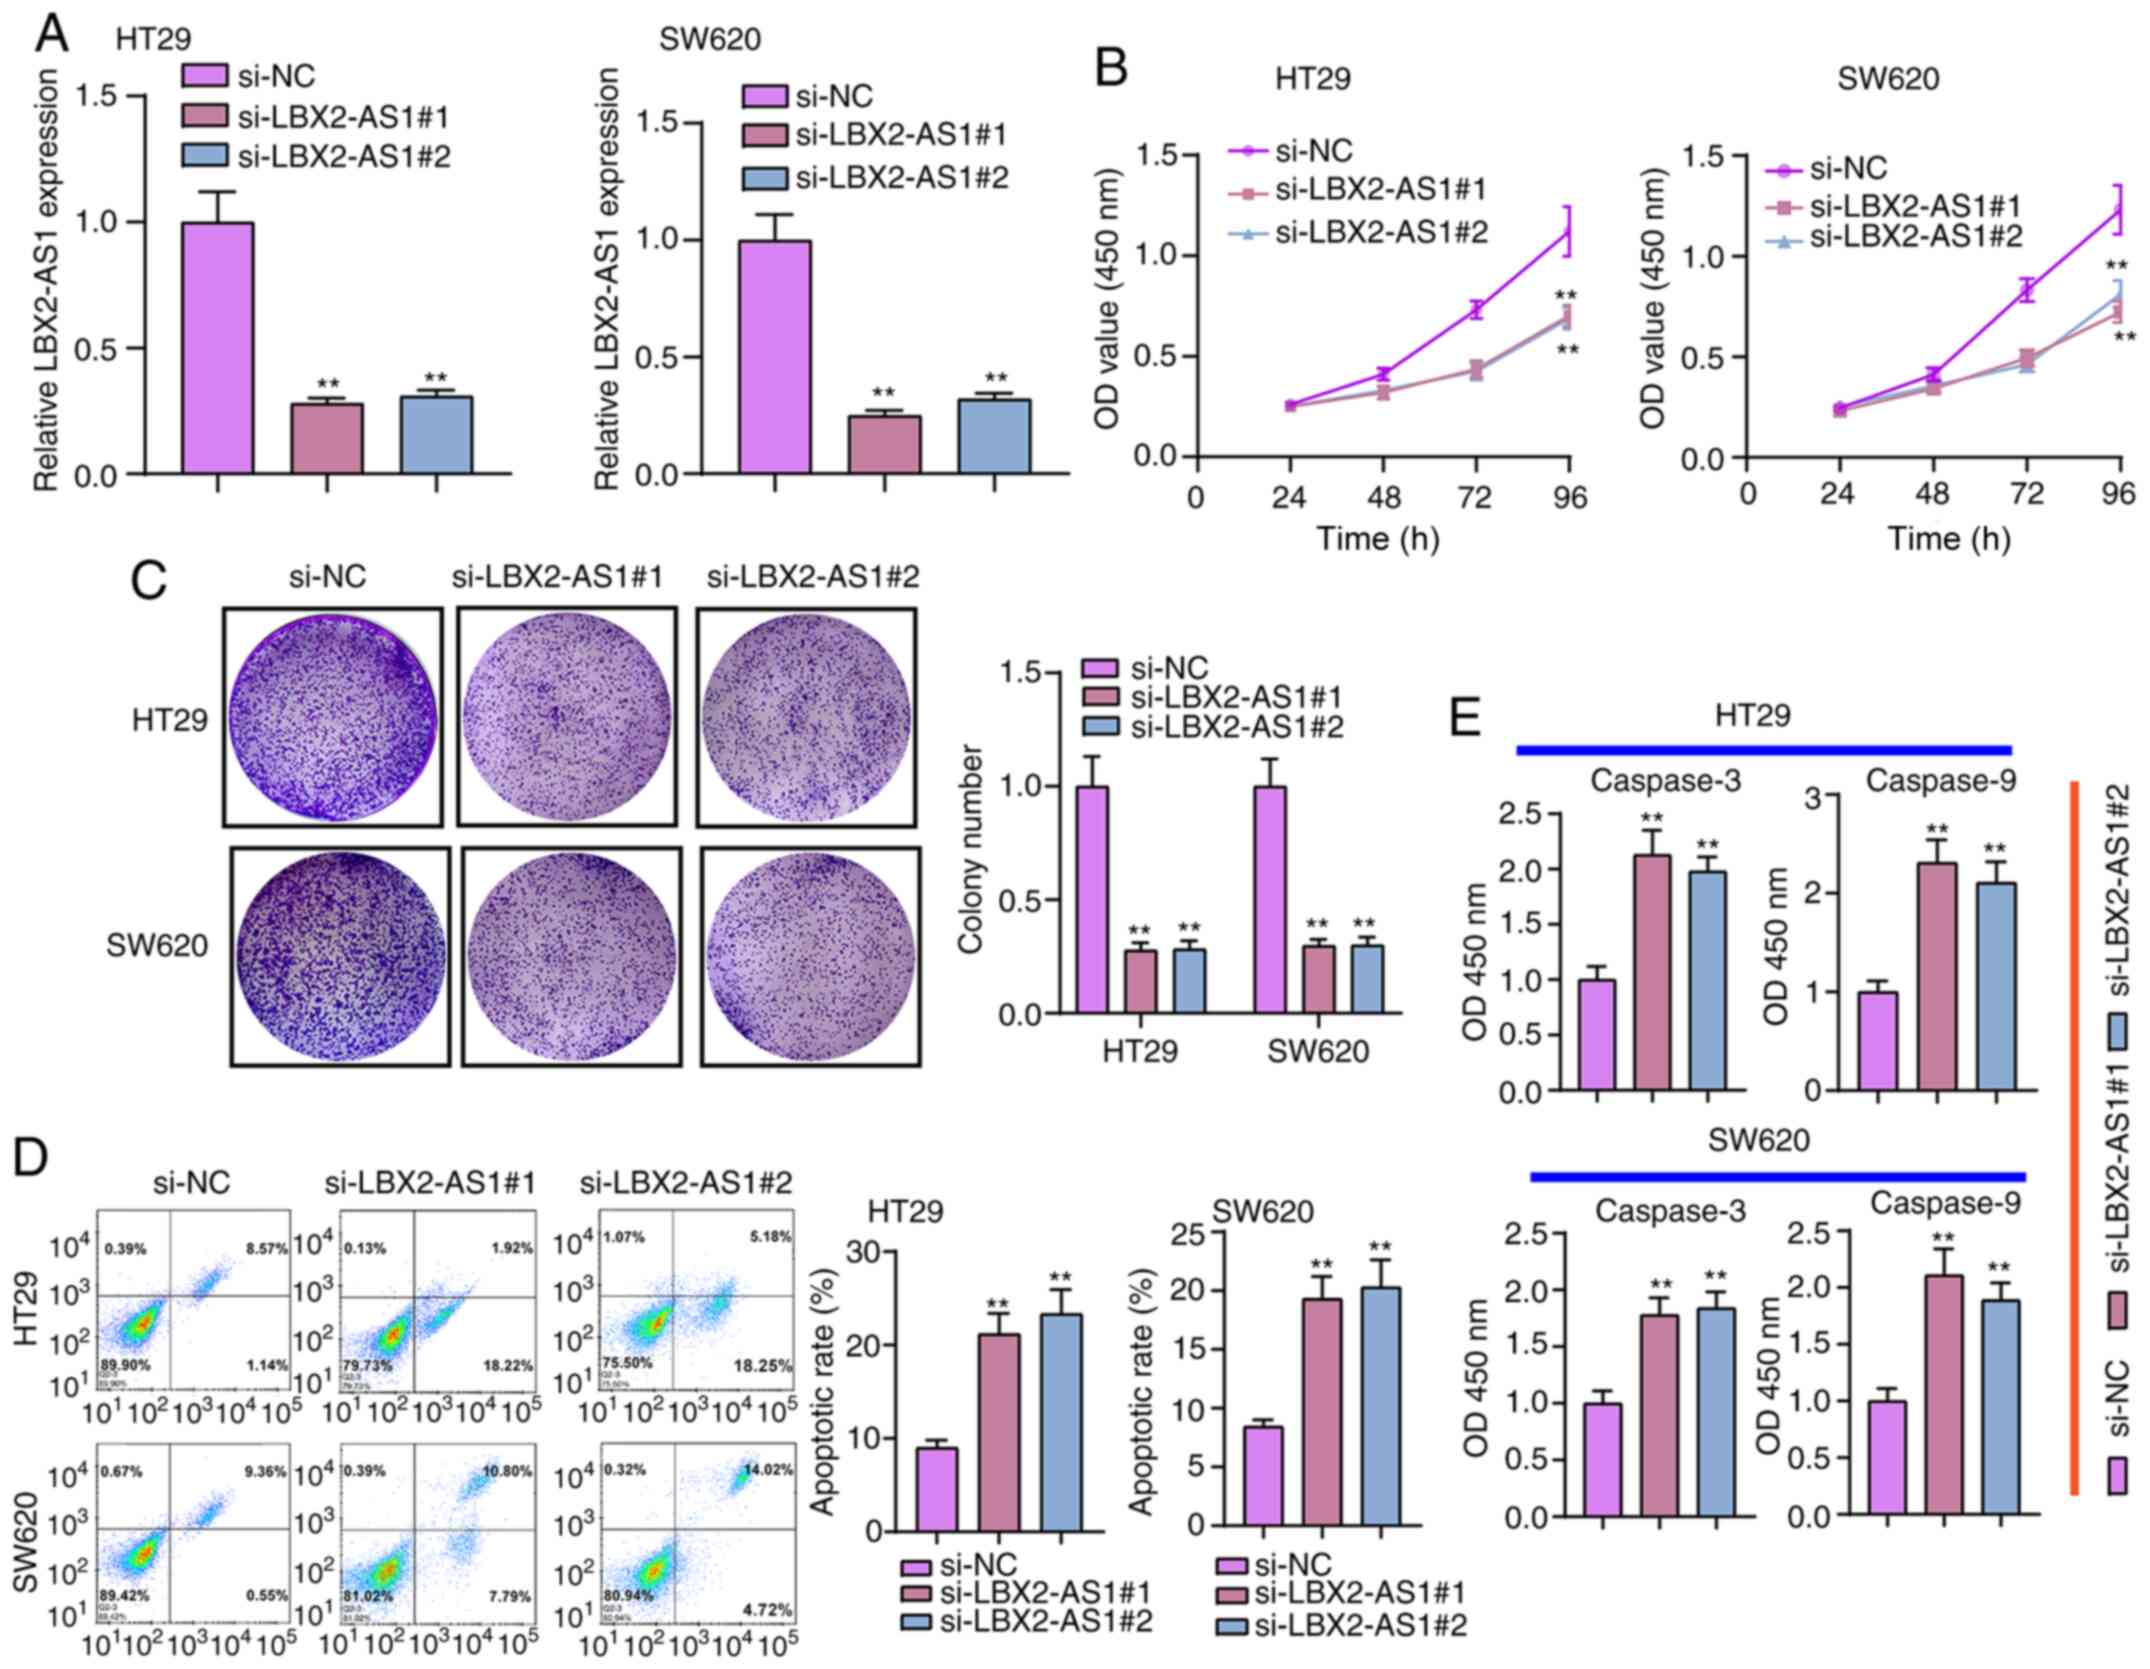
Suppression of LBX2-AS1 inhibits
colorectal cancer cell proliferation and promotes apoptosis
Two siRNAs against LBX2-AS1 were synthesized and
transfected into HT29 and SW620 cells. RT-qPCR results verified
that LBX2-AS1 was efficiently silenced in cells (Fig. 3A). According to CCK-8 assay
results, si-LBX2-AS1 significantly suppressed the viability of
colorectal cancer cells (Fig.
3B). Furthermore, the clone formation ability of HT29 or SW620
colorectal cancer cells was significantly suppressed after
transfection with si-LBX2-AS1 (Fig.
3C). As shown in Fig. 3D,
si-LBX2-AS1 significantly promoted the apoptosis of colorectal
cancer cells. Following transfection with si-LBX2-AS1, caspase-3
and caspase-9 levels were significantly higher compared with the
si-NC group (Fig. 3E).
Therefore, these findings suggested that suppression of LBX2-AS1
may inhibit proliferation and induce apoptosis in colorectal cancer
cells.
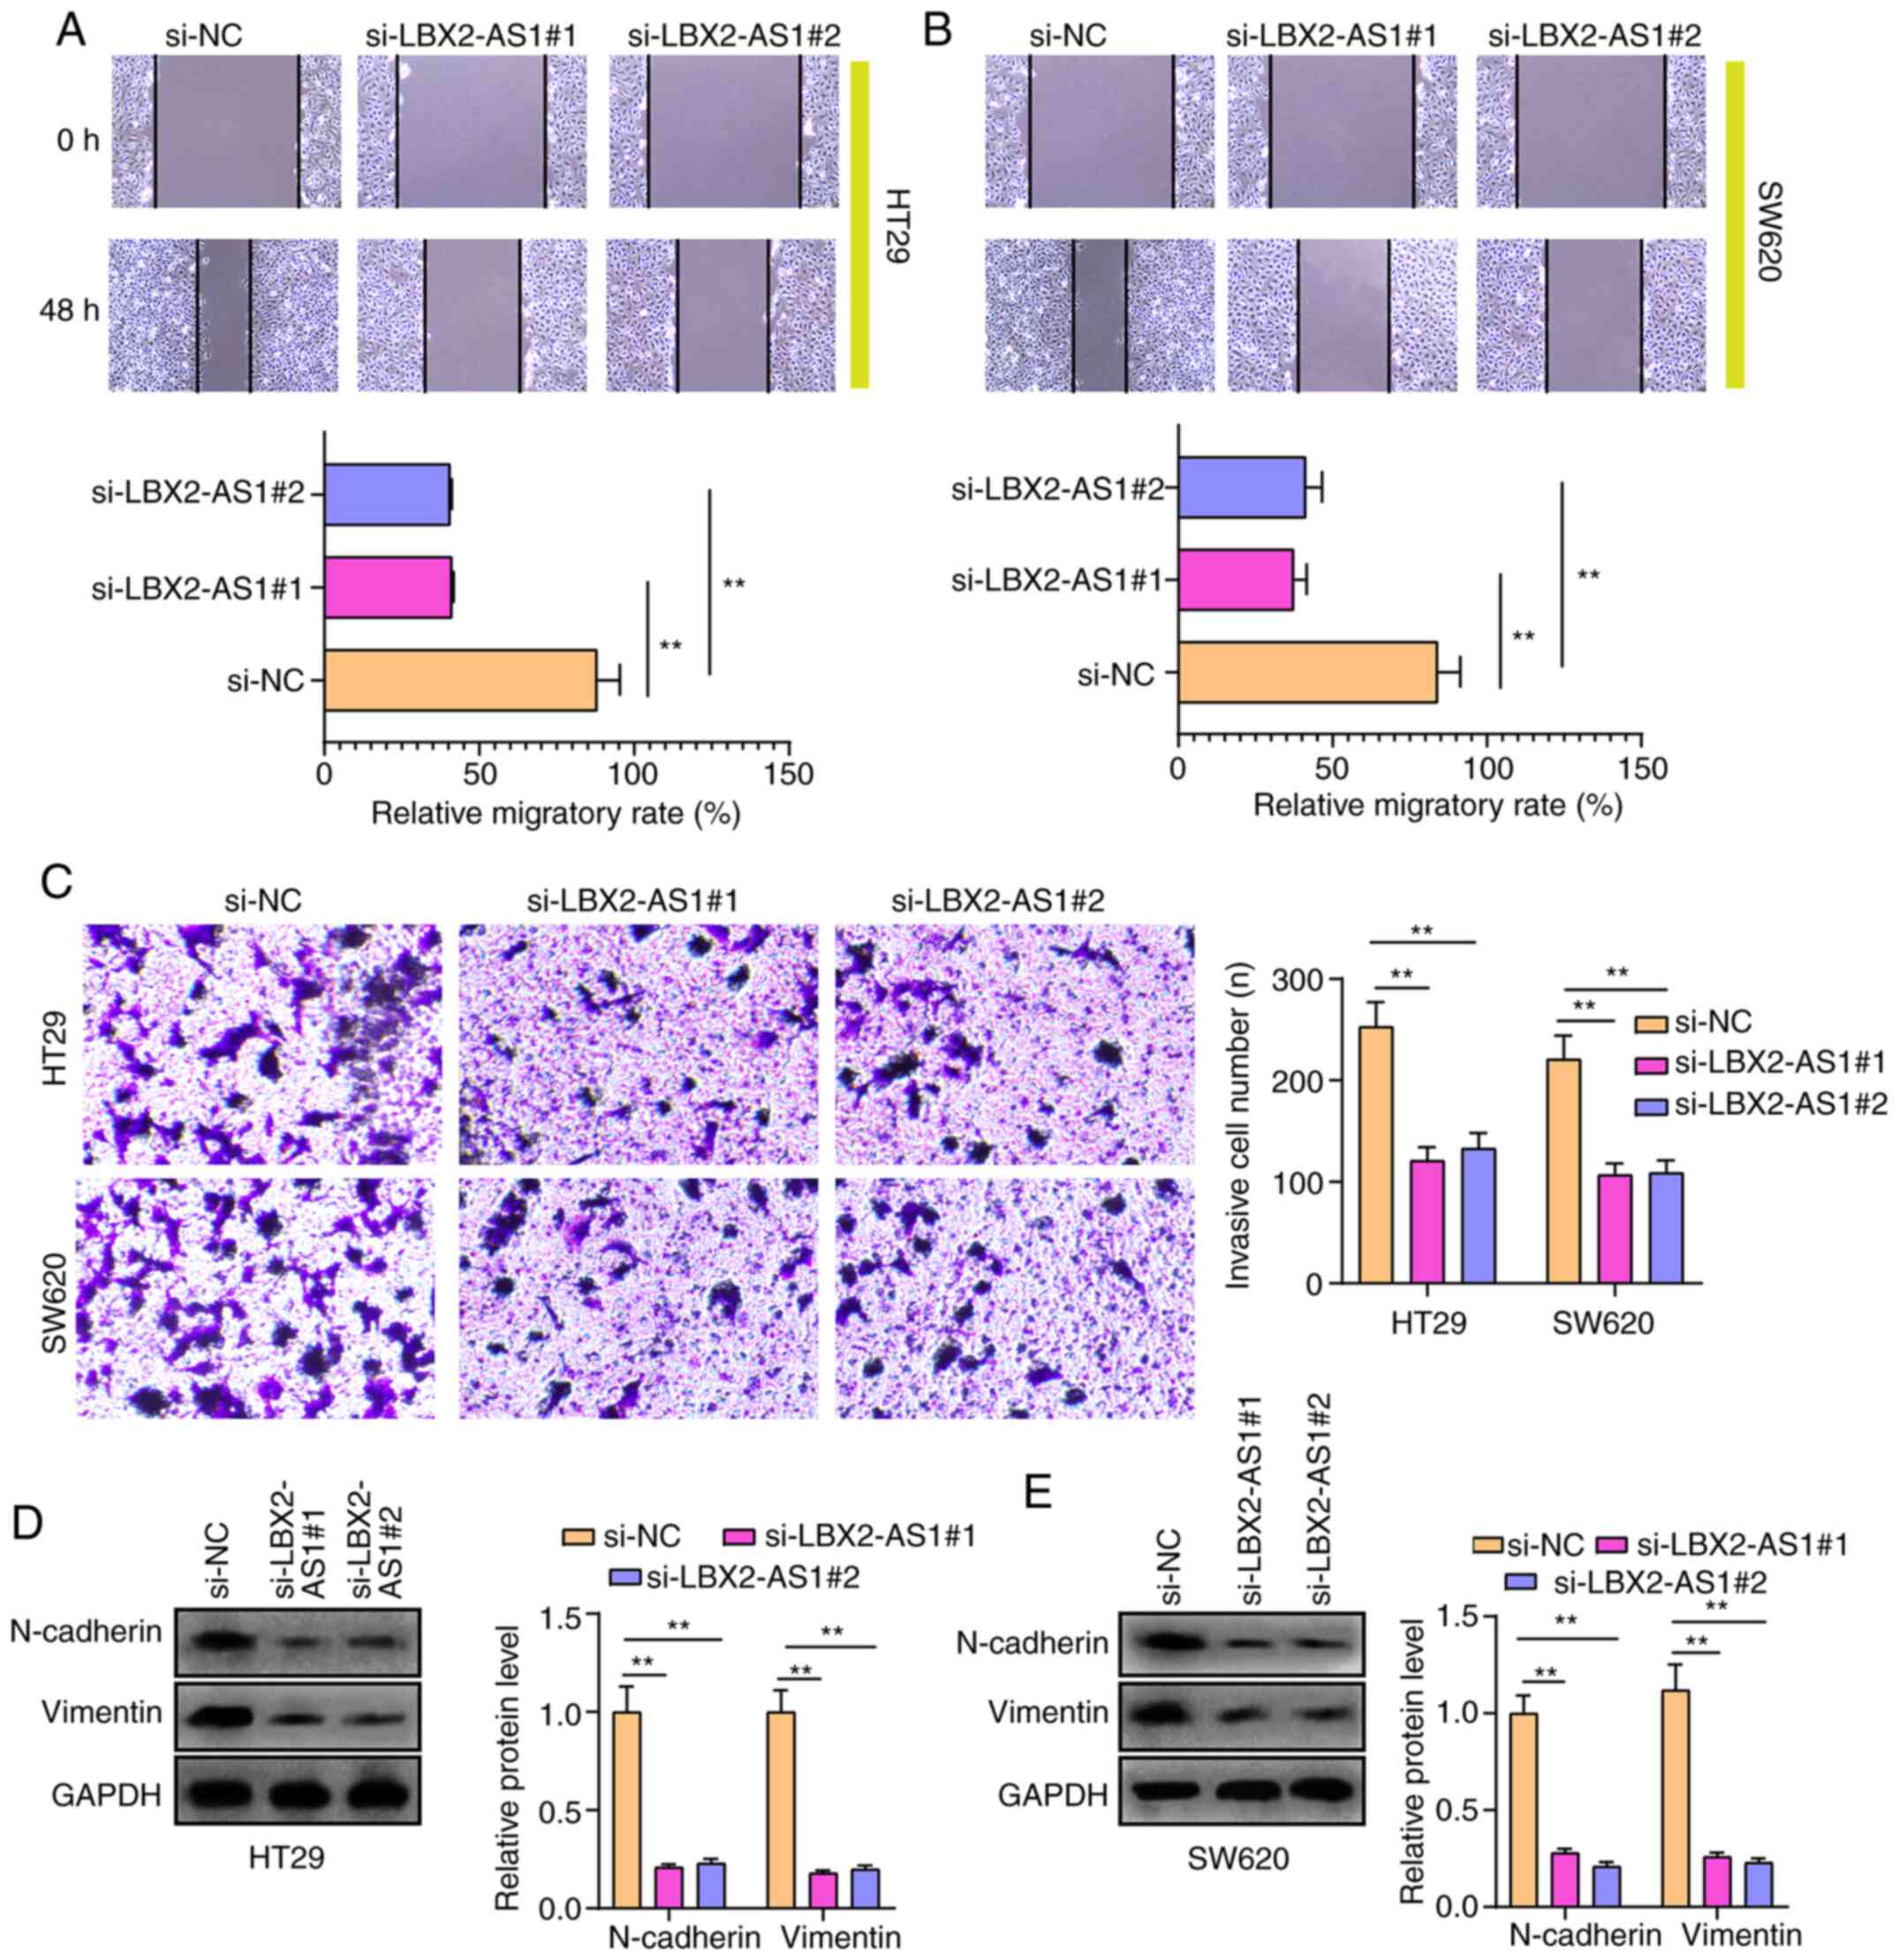
Silencing LBX2-AS1 suppresses migration,
invasion and epithelial-mesenchymal transition (EMT) in colorectal
cancer cells
After silencing LBX2-AS1 expression, the migratory
ability of HT29 and SW620 cells was significantly suppressed
(Fig. 4A and B). Furthermore,
the number of invasive cells was significantly lower in colorectal
cancer cells transfected with si-LBX2-AS1 (Fig. 4C). Additionally, the expression
of EMT-related proteins in colorectal cancer cells was
investigated. As expected, western blotting results showed that
N-cadherin and vimentin protein expression was reduced in HT29 and
SW620 cells transfected with si-LBX2-AS1 (Fig. 4D and E), indicating that the EMT
process of colorectal cancer cells was blocked after silencing
LBX2-AS1.
LBX2-AS1 serves as a sponge of
hsa-miR-491-5p in colorectal cancer cells
LBX2-AS1 was mainly distributed in the nucleus and
cytoplasm (Fig. 5A and B). In
HT29 and SW620 colorectal cancer cells, LBX2-AS1 expression was
detected in the nucleus and cytoplasm (Fig. 5C), which was consistent with the
prediction results. Using the starBase database, potential target
miRNAs of LBX2-AS1 were predicted. To observe which miRNAs could
directly bind to LBX2-AS1, dual-luciferase reporter assays were
performed after LBX2-AS1 wild-type was co-transfected with NC,
miR-3174 mimics, miR-627-5p mimics, miR-151b mimics, miR-627-5b
mimic, miR-491-5p mimics or miR-650 mimics. The results confirmed
that only hsa-miR-491-5p mimics and LBX2-AS1 wild-type
co-transfection could significantly reduce relative luciferase
levels (Fig. 5D and E). LBX2-AS1
was weakly negatively correlated with hsa-miR-491-5p in 450 cases
of colorectal cancer specimens from the starBase database (Fig. 5F). The RT-qPCR results
demonstrated that hsa-miR-491-5p expression was decreased in
colorectal cancer tissues (Fig.
5G) and cells (Fig. 5H). As
expected, there was a moderate negative correlation between
hsa-miR-491-5p and LBX2-AS1 expression, which was validated among
145 patients with colorectal cancer included in the present study
(Fig. 5I). To observe the
regulatory mechanisms of hsa-miR-491-5p, hsa-miR-491-5p was
successfully overexpressed by miR-491-5p mimics (Fig. 5J). Dual-luciferase reporter
results confirmed that, when miR-491-5p mimics and LBX2-AS1-WT were
co-transfected into cells, relative luciferase activity was
significantly decreased (Fig.
5K). Furthermore, after transfection with si-LBX2-AS1,
hsa-miR-491-5p expression was significantly elevated in two
colorectal cancer cells (Fig.
5L). Conversely, LBX2-AS1 expression was significantly
suppressed in cells transfected with miR-491-5p mimics (Fig. 5M). Thus, LBX2-AS1 may serve as a
sponge of hsa-miR-491-5p in colorectal cancer cells.
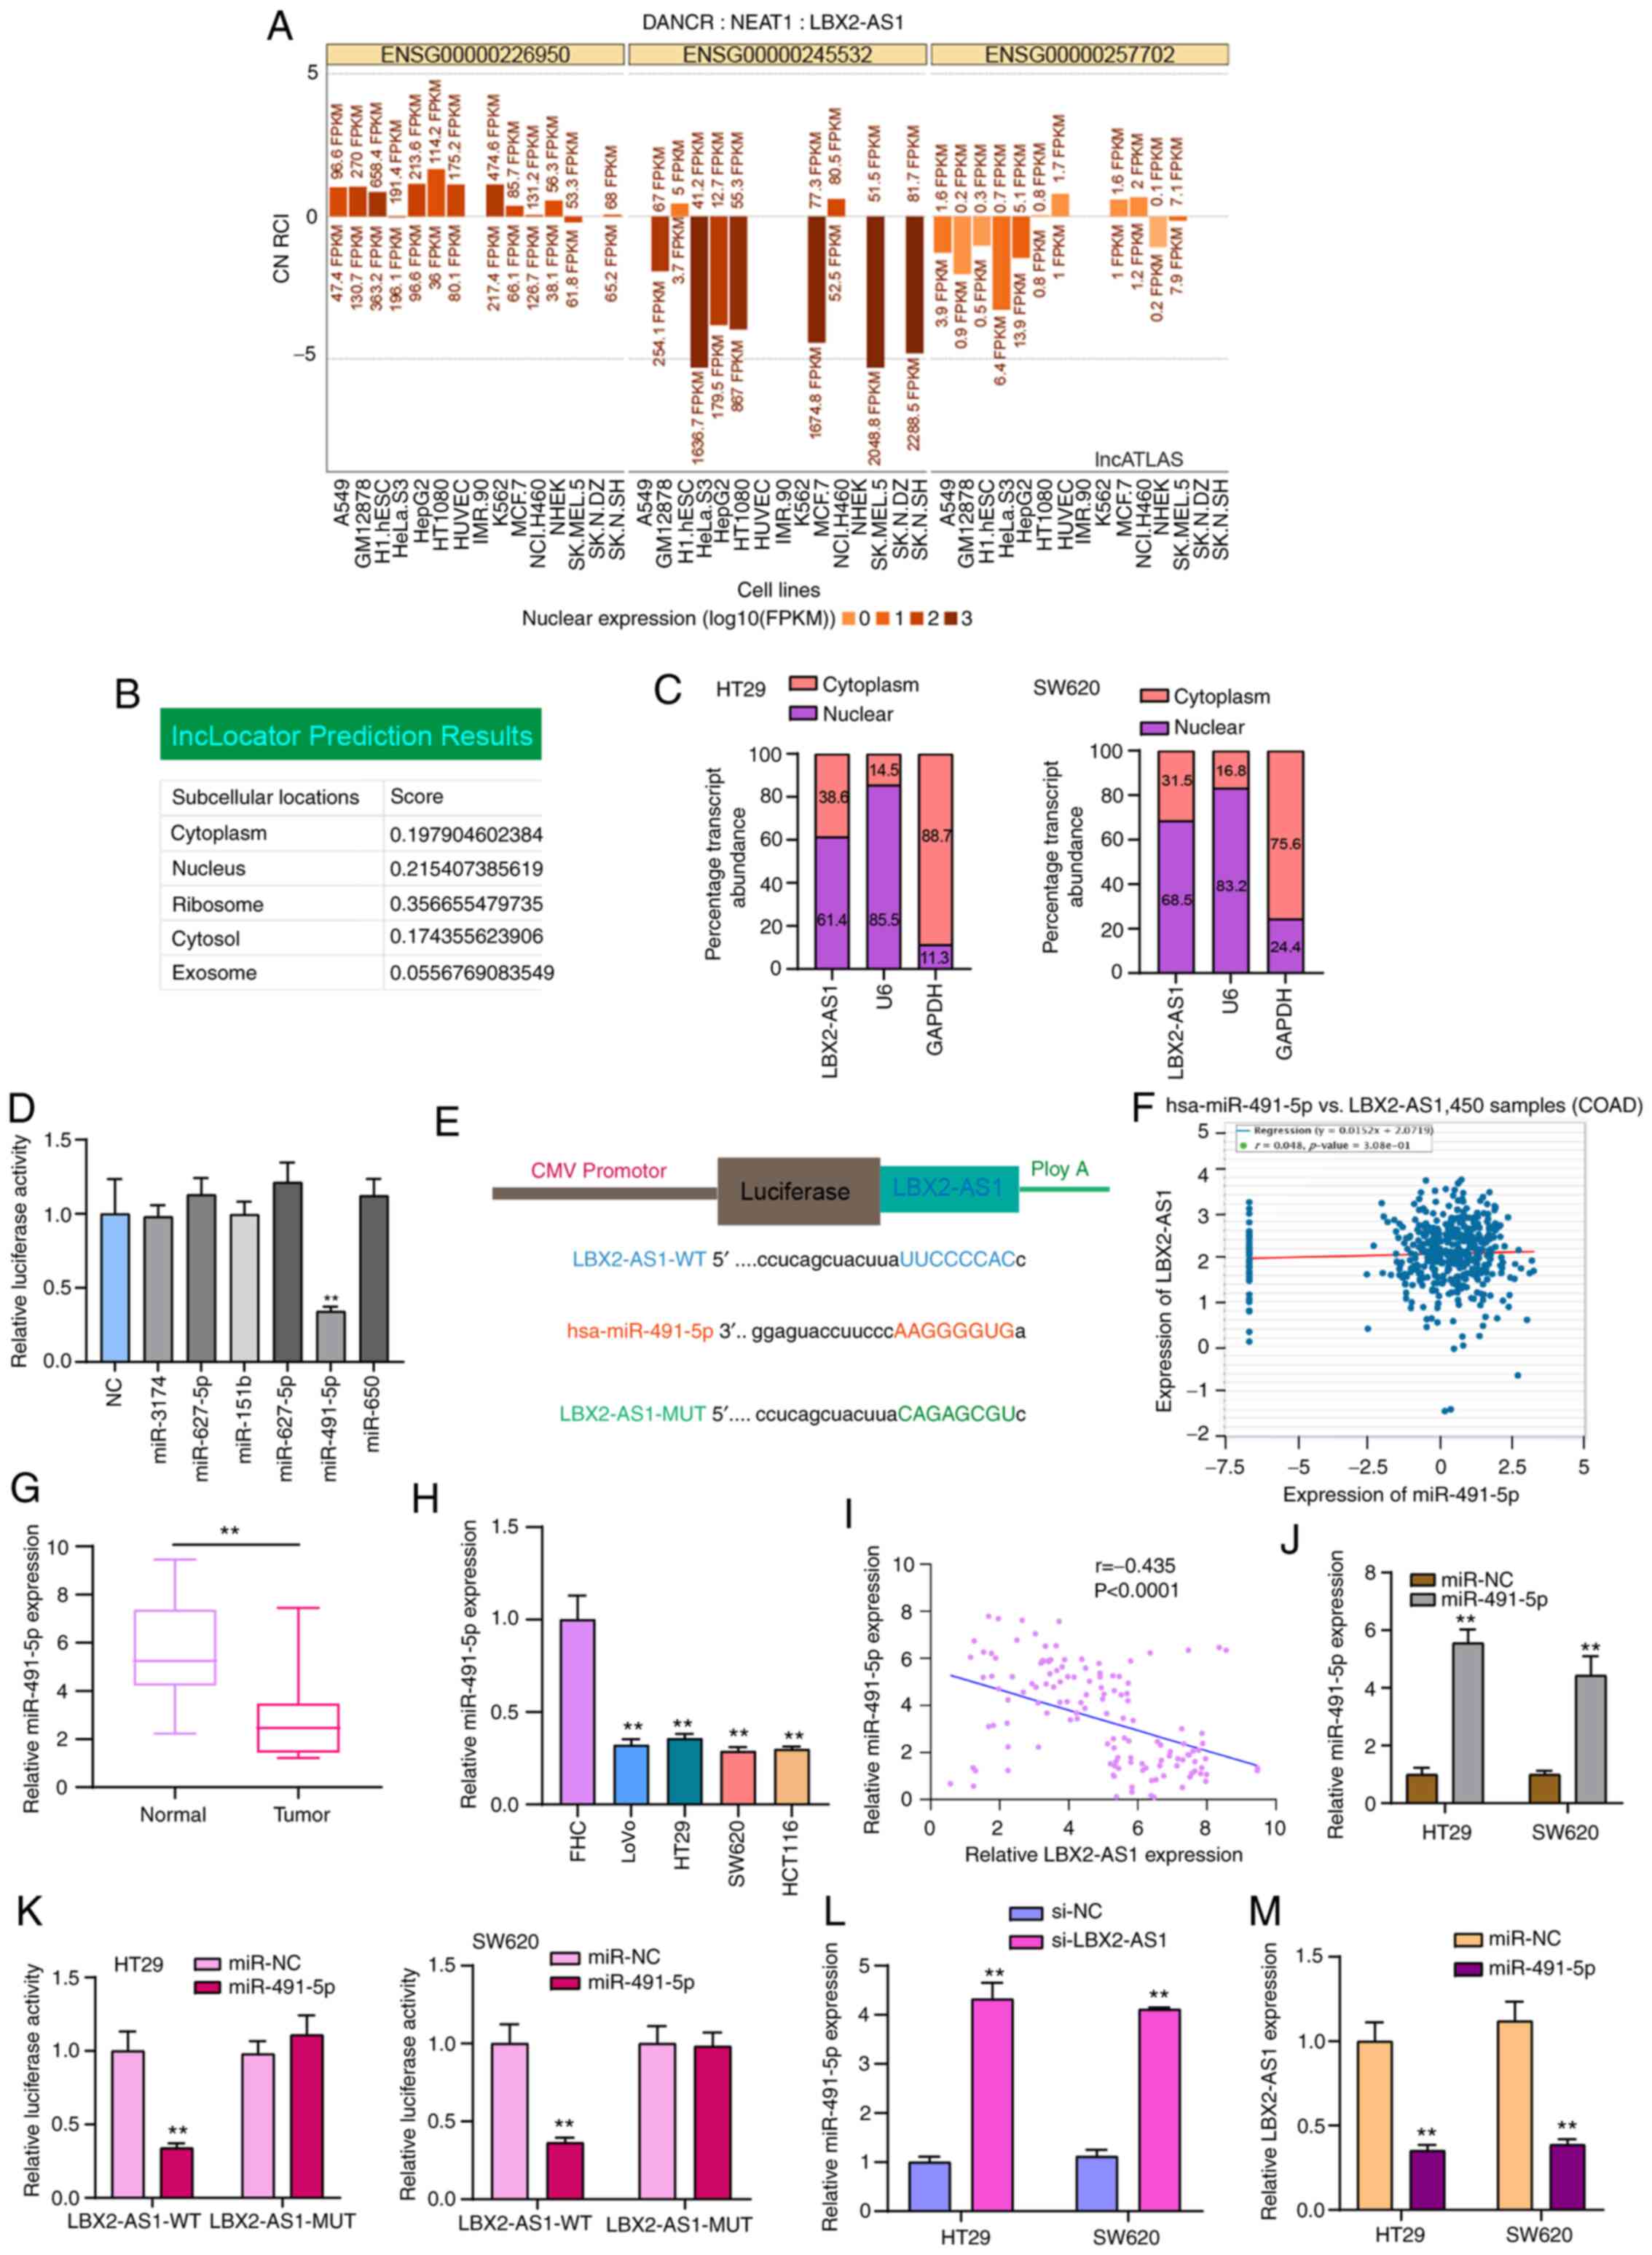 | Figure 5LBX2-AS1 serves as a sponge of
hsa-miR-491-5p in colorectal cancer cells. (A and B) Subcellular
locations of LBX2-AS1 were predicted using the lncATLAS and
lncLocator databases. (C) Subcellular locations of LBX2-AS1 were
determined in HT29 and SW620 colorectal cancer cells. (D)
Dual-luciferase reporter assay showed that there was a direct
target relationship between hsa-miR-491-5p and LBX2-AS1.
**P<0.01 vs. NC. (E) Schematic diagram of the binding
site of hsa-miR-491-5p and LBX2-AS1. (F) A weak negative
correlation was found between hsa-miR-491-5p and LBX2-AS1, which
was identified from the starBase database. (G and H) miR-491-5p
expression was decreased in colorectal cancer tissues and cells, as
determined via RT-qPCR. **P<0.01 vs. normal tissues
or FHC cells. (I) There was a moderate negative correlation between
LBX2-AS1 and miR-491-5p in a cohort of 145 patients with colorectal
cancer (r=-0.4345, P<0.0001). (J) miR-491-5p expression was
determined in colorectal cancer cells transfected with miR-491-5p
mimics via RT-qPCR. (K) Dual-luciferase reporter assay confirmed
that LBX2-AS1 could act as a sponge of hsa-miR-491-5p in colorectal
cancer cells. (L) miR-491-5p expression was determined in
colorectal cancer cells transfected with si-LBX2-AS1 via RT-qPCR.
(M) The relative LBX2-AS1 expression was quantified in colorectal
cancer cells following transfection with miR-491-5p mimics, as
determined via RT-qPCR. **P<0.01 vs. miR-NC or si-NC.
LBX2-AS1, LBX2 antisense RNA 1; si-, small interfering RNA; NC,
negative control; miR, microRNA; RT-qPCR, reverse
transcription-quantitative PCR; WT, wild-type; MUT, mutant. |
S100A11 is highly expressed in colorectal
cancer and acts as a potential target of miR-491-5p
The heatmap presented in Fig. 6A shows the differences in
expression patterns of the top 25 DEGs between colorectal cancer
and normal tissues. Also, these genes were visualized into volcano
plots (Fig. 6B). Among them,
S100A11 was highly expressed both in TCGA database (Fig. 6C) and TCGA/GTEx database
(Fig. 6D). Furthermore, there
was a difference in S100A11 expression among different clinical
stages (Fig. 6E). From the
UALCAN database, high S100A11 expression was found in colorectal
cancer using data from the CPTAC dataset (Fig. 6F). In addition, hsa-miR-491-5p
was weakly correlated with S100A11 in a dataset from the starBase
database (Fig. 6G). S100A11 was
highly expressed in a number of cancer types, except colorectal
cancer (Fig. 6H). Results of
RT-qPCR confirmed that S100A11 expression was higher in colorectal
cancer tissues (Fig. 6I) and
cells (Fig. 6J). As shown in the
bioinformatics analysis, miR-491-5p could bind to the 3′UTR region
of S100A11 (Fig. 6K). In both
HT29 and SW620 cells, co-transfection of S100A11-WT and miR-491-5p
mimics significantly reduced the relative luciferase activity
(Fig. 6L). After miR-491-5p
overexpression with mimics, S100A11 expression was significantly
reduced in colorectal cancer cells (Fig. 6M). Therefore, S100A11 could act
as a target of miR-491-5p in colorectal cancer.
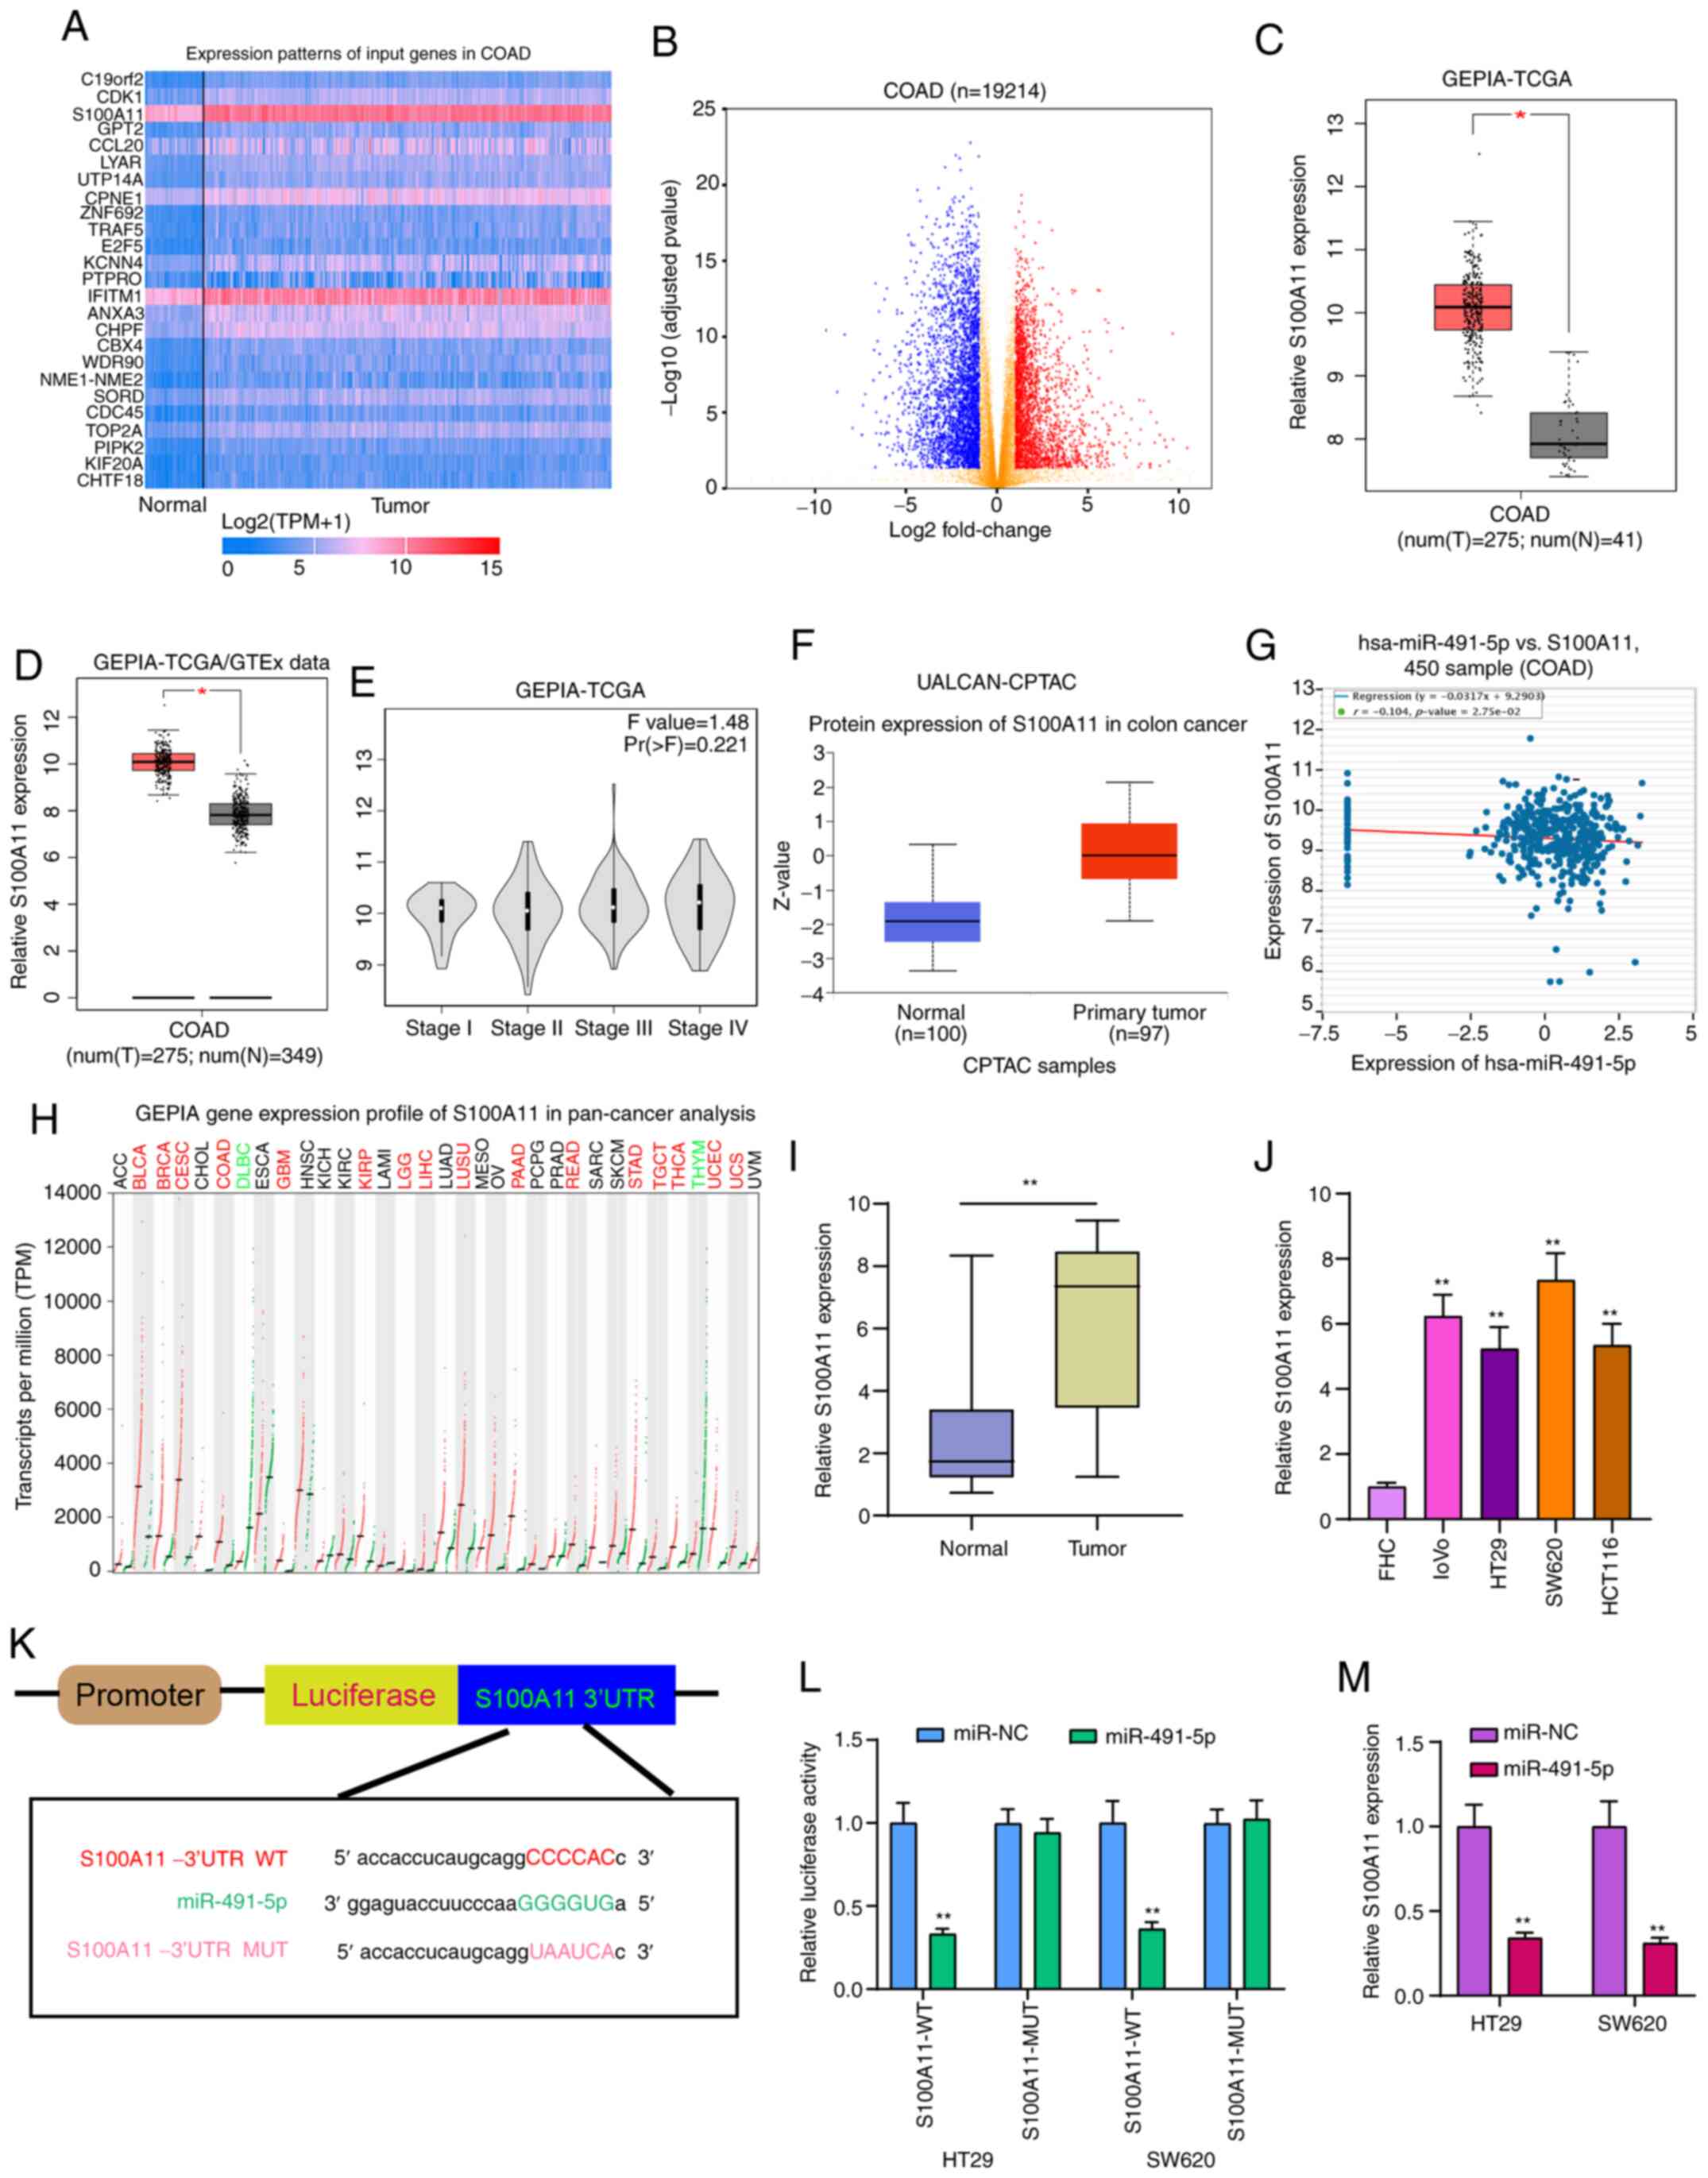 | Figure 6S100A11 is highly expressed in
colorectal cancer tissues and cells, and acts as a potential target
for miR-491-5p. (A) Heatmap showing the top 25 DEGs between
colorectal cancer and normal samples in TCGA database. (B) All DEGs
were visualized in volcano plots. (C and D) High S100A11 expression
was found in colorectal cancer from TCGA database and TCGA/GTEx
database. *P<0.05. (E) Violin plots showing the
expression pattern of S100A11 in different colorectal cancer
stages. (F) Box plots depicting the high S100A11 expression in
colorectal cancer from the UALCAN database. (G) There was a weak
negative correlation between S100A11 and miR-491-5p, which was
identified from the starBase database. (H) The expression patterns
of S100A11 in a pan-cancer analysis. (I and J) S100A11 expression
was verified in colorectal cancer tissues and cells via reverse
transcription-quantitative PCR. **P<0.01 vs. normal
tissues or FHC cells. (K) Schematic diagram of the binding site
between hsa-miR-491-5p and S100A11. (L) Dual-luciferase reporter
assay results confirmed that miR-491-5p directly bound to the 3′UTR
region of S100A11. (M) S100A11 expression was detected in
colorectal cancer cells following transfection with miR-491-5p
mimics. **P<0.01 vs. miR-NC. miR, microRNA; NC,
negative control; DEGs, differentially expressed genes; TCGA, The
Cancer Genome Atlas; GTEx, The Genotype-Tissue Expression project;
COAD, colon adenocarcinoma; GEPIA, Gene Expression Profiling
Interactive Analysis; CPTAC, Clinical Proteomic Tumor Analysis
Consortium; WT, wild-type; MUT, mutant. |
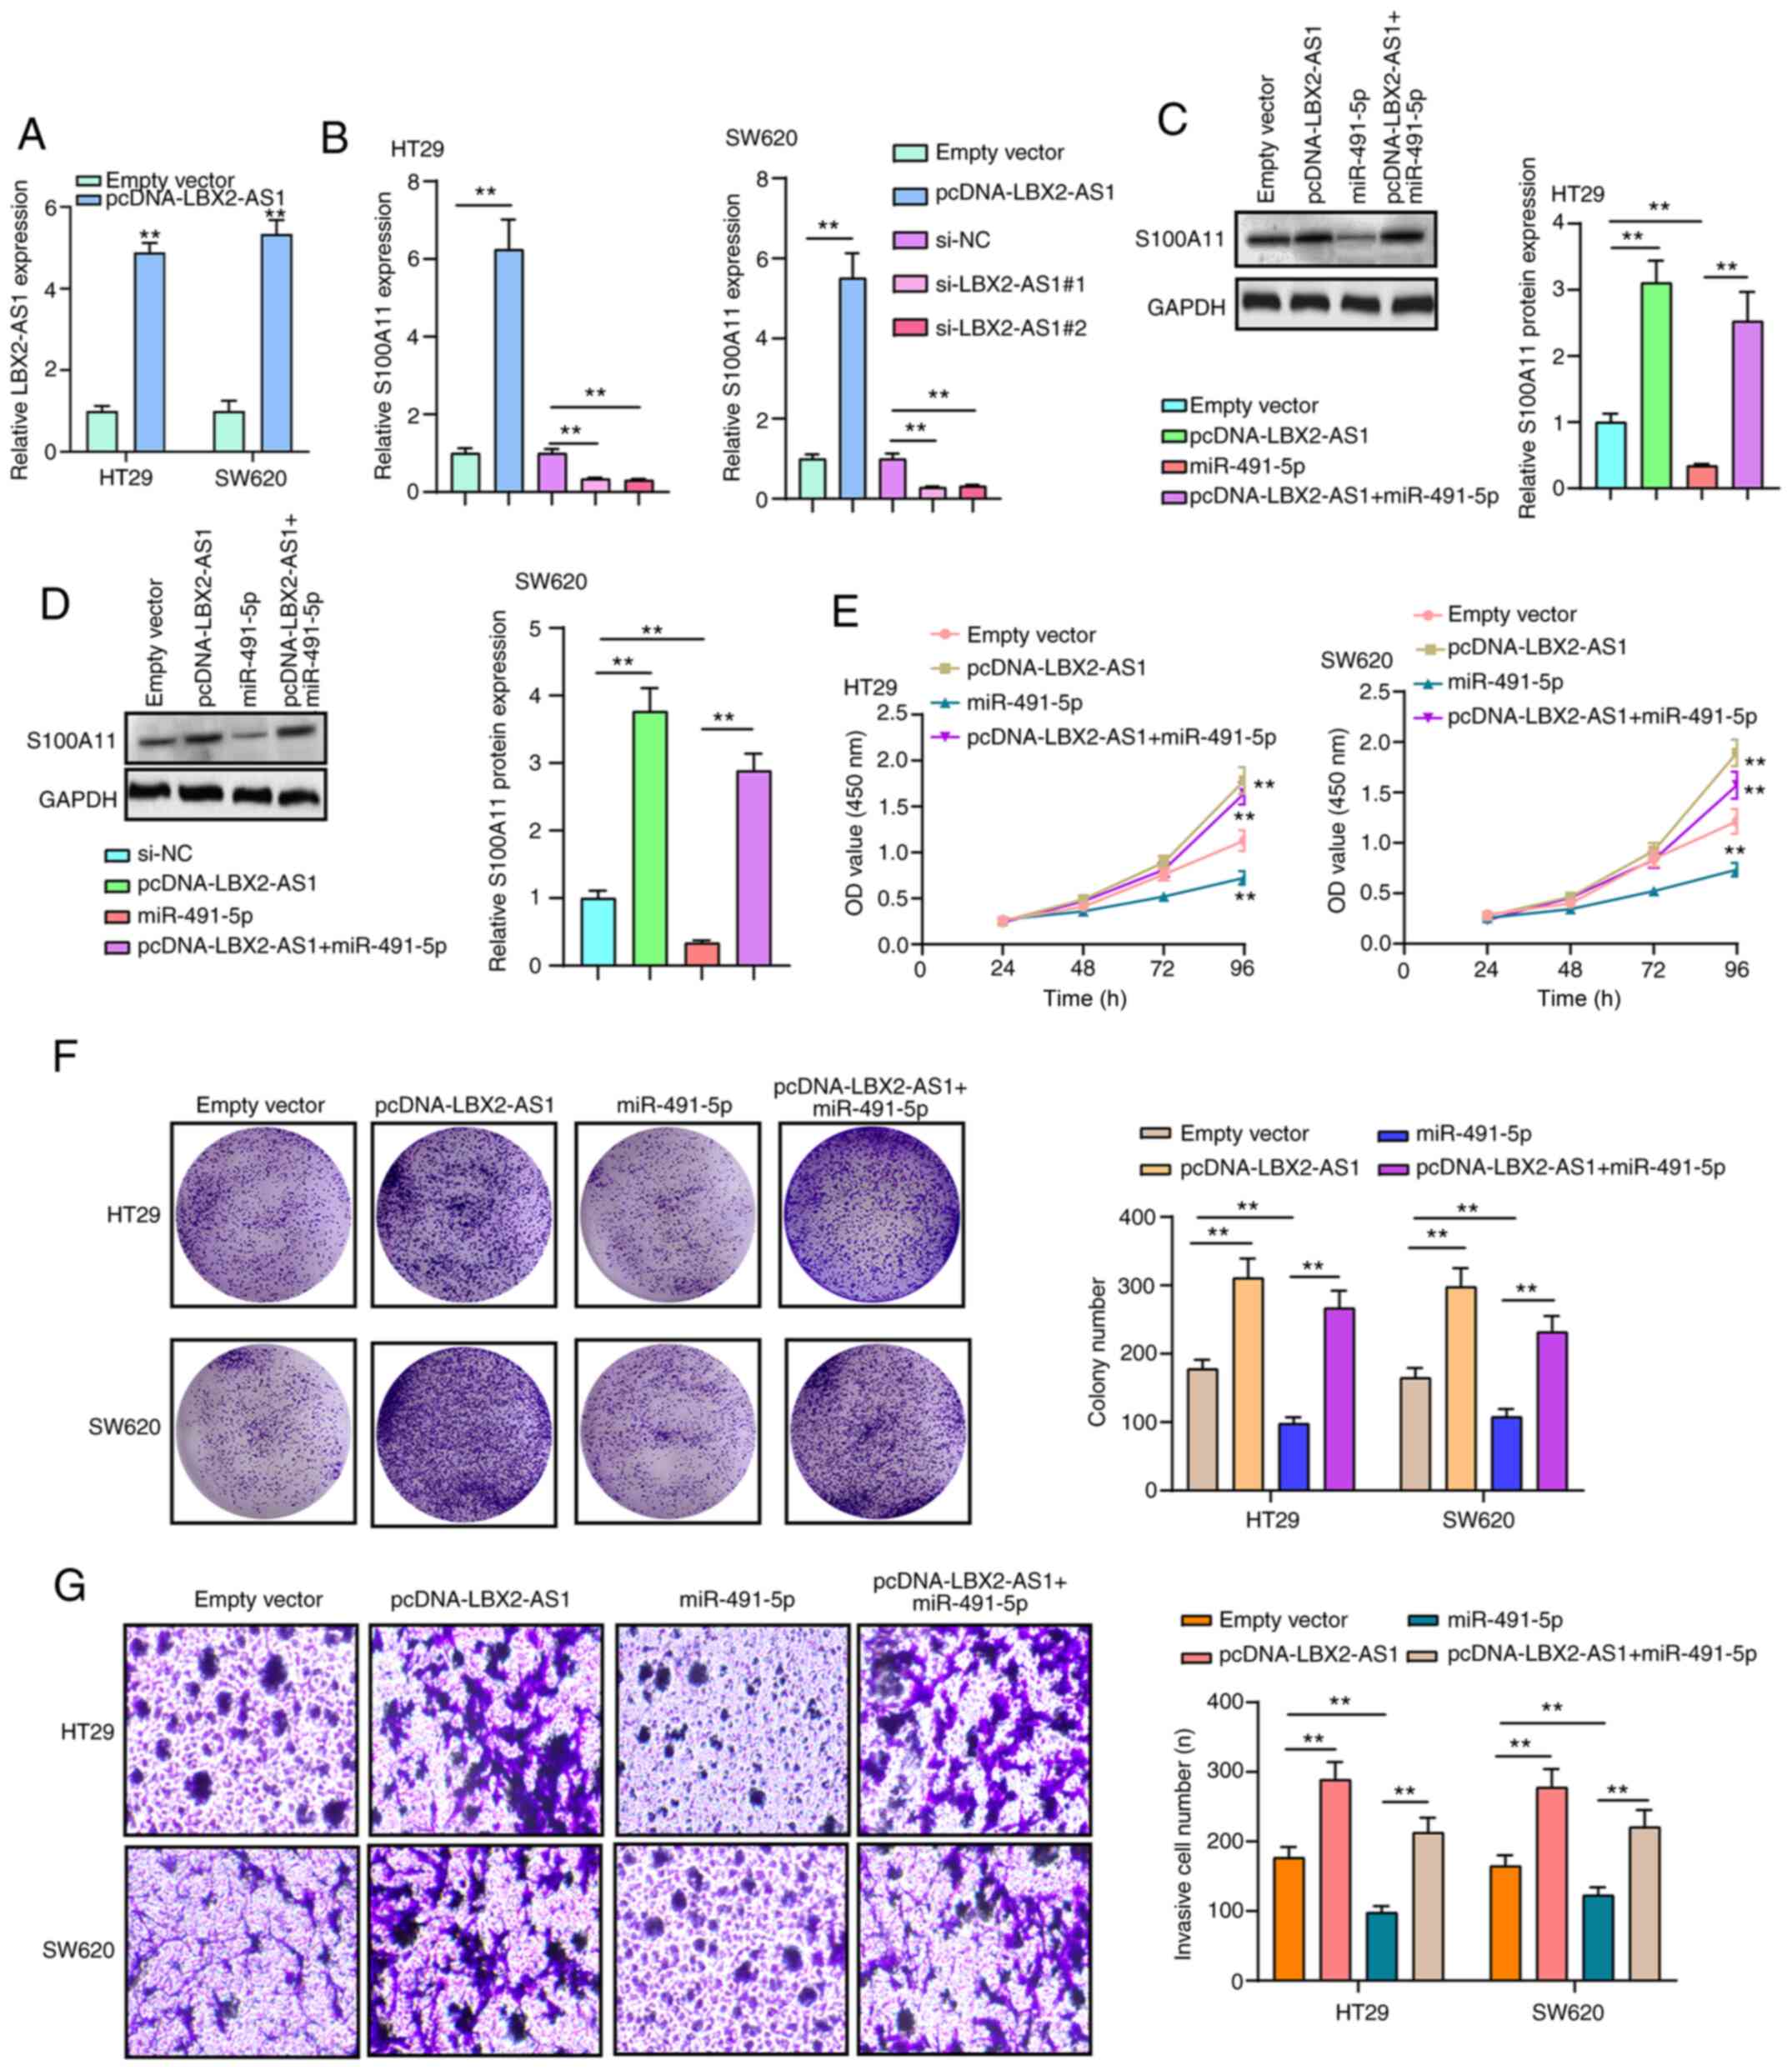
LBX2-AS1 promotes colorectal cancer cell
proliferation and invasion by mediating the miR-491-5p/S100A11
axis
RT-qPCR results confirmed that LBX2-AS1 was
successfully overexpressed in HT29 and SW620 cells transfected with
pcDNA-LBX2-AS1 (Fig. 7A). The
mRNA expression of S100A11 was significantly downregulated in HT29
and SW620 cells transfected with si-LBX2-AS1, as determined via
RT-qPCR (Fig. 7B). On the other
hand, transfection with pcDNA-LBX2-AS1 significantly promoted
S100A11 mRNA expression in colorectal cancer cells (Fig. 7B). At the protein level, in two
colorectal cancer cells transfected with pcDNA-LBX2-AS1, S100A11
expression was significantly elevated (Fig. 7C and D). However, transfection
with miR-491-5p mimics significantly decreased the expression of
S100A11 protein in cells. Of note, LBX2-AS1 overexpression could
reverse the inhibitory effects of transfection with miR-491-5p
mimics on S100A11 protein expression (Fig. 7C and D), indicating that LBX2-AS1
may indirectly enhance the mRNA expression of S100A11 via blocking
miR-491-5p. As expected, the repressive functions of miR-491-5p
mimics on cell viability were found in HT29 and SW620 cells, as
determined via a CCK-8 assay, which were ameliorated by
transfection with pcDNA-LBX2-AS1 (Fig. 7E). In the colony formation assay,
the colony number of HT29 and SW620 cells was significantly reduced
following transfection with miR-491-5p mimics (Fig. 7F). Nonetheless, after
co-transfection of miR-491-5p mimics and pcDNA-LBX2-AS1, the colony
formation ability of colorectal cancer cells was significantly
enhanced compared with the miR-491-5p mimics group (Fig. 7F). Moreover, LBX2-AS1
overexpression was capable of partially reversing the suppressive
effect of miR-491-5p mimics on colorectal cancer cell invasion
(Fig. 7G). The aforementioned
findings suggested that LBX2-AS1 could enhance colorectal cancer
cell proliferation and invasion via regulation of the
miR-491-5p/S100A11 axis.
Discussion
The present study identified a novel finding that
lncRNA LBX2-AS1 could be a potential underlying diagnostic and
prognostic marker for colorectal cancer. Mechanically, LBX2-AS1,
induced by transcription factor ELK1, facilitates cell
proliferation, migration and invasion via the mediation of the
miR-491-5p/S100A11 axis in colorectal cancer cells.
High LBX2-AS1 expression was found in both
colorectal cancer tissues and cells. Previously, LBX2-AS1
expression has been verified to be elevated in several types of
cancer (11,13). The ROC results of the present
study demonstrated that LBX2-AS1 was a sensitive diagnostic marker
in patients with colorectal cancer. In colorectal cancer, high
LBX2-AS1 expression predicted poor clinical outcomes. Furthermore,
LBX2-AS1 expression was associated with the clinical stages of
colorectal cancer. Patients diagnosed as stage III-IV usually had
higher LBX2-AS1 expression than those with stage I-II. Previous
studies have confirmed that upregulated LBX2-AS1 expression is
associated with unfavorable prognosis of lung carcinoma (12), stomach carcinoma (13) and liver cancer (14). In the present study, multivariate
Cox regression analysis showed that LBX2-AS1 expression could be an
independent prognostic factor for colorectal cancer.
In the current study, transcription factor ELK1 was
notably upregulated in colorectal cancer tissues, as well as cells,
which was consistent with previous studies (30-32). It has been confirmed that ELK1
overexpression promotes migration and invasion of colorectal cancer
cells (31). Also, its
upregulation facilitates proliferation and angiogenesis (30), and suppresses apoptosis in
colorectal cancer cells (32).
These findings demonstrate that ELK1 is likely to be involved in
colorectal cancer progression. The results of the RIP and
dual-luciferase reporter assays in the present study verified that
ELK1 could directly bind to the two conservative sites (located at
-437/-405 and -346/-329) in the promoter region of LBX2-AS1.
Therefore, LBX2-AS1 could act as a transcriptional target of ELK1.
ELK1 has been confirmed to directly interact with the endogenous
miR-31 promoter in a MAPK-dependent manner (33). The current study found that
suppression of LBX2-AS1 could promote apoptosis of colorectal
cancer cells. Moreover, silencing LBX2-AS1 could suppress
proliferation, migration, invasion and EMT process in colorectal
cancer cells. EMT is the key mechanism of tumor invasion and
metastasis for colorectal cancer. Zinc finger E-box-binding
homeobox 1-induced LBX2-AS1 upregulation promotes migration,
invasion and EMT in esophageal cancer cells (11). Nuclear factor 1 C-type-mediated
LBX2-AS1 enhances cellular proliferation, migration and invasion in
gastric cancer (34). The
findings of the present study demonstrated that LBX2-AS1 was
distributed in the nucleus and cytoplasm of colorectal cancer
cells. Low miR-491-5p expression was detected in colorectal cancer
tissues and cells, which was consistent with a previous study
(35). Furthermore,
downregulation of miR-491-5p is associated with unfavorable
prognosis in patients with colorectal cancer (36). Furthermore, low miR-491-5p
expression can promote colorectal cancer cell proliferation
(36). Circulating miR-491-5p
can be used to distinguish patients with colorectal cancer from
patients with adenoma (36).
Dual-luciferase reporter results of the present study confirmed
that LBX2-AS1 may play a role as a sponge of hsa-miR-491-5p in
colorectal cancer cells.
Upregulation of S100A11 was found in colorectal
cancer tissues and cells via RT-qPCR in the current study, as
reported in previous studies (37-39). S100A11 is closely related to the
EMT and invasive phenotypes of colorectal cancer cells (40,41). As shown in the dual-luciferase
reporter assays performed in the present study, miR-491-5p may bind
to the 3′UTR region of S100A11. Also, overexpression of miR-491-5p
significantly reduced S100A11 expression in two colorectal cancer
cells. Thus, S100A11 may serve as a target of miR-491-5p in
colorectal cancer. Additionally, overexpression of LBX2-AS induced
the upregulation of S100A11 at the mRNA and protein levels in
colorectal cancer cells. More importantly, LBX2-AS1 may indirectly
enhance the mRNA expression of S100A11 through blocking miR-491-5p.
Furthermore, the suppressive effects of miR-491-5p mimics were
notably reversed by LBX2-AS1 overexpression on colorectal cancer
cell proliferation and invasion. Hence, these findings revealed
that LBX2-AS1 could enhance colorectal cancer cell proliferation
and invasion by means of mediating the miR-491-5p/S100A11 axis.
To conclude, in the present study, lncRNA LBX2-AS1
was identified to be upregulated in colorectal cancer, which was
transcriptionally regulated by transcription factor ELK1. LBX2-AS1
could become a hopeful diagnostic and prognostic marker for
colorectal cancer. It was further found that LBX2-AS1
overexpression facilitated cell proliferation, EMT, migration and
invasion in colorectal cancer cells. LBX2-AS1 could block S100A11
degradation via competitively binding to miR-491-5p, thereby
enhancing colorectal cancer development. Thus, these findings
revealed the possible value of LBX2-AS1 in the diagnosis prognosis,
and treatment of colorectal cancer.
Availability of data and materials
The datasets used and/or analyzed during the current
study are available from the corresponding author on reasonable
request.
Authors' contributions
XY conceived and designed the study. GM, WD and JZ
conducted most of the experiments and data analysis, and wrote the
manuscript. QL, BG and YS participated in data collection and
helped to draft the manuscript. All authors read and approved the
final manuscript. XY and GM confirm the authenticity of all the raw
data.
Ethics approval and consent to
participate
The present study was approved by the Ethics
Committee of The Affiliated Huai'an No. 1 People's Hospital of
Nanjing Medical University (approval no. 2014059; Huai'an, China).
All subjects provided signed informed consent.
Patient consent for publication
Not applicable.
Competing interests
The authors declare that they have no competing
interests.
Acknowledgments
Not applicable.
Funding
No funding was received.
Abbreviations:
|
ncRNA
|
non-coding RNA
|
|
lncRNA
|
long non-coding RNA
|
|
miRNAs
|
microRNAs
|
|
RT-qPCR
|
reverse transcription-quantitative
PCR
|
|
RIP
|
RNA immunoprecipitation
|
|
CCK-8
|
Cell Counting Kit-8
|
|
EMT
|
epithelial-mesenchymal transition
|
|
OS
|
overall survival
|
|
DFS
|
disease-free survival
|
References
|
1
|
Siegel RL, Miller KD and Jemal A: Cancer
statistics, 2019. CA Cancer J Clin. 69:7–34. 2019. View Article : Google Scholar : PubMed/NCBI
|
|
2
|
Bekaii-Saab TS, Ou FS, Ahn DH, Boland PM,
Ciombor KK, Heying EN, Dockter TJ, Jacobs NL, Pasche BC, Cleary JM,
et al: Regorafenib dose-optimisation in patients with refractory
metastatic colorectal cancer (ReDOS): A randomised, multicentre,
open-label, phase 2 study. Lancet Oncol. 20:1070–1082. 2019.
View Article : Google Scholar : PubMed/NCBI
|
|
3
|
Gunjur A: Targeted therapy for BRAF-mutant
colorectal cancer. Lancet Oncol. 20:e6182019. View Article : Google Scholar : PubMed/NCBI
|
|
4
|
Pfeiffer P, Yilmaz M, Möller S, Zitnjak D,
Krogh M, Petersen LN, Poulsen LØ, Winther SB, Thomsen KG and
Qvortrup C: TAS-102 with or without bevacizumab in patients with
chemorefractory metastatic colorectal cancer: An
investigator-initiated, open-label, randomised, phase 2 trial.
Lancet Oncol. 21:412–420. 2020. View Article : Google Scholar : PubMed/NCBI
|
|
5
|
Hu M, Zhou X, Wang Y, Guan K and Huang L:
Relaxin-FOLFOX-IL-12 triple combination therapy engages memory
response and achieves long-term survival in colorectal cancer liver
metastasis. J Control Release. 319:213–221. 2020. View Article : Google Scholar : PubMed/NCBI
|
|
6
|
Huyghe JR, Bien SA, Harrison TA, Kang HM,
Chen S, Schmit SL, Conti DV, Qu C, Jeon J, Edlund CK, et al:
Discovery of common and rare genetic risk variants for colorectal
cancer. Nat Genet. 51:76–87. 2019. View Article : Google Scholar :
|
|
7
|
Chi Y, Wang D, Wang J, Yu W and Yang J:
Long non-coding RNA in the pathogenesis of cancers. Cells.
8:10152019. View Article : Google Scholar :
|
|
8
|
Galamb O, Barták BK, Kalmár A, Nagy ZB,
Szigeti KA, Tulassay Z, Igaz P and Molnár B: Diagnostic and
prognostic potential of tissue and circulating long non-coding RNAs
in colorectal tumors. World J Gastroenterol. 25:5026–5048. 2019.
View Article : Google Scholar : PubMed/NCBI
|
|
9
|
Wei L, Wang X, Lv L, Zheng Y, Zhang N and
Yang M: The emerging role of noncoding RNAs in colorectal cancer
chemoresistance. Cell Oncol (Dordr). 42:757–768. 2019. View Article : Google Scholar
|
|
10
|
Xu M, Xu X, Pan B, Chen X, Lin K, Zeng K,
Liu X, Xu T, Sun L, Qin J, et al: LncRNA SATB2-AS1 inhibits tumor
metastasis and affects the tumor immune cell microenvironment in
colorectal cancer by regulating SATB2. Mol Cancer. 18:1352019.
View Article : Google Scholar : PubMed/NCBI
|
|
11
|
Zhang Y, Chen W, Pan T, Wang H, Zhang Y
and Li C: LBX2-AS1 is activated by ZEB1 and promotes the
development of esophageal squamous cell carcinoma by interacting
with HNRNPC to enhance the stability of ZEB1 and ZEB2 mRNAs.
Biochem Biophys Res Commun. 511:566–572. 2019. View Article : Google Scholar : PubMed/NCBI
|
|
12
|
Tang LX, Su SF, Wan Q, He P, Xhang Y and
Cheng XM: Novel long non-coding RNA LBX2-AS1 indicates poor
prognosis and promotes cell proliferation and metastasis through
notch signaling in non-small cell lung cancer. Eur Rev Med
Pharmacol Sci. 23:7419–7429. 2019.PubMed/NCBI
|
|
13
|
Yang Z, Dong X, Pu M, Yang H, Chang W, Ji
F, Liu T, Wei C, Zhang X and Qiu X: LBX2-AS1/miR-219a-2-3p/FUS/LBX2
positive feedback loop contributes to the proliferation of gastric
cancer. Gastric Cancer. 23:449–463. 2020. View Article : Google Scholar
|
|
14
|
Wang Y, Zhao Y, Zhang X, Zhang A and Ma J:
Long noncoding RNA LBX2-AS1 drives the progression of
hepatocellular carcinoma by sponging microRNA-384 and thereby
positively regulating IRS1 expression. Pathol Res Pract.
216:1529032020. View Article : Google Scholar : PubMed/NCBI
|
|
15
|
Sakai S, Ohhata T, Kitagawa K, Uchida C,
Aoshima T, Niida H, Suzuki T, Inoue Y, Miyazawa K and Kitagawa M:
Long noncoding RNA ELIT-1 acts as a Smad3 cofactor to facilitate
TGFβ/Smad signaling and promote epithelial-mesenchymal transition.
Cancer Res. 79:2821–2838. 2019. View Article : Google Scholar : PubMed/NCBI
|
|
16
|
Wang C, Yang Y, Zhang G, Li J, Wu X, Ma X,
Shan G and Mei Y: Long noncoding RNA EMS connects c-Myc to cell
cycle control and tumorigenesis. Proc Natl Acad Sci USA.
116:14620–14629. 2019. View Article : Google Scholar : PubMed/NCBI
|
|
17
|
Xie JJ, Jiang YY, Jiang Y, Li CQ, Lim MC,
An O, Mayakonda A, Ding LW, Long L, Sun C, et al:
Super-enhancer-driven long non-coding RNA LINC01503, regulated by
TP63, is over-expressed and oncogenic in squamous cell carcinoma.
Gastroenterology. 154:2137–2151.e1. 2018. View Article : Google Scholar : PubMed/NCBI
|
|
18
|
Cheng C, Zhang Z, Cheng F and Shao Z:
Exosomal lncRNA RAMP2-AS1 derived from chondrosarcoma cells
promotes angiogenesis through miR-2355-5p/VEGFR2 axis. Onco Targets
Ther. 13:3291–3301. 2020. View Article : Google Scholar : PubMed/NCBI
|
|
19
|
Li P, Li Y, Dai Y, Wang B, Li L, Jiang B,
Wu P and Xu J: The LncRNA H19/miR-1-3p/CCL2 axis modulates
lipopolysaccharide (LPS) stimulation-induced normal human astrocyte
proliferation and activation. Cytokine. 131:1551062020. View Article : Google Scholar : PubMed/NCBI
|
|
20
|
Zhang Q, Jin X, Shi W, Chen X, Pang W, Yu
X and Yang L: A long non-coding RNA LINC00461-dependent mechanism
underlying breast cancer invasion and migration via the
miR-144-3p/KPNA2 axis. Cancer Cell Int. 20:1372020. View Article : Google Scholar : PubMed/NCBI
|
|
21
|
Cheng Q and Wang L: LncRNA XIST serves as
a ceRNA to regulate the expression of ASF1A, BRWD1M, and PFKFB2 in
kidney transplant acute kidney injury via sponging hsa-miR-212-3p
and hsa-miR-122-5p. Cell Cycle. 19:290–299. 2020. View Article : Google Scholar : PubMed/NCBI
|
|
22
|
Tang Z, Li C, Kang B, Gao G, Li C and
Zhang Z: GEPIA: A web server for cancer and normal gene expression
profiling and interactive analyses. Nucleic Acids Res. 45:W98–W102.
2017. View Article : Google Scholar : PubMed/NCBI
|
|
23
|
Fornes O, Castro-Mondragon JA, Khan A, van
der Lee R, Zhang X, Richmond PA, Modi BP, Correard S, Gheorghe M,
Baranašić D, et al: JASPAR 2020: update of the open-access database
of transcription factor binding profiles. Nucleic Acids Res.
48:D87–D92. 2020.
|
|
24
|
Netanely D, Stern N, Laufer I and Shamir
R: An interactive tool for analyzing clinically-labeled multi-omic
cancer datasets. BMC Bioinformatics. 20:7322019. View Article : Google Scholar
|
|
25
|
Mas-Ponte D, Carlevaro-Fita J, Palumbo E,
Hermoso Pulido T, Guigo R and Johnson R: LncATLAS database for
subcellular localization of long noncoding RNAs. RNA. 23:1080–1087.
2017. View Article : Google Scholar : PubMed/NCBI
|
|
26
|
Cao Z, Pan X, Yang Y, Huang Y and Shen HB:
The lncLocator: A subcellular localization predictor for long
non-coding RNAs based on a stacked ensemble classifier.
Bioinformatics. 34:2185–2194. 2018. View Article : Google Scholar : PubMed/NCBI
|
|
27
|
Li JH, Liu S, Zhou H, Qu LH and Yang JH:
starBase v2.0: Decoding miRNA-ceRNA, miRNA-ncRNA and protein-RNA
interaction networks from large-scale CLIP-Seq data. Nucleic Acids
Res. 42:D92–D97. 2014. View Article : Google Scholar
|
|
28
|
Chandrashekar DS, Bashel B, Balasubramanya
SAH, Creighton CJ, Ponce-Rodriguez I, Chakravarthi BVSK and
Varambally S: UALCAN: A portal for facilitating tumor subgroup gene
expression and survival analyses. Neoplasia. 19:649–658. 2017.
View Article : Google Scholar : PubMed/NCBI
|
|
29
|
Livak KJ and Schmittgen TD: Analysis of
relative gene expression data using real-time quantitative PCR and
the 2(−Delta Delta C(T)) method. Methods. 25:402–408. 2001.
View Article : Google Scholar
|
|
30
|
Xu Z, Zhu C, Chen C, Zong Y, Feng H, Liu
D, Feng W, Zhao J and Lu A: CCL19 suppresses angiogenesis through
promoting miR-206 and inhibiting Met/ERK/Elk-1/HIF-1α/VEGF-A
pathway in colorectal cancer. Cell Death Dis. 9:9742018. View Article : Google Scholar
|
|
31
|
Ma J, Liu X, Chen H, Abbas MK, Yang L, Sun
H, Sun T, Wu B, Yang S and Zhou D: c-KIT-ERK1/2 signaling activated
ELK1 and upregulated carcinoembryonic antigen expression to promote
colorectal cancer progression. Cancer Sci. 112:655–667. 2021.
View Article : Google Scholar
|
|
32
|
Yano S, Wu S, Sakao K and Hou DX:
Involvement of ERK1/2-mediated ELK1/CHOP/DR5 pathway in
6-(methylsulfinyl)hexyl isothiocyanate-induced apoptosis of
colorectal cancer cells. Biosci Biotechnol Biochem. 83:960–969.
2019. View Article : Google Scholar : PubMed/NCBI
|
|
33
|
Kent OA, Mendell JT and Rottapel R:
Transcriptional regulation of miR-31 by oncogenic KRAS mediates
metastatic phenotypes by repressing RASA1. Mol Cancer Res.
14:267–277. 2016. View Article : Google Scholar : PubMed/NCBI
|
|
34
|
Xu G, Zhang Y, Li N, Wu Y, Zhang J, Xu R
and Ming H: LBX2-AS1 up-regulated by NFIC boosts cell proliferation
migration and invasion in gastric cancer through targeting
miR-491-5p/ZNF703. Cancer Cell Int. 20:1362020. View Article : Google Scholar
|
|
35
|
Lu L, Cai M, Peng M, Wang F and Zhai X:
miR-491-5p functions as a tumor suppressor by targeting IGF2 in
colorectal cancer. Cancer Manag Res. 11:1805–1816. 2019. View Article : Google Scholar : PubMed/NCBI
|
|
36
|
Zhang J, Raju GS, Chang DW, Lin SH, Chen Z
and Wu X: Global and targeted circulating microRNA profiling of
colorectal adenoma and colorectal cancer. Cancer. 124:785–796.
2018. View Article : Google Scholar
|
|
37
|
Jung Y, Lee S, Choi HS, Kim SN, Lee E,
Shin Y, Seo J, Kim B, Jung Y, Kim WK, et al: Clinical validation of
colorectal cancer biomarkers identified from bioinformatics
analysis of public expression data. Clin Cancer Res. 17:700–709.
2011. View Article : Google Scholar : PubMed/NCBI
|
|
38
|
Moravkova P, Kohoutova D, Vavrova J and
Bures J: Serum S100A6, S100A8, S100A9 and S100A11 proteins in
colorectal neoplasia: Results of a single centre prospective study.
Scand J Clin Lab Invest. 80:173–178. 2020. View Article : Google Scholar
|
|
39
|
Wang G, Wang X, Wang S, Song H, Sun H,
Yuan W, Cao B, Bai J and Fu S: Colorectal cancer progression
correlates with upregulation of S100A11 expression in tumor
tissues. Int J Colorectal Dis. 23:675–682. 2008. View Article : Google Scholar : PubMed/NCBI
|
|
40
|
Chang Y, Li N, Yuan W, Wang G and Wen J:
LINC00997, a novel long noncoding RNA, contributes to metastasis
via regulation of S100A11 in kidney renal clear cell carcinoma. Int
J Biochem Cell Biol. 116:1055902019. View Article : Google Scholar : PubMed/NCBI
|
|
41
|
Niu Y, Shao Z, Wang H, Yang J, Zhang F,
Luo Y, Xu L, Ding Y and Zhao L: LASP1-S100A11 axis promotes
colorectal cancer aggressiveness by modulating TGFβ/Smad signaling.
Sci Rep. 6:261122016. View Article : Google Scholar
|