Introduction
Esophageal cancer (ESCA) is the 6th leading cause of
cancer-associated mortality and one of the most common
gastrointestinal tumors worldwide (1). ESCA includes esophagus squamous
cell carcinoma (ESCC) and esophageal adenocarcinoma (EAC) (2,3).
EAC is the most common type of ESCA in Western countries, whereas
ESCC is the most common type in China, where it accounts for
>70% of cases of ESCA (4,5).
Although research into treatments for patients with ESCC has
achieved significant progress, the 5-year survival rate remains
unfavorable due to the high rates of recurrence and metastasis
(4,6,7).
Therefore, there is an urgent need to elucidate the molecular
mechanism underlying ESCC progression.
As a zinc-finger transcriptional repressor, growth
factor-independent 1 (GFI1) can bind histone deacetylases and
inhibit transcription; its function was initially discovered due to
its ability to serve as a cellular proto-oncogene in T cell
lymphomas, where it promotes IL-2-independent growth (8). GFI1 has been reported to be
involved in several types of cancer, including pancreatic ductal
adenocarcinoma, cervical carcinoma and acute myeloid leukemia
(AML), and it has also been found that GFI1 can control the
transcription of suppressors of cytokine signaling (SOCS)1
(9-12). SOCS inhibit the JAK/STAT and
NF-κB pathways, among others (13,14). Among the SOCS family of proteins,
SOCS1 is the most potent inhibitor of proinflammatory cytokine
signaling (15). In an ESCC
xenograft mouse model, SOCS1 overexpression has been demonstrated
to exhibit a potent antitumor effect against ESCC (16). Similarly, in a murine xenograft
model, ectopic SOCS1 expression has been reported to improve
radiosensitivity by inducing apoptosis and enhancing DNA damage
following radiotherapy (17).
Thus, SOCS1 serves an antitumor role in ESCC. It has been reported
that GFI1 can bind directly to the SOCS1 promoter and suppress
SOCS1 transcription in AML cells (12). Therefore, determining whether
GFI1 is associated with ESCC through enhancing STAT3 and NF-κB
signaling activity via inhibiting SOCS1 may improve the current
understanding of ESCC development.
The present study aimed to determine the expression
of GFI1 in patients with ESCC and ESCC cells, as well as the
functions of GFI1 in ESCC cells. Furthermore, the molecular
mechanism underlying GFI1 activation in ESCC was analyzed.
Materials and methods
Bioinformatics analysis
The mRNA expression levels of GFI1 from The Cancer
Genome Atlas (TCGA; https://portal.gdc.cancer.gov/) were analyzed using
UALCAN (http://ualcan.path.uab.edu) and
OncoLnc (www.oncoLnc.org) databases. The
databases from UALCAN contains the RNA-seq data (from TCGA), which
includes the GFI1 expression levels from 184 tumor and 11 adjacent
normal esophageal tissues. The survival curves based on GFI1 mRNA
expression from OncoLnc were used to determine the effects of GFI1
expression levels on the survival of patients with ESCC.
Kaplan-Meier analysis with the log-rank test was used for the
survival analysis.
Clinical tissue samples
A total of 40 pairs of ESCC and adjacent normal
esophageal tissues from patients with ESCC, including 22 women and
18 men (mean age, 60 years; aged from 46-75 years old), who
received surgical treatment between March and December 2019, were
collected at The First Affiliated Hospital of Anhui Medical
University (Hefei, China) and were frozen in liquid nitrogen until
required for RNA and protein extraction. The tumors were staged
using the 8th edition of the American Joint Committee on Cancer
Tumor-Node-Metastasis staging system (18). Patients were recruited if they
had not received any radiotherapy or chemotherapy prior to surgery
and had provided signed informed consent prior to inclusion. The
present study was approved by the Ethics Committee of Anhui Medical
University (approval no. 20190356). In addition, after radical
esophagectomy, tumor tissues did not contain any necrotic area, and
adjacent normal tissues were resected at >5 cm from cancer
tissue. The clinicopathological characteristics of the patients are
summarized in Table I.
 | Table ISummary of patient
clinicopathological characteristics. |
Table I
Summary of patient
clinicopathological characteristics.
| Patient
characteristics | n |
|---|
| Sex | |
| Female | 22 |
| Male | 18 |
| Age, year | |
| <60 | 16 |
| ≥60 | 24 |
|
Differentiation | |
| Well/moderate | 29 |
| Poor | 11 |
| Invasion | |
| Absent | 14 |
| Present | 26 |
| Clinical
stagea | |
| Early (I-II) | 25 |
| Advanced
(III-IV) | 15 |
| Lymph node
metastasis | |
| Absent | 21 |
| Present | 19 |
Cell culture
Normal esophageal epithelial cells (SHEE10) were
obtained from The Cell Bank of Type Culture Collection of The
Chinese Academy of Sciences, and four human ESCC cell lines
(KYSE30, KYSE150, KYSE450 and KYSE510) were obtained from
DSMZ-German Collection of Microorganisms and Cell Cultures GmbH.
All cells were cultured in RPMI-1640 medium containing 10% FBS
(both Thermo Fisher Scientific, Inc.), streptomycin (100
µg/ml) and penicillin (100 IU/ml) at 37°C with 5%
CO2.
Cell transfection
KYSE30 and KYSE150 cells (3×10⁵
cells/well) were cultured in 6-well plates. The cells were
transfected with small interfering (si)RNA (30 nM) or control siRNA
(30 nM) using Lipofectamine® 2000 (Invitrogen; Thermo
Fisher Scientific, Inc.) according to the manufacturer's protocol.
After incubation at 37°C for 6 h, the culture medium was changed.
After transfection for 48 h, the knockdown efficiency was assessed
using reverse transcription-quantitative (RT-q) PCR and western
blotting. siRNA targeting GFI1 (siGFI1) and SOCS1 (siSOCS1) were
synthesized by GENERAL BIOL. The sequences of the siRNA were as
follows: GFI1-siRNA, 5′-GCU CGG AGU UUG AGG ACU U-3′; SOCS1-siRNA,
5′-GCA UCC GCG UGC ACU UUC AUU -3′; and control siRNA, 5′-UUC UCC
GAA CGU GUC ACG UTT -3′.
Cell counting kit-8 (CCK-8) and colony
formation assays
Cell proliferation was examined using CCK-8 and
colony formation assays. The CCK-8 assay was purchased from Dojindo
Molecular Technologies, Inc. KYSE30 and KYSE150 cells
(1×10³ cells/well) were seeded into 96-well plates
following transfection with siGFI1 or control siRNA for 48 h. CCK-8
solution (10 µl) was added to each well at 24, 48 or 72 h,
and the cells were further incubated at 37°C for 1.5 h.
Subsequently, the absorbance was measured at 450 nm using a
microplate spectrometer (Thermo Fisher Scientific, Inc.).
For the colony formation assay, KYSE30 and KYSE150
cells (2×10³ cells/well) were seeded in 6-well plates,
incubated overnight and subsequently transfected with siGFI1.
Following 14-day culture, the cells were fixed with 4% formaldehyde
at room temperature, washed three times with PBS and stained with
trypan blue for 10 min at room temperature. The number of colonies
(containing ≥50 cells) were counted using a light microscope
(magnification, ×200; Olympus Corporation).
Cell migration and wound healing
assay
For the cell migration assay, suspensions of
transfected KYSE30 and KYSE150 cells (1×10⁴ cells/well)
were re-suspended in FBS-free RPMI-1640 medium and added to the
upper chamber of a Transwell chamber (8-µm pore size;
Corning, Inc.). RPMI-1640 medium supplemented with 10% FBS (600
µl) was added to the lower chamber. Following culturing for
24 h at 37°C, the adherenT cells on the upper surface of the insert
membrane were removed using cotton swabs, and the migrated cells
were fixed with 4% formaldehyde at room temperature, washed three
times with PBS and stained with trypan blue as aforementioned. The
migratory cells were imaged and counted under a light microscope
(magnification, ×200; Olympus Corporation).
For the wound healing assay, 1×10⁶
transfected cells were seeded in 6-well plates for 48 h at 37°C.
The cell monolayer was scraped using a 200-µl pipette tip
when they reached 80-90% confluence, washed three times with PBS,
and 2 ml RPMI-1640 medium without FBS was added. The wound width
was measured by capturing images under a microscope (magnification,
×200; Olympus Corporation) at 0 and 24 h.
RT-qPCR
Total RNA was isolated from clinical samples and
cells using TRIzol® reagent (Invitrogen; Thermo Fisher
Scientific, Inc.) and reverse-transcribed into cDNA using a
HiScript III 1st Strand cDNA Synthesis kit (Vazyme Biotech Co.,
Ltd.) according to the manufacturer's protocol. qPCR was performed
using LightCycler® FastStart DNA Master SYBR®
Green I (Roche Diagnostics GmbH) on a light Cycler 96 (Roche
Diagnostics GmbH), according to the manufacturer's instructions.
The thermocycling conditions were as follows: Initial denaturation
at 95°C for 30 sec, following by 40 cycles of denaturation at 95°C
for 10 sec, annealing and elongation 60°C for 60 sec. GAPDH served
as an internal control for gene expression, and the relative
expression level was calculated using the 2−ΔΔCq method
(19). The sequences of the
primers used are listed in Table
II.
| Table IIPrimer sequences used for reverse
transcription-quantitative PCR. |
Table II
Primer sequences used for reverse
transcription-quantitative PCR.
| Gene | Direction | Sequence
(5′-3′) |
|---|
| GFI1 | Forward |
GCAAGGCATTCAGCCAGAG |
| Reverse |
AAGGCAAAGGAGGAGCAA |
| SOCS1 | Forward |
TTCGCCCTTAGCGTGAAGAT |
| Reverse |
GCTCGAAGAGGCAGTCGAA |
| Cyclin D1 | Forward |
TGACCCCGCACGATTTCATT |
| Reverse C |
AGAGGGCAACGAAGGTCTG |
| Survivin | Forward |
TTTTGATTCCCGGGCTTACCA |
| Reverse |
ACATTCACTGTGGAAGGCTCT |
| N-cadherin | Forward CC |
TGAGGGATCAAAGCCTGG |
| Reverse |
ACATGTTGGGTGAAGGGGTG |
| E-cadherin | Forward |
AATTCCTGCCATTCTGGGGA |
| Reverse |
GGGCAGTAAGGGCTCTTTGA |
| Vimentin | Forward |
GTTTCCAAGCCTGACCTCAC |
| Reverse |
GTCATTGTTCCGGTTGGCAG |
| SOCS1 | Forward |
TTCGCCCTTAGCGTGAAGATGG |
| Reverse |
TAGTGCTCCAGCAGCTCGAAGA |
| GAPDH | Forward |
GTCTCCTCTGACTTCAACAGCG |
| Reverse |
ACCACCCTGTTGCTGTAGCCAA |
Western blotting assay
Total protein was extracted from cells or tissues
using RIPA lysis buffer (Beyotime Institute of Biotechnology), and
the protein concentration was determined using a BCA protein assay
kit (Beyotime Institute of Biotechnology). Total protein (50
µg) was resolved using 10% SDS-PAGE and transferred to
nitrocellulose membranes (Bio-Rad Laboratories, Inc.). The
membranes were blocked with 5% non-fat milk for 1.5 h at room
temperature, incubated with primary antibodies at 4°C overnight.
The membranes were washed three times with PBST and then incubated
with HRP-conjugated goat anti-mouse IgG (1:2,000; cat. no.
SA00001-1; ProteinTech Group, Inc.) and goat anti-rabbit IgG
(1:2,000; cat. no. 511203; Chengdu Zen Bioscience Co., Ltd.)
secondary antibodies for 1 h at room temperature. Protein bands
were visualized using an enhanced chemiluminescence detection
system (Beyotime Institute of Biotechnology), and densitometry
analysis was performed using ImageJ (v1.8.0, National Institutes of
Health). Rabbit polyclonal antibodies against P65 (1:1,000; cat.
no. 10745-1-AP) and mouse monoclonal antibodies against GAPDH
(1:1,000; cat. no. 60004-1-Ig) were purchased from ProteinTech
Group, Inc. Rabbit polyclonal antibodies against SOCS1 (1:1,000;
cat. no. ab62584) and GFI1 (1:1,000; cat. no. ab21061) were
obtained from Abcam. Rabbit polyclonal antibodies against
phosphorylated (p)-p65 (1:1,000; cat. no. 310012) were obtained
from Chengdu Zen Bioscience Co., Ltd. Rabbit monoclonal antibodies
against STAT3 (1:1,000; cat. no. 4904S) and p-STAT3 (1:1,000; cat.
no. 4113S) were purchased from Cell Signaling Technology, Inc.
Immunohistochemistry (IHC)
ESCC and paired normal tissues were embedded in
paraffin, fixed in 4% paraformaldehyde at room temperature for 2
days and cut into 5-µm sections for IHC analysis. IHC
staining was performed by Wuhan Servicebio Technology Co., Ltd. The
sections were examined, and images were captured using a microscope
(magnification, ×200; Olympus Corporation) in five random fields of
view per sample.
Luciferase reporter assay
KYSE30 and KYSE150 cells (2×10⁵/well)
were seeded and cultured in 12-well plates overnight and
co-transfected with an NF-κB reporter plasmid (1 µg/well;
cat. no. D2206; Beyotime Institute of Biotechnology) and siGFI1 (30
nM), siSOCS1 (30 nM) or siCtrl (30 nM) using
Lipofectamine® 2000 according to the manufacturer's
instructions. After incubation at 37°C for 6 h, the culture medium
was changed. At 48 h post-transfection, cell samples were lysed
using Firefly Luciferase Reporter Gene Assay Cell Lysis Buffer
(cat. no. RG126S; Beyotime Institute of Biotechnology). After brief
centrifugation at 13,778 × g for 20 min, 10 µl aliquot of
the supernatant was assayed using a Luciferase Assay kit (Promega
Corporation), and the same amount of supernatant was used to
measure the concentration of total protein using a BCA protein
assay (cat. no. P0012S; Beyotime Institute of Biotechnology). The
luciferase activity was normalized against the concentration of
total protein.
Statistical analysis
All experiments were performed in triplicate.
Statistical analysis was performed using GraphPad Prism 8 (GraphPad
Software, Inc.), and data are presented as the mean ± SEM.
Statistical differences between groups were compared using a paired
or unpaired Student's t-test as appropriate, a one-way ANOVA with
Tukey's post hoc test. P<0.05 was considered to indicate a
statistically significant difference.
Results
GFI1 expression is upregulated in ESCC
tissues
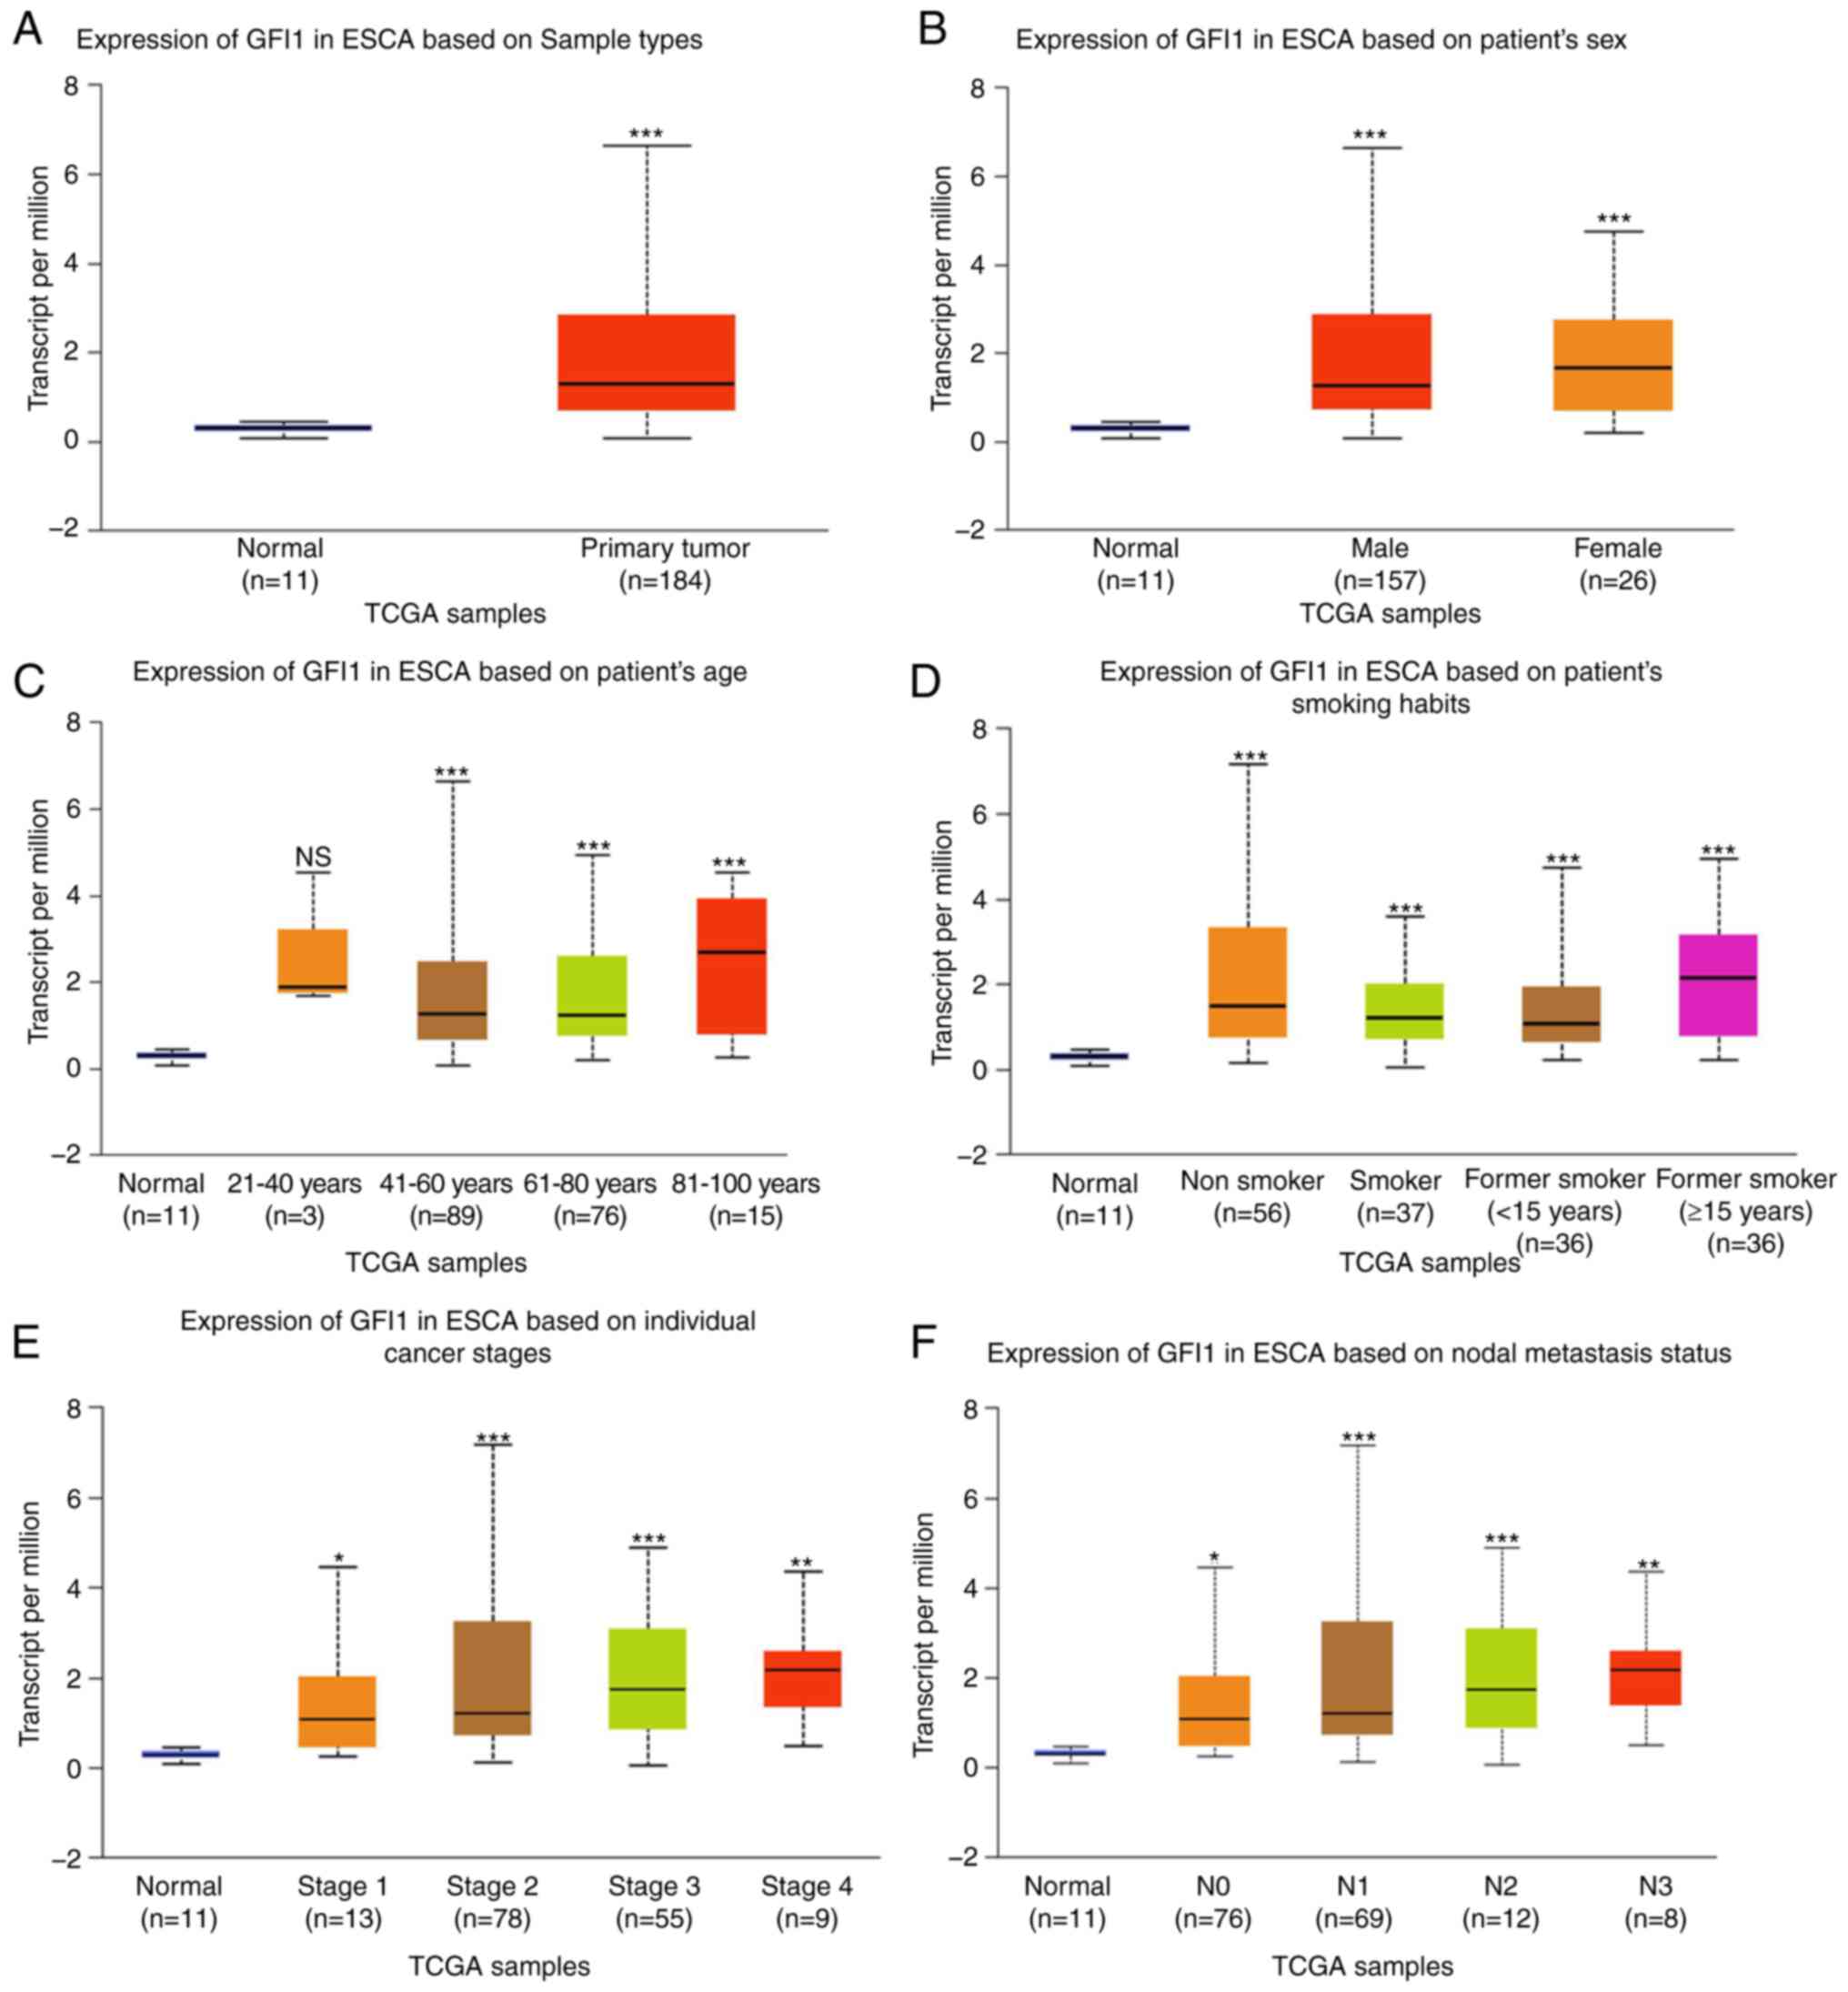
The expression levels of GFI1 in ESCA were analyzed
using data obtained from TCGA using the UALCAN platform. As
presented in Fig. 1A, GFI1
expression levels were significantly upregulated in ESCA tissues
compared with those in normal tissues. Furthermore, a statistically
significant association between the mRNA levels of GFI1 and the
clinicopathological features of ESCA were observed based on the
UALCAN platform. GFI1 mRNA expression levels were increased in ESCA
regardless of sex, patient age (20-40, 41-60, 61-80 and 81-100
years old), smoking status [non-smoker, smoker, short-term former
smoker (<15 years) and long-term former smoker (≥15 years)],
cancer stages (S1-4) and nodal metastasis status (N0-4) compared
with those in normal tissues (Fig.
1B-F). These results suggested that GFI1 was upregulated in
ESCA and may affect ESCA progression.
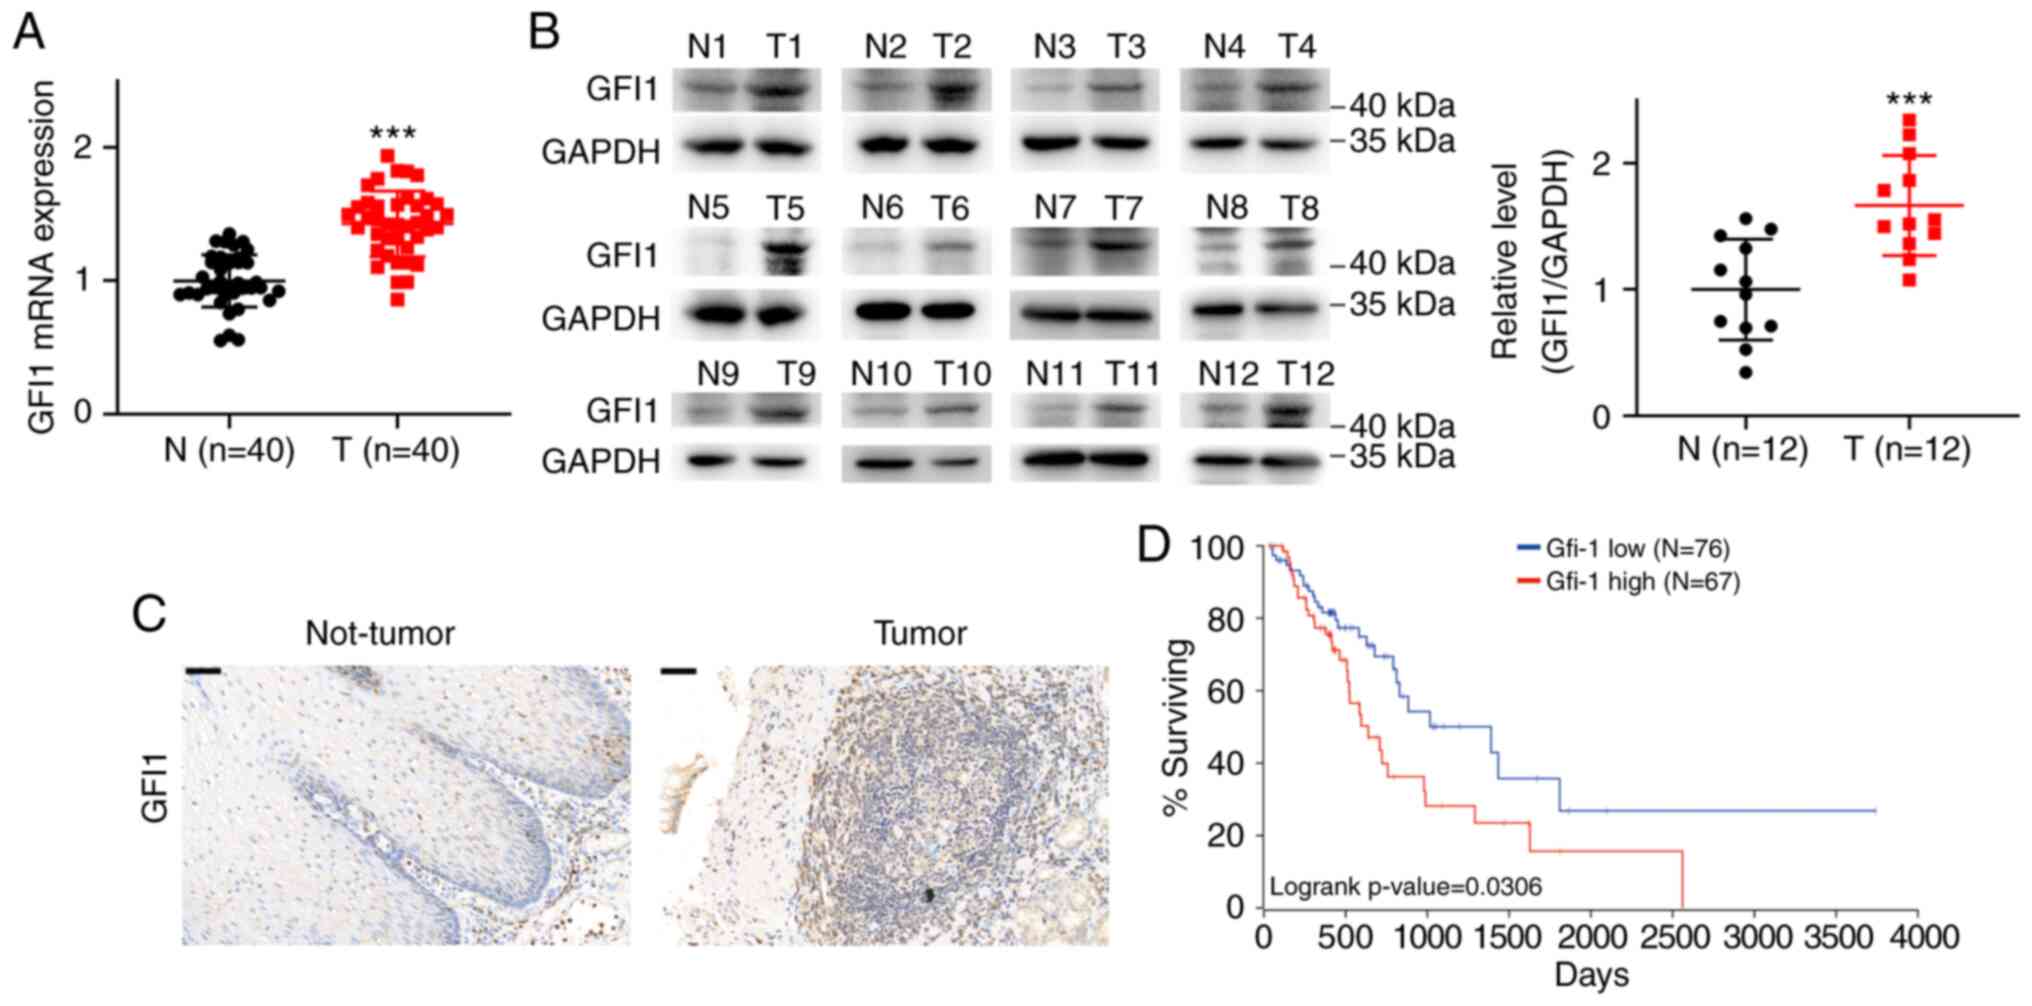
Next, the potential functions of GFI1 in ESCC were
explored in the present study. The mRNA expression levels of GFI1
in 40 pairs of ESCC and adjacent normal tissues were assessed using
RT-qPCR. The results demonstrated that the mRNA levels of GFI1 were
increased in ESCC tissues compared with those in the normal
adjacent tissues (Fig. 2A).
Western blotting also revealed that GFI1 protein levels were
significantly upregulated in ESCC compared with those in normal
tissues (Fig. 2B). Similar to
the results of western blotting, IHC analysis of samples from ESCC
and matched adjacent tissues demonstrated that high GFI1 expression
was observed in ESCC tissues (Fig.
2C). Kaplan-Meier survival analysis using the OncoLnc online
tool suggested that patients with ESCA that exhibited higher than
the median expression levels of GFI1 had shorter overall survival
times compared with those observed in patients with low GFI1 levels
(Fig. 2D).
Together, these results indicated that GFI1 was
upregulated in ESCC tissues and associated with a poor prognosis,
suggesting that GFI1 may promote the progression of ESCC.
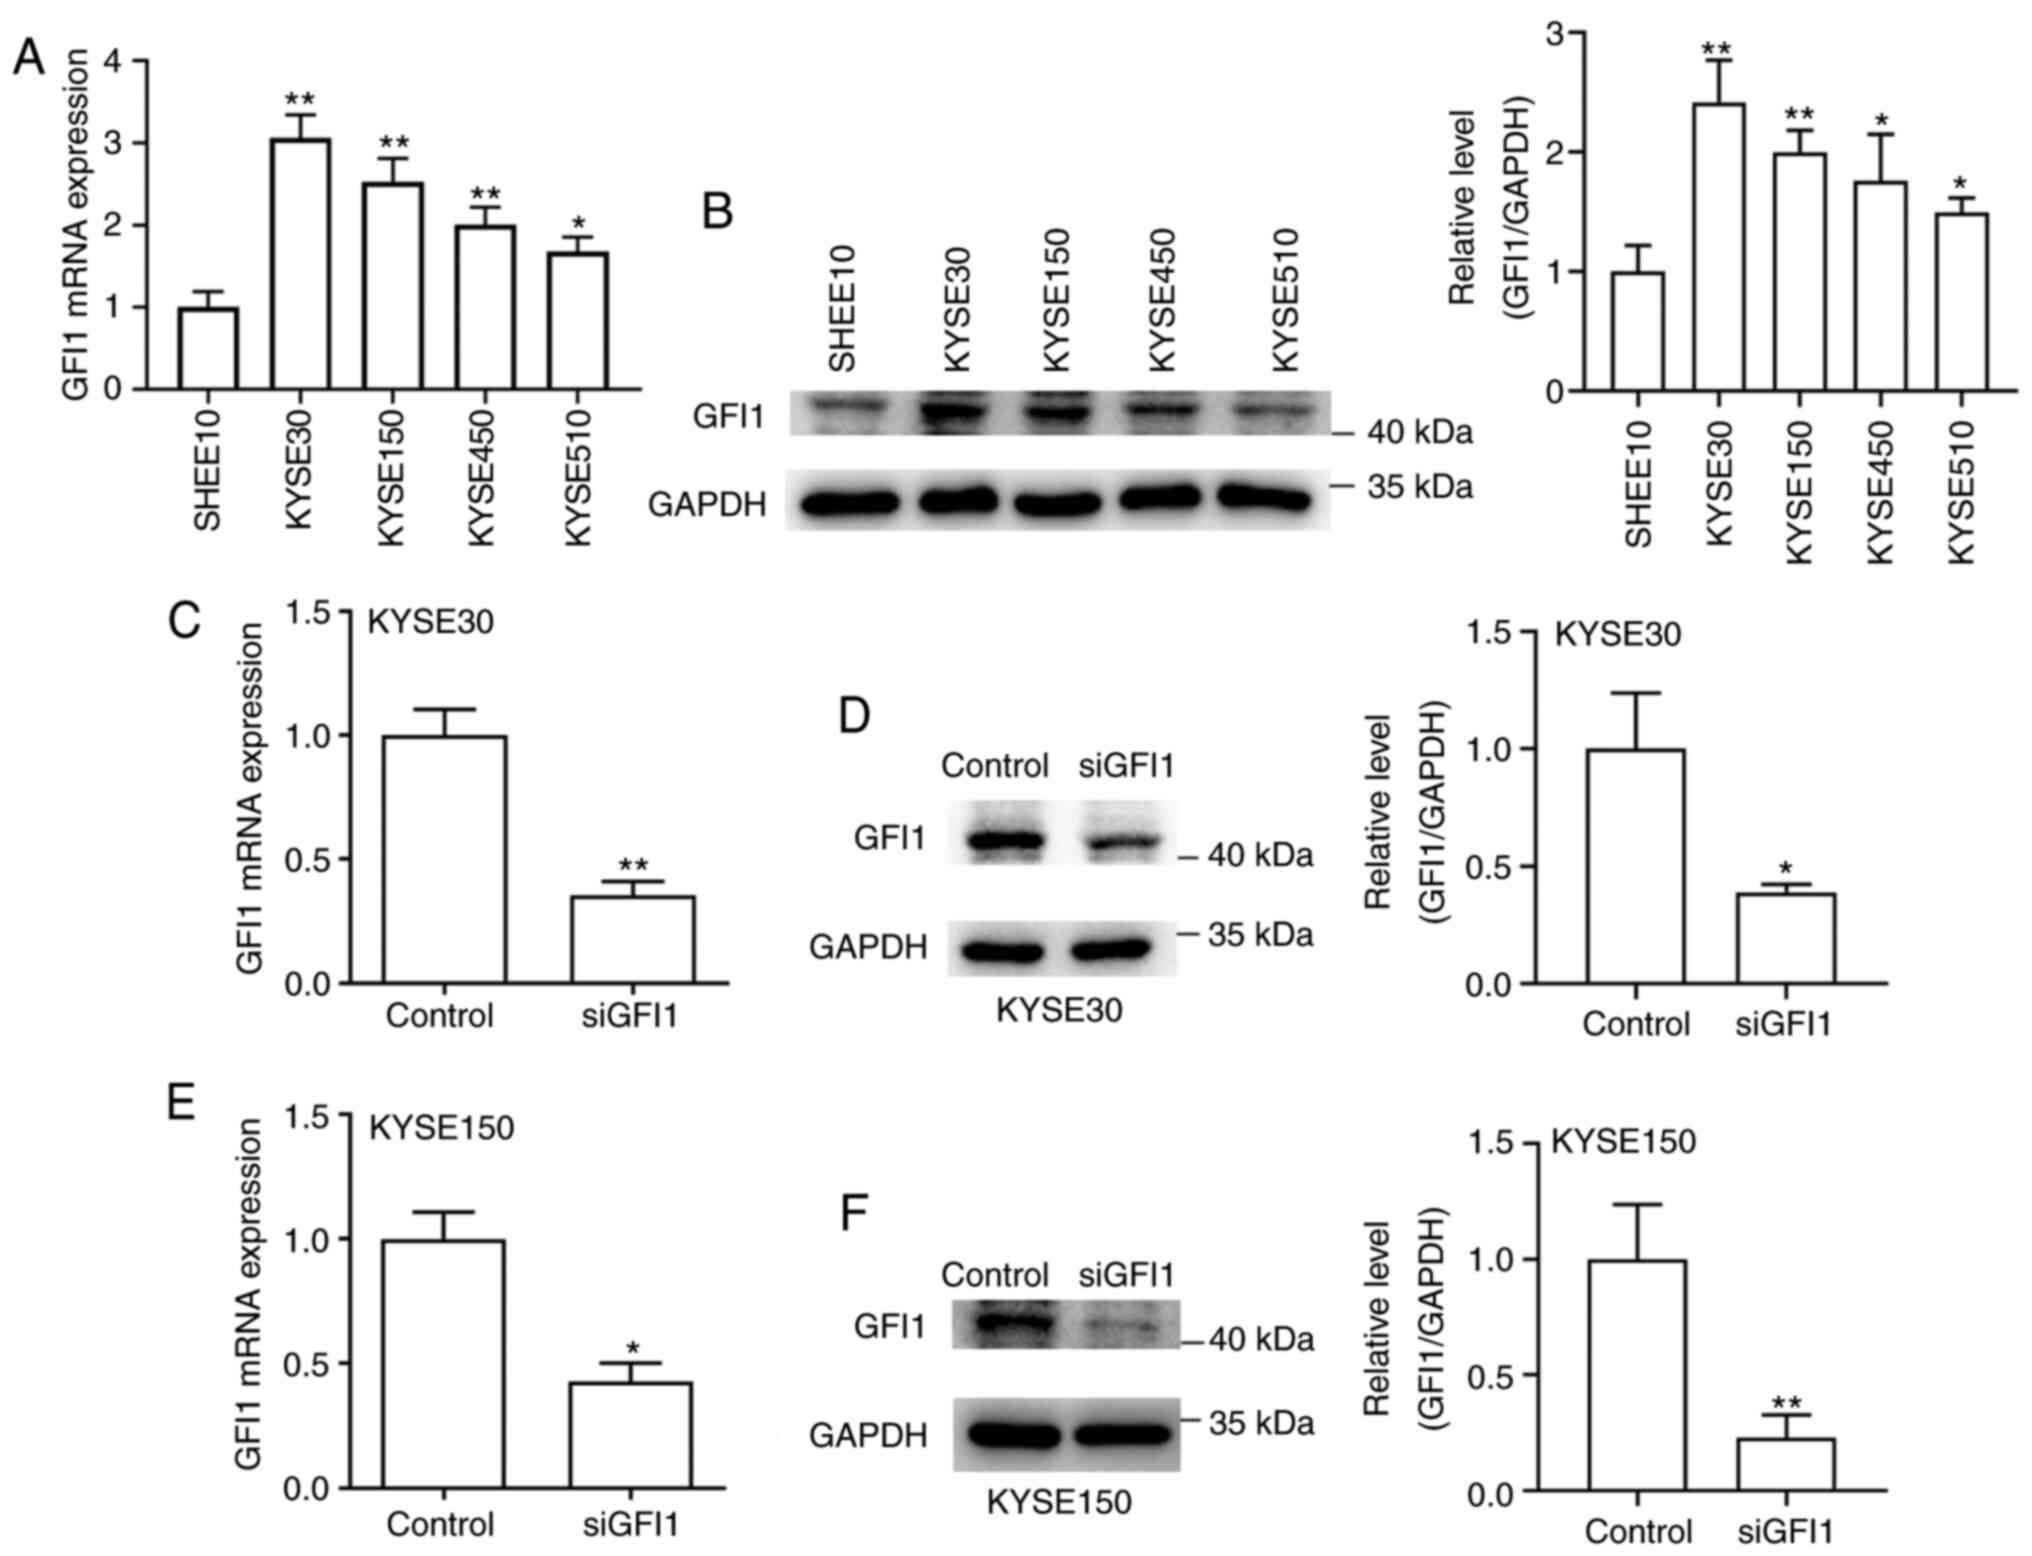
GFI1 is highly expressed in ESCC cell
lines and is knocked down by siRNA
The expression levels of GFI1 in SHEE10 and four
ESCC cell lines (KYSE30, KYSE150, KYSE450 and KYSE510) were
assessed, and the results demonstrated that the mRNA and protein
levels of GFI1 were significantly increased in ESCC cells compared
with those in the normal esophageal cell line (Fig. 3A and B). Subsequently, KYSE30 and
KYSE150 cells, which exhibited the highest levels of endogenous
GFI1 expression, were transfected with siGFI1. As presented in
Fig. 3C-F, both cell lines
transfected with siGFI1 exhibited lower GFI1 mRNA and protein
expression levels compared with those in the control group. Thus,
KYSE30 and KYSE150 cells were both successfully transfected.
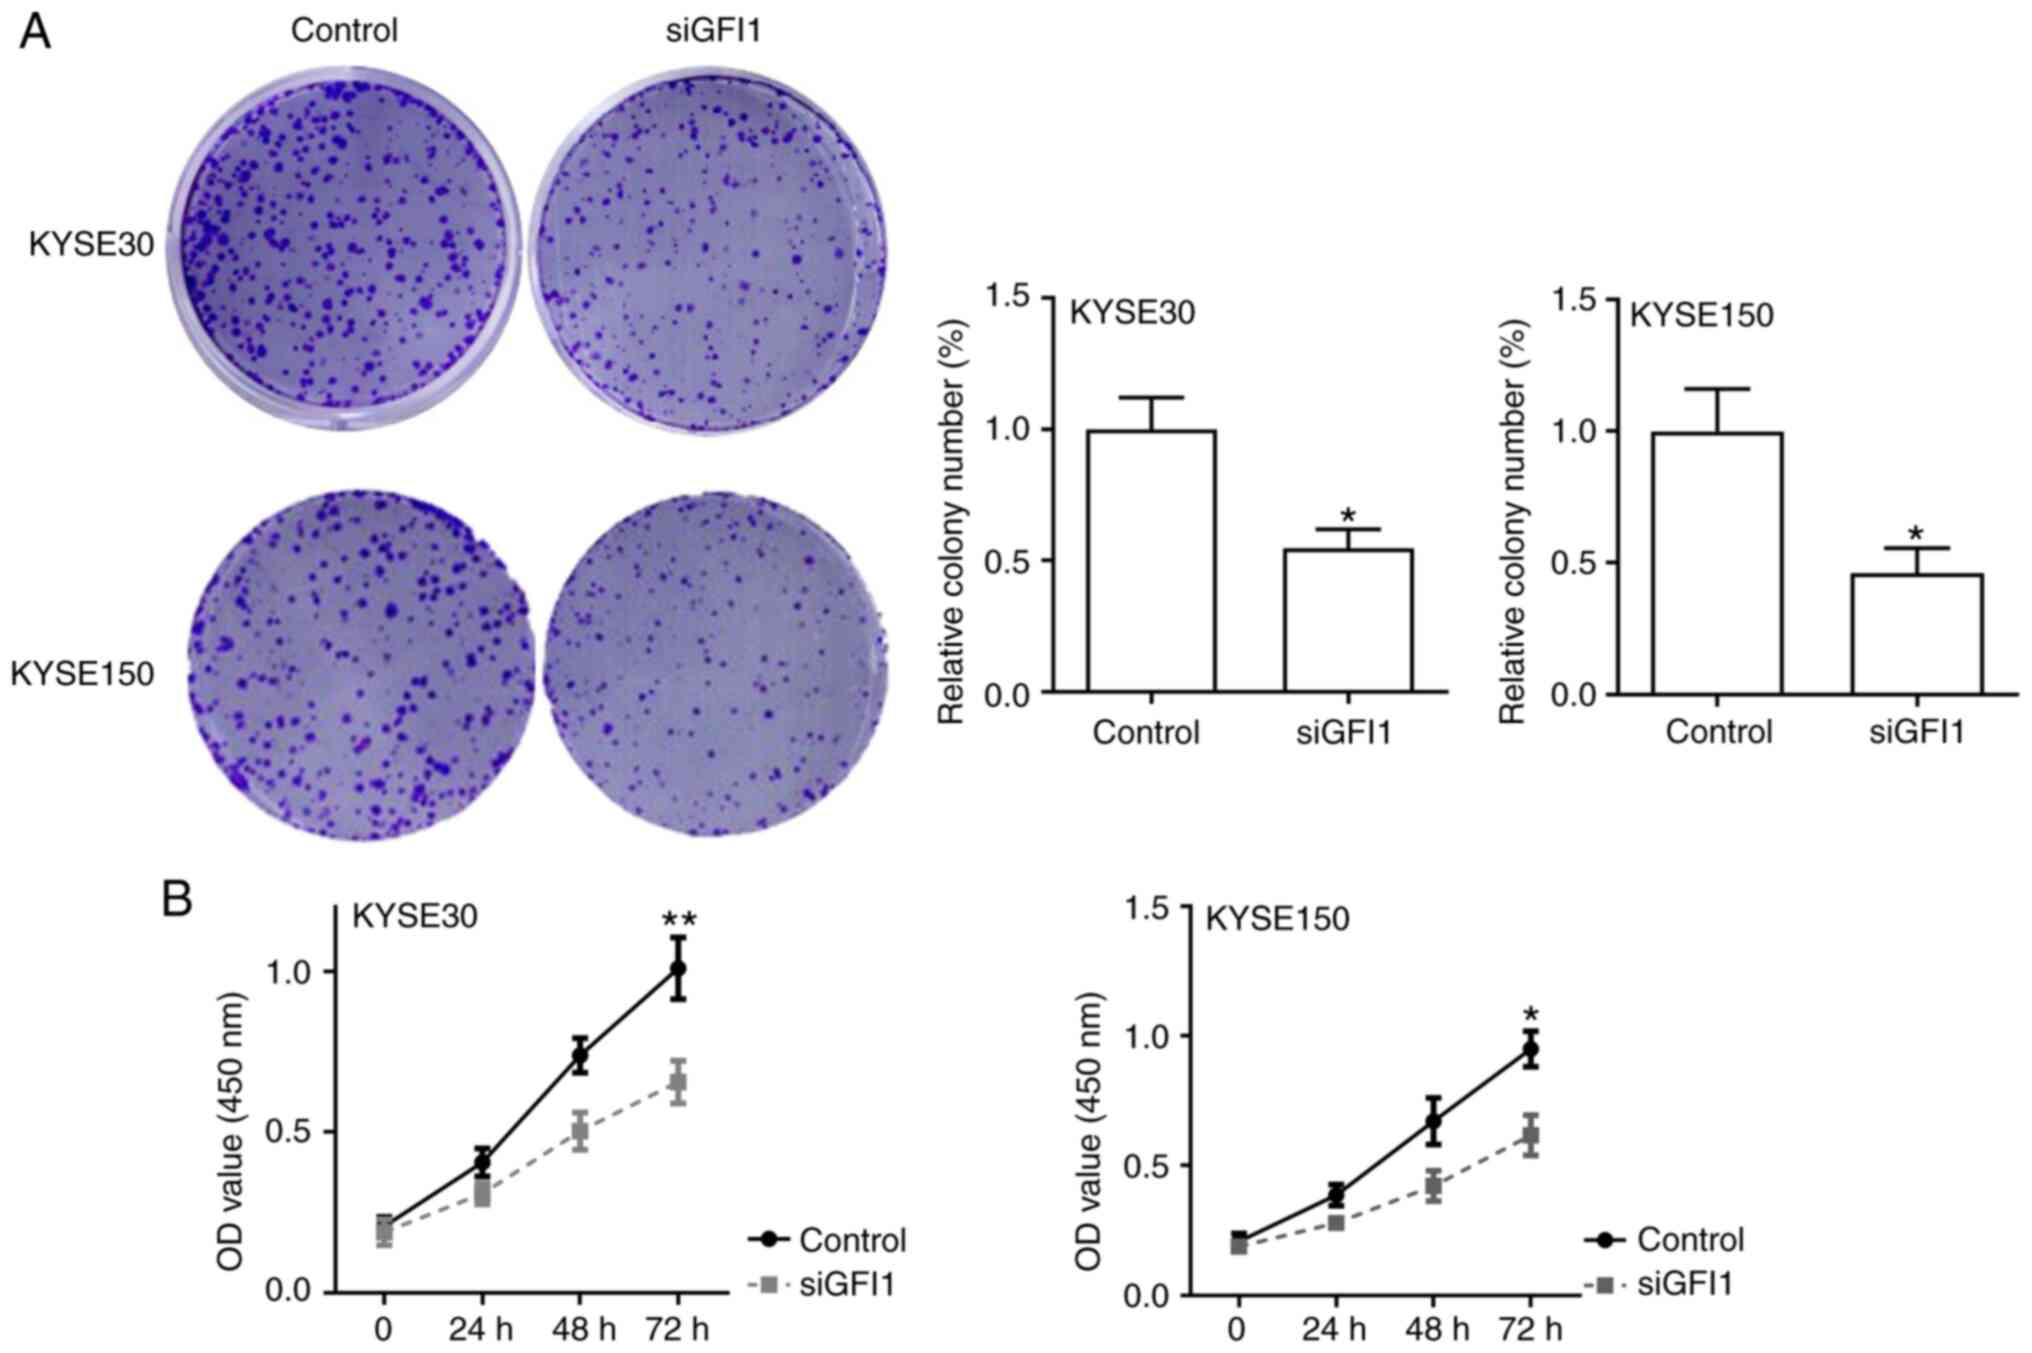
GFI1 knockdown suppresses the
proliferation of ESCC cells
The effects of GFI1 on cell proliferation in
vitro were next assessed. The results of colony formation and
CCK-8 assays demonstrated that GFI1 knockdown significantly reduced
the proliferative rates of KYSE30 and KYSE150 cells compared with
those of the control cells (Fig. 4A
and B). In addition, the expression levels of the cell
cycle-associated genes cyclin D1 and survivin were assessed using
RT-qPCR. As presented in Fig.
S1A, knockdown of GFI1 significantly downregulated the levels
of cyclin D1 and survivin in both cell lines compared with those in
the respective control groups. These results suggested that GFI1
promoted ESCC cell proliferation.
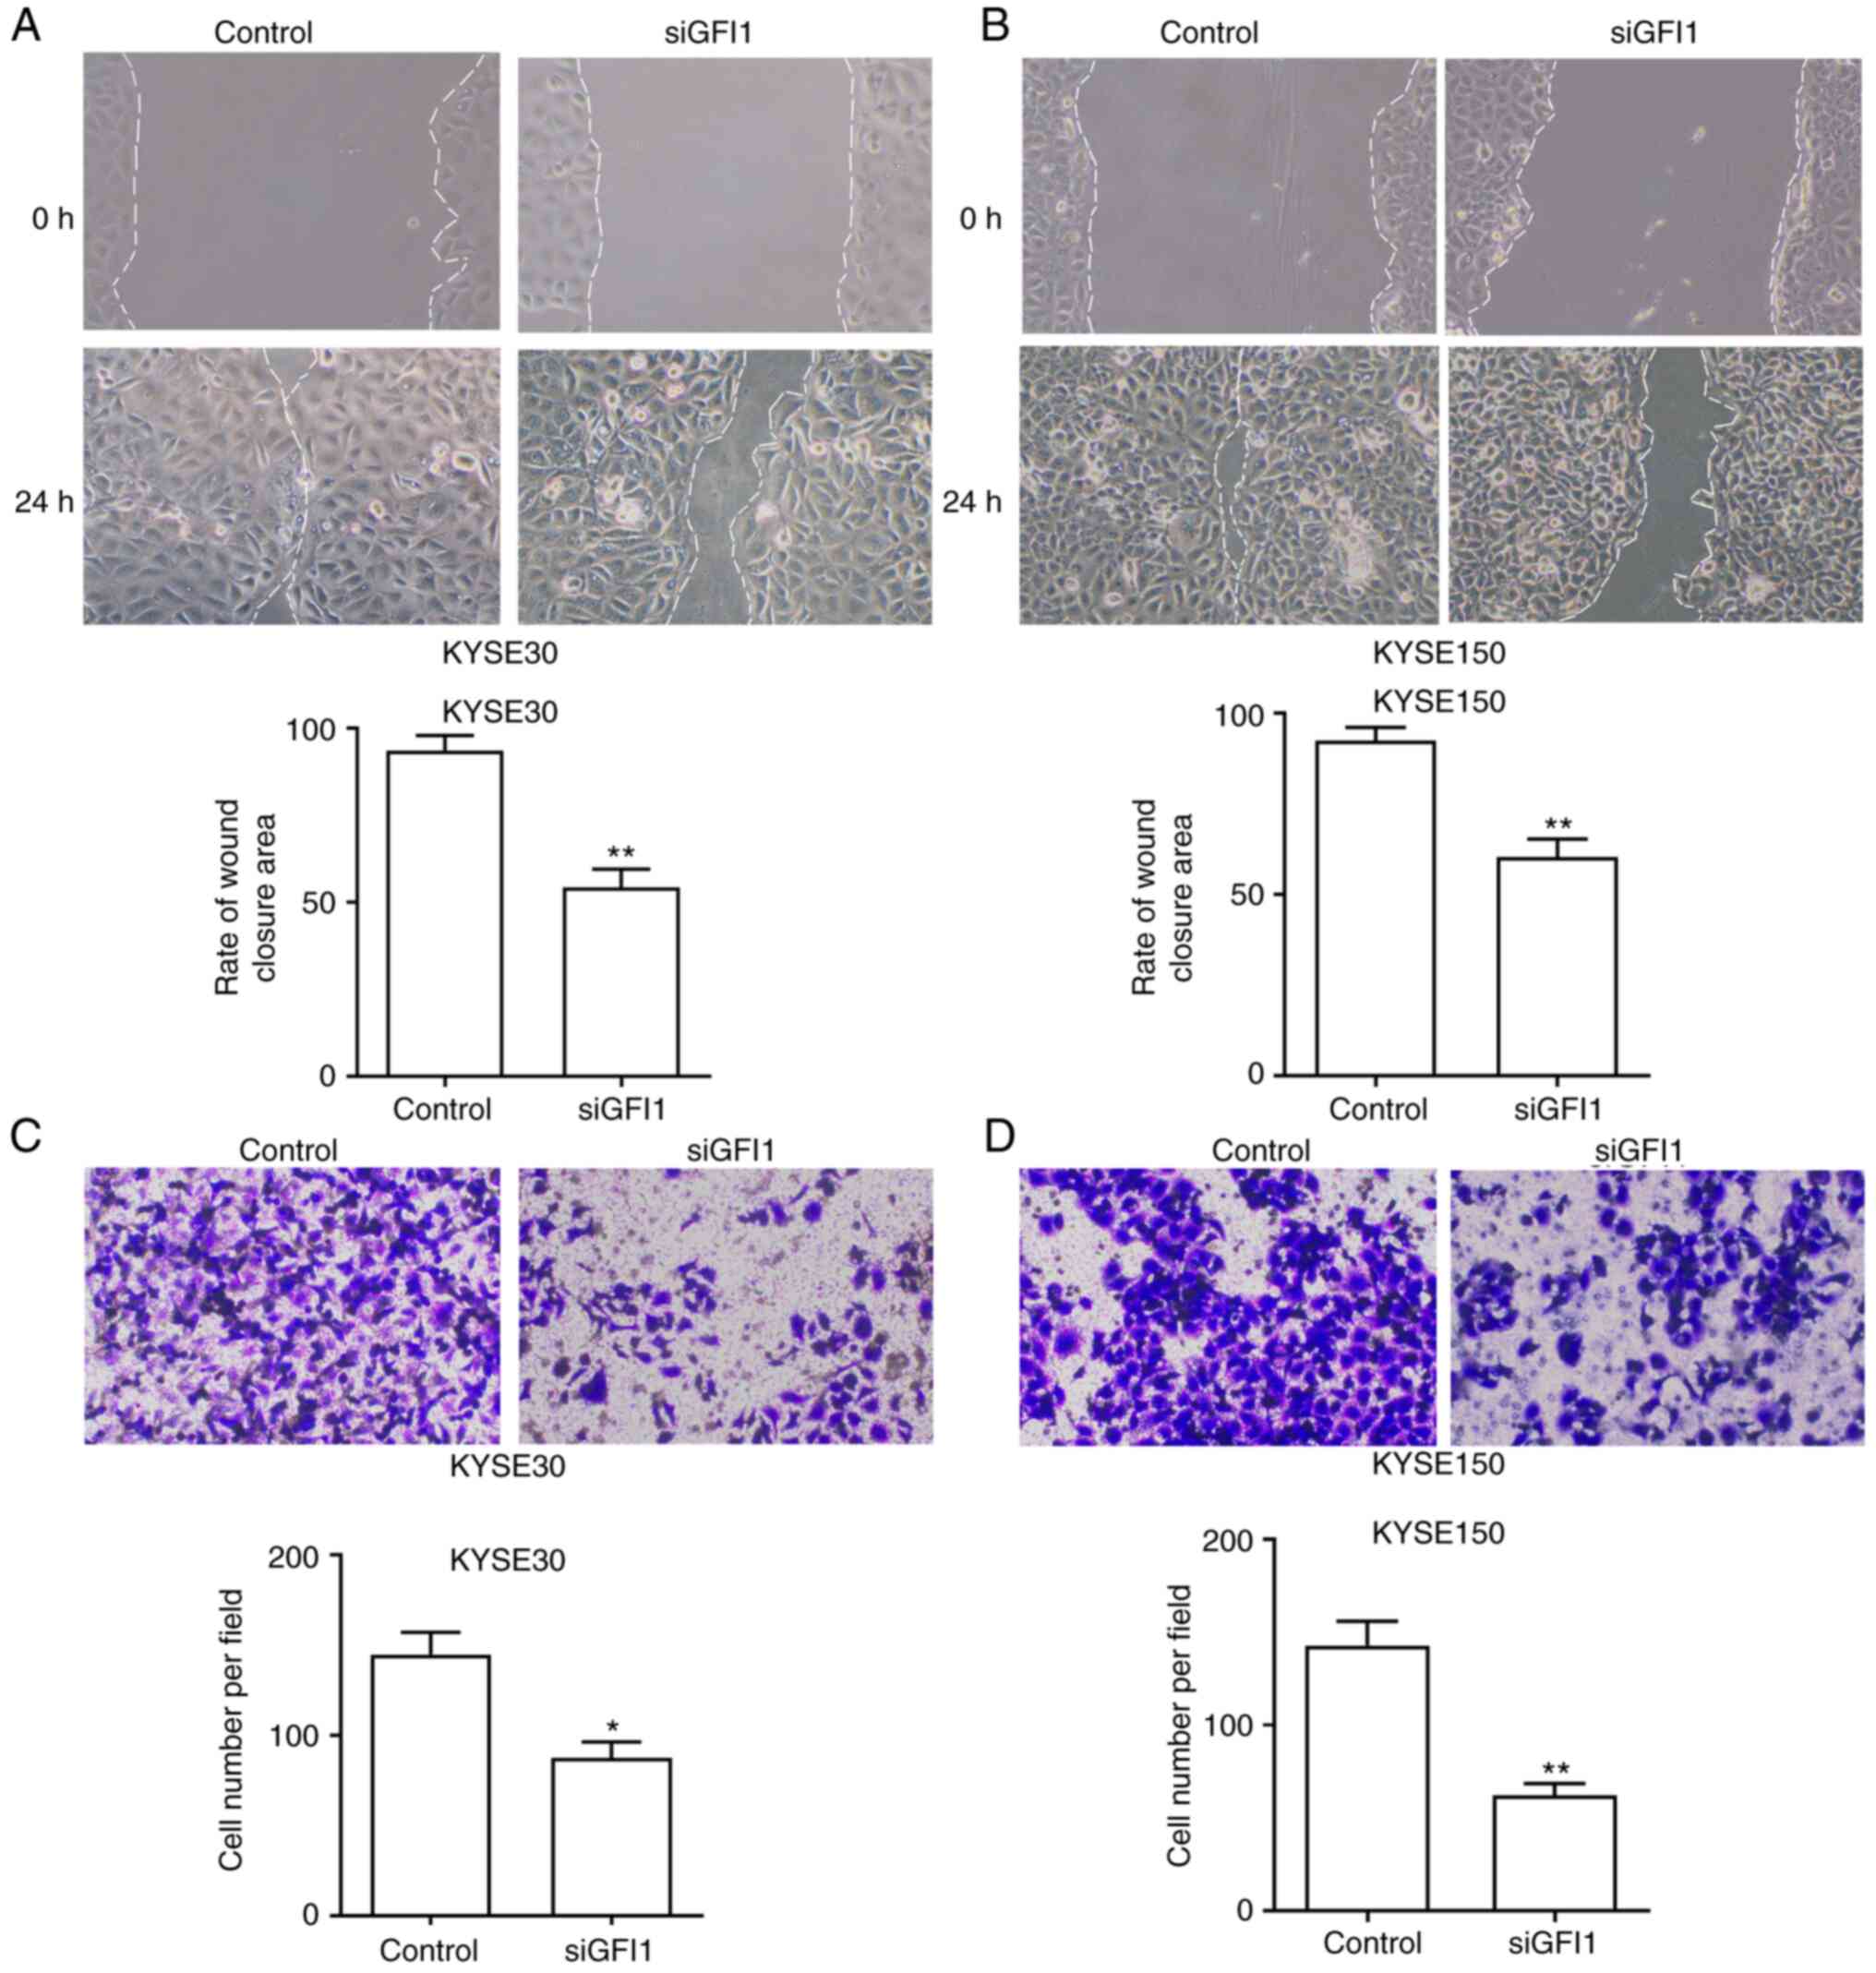
GFI1 knockdown reduces the migration of
ESCC cells
To investigate the function of GFI1 on ESCC cell
migratory ability, wound healing and Transwell assays were
performed. The wound healing assay results demonstrated that the
tumor cell migration was significantly reduced in both cell lines
transfected with siGFI1 compared with that in the control cells
(Fig. 5A and B). In the
Transwell assays, the number of cells that had migrated through the
membrane was reduced in KYSE30 and KYSE150 cells transfected with
siGFI1 compared with those in the respective control groups
(Fig. 5C and D). In addition,
the expression levels of epithelial and mesenchymal markers
E-cadherin, N-cadherin and vimentin in KYSE30 and KYSE150 cell
lines treated with siGFI1 were determined. As demonstrated in
Fig. S1B, the mRNA expression
levels of E-cadherin were increased, and the levels of N-cadherin
and Vimentin were reduced compared with those in the control cells.
Together, these results indicated that GFI1 promoted ESCC cell
migration and may induce the EMT progression.
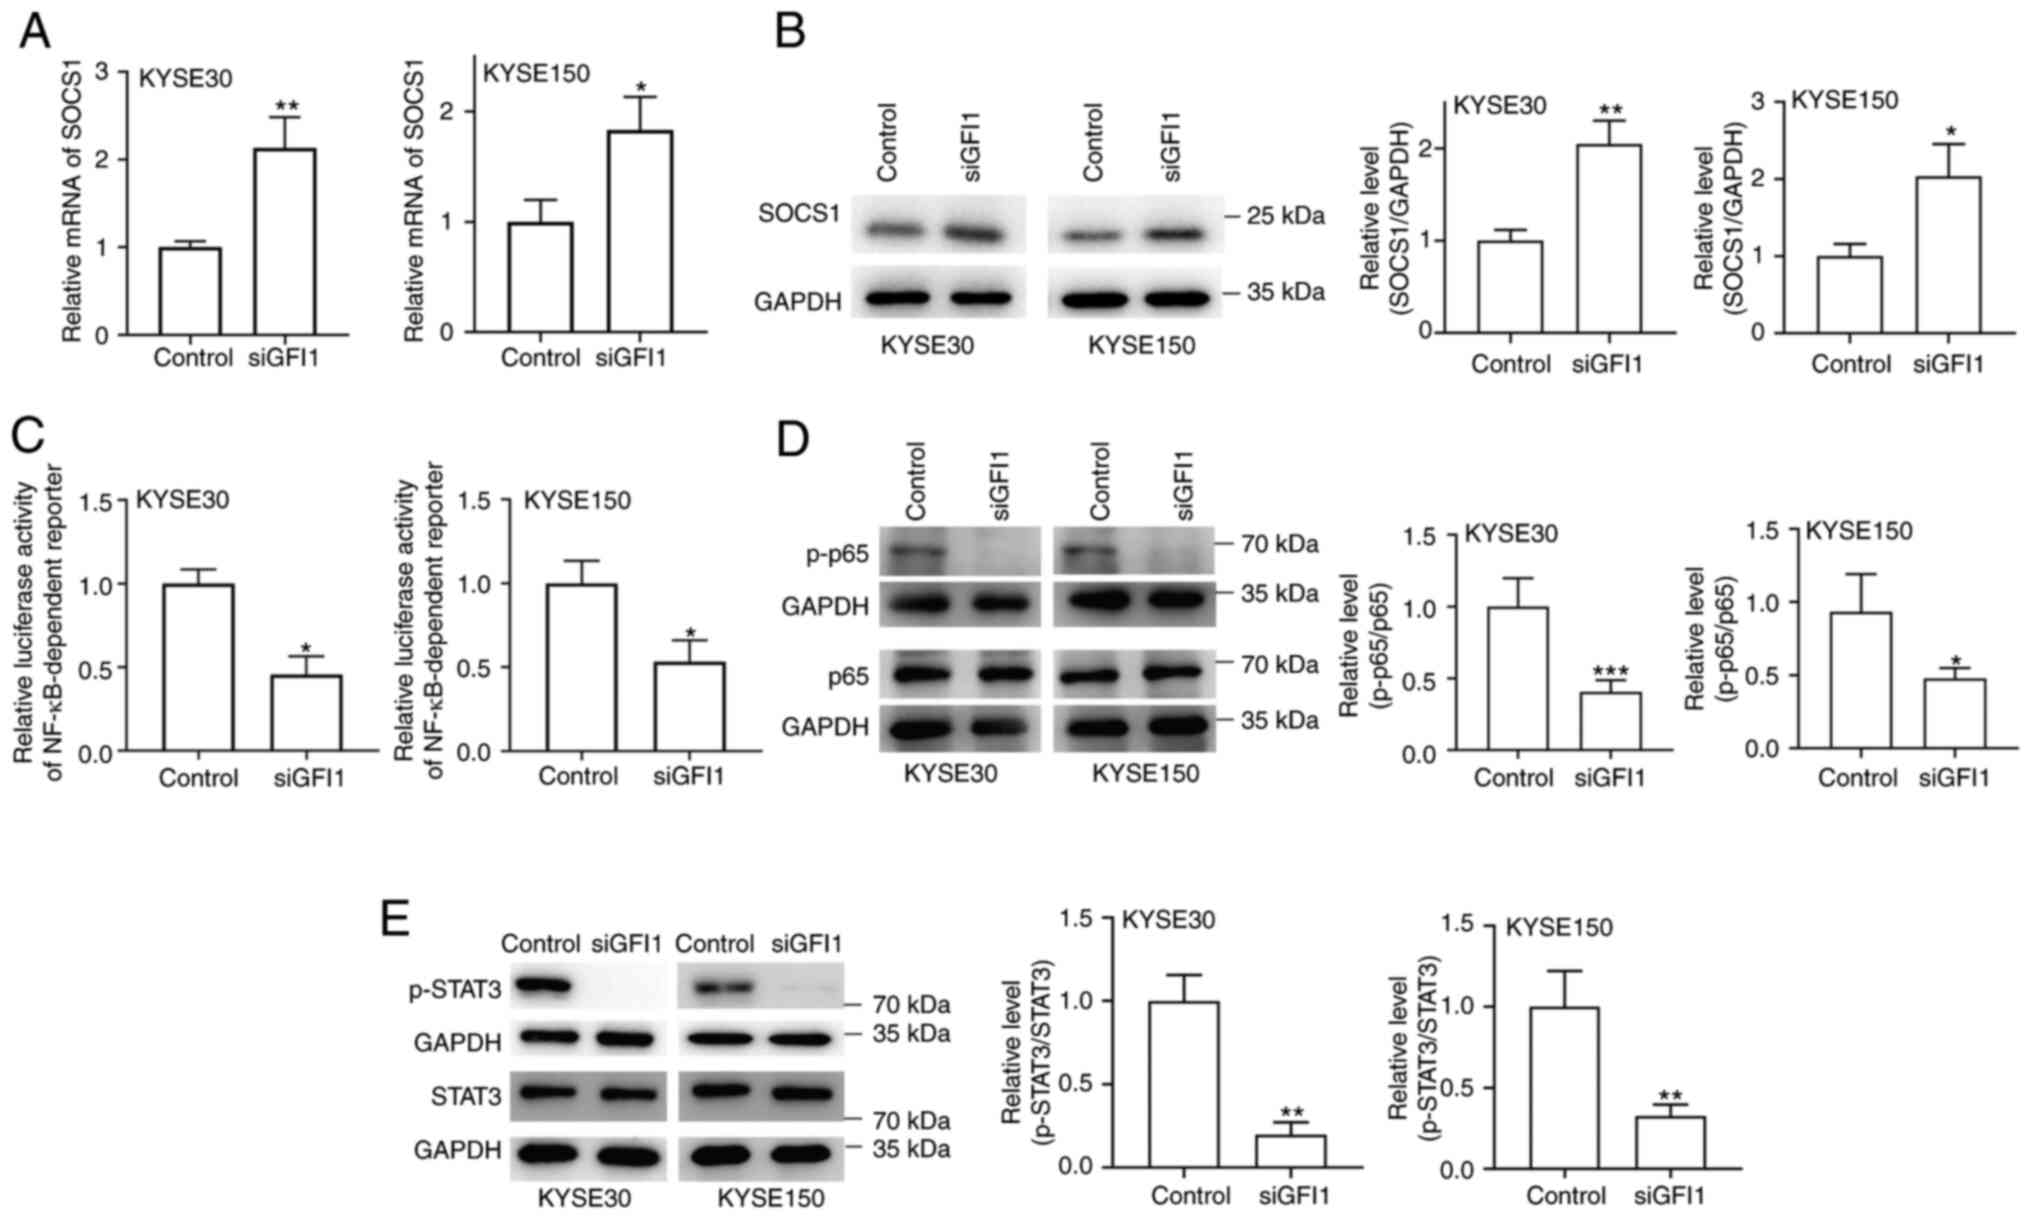
GFI1 knockdown inhibits STAT3 and NF-κB
signaling via upregulation of SOCS1 expression
Whether GFI1 regulated the STAT3 and NF-κB signaling
pathways by inhibiting SOCS1 expression in ESCC cell lines was
determined in the present study. As demonstrated in Fig. 6A and B, GFI1 knockdown in KYSE30
and KYSE150 cells increased SOCS1 mRNA and protein levels compared
with those in the control cells. Additionally, NF-κB activity was
reduced in both cell lines following knockdown of GFI1 compared
with that in the control groups (Fig. 6C). When the NF-κB signaling
pathway is activated, p65 is rapidly phosphorylated and
translocates to the nucleus (20); when GFI1 expression was knocked
down in KYSE30 and KYSE150 cells, the levels of p-p65 were notably
decreased compared with those in the control cells (Fig. 6D). In addition, as presented in
Fig. 6E, knockdown of GFI1
inhibited STAT3 phosphorylation in both cell lines.
To analyze whether SOCS1 inhibition was required for
the GFI1-mediated increases in the proliferative and migratory
capacities of ESCC cells, the present study transfected siSOCS1
into KYSE30 and KYSE150 cells. The transfection efficiency was
confirmed by RT-qPCR and Western blotting analyses, and the results
demonstrated that both cell lines transfected with siSOCS1
exhibited lower SOCS1 mRNA and protein expression levels compared
with those in the control groups (Fig. S2A-D). Subsequently, SOCS1
expression was knocked down in ESCC cells following GFI1 knockdown.
Colony formation and Transwell migration assay results revealed
that knockdown of SOCS1 compensated for the loss of proliferation
and migration induced by GFI1 knockdown (Fig. 7A and B). In addition, SOCS1
knockdown attenuated the reduction in NF-κB activity and the
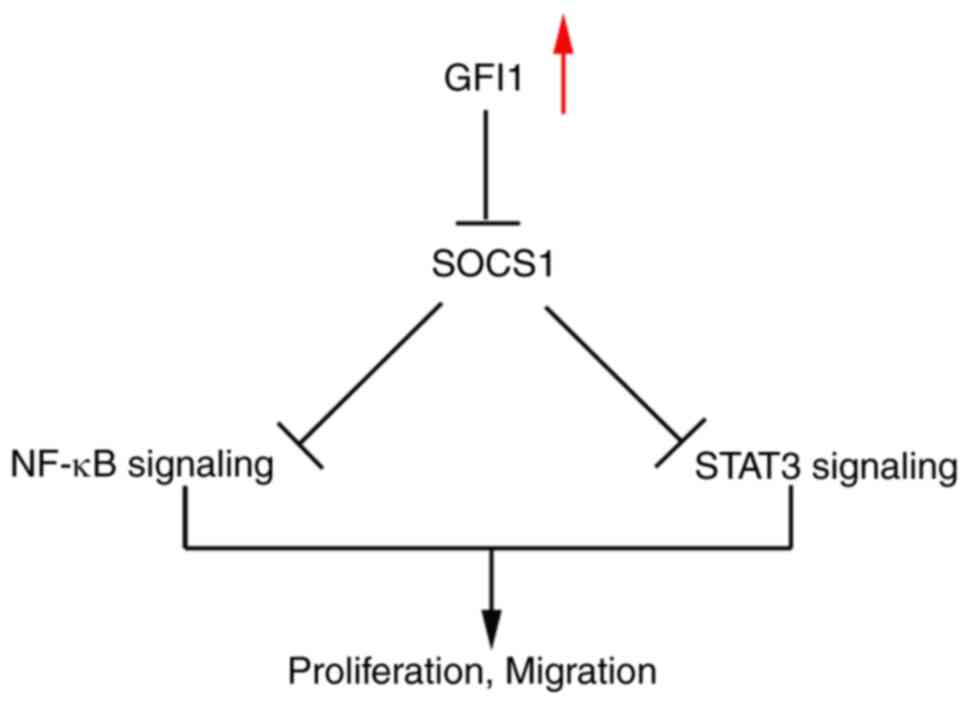
reduction in p-p65 and p-STAT3 levels (Fig. 7C-H). Taken together, these
results demonstrated that GFI1 may promote ESCC cell proliferation
via inhibiting SOCS1 expression and enhancing NF-κB and STAT5
activity (Fig. 8).
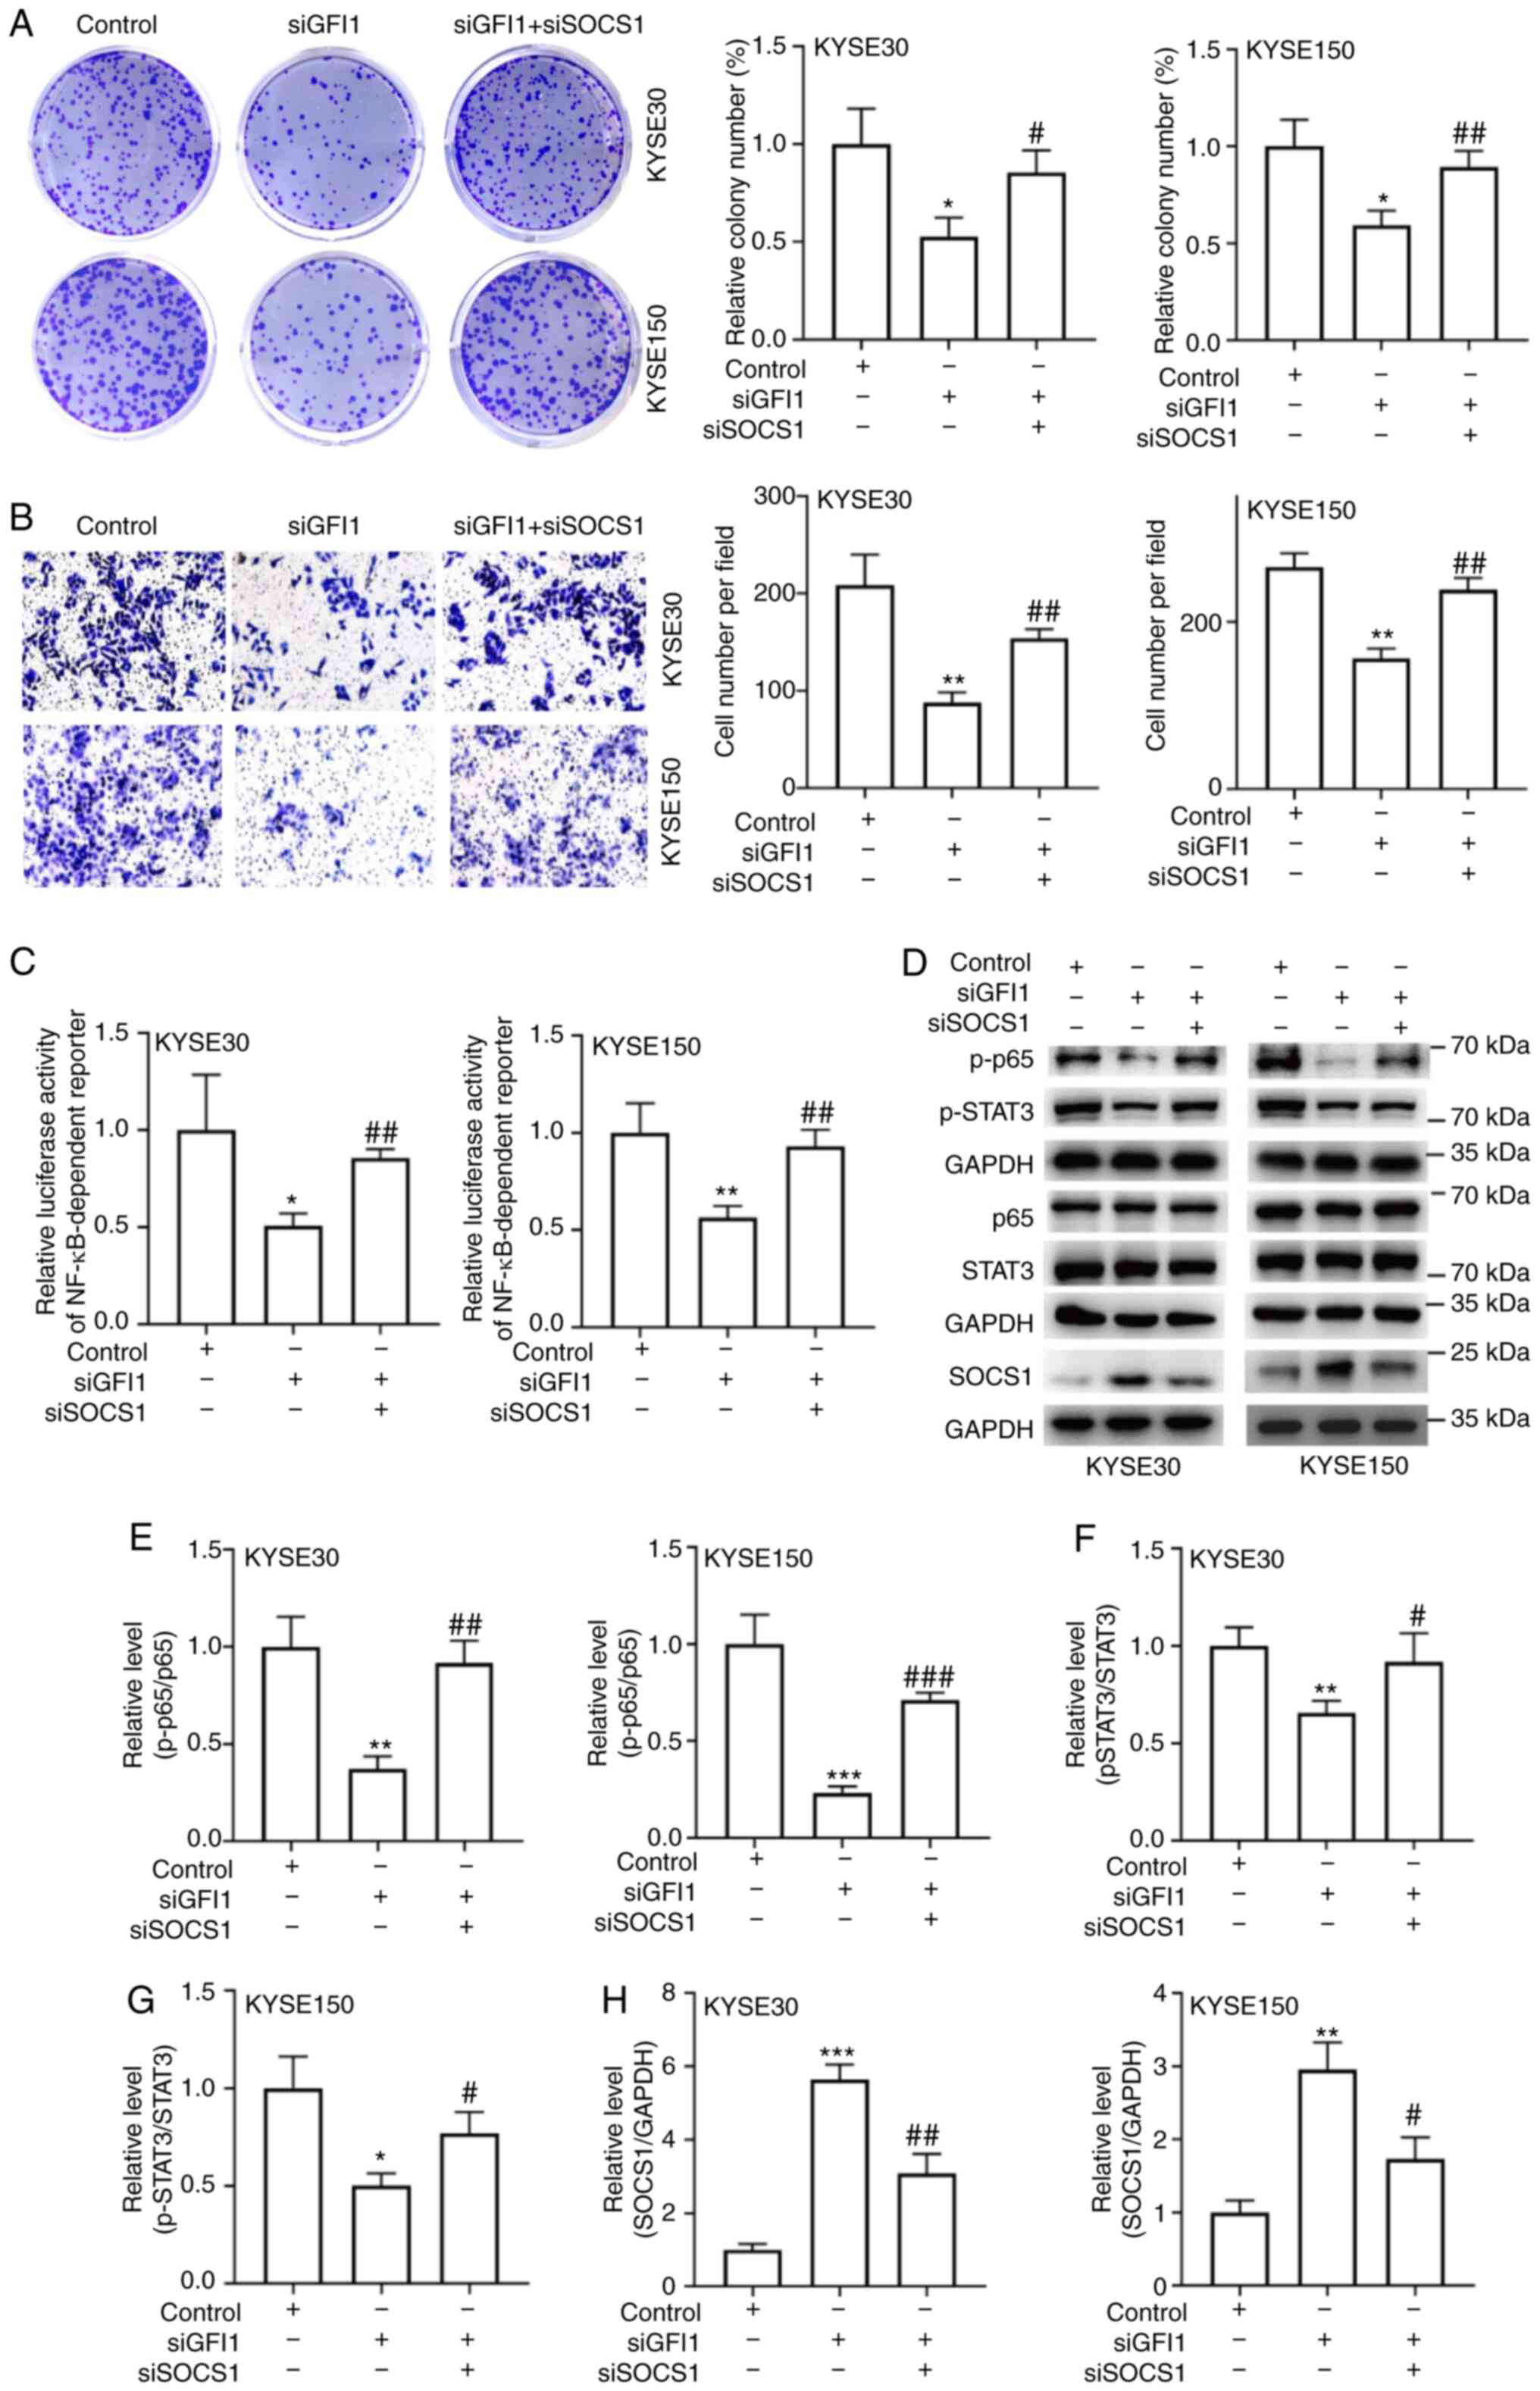 | Figure 7SOCS1 inhibits the increase in
esophageal squamous cell carcinoma cell proliferation and migration
induced by GFI1. (A-H) siSOCS1 was transfected into the
GFI1-knockdown KYSE30 and KYSE150 cells. (A) Colony formation
assays were performed on the double transfected cells. (B) Cell
migration was determined using Transwell assays. (C) NF-κB
activity, (D) p-p65, p-STAT3 and SOCS1 protein levels were
analyzed. (E-G) Ratio of p-p65 to p65 and STAT3 to p-STAT3, as well
as (H) the semi-quantification of SOCS1 protein expression were
determined using ImageJ. Magnification, ×200.
*P<0.05, **P<0.01
***P<0.001 vs. control; #P<0.05,
##P<0.01 and ###P<0.001 vs. siGFI1.
SOCS1, suppressor of cytokine signaling 1; si, small interfering
RNA; GFI1, growth factor-independent 1; p-, phosphorylated. |
Discussion
Although a number of improvements have been achieved
in the treatment of ESCC, surgical resection remains the most
effective treatment for patients with ESCC (21). However, the 5-year overall
survival rates remains poor at an estimated 15-20%, and 43~53% of
patients who undergo surgery experience local recurrence and/or
distant metastasis (22,23). Therefore, elucidating the
molecular mechanisms underlying the development and progression of
ESCC, and identifying novel therapeutic targets may improve ESCC
treatment.
Previous studies have demonstrated that GFI1 not
only regulates the development of multiple hematopoietic lineages,
including macrophages, dendritic cells, granulocytes, as well as T
and B cells, but it also participates in the self-renewal and
survival of hematopoietic stem cells (24,25). GFI1-knockout mice exhibit defects
in B cell, T cell and neutrophil differentiation, as well as in the
response of mature B and T cells to antigens (26). In addition, GFI1 inhibits T cell
death induced by cultivation of IL-2-dependent T cell lines in
IL-2-deficient media by repressing Bax expression (27). Although GFI1 has been reported to
be involved in the development and progression of cervical cancer
and lymphomas, its functions in ESCC remain unclear. In the present
study, GFI1 expression levels were markedly upregulated in ESCC
tissues compared with those in adjacent normal tissues, and GFI1
knockdown reduced cell proliferation and migration of ESCC
cells.
As an inhibitor of DNA binding, GFI1 targets a range
of proteins in various types of cells, including STAT5B, MCL1
apoptosis regulator, BCL2 family member, RUNX family transcription
factor 2, suppressor of cytokine signaling 1 and F-box and WD
repeat domain-containing 7 (9,12,28,29). SOCS1 was originally identified as
a suppressor of cytokine signaling, and belongs to the SOCS family
of proteins (30). SOCS1
inhibits proliferation signals modulated by various oncogenes
(CDK2, CyclinD1 and STATs) in cancer development (31). Previous studies have reported
that aberrant downregulation of SOCS1 is involved in the clinical
progression of a number of types of cancer, including
hepatocellular carcinoma, bladder and triple-negative breast cancer
(32-34). In the present study, the results
demonstrated that GFI1 knockdown increased the levels of SOCS1
expression compared with those in the control cells. An increasing
number of studies have reported that SOCS1 targets several
signaling pathways, including the JAK/STAT, MAPK and NF-κB pathways
(15,35,36). The STAT3 and NF-κB signaling
pathways are two vital intracellular pathways that serve key roles
in modulating cell differentiation, proliferation, migration and
metabolism (37,38). These pathways are frequently
overactivated in various types of cancer, including colorectal,
non-small lung and breast cancer, and have been reported to
contribute to tumor progression and drug resistance (39-41). Previous studies have demonstrated
that the STAT3 and NF-κB pathways are aberrantly activated during
ESCC development (17,42,43). However, whether both pathways are
associated with the role of GFI1 in ESCC remains unknown. The
results of the present study demonstrated that knocking down GFI1
expression significantly reduced SOCS1 expression levels and
further reduced the levels of p-STAT3 as well as NF-κB
activity.
The major limitation of the present study was that
the data were obtained from both EAC and ESCC, since hypothesized
from the EAC results that GFI1 may also be relevant in ESCC.
In conclusion, the results of the present study
demonstrated that GFI1 was significantly upregulated in ESCC
tissues and cells compared with those in normal esophageal tissues
and cells. Knockdown of GFI1 reduced ESCC cell proliferation and
migration by decreasing SOCS1 expression levels, which occurred via
the regulation of the STAT3 and NF-κB signaling pathways. Thus,
GFI1 may serve as a potential therapeutic target for the treatment
of ESCC.
Supplementary Data
Availability of data and materials
The datasets used and/or analyzed during the current
study are available from the corresponding author on reasonable
request.
Authors' contributions
WH and RZ designed the study. YH, RR and YF
performed the experiments. KW, LY and RR analyzed the data. WH and
RZ wrote the manuscript. All authors read and approved the final
manuscript. WH and RZ confirm the authenticity of all the raw
data.
Ethics approval and consent to
participate
The present study was approved by the Ethics
Committee of Anhui Medical University (Hefei, China; approval no.
20190356). All patients provided signed informed consent prior to
the study.
Patient consent for publication
Not applicable.
Competing interests
The authors declare that they have no competing
interests.
Acknowledgments
Not applicable.
Funding
This study was supported by the National Science Foundation of
China Grants (grant no. 82003048), the Anhui Provincial Natural
Science Foundation (grant no. 1908085QC131) and Grants for
Scientific Research of BSKY from Anhui Medical University (grant
no. XJ201726).
References
|
1
|
Torre LA, Bray F, Siegel RL, Ferlay J,
Lortet-Tieulent J and Jemal A: Global cancer statistics, 2012. CA
Cancer J Clin. 65:87–108. 2015. View Article : Google Scholar : PubMed/NCBI
|
|
2
|
Short MW, Burgers KG and Fry VT:
Esophageal cancer. Am Fam Physician. 95:22–28. 2017.PubMed/NCBI
|
|
3
|
Enzinger PC and Mayer RJ: Esophageal
cancer. N Engl J Med. 349:2241–2252. 2003. View Article : Google Scholar : PubMed/NCBI
|
|
4
|
Song Y, Li L, Ou Y, Gao Z, Li E, Li X,
Zhang W, Wang J, Xu L, Zhou Y, et al: Identification of genomic
alterations in oesophageal squamous cell cancer. Nature. 509:91–95.
2014. View Article : Google Scholar
|
|
5
|
Zhang SW, Zhang M and Li GL: An analysis
of incidence and mortality of esophageal cancer in China,
2003-2007. China Cancer. 4:241–247. 2012.
|
|
6
|
Zhang N, Shi J, Shi X, Chen W and Liu J:
Mutational characterization and potential prognostic biomarkers of
Chinese patients with esophageal squamous cell carcinoma. Onco
Targets Ther. 13:12797–12809. 2020. View Article : Google Scholar
|
|
7
|
Zhong X, Huang G, Ma Q, Liao H, Liu C, Pu
W, Xu L, Cai Y and Guo X: Identification of crucial miRNAs and
genes in esophageal squamous cell carcinoma by miRNA-mRNA
integrated analysis. Medicine (Baltimore). 98:e162692019.
View Article : Google Scholar
|
|
8
|
Liao X, Tang Y, Chattopadhyay SK, Hartley
JW and Morse HC III: Upregulation of Gfi-1, a gene involved in
IL-2-independent growth of T cells, in a murine retrovirus-induced
immunsodeficiency syndrome. In Vivo. 11:9–12. 1997.
|
|
9
|
Cai H, Zhang F and Li Z: Gfi-1 promotes
proliferation of human cervical carcinoma via targeting of FBW7
ubiquitin ligase expression. Cancer Manag Res. 10:2849–2857. 2018.
View Article : Google Scholar
|
|
10
|
Cheng B, Tang S, Zhe N, Ma D, Yu K, Wei D,
Zhou Z, Lu T, Wang J and Fang Q: Low expression of GFI-1 gene is
associated with panobinostat-resistance in acute myeloid leukemia
through influencing the level of HO-1. Biomed Pharmacother.
100:509–520. 2018. View Article : Google Scholar
|
|
11
|
Xian G, Zhao J, Qin C, Zhang Z, Lin Y and
Su Z: Simvastatin attenuates macrophage-mediated gemcitabine
resistance of pancreatic ductal adenocarcinoma by regulating the
TGF-β1/Gfi-1 axis. Cancer Lett. 385:65–74. 2017. View Article : Google Scholar
|
|
12
|
Lee MC, Kuo YY, Chou WC, Hou HA, Hsiao M
and Tien HF: Gfi-1 is the transcriptional repressor of SOCS1 in
acute myeloid leukemia cells. J Leukoc Biol. 95:105–115. 2014.
View Article : Google Scholar
|
|
13
|
Durham GA, Williams JJL, Nasim MT and
Palmer TM: Targeting SOCS proteins to control JAK-STAT signalling
in disease. Trends Pharmacol Sci. 40:298–308. 2019. View Article : Google Scholar
|
|
14
|
Yong YH, Wang P, Jia RM, Gooneratne R,
Robert Wang HC, Liao M and Ju XH: SOCS3 control the activity of
NF-κB induced by HSP70 via degradation of MyD88-adapter-like
protein (Mal) in IPEC-J2 cells. Int J Hyperthermia. 36:151–159.
2019. View Article : Google Scholar
|
|
15
|
Liau NPD, Laktyushin A, Lucet IS, Murphy
JM, Yao S, Whitlock E, Callaghan K, Nicola NA, Kershaw NJ and Babon
JJ: The molecular basis of JAK/STAT inhibition by SOCS1. Nat
Commun. 9:15582018. View Article : Google Scholar
|
|
16
|
Sugase T, Takahashi T, Serada S, Nakatsuka
R, Fujimoto M, Ohkawara T, Hara H, Nishigaki T, Tanaka K, Miyazaki
Y, et al: Suppressor of cytokine signaling-1 gene therapy induces
potent antitumor effect in patient-derived esophageal squamous cell
carcinoma xenograft mice. Int J Cancer. 140:2608–2621. 2017.
View Article : Google Scholar : PubMed/NCBI
|
|
17
|
Sugase T, Takahashi T, Serada S, Fujimoto
M, Hiramatsu K, Ohkawara T, Tanaka K, Miyazaki Y, Makino T,
Kurokawa Y, et al: SOCS1 gene therapy improves radiosensitivity and
enhances irradiation-induced DNA damage in esophageal squamous cell
carcinoma. Cancer Res. 77:6975–6986. 2017. View Article : Google Scholar
|
|
18
|
Amin MB, Gress DM, Meyer Vega LR, et al:
AJCC cancer staging manual. 8th edition. New York: Springer; 2017,
View Article : Google Scholar
|
|
19
|
Livak KJ and Schmittgen TD: Analysis of
relative gene expression data using real-time quantitative PCR and
the 2(-Delta Delta C(T)) method. Methods. 25:402–408. 2001.
View Article : Google Scholar
|
|
20
|
Mut M, Amos S and Hussaini IM: PKC alpha
phosphorylates cytosolic NF-kappaB/p65 and PKC delta delays nuclear
translocation of NF-kappaB/p65 in U1242 glioblastoma cells. Turk
Neurosurg. 20:277–285. 2010.
|
|
21
|
Lin HN, Chen LQ, Shang QX, Yuan Y and Yang
YS: A meta-analysis on surgery with or without postoperative
radiotherapy to treat squamous cell esophageal carcinoma. Int J
Surg. 80:184–191. 2020. View Article : Google Scholar
|
|
22
|
Reichenbach ZW, Murray MG, Saxena R,
Farkas D, Karassik EG, Klochkova A, Patel K, Tice C, Hall TM, Gang
J, et al: Clinical and translational advances in esophageal
squamous cell carcinoma. Adv Cancer Res. 144:95–135. 2019.
View Article : Google Scholar
|
|
23
|
Chen J, Yin W, Yao H and Gu W: Salvage
treatment for lymph node recurrence after radical resection of
esophageal squamous cell carcinoma. Radiat Oncol. 14:1692019.
View Article : Google Scholar
|
|
24
|
Duan Z and Horwitz M: Targets of the
transcriptional repressor oncoprotein Gfi-1. Proc Natl Acad Sci
USA. 100:5932–5937. 2003. View Article : Google Scholar
|
|
25
|
Hock H, Hamblen MJ, Rooke HM, Traver D,
Bronson RT, Cameron S and Orkin SH: Intrinsic requirement for zinc
finger transcription factor Gfi-1 in neutrophil differentiation.
Immunity. 18:109–120. 2003. View Article : Google Scholar : PubMed/NCBI
|
|
26
|
Möröy T and Khandanpour C: Growth factor
independence 1 (Gfi1) as a regulator of lymphocyte development and
activation. Semin Immunol. 23:368–378. 2011. View Article : Google Scholar
|
|
27
|
Grimes HL, Gilks CB, Chan TO, Porter S and
Tsichlis PN: The Gfi-1 protooncoprotein represses Bax expression
and inhibits T-cell death. Proc Natl Acad Sci USA. 93:14569–14573.
1996. View Article : Google Scholar
|
|
28
|
Lin Z, Jiang J and Liu XS: Ursolic
acid-mediated apoptosis of K562 cells involves Stat5/Akt pathway
inhibition through the induction of Gfi-1. Sci Rep. 6:333582016.
View Article : Google Scholar
|
|
29
|
Soliera AR, Mariani SA, Audia A, Lidonnici
MR, Addya S, Ferrari-Amorotti G, Cattelani S, Manzotti G,
Fragliasso V, Peterson L, et al: Gfi-1 inhibits proliferation and
colony formation of p210BCR/ABL-expressing cells via
transcriptional repression of STAT 5 and Mcl-1. Leukemia.
26:1555–1563. 2012. View Article : Google Scholar
|
|
30
|
Yoshimura A, Naka T and Kubo M: SOCS
proteins, cytokine signalling and immune regulation. Nat Rev
Immunol. 7:454–465. 2007. View
Article : Google Scholar : PubMed/NCBI
|
|
31
|
Sharma J and Larkin J III: Therapeutic
implication of SOCS1 modulation in the treatment of autoimmunity
and cancer. Front Pharmacol. 10:3242019. View Article : Google Scholar
|
|
32
|
Chen Q, Yin D, Zhang Y, Yu L, Li XD, Zhou
ZJ, Zhou SL, Gao DM, Hu J, Jin C, et al: MicroRNA-29a induces loss
of 5-hydroxymethylcytosine and promotes metastasis of
hepatocellular carcinoma through a TET-SOCS1-MMP9 signaling axis.
Cell Death Dis. 8:e29062017. View Article : Google Scholar : PubMed/NCBI
|
|
33
|
Demirel I, Säve S, Kruse R and Persson K:
Expression of suppressor of cytokine signalling 3 (SOCS3) in human
bladder epithelial cells infected with uropathogenic Escherichia
coli. APMIS. 121:158–167. 2013. View Article : Google Scholar
|
|
34
|
Qian Q, Lv Y and Li P: SOCS1 is associated
with clinical progression and acts as an oncogenic role in
triple-negative breast cancer. IUBMB Life. 70:320–327. 2018.
View Article : Google Scholar
|
|
35
|
Gong HL, Tao Y, Mao XZ, Song DY, You D and
Ni JD: MicroRNA-29a suppresses the invasion and migration of
osteosarcoma cells by regulating the SOCS1/NF-κB signalling pathway
through negatively targeting DNMT3B. Int J Mol Med. 44:1219–1232.
2019.PubMed/NCBI
|
|
36
|
Souma Y, Nishida T, Serada S, Iwahori K,
Takahashi T, Fujimoto M, Ripley B, Nakajima K, Miyazaki Y, Mori M,
et al: Antiproliferative effect of SOCS-1 through the suppression
of STAT3 and p38 MAPK activation in gastric cancer cells. Int J
Cancer. 131:1287–1296. 2012. View Article : Google Scholar
|
|
37
|
Chun KS, Jang JH and Kim DH: Perspectives
regarding the intersections between STAT3 and oxidative metabolism
in cancer. Cells. 9:22022020. View Article : Google Scholar
|
|
38
|
Rasmi RR, Sakthivel KM and Guruvayoorappan
C: NF-κB inhibitors in treatment and prevention of lung cancer.
Biomed Pharmacother. 130:1105692020. View Article : Google Scholar
|
|
39
|
Zhao J, Wang X, Mi Z, Jiang X, Sun L,
Zheng B, Wang J, Meng M, Zhang L, Wang Z, et al:
STAT3/miR-135b/NF-κB axis confers aggressiveness and unfavorable
prognosis in non-small-cell lung cancer. Cell Death Dis.
12:4932021. View Article : Google Scholar
|
|
40
|
Cong Y, Cui Y, Zhu S, Cao J, Zou H, Martin
TA, Qiao G, Jiang W and Yu Z: Tim-3 promotes cell aggressiveness
and paclitaxel resistance through NF-κB/STAT3 signalling pathway in
breast cancer cells. Chin J Cancer Res. 32:564–579. 2020.
View Article : Google Scholar : PubMed/NCBI
|
|
41
|
Ma J, Yang Y, Fu Y, Guo F, Zhang X, Xiao
S, Zhu W, Huang Z, Zhang J and Chen J: PIAS3-mediated feedback
loops promote chronic colitis-associated malignant transformation.
Theranostics. 8:3022–3037. 2018. View Article : Google Scholar
|
|
42
|
Long L, Pang XX, Lei F, Zhang JS, Wang W,
Liao LD, Xu XE, He JZ, Wu JY, Wu ZY, et al: SLC52A3 expression is
activated by NF-κB p65/Rel-B and serves as a prognostic biomarker
in esophageal cancer. Cell Mol Life Sci. 75:2643–2661. 2018.
View Article : Google Scholar
|
|
43
|
Liu Y, Wang X, Zeng S, Zhang X, Zhao J,
Zhang X, Chen X, Yang W, Yang Y, Dong Z, et al: The natural
polyphenol curcumin induces apoptosis by suppressing STAT3
signaling in esophageal squamous cell carcinoma. J Exp Clin Cancer
Res. 37:3032018. View Article : Google Scholar : PubMed/NCBI
|