Introduction
Liver cancer (LC) is the sixth most commonly
diagnosed malignancy and was the fourth leading cause of
cancer-related mortality worldwide in 2018, with ~841,000 new cases
and 782,000 related deaths (1).
Although there have been notable developments in surgical
techniques and in the peri-operative management of LC, the
prognosis following curative treatments remains poor due to tumor
progression and the high recurrence rate (2). The 5-year survival rate for
patients with LC has been shown to be 15-38% in the USA (3-5).
The risk factors for LC include hepatitis B (HBV) and hepatitis C
virus (HCV) infection (6).
Alcoholic cirrhosis, non-alcoholic fatty liver disease and
co-infection with human immunodeficiency virus may also contribute
to the occurrence of LC. Chronic hepatitis, liver fibrosis and
molecular alternations in hepatocytes are promoted by these hepatic
diseases, and these changes increase cell proliferation and
survival, eventually leading to the development of LC (6). Moreover, the molecular changes in
LC are associated with tumor malignancies. Thus, it would be
beneficial to elucidate the molecular mechanisms related to the
occurrence, progression and recurrence of LC in order to improve
prognosis.
MicroRNAs (miRNAs/miRs) are small, endogenous,
non-coding RNAs consisting of ~22 nucleotides (7). They regulate target gene expression
by binding to the 3′-untranslated region (UTR) of mRNAs (7). They play crucial roles in the
progression of various types of cancer, such as gastric (8), esophageal (9), colorectal (10) and pancreatic (11) cancer. A variety of miRNAs have
been shown to be associated with the progression of LC by affecting
oncogenesis, tumor development, cell proliferation, cell cycle
regulation or apoptosis (12).
As previously demonstrated, miR-657 promotes tumorigenesis by
targeting transducin-like enhancer protein 1 (13) and miR-1181 promotes cell growth
by regulating the expression of axis inhibition protein 1 (14). On the other hand, it has been
demonstrated that miR-223 suppresses tumor progression by targeting
stathmin1 (15), and miR-195
suppresses angiogenesis by inhibiting vascular endothelial growth
factor, VAV2 and CDC42 (16).
Thus, miRNAs promote and suppress the progression of LC, and have
potential for use in clinical applications, such as functioning as
prognostic markers or being included in miRNA-based therapy.
miR-4730 has been reported to function as a
prognostic indicator for pancreatic cancer, and the lower
expression of miR-4730 in pancreatic cancer tissues has been shown
to be associated with a poor prognosis (17). According to the results of the
Kaplan Meier plotter, which is a large database evaluating the
association between mRNA expression and prognosis in 21 types of
cancer (http://kmplot.com/), the lower
expression of miR-4730 in patients with LC is associated with a
poor prognosis. However, to the best of our knowledge, no studies
to date have clarified the association between miR-4730 expression
and the prognosis of patients with LC. Moreover, functions and
target genes of miR-4730 were not identified in previous studies.
The present study thus aimed to investigate the association between
miR-4730 expression and the prognosis of patients with LC. In
addition, the molecular functions and target genes of miR-4730 were
investigated using LC cell lines.
Materials and methods
Patients and clinical samples
A total of 148 consecutive patients who underwent
curative surgery for LC between 2014 and 2018 at the University
Hospital, Kyoto Prefectural University of Medicine were
retrospectively reviewed. Patients who had undergone surgery for
recurrent lesions or with any antitumor therapies prior to surgery
were excluded, and 70 patients were enrolled in total. Total RNA
was extracted from the formalin-fixed paraffin-embedded (FFPE)
tissue samples of these patients. Non-tumorous liver tissue was
collected from the peritumoral liver tissue of the patients with
LC. Tumor staging and clinicopathological factors were classified
according to the 8th edition of the UICC/TNM staging system
(18) and pathological features
were diagnosed by pathologists. The treatment policy was selected
according to the Clinical Practice Guidelines for Hepatocellular
Carcinoma 2017 (19).
The present study was conducted in accordance with
the principles of the Declaration of Helsinki, and written informed
consent was obtained from all patients prior to surgery. The
present study was reviewed and approved by the Institutional Ethics
Review Board of the University Hospital, Kyoto Prefectural
University of Medicine (approval no. ERB-C-1359-2).
Cells and cell culture
The following LC cell lines were used in the present
study: The Li-7 cell line (RBRC-RCB1941, lot no. 356-12) was
purchased from the RIKEN BioResource Center, and the HepG2
(JCRB1054, lot no. 04202017), HuH-7 (JCRB0403, lot no. 10192018),
PLC/PRF/5 (JCRB0406, lot no. 12142015) cell lines were purchased
from the JCRB Cell Bank. Human umbilical vein endothelial cells
(HUVECs; D10011, lot no. 434Z003) were purchased from PromoCell),
and the human normal esophageal squamous epithelial cell line,
Het-1A (CRL-2692, lot no. 63598569), was purchased from the
American Type Culture Collection (ATCC). These non-LC cell lines
were used as a control. Li-7 and Het-1A cells were maintained in
Roswell Park Memorial Institute medium (Nakalai Tisque),
supplemented with 10% fetal bovine serum (FBS; System Biosciences).
The HepG2, HuH-7, and PLC/PRF/5 cells were maintained in Dulbecco's
modified Eagle's medium (Nakalai Tisque), supplemented with 10%
fetal bovine serum (FBS; System Biosciences). HUVECs were cultured
in an endothelial basal medium (EBM; Lonza Group, Ltd.) with
endothelial growth supplement Single Quots (EGM-2; Lonza Group,
Ltd.). All cell lines were cultured in a humidified incubator at
37°C with 5% carbon dioxide.
RNA extraction and quantification of
miRNA and mRNA expression using reverse transcription-quantitative
PCR (RT-qPCR)
Total RNA was extracted from the FFPE tissue samples
using an AllPrep DNA/RNA FFPE Kit (Qiagen GmbH) and from the
cultured cells using a miRNeasy Mini kit (Qiagen GmbH) according to
the manufacturer's protocol. The reverse transcription reaction was
performed using a High Capacity cDNA Reverse Transcription kit
(Applied Biosystems; Thermo Fisher Scientific, Inc.) according to
the manufacturer's protocol; for 10 min at 25°C, followed by 2 h at
37°C and 5 min at 85°C. miRNA and mRNA expression levels were
measured using RT-qPCR with a StepOnePlus PCR system (Applied
Biosystems; Thermo Fisher Scientific, Inc.), and cycle threshold
(Ct) values were calculated using StepOne Software v2.0 (Applied
Biosystems; Thermo Fisher Scientific, Inc.). The thermocycling
conditions were as follows: 10 min at 95°C, followed by 40 cycles
for 15 sec at 95°C, for 30 sec at 55°C, and for 30 sec at 72°C.
TaqMan MicroRNA Assays, hsa-miR-4730 (Assay ID: 462061_mat) and
RNU6B (Assay ID: 001093) and TaqMan Gene Expression Assays, high
mobility group A1 (HMGA1) (Assay ID: Hs00852949_g1) and β-actin
(Assay ID: Hs01060665_g1), were used as the primer sets (Thermo
Fisher Scientific, Inc.). The results were evaluated using the
2−ΔΔCq method relative to the expression level of RNU6B
for miRNAs and β-actin for mRNAs (20).
Transfection of miRNA mimic and control
vector
miR-4730 mimic (Assay ID: MC21609; Thermo Fisher
Scientific, Inc.) and control vector (Negative Control #1; Thermo
Fisher Scientific, Inc.) were used for overexpression experiments.
These were transfected into the Li-7 and HepG2 cells at a final
concentration of 3 nM using a Lipofectamine 2000®
reagent (Thermo Fisher Scientific, Inc.) for 24 h at 37°C according
to the manufacturer's protocol. Overexpression was confirmed in
total RNA extracted 48 h following transfection using RT-qPCR.
Western blot analysis
Protein samples were extracted using the Mammalian
Protein Extraction Reagent (Thermo Fisher Scientific, Inc.). The
protein concentration was measured using the Protein Assay Rapid
kit Wako II (FUJIFILM Wako Pure Chemical Corporation) and adjusted
to 20 µg per sample. Each protein sample was separated by
10% sodium dodecyl sulfate-polyacrylamide gel electrophoresis and
subsequently transferred onto polyvinylidene difluoride membranes
(GE Healthcare; Cytiva). The membranes were blocked using
Tris-buffered saline with 0.05% Tween-20 (TBST) including 5% bovine
serum albumin (MilliporeSigma) for 1 h at room temperature and then
incubated with the following primary antibodies at 4°C overnight.
The membranes were washed with TBST to remove excess primary
antibodies and incubated with anti-rabbit (#7074S) or anti-mouse
(#7076S) secondary antibodies (both from Cell Signaling Technology,
Inc.) at room temperature for 1 h, and proteins were detected using
the ECL Plus Western Blotting Detection System (GE Healthcare;
Cytiva). Densitometric analysis of the blots was performed using
ImageJ software bundled with Java 1.8.0_172 (National Institutes of
Health).
The monoclonal antibodies used in the present study
were the following: Anti-HMGA1 (1:10,000 dilution, anti-rabbit,
cat. no. ab129153) and anti-integrin-linked kinase (ILK) (1:1,000
dilution, anti-rabbit, cat. no. ab196013) (all from Abcam),
anti-Akt (1:2,000 dilution, anti-mouse, cat. no. 2920S),
anti-phosphorylated (p)-Akt (1:2,000 dilution, anti-rabbit, cat.
no. 4060S), anti-glycogen synthase kinase 3β (GSK3β; 1:1,000
dilution, anti-rabbit, cat. no. 5676S), anti-p-GSK3β (1:1,000
dilution, anti-rabbit, cat. no. 5558S) (all from Cell Signaling
Technology, Inc.), and anti-β-actin (1:20,000 dilution, anti-mouse,
cat. no. A2228-200UL, MilliporeSigma) antibodies.
Microarray analysis
miR-4730 mimic and control vector was introduced
into the Li-7 and HepG2 cells. Total RNA was extracted following 48
h of incubation at 37°C, and the purity of the RNA was evaluated
using a NanoDrop ND-2000 Spectrophotometer (Thermo Fisher
Scientific, Inc.). These samples were submitted to an expression
array analysis (Human Clariom S Array; Thermo Fisher Scientific,
Inc.). The results were arranged in order by fold change between
the mimicand control vector-transfected cells, and candidate target
genes were selected using TargetScan data (http://www.targetscan.org). The probability of being a
target gene was ranked by the weighted context++ score (the more
negative the score, the stronger the suppression of
expression).
Cell proliferation assay
The Li-7 and HepG2 cells were seeded at
2.0×10⁴ cells/well in a 24-well plate. The number of
viable cells was evaluated using a colorimetric water-soluble
tetrazolium salt assay (Cell Counting Kit-8; Dojindo Laboratories,
Inc.). The cell count was assessed at 0, 24, 48 and 72 h following
miR-4730 mimic transfection. An absorbance value was measured at a
wavelength of 450 nm using Multiskan FC (cat. no. 51119000, Thermo
Fisher Scientific, Inc.) with Skanlt software 3.1.
Cell cycle assay
The Li-7 and HepG2 cells were seeded at
1.0×10⁵ cells/well in a 6-well plate. Each proportion of
the cell cycle was analyzed at 48 h following transfection with the
miR-4730 mimic using flow cytometry, BD Accuri C6 (BD Biosciences).
Cells were detached from the plate by trypsin-EDTA, treated with
200 µl 0.2% Triton X-100, and stained with 500 µl
PI/RNase staining buffer (Becton, Dickinson and Company) for 15 min
at room temperature. In total, 10,000 cells were measured in each
sample.
Cell apoptosis assay
The Li-7 and HepG2 cells were seeded at
8.0×10⁴ cells/well in a 6-well plate. Apoptotic rates
were evaluated at 48 h following transfection with miR-4730 mimic
using an Annexin V-FITC kit (Beckman Coulter, Inc.). The proportion
of early and late apoptotic cells was measured using flow cytometry
with BD Accuri C6. In total, 10,000 cells were measured in each
sample.
Luciferase reporter assay
Wild-type (WT) or mutant-type (MT) 3′-UTR sequences
of the HMGA1 were inserted into the pmirGLO vectors (Promega
Corporation), prior to the luciferase assays. Cells were seeded at
1.0×10⁴ cells/well in a 96-well black plate (Thermo
Fisher Scientific, Inc.). After 24 h of culture, 100 ng of the WT
or MT vector and 3 nM of miR-4730 mimic were transfected into the
cultured cells using the Lipofectamine 2000® reagent
(Thermo Fisher Scientific, Inc.). The cells were incubated for 48 h
at 37°C before the measurements. This assay was performed using the
Dual Luciferase Reporter Assay kit (Promega Corporation) in
accordance with the manufacturer's protocol. Luminous absorbance
was measured using the GloMax® Discover Microplate
Reader (Promega Corporation). The luciferase activity of
Renilla was used as the control reporter for
normalization.
Statistical analysis
The Kaplan-Meier method was used to analyze
recurrence-free survival (RFS) and overall survival (OS), and the
differences were evaluated using the log rank test. Prognosis was
examined using univariate and multivariate analysis with the Cox
hazard proportional model. The hazard ratio and 95% confidence
interval were calculated using JMP 10 software (SAS Institute,
Inc.). The Wilcoxon t-test was used to evaluate the differences
among the paired non-parametric variables, the Mann-Whitney U-test
among unpaired non-parametric variables, and the unpaired t-test
among unpaired parametric variables. Correlation analysis was
performed using Spearman's rank correlation coefficient. The
Chi-squared test was used for categorical variables. Statistical
tests used in the present study were two-sided, and a P-value
<0.05 was considered to indicate a statistically significant
difference. Data were presented in the figures as the mean ±
standard deviation (SD). All statistical analyses were performed
using JMP 10 software (SAS Institute, Inc.).
Results
miR-4730 expression in tissue samples and
its association with clinical features of patients with LC
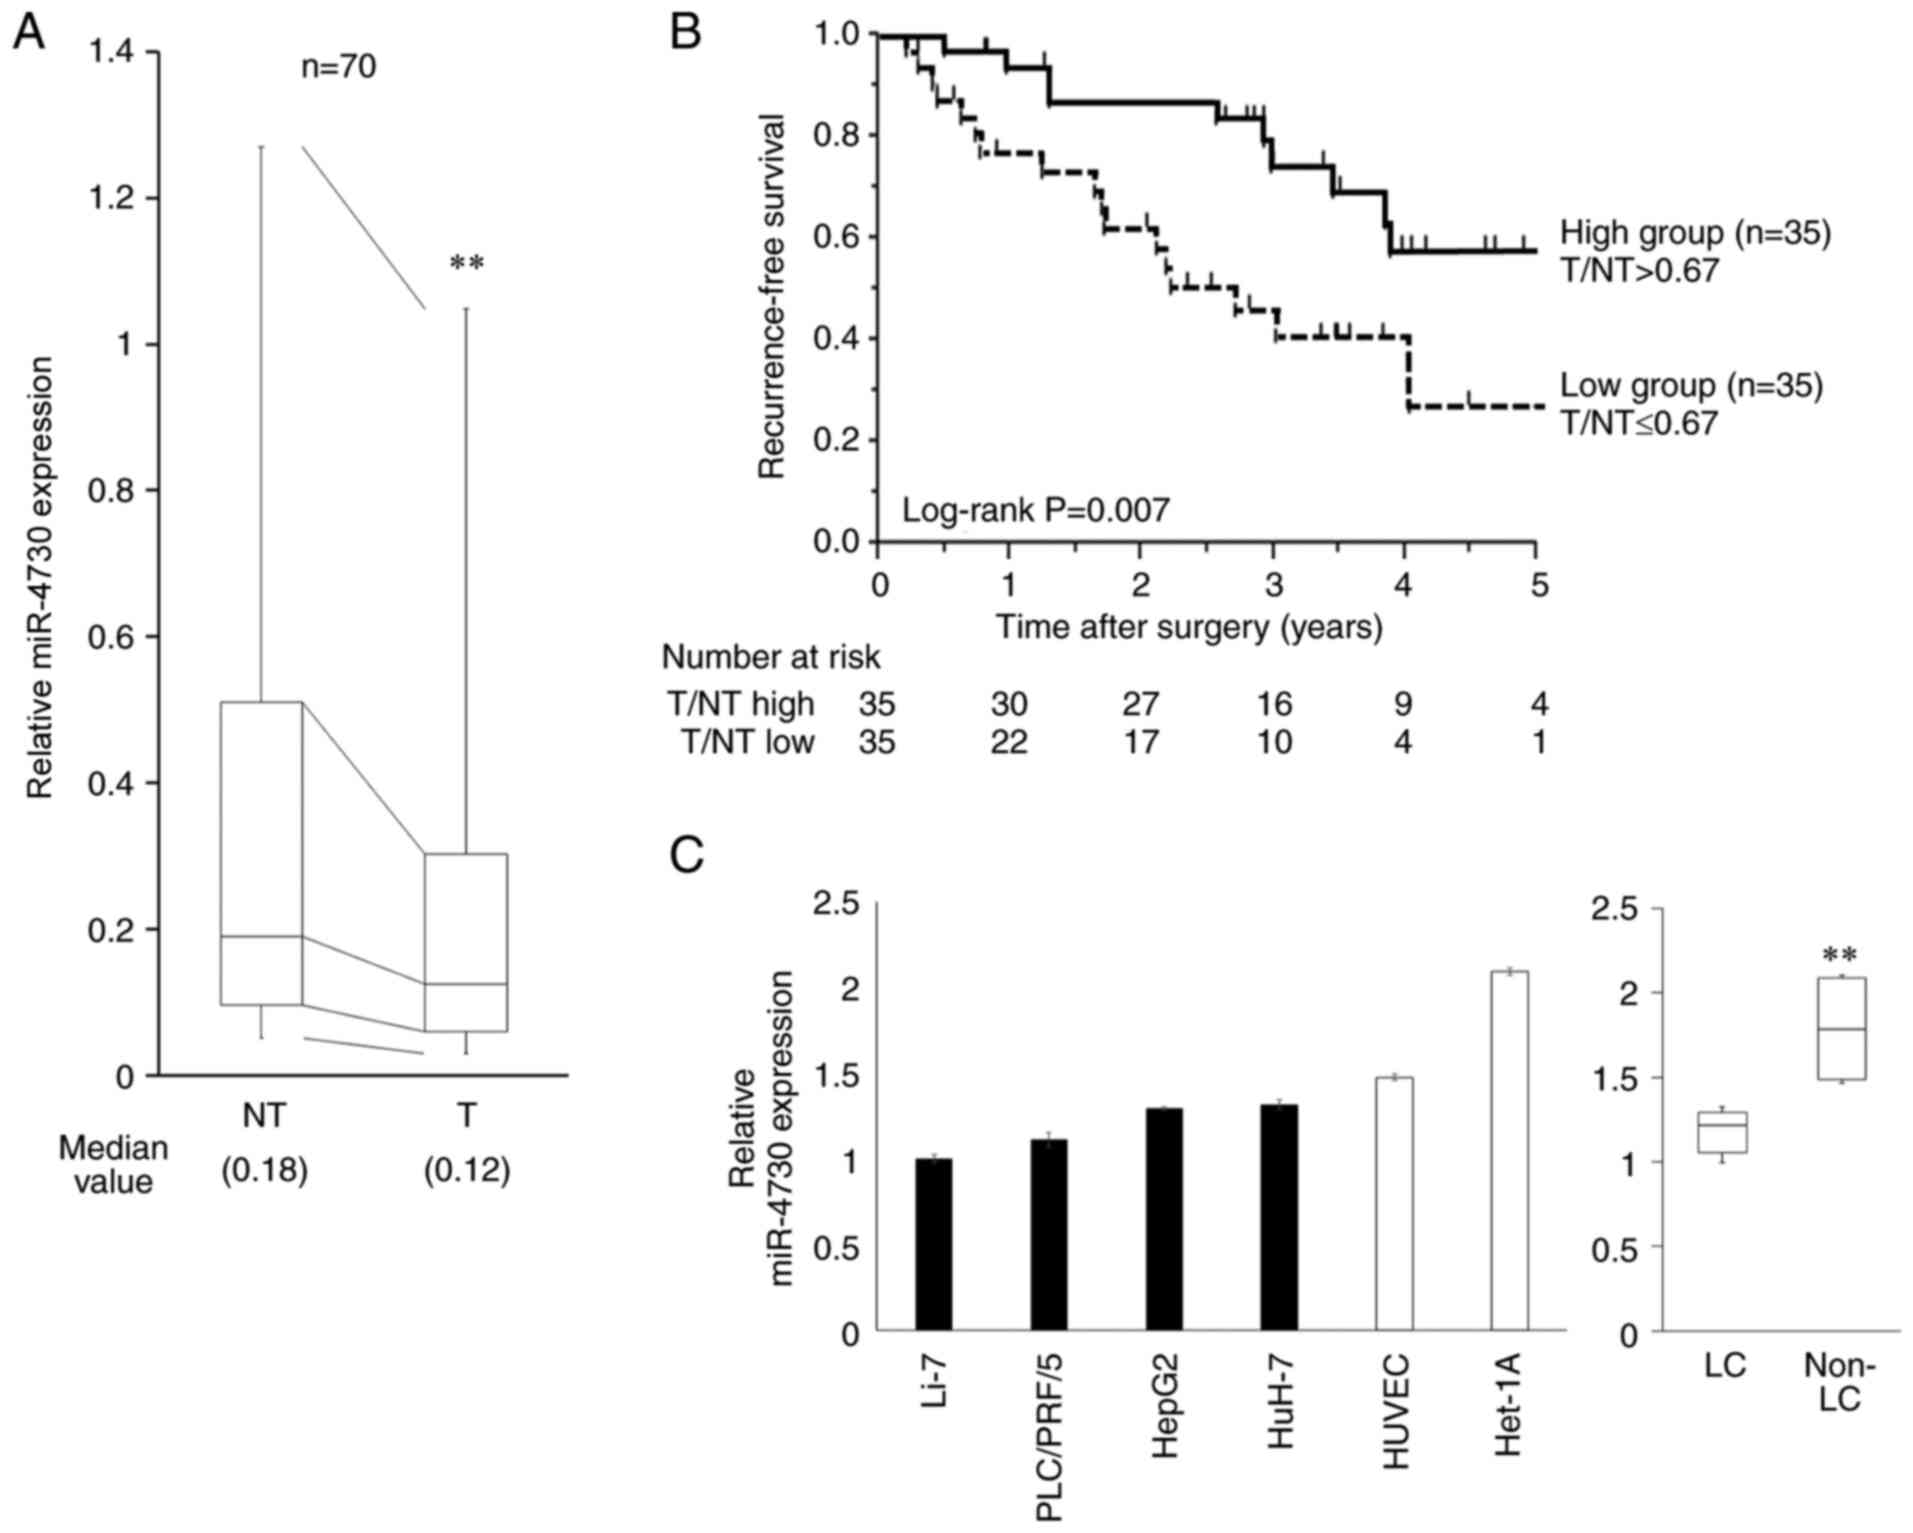
miR-4730 expression in the FFPE tissue samples
(n=70) was significantly higher in the non-tumorous tissue than in
the tumor tissue (P=0.006, Fig.
1A). As shown in Fig. 1B,
RFS following surgery was associated with miR-4730 expression.
Patients were divided into the high and low groups according to the
median value of miR-4730 expression in the tumor divided by that in
the non-tumorous tissue (T/NT). The cut-off value was determined as
0.67. RFS was significantly worse in the low expression group
(P=0.007). However, there was no difference in OS between these two
groups (P=0.786, Fig. S1).
The association between miR-4730 expression and the
clinicopathological features of patents with LC is presented in
Table I. Viral infection (HBV or
HCV), the serum albumin level and sex were associated with miR-4730
expression in the tumor tissue (P=0.046, P=0.006 and P=0.032,
respectively). Furthermore, miR-4730 expression tended to be
associated with indocyanine green retention (P=0.065) and the
recurrence rate (P=0.084), although this was not significant.
Survival analysis in the univariate analysis revealed that a mass
size >5 cm (P=0.034), multiple tumors (P=0.047) and a lower
expression of miR-4730 in the tumor tissue (P=0.007) were
significantly associated with a poor RFS rate (Table II). Moreover, in the
multivariate analysis, only miR-4730 expression was an independent
prognostic factor (hazard ratio, 1.98; 95% confidence interval,
1.22-3.22, P=0.005).
 | Table IAssociation between miR-4730
expression and clinicopathological features of patients with liver
cancer. |
Table I
Association between miR-4730
expression and clinicopathological features of patients with liver
cancer.
| Variables | No. of patients
(n=70) | Expression of
miR-4730
| P-valuea |
|---|
| T/NT >0.67 | (n=35) | T/NT ≤0.67 | (n=35) |
|---|
| Age (years) | | | | | | 1.000 |
| >70 | 40 | 20 | (57%) | 20 | (57%) | |
| ≤70 | 30 | 15 | (43%) | 15 | (43%) | |
| Sex | | | | | | 0.032 |
| Male | 50 | 29 | (83%) | 21 | (60%) | |
| Female | 20 | 6 | (17%) | 14 | (40%) | |
| Viral
infection | | | | | | 0.046 |
| HBV, HCV | 44 | 18 | (51%) | 26 | (74%) | |
| Others | 26 | 17 | (49%) | 9 | (26%) | |
| AFP (ng/ml) | | | | | | 0.780 |
| >20 | 17 | 8 | (23%) | 9 | (26%) | |
| ≤20 | 53 | 27 | (77%) | 26 | (74%) | |
| ICGR15 (%) | | | | | | 0.065 |
| >15 | 21 | 7 | (20%) | 14 | (40%) | |
| ≤15 | 49 | 28 | (80%) | 21 | (60%) | |
| Albumin (g/dl) | | | | | | 0.006 |
| >3.5 | 65 | 35 | (100%) | 30 | (86%) | |
| ≤3.5 | 5 | 0 | (0%) | 5 | (14%) | |
| Mass size (cm) | | | | | | 0.758 |
| ≥5 | 13 | 7 | (20%) | 8 | (17%) | |
| <5 | 57 | 28 | (80%) | 29 | (83%) | |
| Mass quantity | | | | | | 0.999 |
| Multiple | 4 | 2 | (6%) | 2 | (6%) | |
| Single | 66 | 33 | (94%) | 33 | (94%) | |
| Vascular
invasion | | | | | | 0.584 |
| Presence | 18 | 10 | (29%) | 8 | (23%) | |
| Absence | 52 | 25 | (71%) | 27 | (77%) | |
| T factorb | | | | | | 0.614 |
| T2-3 | 24 | 13 | (37%) | 11 | (31%) | |
| T1 | 46 | 22 | (63%) | 24 | (69%) | |
| Histopathological
type | | | | | | 0.606 |
| Well
differentiated | 22 | 10 | (29%) | 12 | (34%) | |
| Other | 48 | 25 | (71%) | 23 | (66%) | |
| Liver fibrosis | | | | | | 0.780 |
| F1-4 | 53 | 26 | (74%) | 27 | (77%) | |
| F0 | 17 | 9 | (26%) | 8 | (23%) | |
| Recurrence | | | | | | 0.084 |
| Presence | 27 | 10 | (29%) | 17 | (49%) | |
| Absence | 43 | 25 | (71%) | 18 | (51%) | |
| Table IIUnivariate and multivariate analyses
for recurrence-free survival. |
Table II
Univariate and multivariate analyses
for recurrence-free survival.
| Variables | No. of patients
(n=70) | Univariate
| Multivariate
|
|---|
| RFS (%) | P-valuea | HR | 95% CI | P-valueb |
|---|
| Age (years) | | | 0.257 | | | |
| >70 | 40 | 54.5 | | | | |
| ≤70 | 30 | 29.4 | | | | |
| Sex | | | 0.601 | | | |
| Male | 50 | 36.1 | | | | |
| Female | 20 | 63.5 | | | | |
| Virus | | | 0.501 | | | |
| HBV, HCV | 44 | 47.0 | | | | |
| Other | 26 | 39.8 | | | | |
| AFP (ng/ml) | | | 0.908 | | | |
| >20 | 17 | 42.1 | | | | |
| ≤20 | 53 | 44.5 | | | | |
| ICGR15 (%) | | | 0.080 | | | |
| >15 | 21 | 22.8 | | | | |
| ≤15 | 49 | 49.9 | | | | |
| Albumin (g/dl) | | | 0.258 | | | |
| >3.5 | 65 | 44.6 | | | | |
| ≤3.5 | 5 | 40.0 | | | | |
| Mass size (cm) | | | 0.034 | 1.37 | 0.70-2.47 | 0.331 |
| >5 | 13 | 0 | | | | |
| ≤5 | 57 | 50.8 | | | | |
| Mass quantity | | | 0.047 | 1.88 | 0.56-4.68 | 0.267 |
| Multiple | 4 | 0 | | | | |
| Single | 66 | 48.3 | | | | |
| Vascular
invasion | | | 0.852 | | | |
| Presence | 18 | 34.5 | | | | |
| Absence | 52 | 46.8 | | | | |
| T factorc | | | 0.125 | | | |
| T2-3 | 24 | 22.1 | | | | |
| T1 | 46 | 54.7 | | | | |
| Histopathological
type | | | 0.713 | | | |
|
Well-differentiated | 22 | 45.1 | | | | |
| Other | 48 | 43.7 | | | | |
| Liver fibrosis | | | 0.110 | | | |
| F1-4 | 53 | 37.5 | | | | |
| F0 | 17 | 76.9 | | | | |
| miR-4730 | | | 0.007 | 1.98 | 1.22-3.22 | 0.005 |
| T/NT ≤0.67 | 35 | 27.2 | | | | |
| T/NT >0.67 | 35 | 57.8 | | | | |
Functions of miR-4730 in LC cell
lines
miR-4730 expression in LC cell lines was
significantly lower than that in non-LC cell lines (P=0.003,
Fig. 1C). The Li-7 and HepG2
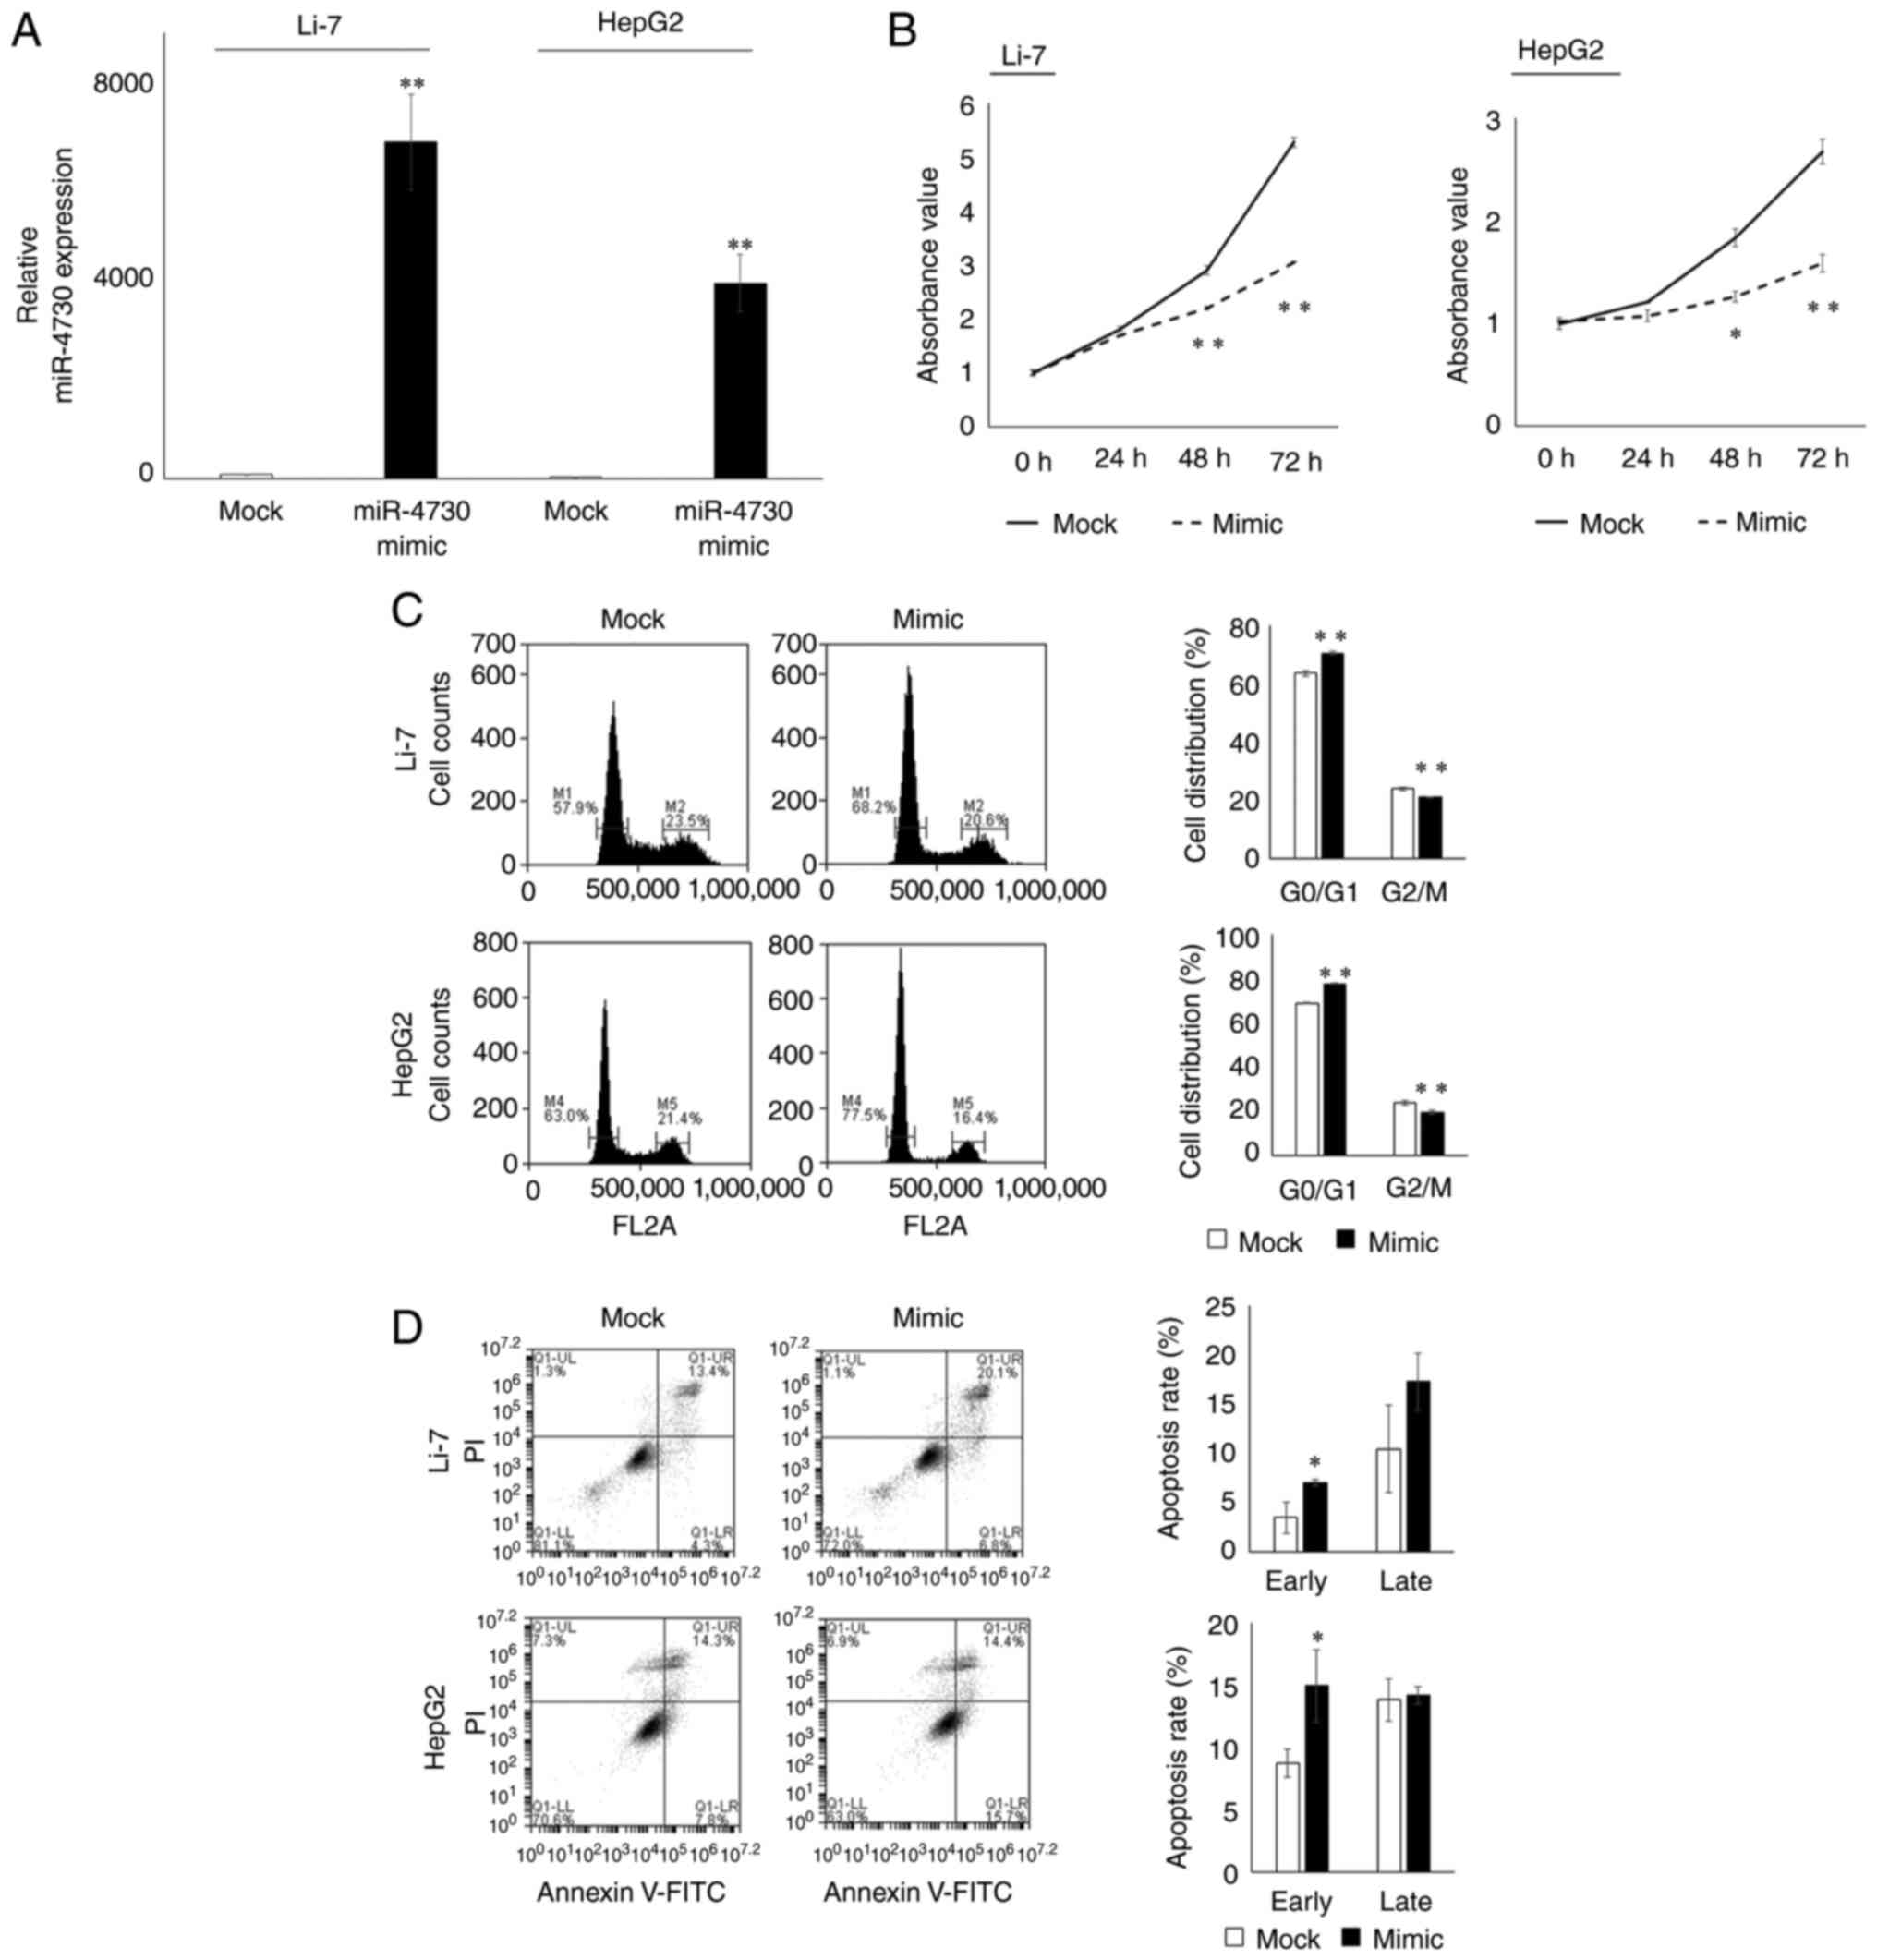
cell lines were selected for further examination. miR-4730
expression in both cell lines was sufficiently elevated following
transfection with miR-4730 mimic (Fig. 2A). The proliferative ability of
the Li-7 and HepG2 cells was significantly inhibited following
transfection with miR-4730 mimic (Fig. 2B). In the cell cycle analysis,
the proportion of cells in the G0/G1 phase was significantly
increased following transfection with miR-4730 mimic (Fig. 2C). In the apoptosis assay, the
number of early apoptotic cells was also significantly increased
following transfection with miR-4730 mimic (Fig. 2D).
Search for the candidate target gene of
miR-4730
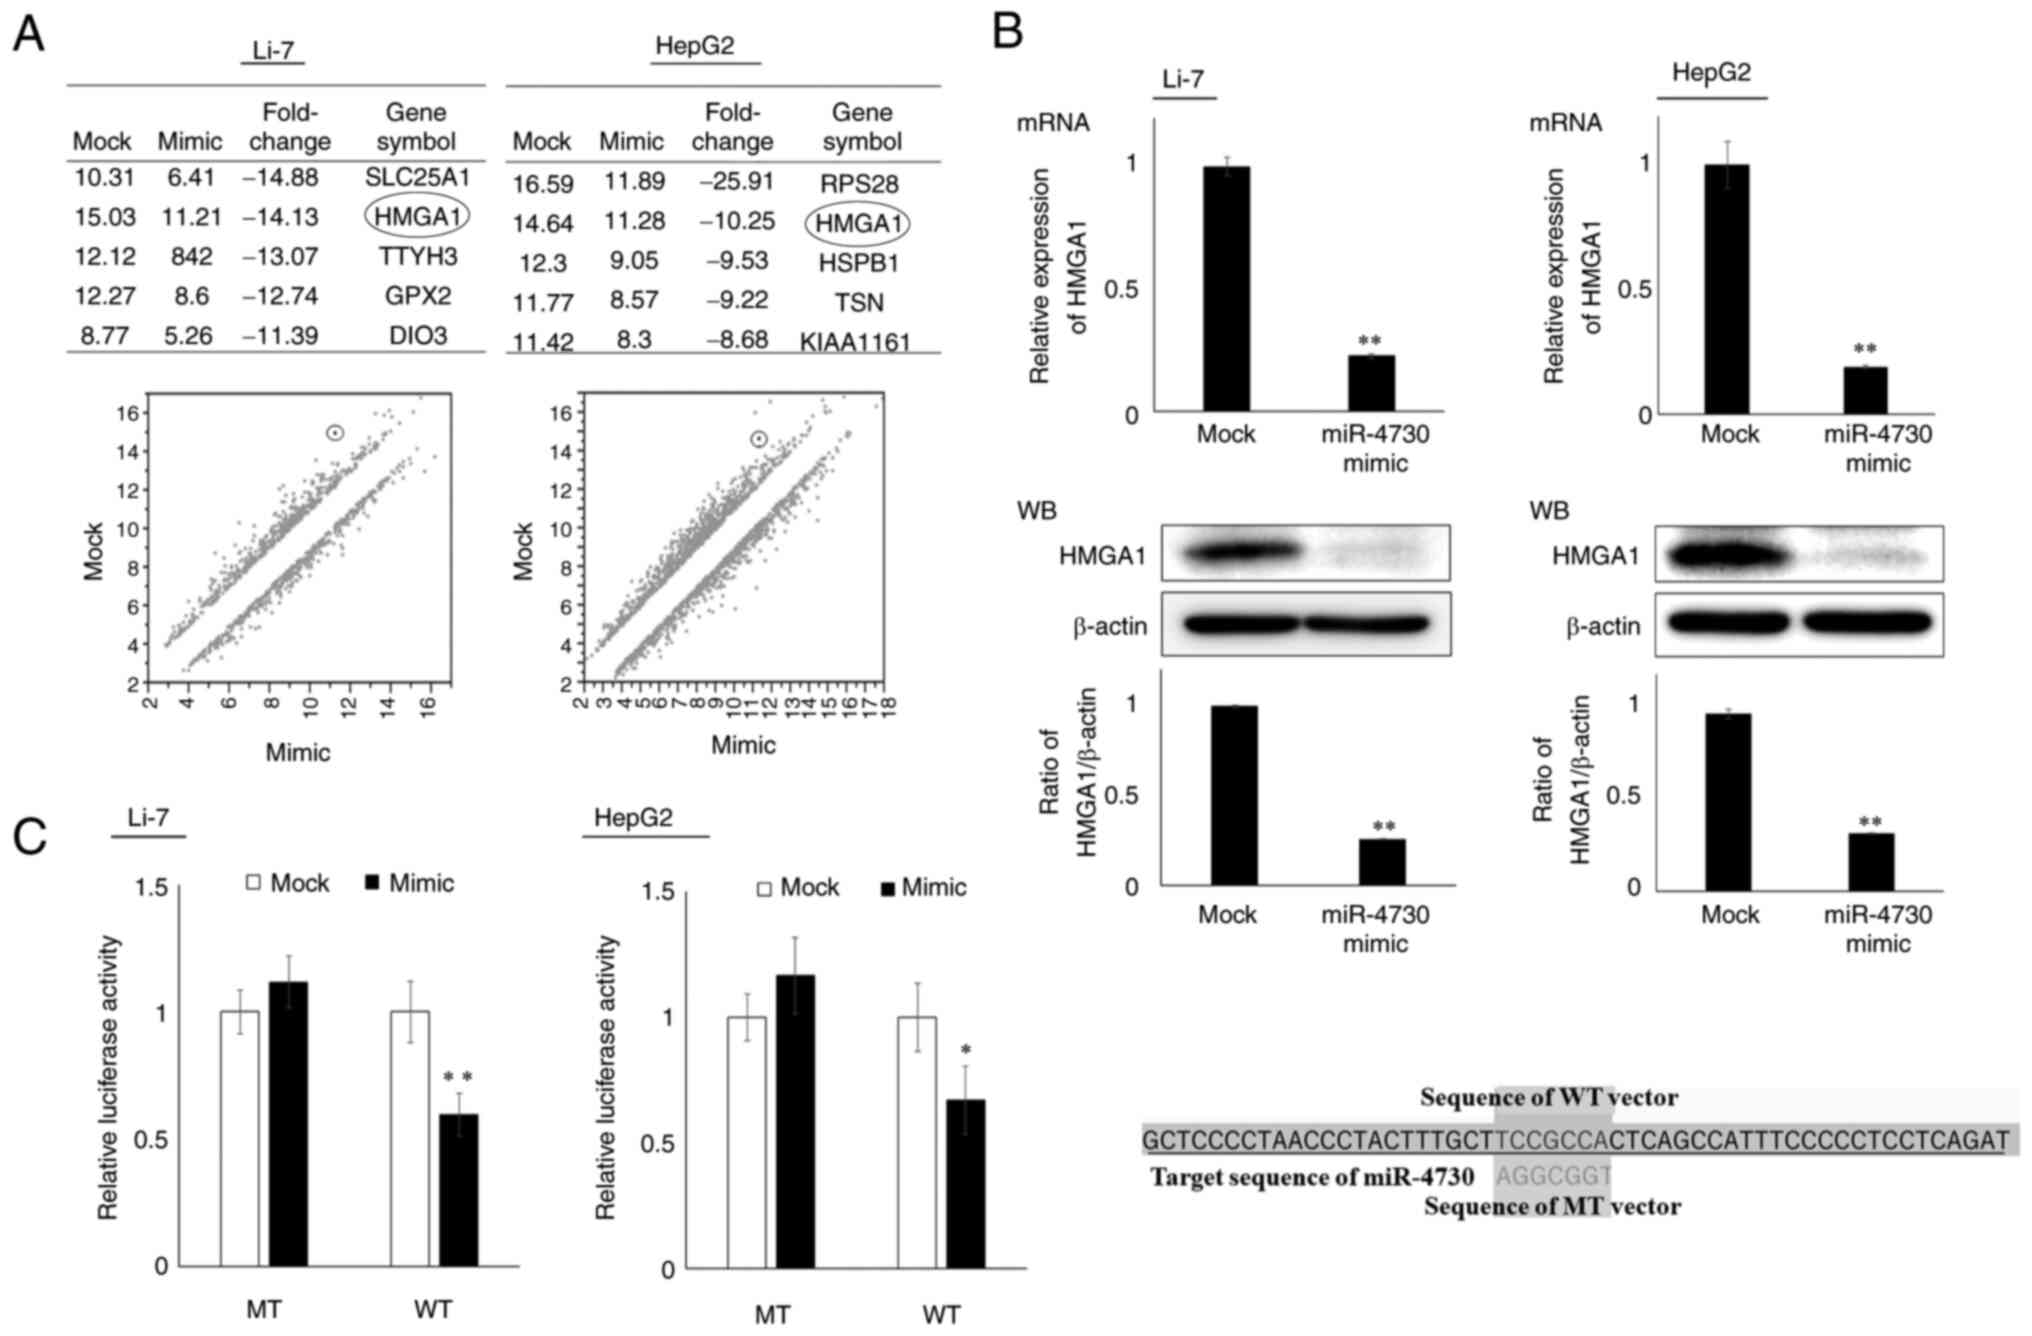
Changes in gene expression following miR-4730
overexpression were examined using microarray analysis, and HMGA1,
which was ranked higher in both Li-7 and HepG2 cell lines (Fig. 3A), was selected as a candidate
target gene of miR-4730 (the weighted context++ score of miR-4730
and HMGA1 was -0.39 according to the TargetScan database).
Association between miR-4730 and HMGA1
expression
The association between miR-4730 and HMGA1
expression was analyzed using RT-qPCR and western blot analysis
(Fig. 3B). The mRNA and protein
expression levels of HMGA1 were significantly decreased following
miR-4730 overexpression. Moreover, miR-4730 overexpression
decreased the luciferase activity of the vector containing the
target sequence of HMGA1 (WT vector), but not that of the vector
containing the mutant sequence (MT vector) (Fig. 3C). Thus, HMGA1 was a direct
target gene of miR-4730.
HMGA1 expression and downstream signaling
pathway
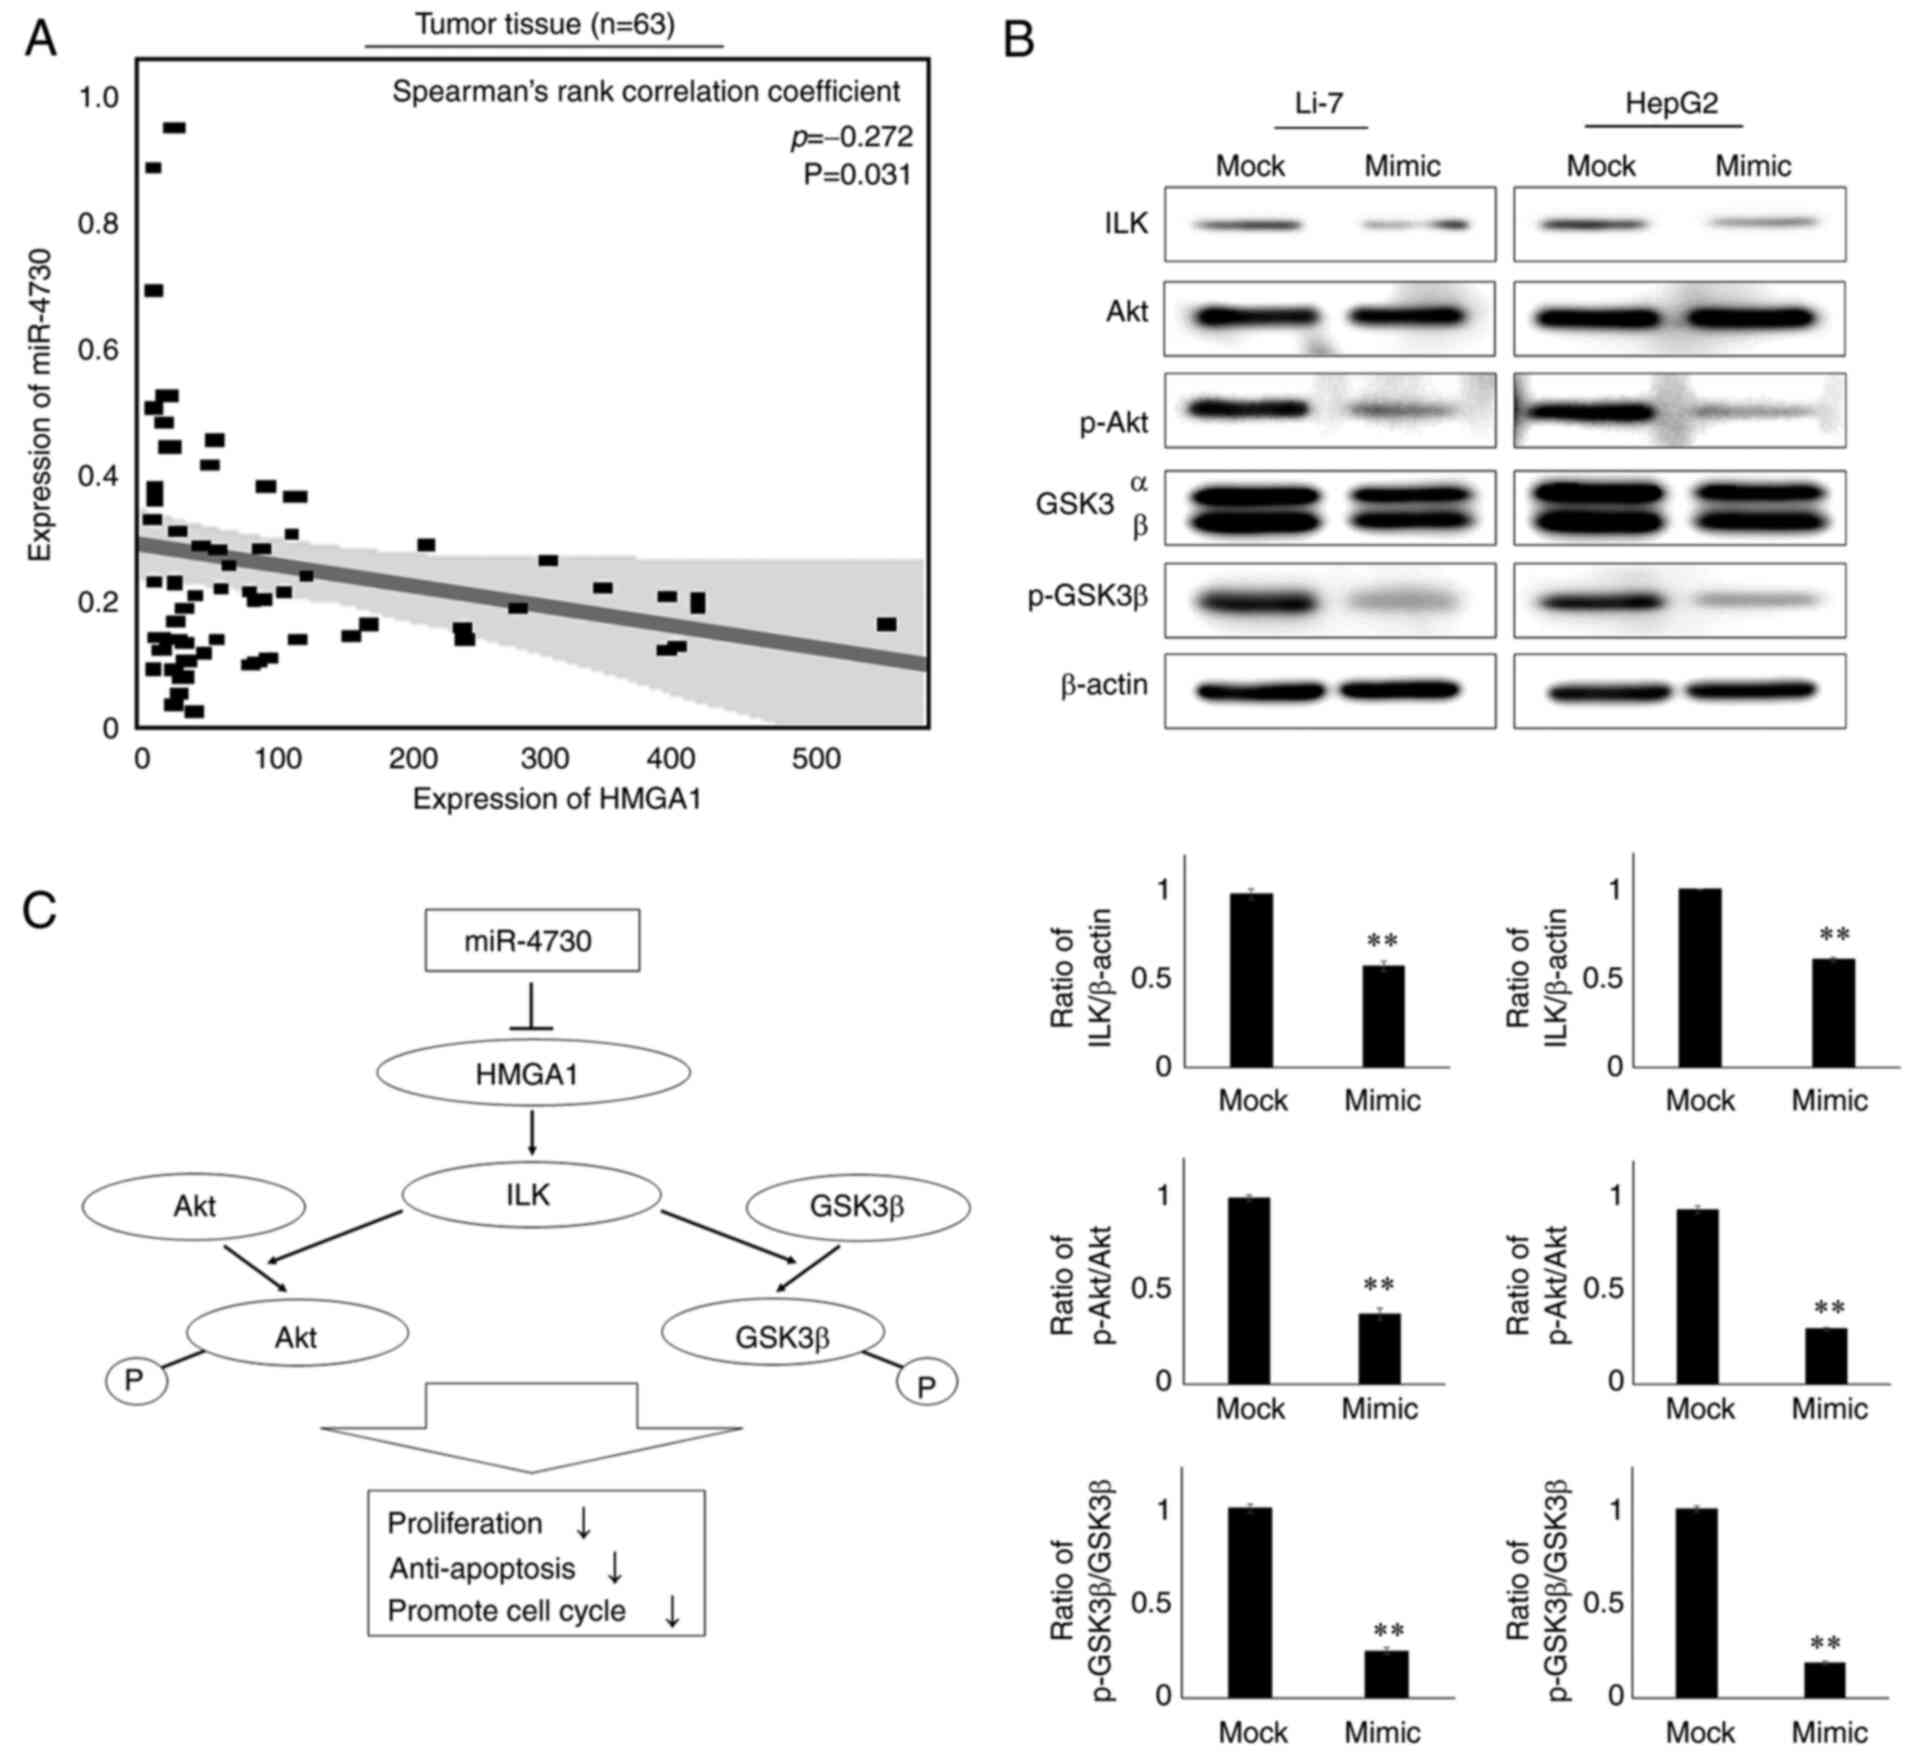
The expression of HMGA1 in tumor tissue was found to
negatively correlate with the expression of miR-4730 (P=0.049,
Spearman's rank correlation coefficient=-0.268, Fig. 4A). Such a correlation could not
be confirmed in the non-tumorous tissue (Fig. S2). As a previous study found
that HMGA1 regulated the ILK/Akt/GSK3β signaling pathway and
promoted the proliferation of LC (21), the present study examined the
alterations in protein expression in this downstream pathway using
western blot analysis. The protein expression levels of HMGA1, ILK,
p-Akt and p-GSK3β were downregulated in both the Li-7 and HepG2
cell lines following miR-4730 overexpression (Fig. 4B). As shown in Fig. 4C, miR-4730 overexpression
inhibited HMGA1 and the ILK/Akt/GSK3β downstream signaling
pathway.
Discussion
Gene regulation is one of the main factors
responsible for the progression of LC (6). miRNAs regulate levels of gene
expression by binding to the 3′-UTR of their target mRNAs and
subsequently inducing their cleavage or translational repression
(7). miRNAs can function as
promoters and suppressors of LC by inhibiting their target genes
(12); however, the functions
and target genes of various miRNAs remain unknown. It is thus of
utmost interest to reveal the characteristics of miRNAs in the
regulation of LC progression in order to improve the therapeutic
effects or prognosis. The present study revealed that miR-4730
suppressed the progression of LC by targeting HMGA1 and inhibiting
the downstream ILK/Akt/GSK3β signaling pathway. The association
between HMGA1 and its downstream pathway was revealed in a previous
study (21). However, to the
best of our knowledge, the present study is the first to clarify
the molecular functions of miR-4730 and its association with HMGA1
in LC. Furthermore, the lower expression of miR-4730 in tumor
tissue was related to a poor RFS of patients with LC. Thus,
miR-4730 is a novel prognostic marker for patients with LC.
HMGA1 is non-histone chromatin protein and regulates
the transcription of several genes by either enhancing or
suppressing transcription factors (22). It directly binds to DNA using
basic AT-hook domains and modifies their conformation, which
consequently facilitates the binding of transcriptional factors. By
generating the multiprotein stereospecific complex bound to DNA,
HMGA1 regulates expression of various genes. It has previously been
reported that the expression of HMGA1 in adult tissue is typically
lower (23); however, in various
malignant cells the overexpression of HMGA1 has been observed
(24). This overexpression of
HMGA1 activates tumor proliferation, anti-apoptotic mechanisms,
metastasis, angiogenesis, immune evasion, chromosomal instability
and epithelial mesenchymal transition (25). In the present study, miR-4730
directly targeted HMGA1 in LC cell lines, and a negative
correlation was observed between the expression of miR-4730 and
HMGA1 in clinical LC samples. Thus, the overexpression of HMGA1 due
to the suppression of mi-4730 expression contributes to LC
progression.
Shi et al (26) also reported that HMGA1 was highly
expressed in LC tissue and miR-195-5p directly suppressed HMGA1
expression. The base sequence of miR-4730 and miR-195-5p differ
from each other, and these miRNAs inhibit different regions of
HMGA1. Considering the mechanism of miRNA that affects the
expression of a number of different target genes (7), there are less functional
associations between miR-195-5p and miR-4730 in LC. miR-195-5p has
been reported to regulate a variety of genes other than HMGA1 in
LC, such as for example metastasis-associated in colon cancer-1
(27), centrosomal protein 55
(28) and programmed cell death
4 (29). Therefore, there is no
doubt that miR-195-5p also suppresses the progression of LC;
however, it appears that there is no association between the
functions of miR-4730 and miR-195-5p in inhibiting HMGA1
expression.
The ILK/Akt/GSK3β signaling pathway is one of the
downstream pathways of HMGA1 (30). Liu et al (21) reported that HMGA1 participated in
LC progression through the ILK/Akt/GSK3β signaling pathway. The
knockdown of HMGA1 has been shown to decrease the expression of
ILK, and ILK downregulation suppresses the phosphorylation of Akt
and GSK3β (31). Akt is known as
a critical mediator of growth factor-induced cell proliferation by
activating mammalian target of rapamycin (32). The activation of Akt suppresses
apoptosis by phosphorylating certain substrates, such as
pro-apoptotic Bad, caspase-9 and Forkhead transcription factor
FoxO3a (33), and also
upregulates cell cycle-promoting genes, such as cyclin-dependent
kinase 1, proliferating cell nuclear antigen and telomerase reverse
transcriptase (34). In the
present study, miR-4730 overexpression markedly inhibited the
ILK/Akt/GSK3β pathway, and the functions of LC cells were
suppressed. These results suggest that miR-4730 has potent
tumor-suppressive abilities in LC and may be used for miRNA-based
therapy by directly suppressing the function of HMGA1.
In the present study, miR-4730 expression was found
to be significantly lower in tumor tissue than in non-tumorous
tissue. It was also found that HBV or HCV infection was associated
with a lower expression of miR-4730 in tumor tissue. A previous
study reported that HMGA1 expression in LC cell lines expressing
the full-length HBV genome was upregulated (35). HBV is a circular and
double-stranded DNA virus that invades hepatocytes and encodes
viral proteins (35). Thus, HBV
infection can affect gene expression in hepatocytes and may
upregulate HMGA1 expression following the suppression of miR-4730
expression.
The present study revealed that the lower expression
of miR-4730 in tumor tissue was associated with a poor RFS. The
recurrence of LC is considered to be the onset of new LC rather
than the recurrence of the initial lesion. Liver tumor tissue with
a lower miR-4730 expression may have a higher malignant ability or
carcinogenicity; however, further investigations is required to
clarify the mechanisms responsible for the decrease in miR-4730
expression. In the present study, a lower miR-4730 expression was
associated with HBV or HCV infection and a decrease in liver
function. Therefore, chronic inflammation of the liver tissue may
affect miR-4730 expression. On the other hand, non-surgical
treatments are often selected for the recurrence of LC. Even if
surgical treatments are selected, partial resections are mostly
performed. In these cases, peritumoral liver tissue cannot be
sufficiently collected and it is difficult to fully analyze
miR-4730 expression in non-tumorous liver tissue.
There are some limitations to the present study
which should be mentioned. It was difficult to reach more general
conclusions due to the small patient population and limited sample
holding status. In the present study, the effects of the knockdown
of miR-4730 expression were not examined due to the lower
expression of miR-4730 in the majority of LC cell lines than in
non-LC cell lines. The opposite effect using an inhibitor of
miR-4730 may need to be examined in other cell lines. Moreover, the
effects of HMGA1 overexpression on proliferation or apoptosis were
not examined. Although the present study focused on miR-4730, there
might be other candidate miRNAs which influence the expression of
HMGA1. Thus, further studies are warranted.
In conclusion, the present study demonstrated that
miR-4730 expression in LC suppressed tumor progression by directly
targeting HMGA1 and inhibiting the downstream pathway. miR-4730 is
a novel prognostic marker for patients with LC and may become a
therapeutic target through the HMGA1 pathway.
Supplementary Data
Availability of data and materials
The datasets generated and/or analyzed during the
current study are available in the Gene Expression Omnibus (GEO)
repository (https://www.ncbi.nlm.nih.gov/geo/query/acc.cgi?acc=GSE196261).
Authors' contributions
HF and HK conceived the study design, performed the
experiments, and wrote the initial manuscript drafts. HK, TA, SKa,
JS, KT, WT and EO discussed the progress and analyzed the results
of this research and performed critical editing of the manuscript.
HS, SKo, AS, YY, RM and HI collected the clinical samples and
carefully considered the research plans and contents. HF and HK
confirm the authenticity of all the raw data. All authors have read
and agreed to the published version of the manuscript.
Ethics approval and consent to
participate
The present study was conducted in accordance with
the principles of the Declaration of Helsinki, and written informed
consent was obtained from all patients prior to surgery. This study
was reviewed and approved by the Institutional Ethics Review Board
of the University Hospital, Kyoto Prefectural University of
Medicine (approval no. ERB-C-1359-2).
Patient consent for publication
Not applicable.
Competing interests
The authors declare that they have no competing
interests.
Acknowledgments
Not applicable.
Funding
No funding was received.
References
|
1
|
Bray F, Ferlay J, Soerjomataram I, Siegel
RL, Torre LA and Jemal A: Global cancer statistics 2018: GLOBOCAN
estimates of incidence and mortality worldwide for 36 cancers in
185 countries. CA Cancer J Clin. 68:394–424. 2018. View Article : Google Scholar : PubMed/NCBI
|
|
2
|
Forner A, Llovet JM and Bruix J:
Hepatocellular carcinoma. Lancet. 379:1245–1255. 2012. View Article : Google Scholar : PubMed/NCBI
|
|
3
|
Altekruse SF, Henley SJ, Cucinelli JE and
McGlynn KA: Changing hepatocellular carcinoma incidence and liver
cancer mortality rates in the United States. Am J Gastroenterol.
109:542–553. 2014. View Article : Google Scholar : PubMed/NCBI
|
|
4
|
Zhang G, Li R, Deng Y and Zhao L:
Conditional survival of patients with hepatocellular carcinoma:
Results from the Surveillance, Epidemiology, and End Results
registry. Expert Rev Gastroenterol Hepatol. 12:515–523. 2018.
View Article : Google Scholar : PubMed/NCBI
|
|
5
|
Xu L, Kim Y, Spolverato G, Gani F and
Pawlik TM: Racial disparities in treatment and survival of patients
with hepatocellular carcinoma in the United States. Hepatobiliary
Surg Nutr. 5:43–52. 2016.PubMed/NCBI
|
|
6
|
Villanueva A: Hepatocellular Carcinoma. N
Engl J Med. 380:1450–1462. 2019. View Article : Google Scholar : PubMed/NCBI
|
|
7
|
Bartel DP: MicroRNAs: Genomics,
biogenesis, mechanism, and function. Cell. 116:281–297. 2004.
View Article : Google Scholar : PubMed/NCBI
|
|
8
|
Link A and Kupcinskas J: MicroRNAs as
non-invasive diagnostic biomarkers for gastric cancer: Current
insights and future perspectives. World J Gastroenterol.
24:3313–3329. 2018. View Article : Google Scholar : PubMed/NCBI
|
|
9
|
Harada K, Baba Y, Ishimoto T, Shigaki H,
Kosumi K, Yoshida N, Watanabe M and Baba H: The role of microRNA in
esophageal squamous cell carcinoma. J Gastroenterol. 51:520–530.
2016. View Article : Google Scholar : PubMed/NCBI
|
|
10
|
Chen B, Xia Z, Deng YN, Yang Y, Zhang P,
Zhu H, Xu N and Liang S: Emerging microRNA biomarkers for
colorectal cancer diagnosis and prognosis. Open Biol. 9:1802122019.
View Article : Google Scholar : PubMed/NCBI
|
|
11
|
Rawat M, Kadian K, Gupta Y, Kumar A, Chain
PSG, Kovbasnjuk O, Kumar S and Parasher G: MicroRNA in pancreatic
cancer: From biology to therapeutic potential. Genes (Basel).
10:7522019. View Article : Google Scholar
|
|
12
|
Oura K, Morishita A and Masaki T:
Molecular and functional roles of MicroRNAs in the progression of
hepatocellular carcinoma-A review. Int J Mol Sci. 21:83622020.
View Article : Google Scholar
|
|
13
|
Zhang L, Yang L, Liu X, Chen W, Chang L,
Chen L, Loera S, Chu P, Huang WC, Liu YR and Yen Y: MicroRNA-657
promotes tumorigenesis in hepatocellular carcinoma by targeting
transducin-like enhancer protein 1 through nuclear factor kappa B
pathways. Hepatology. 57:1919–1930. 2013. View Article : Google Scholar
|
|
14
|
Song Z, Yu Z, Chen L, Zhou Z, Zou Q and
Liu Y: MicroRNA-1181 supports the growth of hepatocellular
carcinoma by repressing AXIN1. Biomed Pharmacother. 119:1093972019.
View Article : Google Scholar : PubMed/NCBI
|
|
15
|
Wong QW, Lung RW, Law PT, Lai PB, Chan KY,
To KF and Wong N: MicroRNA-223 is commonly repressed in
hepatocellular carcinoma and potentiates expression of Stathmin1.
Gastroenterology. 135:257–269. 2008. View Article : Google Scholar : PubMed/NCBI
|
|
16
|
Wang R, Zhao N, Li S, Fang JH, Chen MX,
Yang J, Jia WH, Yuan Y and Zhuang SM: MicroRNA-195 suppresses
angiogenesis and metastasis of hepatocellular carcinoma by
inhibiting the expression of VEGF, VAV2, and CDC42. Hepatology.
58:642–653. 2013. View Article : Google Scholar : PubMed/NCBI
|
|
17
|
Yang W, Ju HY and Tian XF: Hsa-miR-4730 as
a new and potential diagnostic and prognostic indicators for
pancreatic cancer. Eur Rev Med Pharmacol Sci. 24:8801–8811.
2020.PubMed/NCBI
|
|
18
|
Union for International Cancer Control:
TNM Classification of Malignant Tumours. Brierley JD, Gospodarowicz
MK and Wittekind C: 8th edition. John Wiley & Sons, Inc;
Hoboken, NJ: 2017
|
|
19
|
The Japan Society of Hepatology: Clinical
Practice Guidelines for Hepatocellular Carcinoma 2017. Kanehara
& Co Ltd; Tokyo: 2017
|
|
20
|
Livak KJ and Schmittgen TD: Analysis of
relative gene expression data using real-time quantitative PCR and
the 2(-Delta Delta C(T)) Method. Methods. 25:402–408. 2001.
View Article : Google Scholar
|
|
21
|
Liu L, Zhang S, Hu L, Liu L, Guo W and
Zhang J: HMGA1 participates in MHCC97H cell proliferation and
invasion through the ILK/Akt/GSK3β signaling pathway. Mol Med Rep.
16:9287–9294. 2017. View Article : Google Scholar : PubMed/NCBI
|
|
22
|
Fusco A and Fedele M: Roles of HMGA
proteins in cancer. Nat Rev Cancer. 7:899–910. 2007. View Article : Google Scholar : PubMed/NCBI
|
|
23
|
Chiappetta G, Avantaggiato V, Visconti R,
Fedele M, Battista S, Trapasso F, Merciai BM, Fidanza V, Giancotti
V, Santoro M, et al: High level expression of the HMGI (Y) gene
during embryonic development. Oncogene. 13:2439–2446.
1996.PubMed/NCBI
|
|
24
|
Wang Y, Hu L, Zheng Y and Guo L: HMGA1 in
cancer: Cancer classification by location. J Cell Mol Med.
23:2293–2302. 2019. View Article : Google Scholar : PubMed/NCBI
|
|
25
|
Sumter TF, Xian L, Huso T, Koo M, Chang
YT, Almasri TN, Chia L, Inglis C, Reid D and Resar LM: The high
mobility group A1 (HMGA1) transcriptome in cancer and development.
Curr Mol Med. 16:353–393. 2016. View Article : Google Scholar : PubMed/NCBI
|
|
26
|
Shi M, Lv X, Zhu M, Dong Y, Hu L, Qian Y,
Fan C and Tian N: HMGA1 promotes hepatocellular carcinoma
proliferation, migration, and regulates cell cycle via miR-195-5p.
Anticancer Drugs. 33:e273–e285. 2022. View Article : Google Scholar
|
|
27
|
Wan T, Zheng J, Yao R, Yang S, Zheng W and
Zhou P: LncRNA DDX11-AS1 accelerates hepatocellular carcinoma
progression via the miR-195-5p/MACC1 pathway. Ann Hepatol.
20:1002582021. View Article : Google Scholar
|
|
28
|
Liu LX, Liu B, Yu J, Zhang DY, Shi JH and
Liang P: SP1-induced upregulation of lncRNA CTBP1-AS2 accelerates
the hepatocellular carcinoma tumorigenesis through targeting CEP55
via sponging miR-195-5p. Biochem Biophys Res Commun. 533:779–785.
2020. View Article : Google Scholar : PubMed/NCBI
|
|
29
|
Huang D, Wei Y, Zhu J and Wang F: Long
non-coding RNA SNHG1 functions as a competitive endogenous RNA to
regulate PDCD4 expression by sponging miR-195-5p in hepatocellular
carcinoma. Gene. 714:1439942019. View Article : Google Scholar : PubMed/NCBI
|
|
30
|
Reeves R: Molecular biology of HMGA
proteins: Hubs of nuclear function. Gene. 277:63–81. 2001.
View Article : Google Scholar : PubMed/NCBI
|
|
31
|
Chan J, Ko FC, Yeung YS, Ng IO and Yam JW:
Integrin-linked kinase overexpression and its oncogenic role in
promoting tumorigenicity of hepatocellular carcinoma. PLoS One.
6:e169842011. View Article : Google Scholar : PubMed/NCBI
|
|
32
|
Revathidevi S and Munirajan AK: Akt in
cancer: Mediator and more. Semin Cancer Biol. 59:80–91. 2019.
View Article : Google Scholar : PubMed/NCBI
|
|
33
|
Spokoini R, Kfir-Erenfeld S, Yefenof E and
Sionov RV: Glycogen synthase kinase-3 plays a central role in
mediating glucocorticoid-induced apoptosis. Mol Endocrinol.
24:1136–1150. 2010. View Article : Google Scholar : PubMed/NCBI
|
|
34
|
Koundouros N and Poulogiannis G:
Phosphoinositide 3-Kinase/Akt signaling and redox metabolism in
cancer. Front Oncol. 8:1602018. View Article : Google Scholar : PubMed/NCBI
|
|
35
|
Nakanishi F, Ohkawa K, Ishida H, Hosui A,
Sato A, Hiramatsu N, Ueda K, Takehara T, Kasahara A, Sasaki Y, et
al: Alteration in gene expression profile by full-length hepatitis
B virus genome. Intervirology. 48:77–83. 2005. View Article : Google Scholar : PubMed/NCBI
|