Introduction
Salusin-α and adiponectin are (two) vasoactive
peptides associated with atherosclerosis that have been previously
discovered. Salusin-α is one of the alternatively spliced products
derived from human torsional dystrophin TOR2A mRNA, which was
discovered by Shichiri et al (1) through the analysis of human DNA
library in 2003. It mainly exists in blood vessels, the central
nervous system and kidneys, and is a previously identified
vasoactive peptide that inhibits atherosclerosis (2). A recent study reported that lipid
metabolism disorder is the most important risk factor in the
development of atherosclerosis (3), and salusin-α is able to inhibit the
synthesis of lipids in macrophages through downregulating
acyl-coenzyme A: cholesterol acyltransferase-1 (ACAT-1), thereby
inhibiting the process of foam formation of macrophages (4). Furthermore, a previously published
clinical study confirmed that the level of salusin-α in serum is
increased, whereas the level of triglycerides (TG) is significantly
decreased (5). Additionally, it
was also reported that, in a study of patients who experienced
dyslipidemia due to hemodialysis treatment, salusin-α was
negatively correlated with low-density lipoprotein, whereas it was
positively correlated with the high-density lipoprotein/low-density
lipoprotein cholesterol ratio (6). These results revealed that salusin-α
could regulate lipid metabolism, thereby inhibiting
atherosclerosis.
Alternatively, adiponectin, an endogenous cytokine,
is mainly secreted by adipose tissue, which fulfills its biological
role via combining with its receptors (7). At present, there are three known
adiponectin receptors, namely adiponectin receptors 1 and 2
(AdipoR1 and AdipoR2) and T-cadherin (8). AdipoR1 is mainly expressed in
skeletal muscle, where it is involved in activation of the
AMP-activated protein kinase (AMPK) pathway, whereas AdipoR2 is
mainly expressed in the liver, and is associated with the
activation of peroxisome proliferator-activated receptor-α (PPARα)
(9). A recent study suggested
that adiponectin could combine with AdipoR1 or AdipoR2 to promote
fatty acid oxidation and inhibit lipid synthesis (10). Similar to salusin-α, there is
evidence that adiponectin also inhibits the synthesis of lipids and
atherosclerosis via binding with receptors to downregulate ACAT-1
(11); moreover, the content of
adiponectin in circulating blood is positively correlated with
high-density lipoprotein, and negatively correlated with TG
(12). The evidence to date has
collectively shown that salusin-α and adiponectin are peptides
associated with lipid metabolism, and they exert the same
biological effects in certain respects. However, to the best of our
knowledge, no studies have been published to date concerning
whether any association exists between salusin-α and
adiponectin.
Fatty liver disease, which is a disease associated
with lipid metabolism, is characterized by an excessive
accumulation of lipids in hepatocytes due to various different
causes (13). In recent years,
fatty liver disease has been recognized as one of the main causes
of chronic liver disease throughout the world. Indeed, a previously
published epidemiological investigation demonstrated that its
prevalence has reached 25% worldwide, and the incidence rate is
starting to increase in younger populations (14). Simple fatty liver disease can
develop into steatohepatitis, liver fibrosis, and even cirrhosis
and liver cancer, in addition to inducing certain cardiovascular
diseases, including atherosclerosis (15). However, if diagnosed sufficiently
early, fatty liver disease is reversible, and early diagnosis and
treatment can cause the condition to return to normal (16). Therefore, it is very important to
investigate how to inhibit the synthesis and accumulation of lipids
in the hepatocytes of patients with fatty liver, with the aim of
reducing the incidence rate of fatty liver disease. Numerous
studies have been conducted which have shown that adiponectin binds
to AdipoR2 and activates PPARα, subsequently directly affecting
lipid synthesis in liver cells through the apolipoprotein A5
(ApoA5)/sterol regulatory element-binding transcription factor 1
(SREBP-1c) signaling pathway (17,18). Tang et al (19) proposed that, compared with a
high-fat diet model group, the levels of fatty acid synthase and
acetyl-CoA carboxylase-α were significantly reduced in the liver
tissue of mice following salusin-α treatment, and the expression
levels of PPARα, carnitine palmitoyltransferase 1A and cytochrome
P450 7A1 were also significantly increased, thereby promoting the
oxidation of fatty acids and decomposition of cholesterol,
inhibiting fatty liver. Clearly, salusin-α and adiponectin can
exert the same effects on lipid metabolism; however, it remains
unclear whether salusin-α is able to effect changes in the
downstream signal molecules of hepatocytes through AdipoR2. Based
on the observations that salusin-α and adiponectin exert numerous
similar biological effects, and can both effect changes in the
level of the downstream molecule PPARα, it was hypothesized that
salusin-α may regulate changes in downstream signaling molecules
via AdipoR2. However, to the best of our knowledge, few studies
have been undertaken on the correlation between salusin-α and
AdipoR2.
Consequently, in the present study, 293T cells were
first infected with synthesized overexpression and interfering
salusin-α lentiviruses, and then changes in the level of AdipoR2
were detected using semi-quantitative (SQ)-PCR. Subsequently, HepG2
cells were also infected using the identical method, and the
AdipoR2 level was assessed. Western blot (WB) analysis was then
employed to detect whether salusin-α could regulate the
PPARα/ApoA5/SREBP-1c signaling pathway in liver cells through
AdipoR2. In order to further confirm that salusin-α exerts a role
through AdipoR2, an agonist and inhibitor of AdipoR2 were also used
to investigate the regulation of lipid synthesis mediated by
salusin-α in HepG2 cells via the PPARαApoA5/SREBP-1c signaling
pathway. Collectively, the findings of the present study provided a
theoretical and experimental basis for exploring the potential
mechanism via which salusin-α inhibits fatty liver.
Materials and methods
Construction of recombinant plasmids
According to the human TOR2A gene sequence number
(NM-001134430), the sequence of salusin-α was determined, and a
short hairpin (sh)RNA design tool (BLOCK-iT™ RNAi Designer; Thermo
Fisher Scientific, Inc.) was used to design three salusin-α
interference sequences (Table I).
The specificity of these sequences was then confirmed through BLAST
analysis on NCBI database. These sequences were synthesized by
Sangon Biotech Co., Ltd. Transfer plasmids [pHAGE (cat. no. 118692)
and pLKO.1 (cat. no. 8453; both from Addgene)] and auxiliary
plasmids [psPAX2 (cat. no. 12260) and pMD2G (cat. no. 12259; both
from Addgene)] were provided by Tongji Medical College of Huazhong
University of Science and Technology. SnapGene-designed salusin-α
primers contained BamHI (cat. no. 1010A) and XhoI
(cat no. 1094A; both from Takara Biotechnology Co., Ltd.)
restriction sites (Table II),
and pHAGE-Salusin-α was constructed according to the method of
double-enzyme-digestion molecular cloning. Briefly, the PCR
amplification product containing salusin-α and pHAGE vector were
digested with BamHI and XhoI to produce the same
sticky ends. Subsequently, the salusin-α gene sequence and linear
Phage vector were purified and then joined using T4 DNA ligase (cat
no. 2011A; Takara Biotechnology Co., Ltd.) in an overnight
incubation at 16°C. pLKO.1-shSalusin-α was constructed according to
the construction method for interference plasmids. The two
synthesized interference sequences were annealed to form a
double-stranded DNA, which was then ligated with the line vector of
pLKO.1 that had been digested by AgeI (cat. no. R3552S; New
England BioLabs, Inc.) and EcoRI (cat. no. R3101V; New
England BioLabs, Inc.). The constructed pHAGE-Salusin-α and
pLKO.1-shSalusin-α plasmids were respectively transfected into
TOP10 competent cells. The transfection mixture was coated onto an
LB plate and cultured overnight at 37°C in an incubator, prior to
the selection of colonies on the plate. The constructed plasmids
were confirmed by colony PCR. Table
II shows the salusin-α primers and the primers designed for the
interference sequence. Positive colonies of successfully cloned
plasmid were inoculated into LB culture medium. Precisely following
the instructions of the plasmid extraction kit (cat. no. 9760;
Takara Biotechnology Co., Ltd.), the recombinant plasmids were
extracted from the bacterial solution and sent to Sangon Biotech
Co., Ltd. for sequencing. Finally, the recombinant plasmids were
amplified and purified, and a large number of highly purified
plasmids were obtained for subsequent experiments.
 | Table ISynthetic interfering sequences of
salusin-α. A total of 3 interference sequences are included, all of
which were used to construct pLKO.1-shSalusin-α. Target site:
shSalusin-α specifically designed for this sequence of salusin-α.
The bold part is the sense chain and the antisense chain, the
antisense chain is the reverse repeat sequence of the sense chain,
the 'CTCGAG' is loop. |
Table I
Synthetic interfering sequences of
salusin-α. A total of 3 interference sequences are included, all of
which were used to construct pLKO.1-shSalusin-α. Target site:
shSalusin-α specifically designed for this sequence of salusin-α.
The bold part is the sense chain and the antisense chain, the
antisense chain is the reverse repeat sequence of the sense chain,
the 'CTCGAG' is loop.
| Name | Sequences
(5′→3′) | Target site
(bp) |
|---|
| shSalusin-α#1 | Sense:
CCGGGCCCTTCCTCCCGCTCCAGCGCTCGAGCGCTGGAGCGGGAGGAAGGGCTTTTTG | 7-27 |
| Antisense:
AATTCAAAAAGCCCTTCCTCCCGCTCCAGCGCTCGAGCGCTGGAGCGGGAGGAAGGGC |
| shSalusin-α#2 | Sense:
CCGGGCGGCACCACGTCCGGCACTGCTCGAGCAGTGCCGGACGTGGTGCCGCTTTTTG | 25-45 |
| Antisense:
AATTCAAAAAGCGGCACCACGTCCGGCACTGCTCGAGCAGTGCCGGACGTGGTGCCGC |
| shSalusin-α#3 | Sense:
TCTCGAGAGCTCGTTGAGCACGCAGTCTTTTTG | 40-60 |
| Antisense:
AATTCAAAAAGCACTGCGTGCTCAACGAGCTCTCGAGAGCTCGTTGAGCACGCAGTGC |
| Table IIpSequences of primers used for
semi-quantitative PCR. shSalusin-α#1-3: interference sequences of
salusin-α#1, 2 and 3; the text highlighted in bold represents the
restriction site; because the forward primer was designed on the
pLKO.1, the interference sequences shSalusin-α#1-3 share a forward
primer. |
Table II
pSequences of primers used for
semi-quantitative PCR. shSalusin-α#1-3: interference sequences of
salusin-α#1, 2 and 3; the text highlighted in bold represents the
restriction site; because the forward primer was designed on the
pLKO.1, the interference sequences shSalusin-α#1-3 share a forward
primer.
| Gene name | Sequence
(5′→3′) | Length (bp) |
|---|
| WPRE | F:
CGCTATGTGGATACGCTGCTTTA | 93 |
| R:
GCAACCAGGATTTATACAAGGAGGA |
| GAPDH | F:
GTCTCCTCTGACTTCAACAGCG | 131 |
| R:
ACCACCCTGTTGCTGTAGCCAA |
| Salusin-α | F:
CAGGATCCAGTGGTGCCCTTCCTCCCG | 101 |
| R:
CATCTCGAGCTTGGCTCCAGGCCCAGC |
| AdipoR2 | F:
AGGACTCCAGAGCCAGATATAAG | 273 |
| R:
CCACCGCCCTTCCCATACC |
|
shSalusin-α#1-3 | F:
CGAGACTAGCCTCGAGCGGCC | |
| shSalusin-α#1 | R:
CTCGAGCGCTGGAGCGGGA | 311 |
| shSalusin-α#2 | R:
CTCGAGCAGTGCCGGACGT | 311 |
| shSalusin-α#3 | R:
CTCGAGAGCTCGTTGAGCACGC | 311 |
Cell culture and packaging of
lentivirus
293T cells (cat. no. CRL-3216TM; American Type
Culture Collection), which are also called human embryonic kidney
cells (an epithelial-like cell that was isolated from the kidney of
a patient), were obtained from the Tongji Medical College of
Huazhong University of Science and Technology. The HepG2 cell line
(has an epithelioid morphology and was isolated from male liver
cancer) was purchased from ENOVA BIO (www.enovabio.com; cat. no. ECL0103). After STR
identification, the aforementioned HepG2 cell line was found to
have a similarity rate and of 98.51% with the HepG2 cell line in
CELLOSAURUS database (accession no. CVCL_0027). Both cell lines
were maintained in high-glucose DMEM (cat. no. PM150210; Procell
Life Science & Technology Co., Ltd.) containing 10% (v/v) fetal
bovine serum, 100 U/ml penicillin and 100 µg/ml streptomycin
(cat. no. MA0110; Dalian Meilun Biology Technology Co., Ltd.) in a
humidified incubator containing 5% CO2 at 37°C.
Mycoplasma detection was performed on the cells before the
experiment, and HepG2 cells were identified by STR profiling to
determine that there was no cross-contamination of the cells. To
explore the manner in which salusin-α may regulate the
PPARα/ApoA5/SREBP-1c pathway through AdipoR2, after having infected
HepG2 cells with the lentivirus for 24 h, the cells were
coincubated with Complete™ medium containing either the AdipoR2
inhibitor (1 µM thapsigargin; cat. no. T9033;
MilliporeSigma) or the AdipoR2 agonist [20 µM 4-phenyl
butyric acid (PBA); cat. no. 2312-73-4; Sigma-Aldrich; Merck KGaA]
for 24 h (20).
293T cells in the exponential growth phase were
selected for packaging of lentivirus. In this experiment, the
second-generation lentivirus was packaged by liposome transfection.
According to the Simple-Fect Transfection Reagent (cat. no.
profect-01; Wuhan Signal Shuguang Biotechnology Co., Ltd.), 4
µg recombinant plasmid (pHAGE-Salusin-α or
pLKO.1-shSalusin-α#1-3), 3 µg pMD2G plasmid and 1 µg
psPAX2 plasmid were co-transfected into 293T cells to package
lentivirus. The transfected 293T cells were placed into the
5%-CO2 incubator at 37°C for culture. After 24 h of
transfection, the culture medium was changed, and then continued to
be cultured at 37°C. The peak period for 293T cells to produce
lentivirus is 48-72 h after transfection; therefore, the cell
supernatant was collected at 48 and 72 h respectively, and the
cytopathic effect (CPE) was observed under an inverted optical
microscope. After 72 h of transfection, the ability of cells to
produce lentivirus rapidly decreased and a large number of cells
died due to CPE, at which time, the culture could be terminated.
The collected cell supernatants were centrifuged at 4°C, 1,500 × g
for 10 min to remove the cell residue, subsequently filtered with
0.45 µm filter, sub-packaged and stored at -80°C for future
experiments. In addition, 500 µl of the aforementioned
filtered cell supernatant was collected, and the viral RNA was
extracted using the TRIzol™ method (cat. no. 9108; Takara
Biotechnology Co., Ltd.). Given that the pHAGE/pHAGE-Salusin-α and
shMock/pLKO.1-shSalusin-α plasmids carried the specific genes
woodchuck hepatitis virus post-transcriptional regulatory element
(WPRE) and shSalusin-α respectively, the existence of WPRE and
shSalusin-α was confirmed using semi-quantitative (SQ)-PCR
(Table II) and 1.5% agarose gel
electrophoresis (GoldView) to verify the production of this
virus.
Preparation of transmission electron
microscopy (TEM) specimens
After 72 h of culture, precooled 2.5% glutaraldehyde
(cat no. G916054; Shanghai Macklin Biochemical Co., Ltd.) was
directly added to the 293T cells used for packaging without
rinsing, and the cells were fixed for 1 h. The cells were quickly
scooped out with a cell shovel and transferred to a centrifuge
tube. Most of the cellular supernatant was removed by
centrifugation at 4°C, 300 × g for 5 min, leaving ~1 ml of residual
supernatant for gently blowing apart the cells, and then
transferred to 1.5-ml EP tubes. After standing vertically and
allowing the cells to settle naturally for 1 h, the supernatant was
gently discarded, and 1 ml newly precooled 2.5% glutaraldehyde was
slowly added along the tube wall. The cells were then stored in a
refrigerator at 4°C for 2 h, 1% osmic acid fixed at 4°C for 2 h.
Buffer washing and dehydration of 50% pyruvic acid for 15 min was
performed. Epon 812 (cat no. 02662-AB; Structure Probe, Inc.) was
used as a resin embedding agent to embed the sample at 60°C for 36
h, and then a slicer was used to cut the sample into 50 nm.
Subsequently, at room temperature, the sample was dyed with uranium
acetate for 30 min, then with lead citrate for 15 min, and finally
sent to the People's Hospital of Wuhan University for subsequent
TEM experiments.
Determination of lentivirus titer and
MOI
293T cells were inoculated into 12-well plates for
2×10⁵ cells per well, and cultured overnight at 37°C. On
the second day, the cells proliferated to 20-30% fusion density,
and the viral solution stored in the refrigerator at -80°C was
melted in the ice bath, and the cell culture solution containing
DMEM (without serum) was used for gradient dilution as follows: i)
First diluent: 10 µl virus solution + 90 µl culture
medium for virus dilution; ii) Second diluent: 10 µl of
first diluent + 90 µl culture medium for virus dilution;
iii) Third diluent: 10 µl of second diluent + 90 µl
culture medium for virus dilution; iiii) Fourth diluent: 10
µl of third diluent + 90 µl culture medium for virus
dilution. The desired cell hole was selected, the lentivirus
diluent in each tube was gently mixed, 90 µl was added into
each cell hole, and placed into a cell incubator at 37°C for
overnight culture. The control virus with known titer was added
with No. 1-4 diluent, and the sample to be tested was added with
first and second diluent. On the fifth day, the cell state was
observed, the cell density was >80%, and RNA was extracted for
reverse transcription-quantitative PCR (RT-qPCR). After the
lentivirus infected cells successfully, 500 µl TRIzol
solution was added to each well of 12-well plate to extract the
total RNA. After that, RT-qPCR were used to detect the target gene
WPRE and internal reference gene GAPDH (primer sequences are listed
in the Table II). PCR system is
presented in Table III. The
thermocycling conditions for the PCR program were as follows: 95°C
pre-denaturation for 30 sec; denaturation at 95°C for 15 sec;
annealing at 60°C for 60 sec; 40 cycles. Finally, the standard
curve was constructed based on the CT value of WPRE and GAPDH in
the control group and the known virus titer, and then the relative
virus titer was calculated according to the CT value of the
experimental group. The virus titer equals to: The relative virus
titer x dilution multiple.
| Table IIIReal-time fluorescence quantitative
PCR system. |
Table III
Real-time fluorescence quantitative
PCR system.
| Components | Volume
(µl) |
|---|
| Ultra-pure
water | 7.2 |
| 2X SYBR Mix | 10 |
| Upstream primer (10
µM) | 0.4 |
| Downstream primer
(10 µM) | 0.4 |
| Template | 2 |
| Total volume | 20 |
Multiple data have shown that the MOI of HepG2 is
5-10, thus the six MOI gradients of 2, 5, 7, 10, 15 and 20 were
set. Cells in each well of the six-well plate were inoculated at a
density of 8×10⁵. When the density reached 80% the
following day (the number of cells was ~2×10⁶),
according to the formula MOI=(virus titer x added virus volume)/the
number of cells transfected, the corresponding added virus volumes
were calculated to be 0.2, 0.5, 0.7, 1, 1.5 and 2 ml respectively.
Lentivirus was added one by one, and the fresh culture medium was
changed after 12 h. Antibiotics were used for screening and
puromycin (cat no. ST551; Beyotime Institute of Biotechnology) was
diluted to 100 µg/ml (from an initial concentration of 10
mg/ml). Then, according to the manufacturer's instructions,
puromycin was used at a concentration of 3 µg/ml for HepG2
cells and 2 µg/ml for 293T cells (60 µl of diluted
puromycin was added to the six-well plate (2 ml) of HepG2 and 40
µl of diluted puromycin to the six-well plate (2 ml) of 293T
cells]. After 3-5 days of culture, under the microscope, it was
found that the pore cells with 1 ml of virus had a higher survival
rate and favorable cell state, and the pores with >1 ml of virus
had different degrees of black spots, thus the appropriate MOI
value of HepG2 was 10. MOI value of 293T cells was 1.
Lentiviral infection
Before the formal experiment, the collected pHAGE,
shMock and pLKO.1 lentiviruses were used to infect the cultured
293T cells respectively. At the same time, a group of 293T cells
without virus (NC group) was set up, and the expression of
salusin-α in each control group was detected at 48 h after
infection. After that, the formal experiment began. 293T cells in
favorable growth condition were inoculated in sixwell plates at a
density of 1.2×10⁵ cells/well. The next day, after the
cell confluence reached 70%, lentivirus infection was initiated.
According to the titer and MOI detected by the aforementioned
experiments, it was detected that 1 ml of viral stock solution was
the most favorable. Therefore, after the medium in the six-well
plate had been removed, 1 ml of the aforementioned viral solution
and 1 ml fresh complete medium were added to each well, in addition
to polybrene (cat no. BL628A; Biosharp Life Sciences) at a final
concentration of 8 µg/ml in each well. Subsequently, the
six-well plate was placed into the 5%-CO2 incubator at
37°C for culture overnight. After 12 h incubation, the medium was
replaced with fresh culture medium. Transiently infected 293T cells
were collected 24 h after infection, and RT-qPCR (Table II) and WB analyses were then used
to analyze the expression level changes of the target genes and
proteins. The identical method of lentiviral infection was used for
the HepG2 cells as for the 293T cells, with the only difference
that, whereas 293T cells are easily infected and changes in gene
and protein expression can be detected after only 24 h of
infection, for the HepG2 cells the rapid collection of infected
cells 48 h after infection to detect changes in target proteins via
WB analysis was required. Moreover, based on the aforementioned
experimental procedures, in order to explore the manner in which
salusin-α may regulate the PPARα/ApoA5/SREBP-1c pathway through
AdipoR2, after having infected HepG2 cells with the lentivirus for
24 h, the agonist (PBA) and inhibitor (thapsigargin) of AdipoR2
were respectively added, then the expression levels of proteins
associated with lipid metabolism were detected.
SQ-PCR analysis
The core of SQ-PCR is to determine the number of
cycles of the target gene at the exponential amplification period.
In order to determine the number of SQ-PCR cycles of the target
gene, total RNA was extracted from 293T cells that had not been
transfected with the virus using TRIzol™ (cat no. 9108; Takara
Biotechnology Co., Ltd.), and following the instructions of the
reverse transcription kit (cat no. D7170M; Beyotime Institute of
Biotechnology), 1 µg template RNA was reverse-transcribed
into cDNA. PCR Thermocycler (Biometra Tone 96 G; Analytik Jena AG)
was used to PCR-amplify salusin-α (Table II) for multiple rounds, and the
PCR cycle numbers were set to 20, 22, 24, 26, 28, 30 and 32,
respectively. The thermocycling conditions for PCR were as follows:
94°C pre-denaturation for 3 min; denaturation at 94°C for 30 sec;
annealing at 64°C for 30 sec; and extension at 72°C for 30 sec,
completed the cycle number of times, and extended for 5 min at the
end. The method used to find the number of cycles used for AdipoR2
SQ-PCR was consistent with that for salusin-α, except that the
annealing temperature for AdipoR2 was set at 60°C. Subsequently,
the PCR products were electrophoresed (1.5% agarose gels), and the
electrophoretic bands were analyzed using Tanon 1600 Gel Imaging
System (Tanon Science and Technology Co., Ltd.) to determine the
index stage and platform stage of PCR amplification. Subsequently,
PCR was performed for the target gene with the number of cycles at
the exponential stage, and the same number of cycles of PCR was
used for GAPDH (Table II) as the
internal control to eliminate any error caused by sample addition.
Finally, agarose electrophoresis with subsequent imaging in the gel
image system was performed. The brightness of the bands was
observed, and the optical density (OD) of each group of bands was
measured using the Tianneng gel analysis software (biotanon.com). The ratios of the target gene OD
value/GAPDH OD value were used to express the relative expression
level of mRNA, to compare the expression levels of the target genes
in each group.
WB analysis
Control and treatment cells were washed with PBS.
After the cells were lysed on ice with RIPA lysate (cat. no.
MAO151; Dalian Meilun Biology Technology Co., Ltd.) containing PMSF
(cat. no. G2008-1ML; Wuhan Servicebio Technology Co., Ltd.) for 30
min, the cells in each group were respectively collected, and
centrifuged at 4°C (4,500 × g for 10 min) to remove the cell
fragments. Subsequently, the total protein concentration in the
supernatant was measured using a bicinchoninic acid (BCA) kit (cat
no. E-BC-K318-M; Elabscience Biotechnology, Inc.), and the protein
content of each sample was adjusted to the same concentration at 5
µg/µl with PBS. The diluted protein samples were then
mixed with 1X SDS loading buffer solution and denatured at 95°C for
5 min, and SDS-PAGE (either 8 or 10% gels) was used to separate the
proteins, which were subsequently transferred to PVDF membranes
(cat no. IPVH00010l; EMD Millipore). Non-specific binding to the
membranes was blocked with 5% skimmed milk powder (cat no.
1172GR100; BioFRoxx; neoFroxx) for 2 h at room temperature, and the
membranes were subsequently incubated overnight at 4°C with
different primary antibodies, as follows: Anti-salusin-α rabbit
polyclonal antibodies (1:1,000; cat. no. ab232928; Abcam),
anti-AdipoR2 mouse monoclonal antibodies (1:1,000; cat. no.
sc-514045; Santa Cruz Biotechnology, Inc.), anti-PPARα rabbit
polyclonal antibodies (1:1,000; cat. no. ab227074; Abcam),
anti-ApoA5 mouse monoclonal antibodies (1:1,000; cat. no. ab115772;
Abcam), anti-SREBP-1c rabbit polyclonal antibodies (1:1,000; cat.
no. ab28481, Abcam) and anti-GAPDH rabbit polyclonal antibodies
(1:10,000; cat. no. ab9485; Abcam). Subsequently, diluted
horseradish peroxide-labeled secondary antibodies were added as
follows: Goat anti-rabbit IgG (1:50,000; cat. no. ab205718; Abcam)
and goat anti-mouse IgG (1:10,000; cat. no. ab205719; Abcam). The
membranes were incubated on a shaking table at room temperature for
2 h, prior to washing three times using TBST (0.1% Tween). WBs were
visualized using ECL chemiluminescence kit (cat. no. MA0186; Dalian
Meilun Biology Technology Co., Ltd.), and a chemiluminescence
imaging system was used for exposure imaging. Furthermore, the gray
values of the strips were analyzed with ImageJ (V1.8.0.112;
National Institutes of Health), and the gray value ratios of each
group of target strips and internal reference strips were
recorded.
Statistical analysis
All data are expressed as the mean ± standard
deviation. The statistical analysis was conducted using GraphPad
Prism 8 (Dotmatics). All experiments were performed three times.
Prior to the statistical analysis, the normality of data was
examined using the Shapiro-Wilk test. ANOVA was used for normally
distributed data, whereas the Kruskal-Wallis H rank sum test was
used for non-normally distributed data. Depending on the design of
the experiment, the data were analyzed using one-way ANOVA followed
by Tukey's post hoc test. P<0.05 was considered to indicate a
statistically significant difference.
Results
Construction and identification of
recombinant plasmid
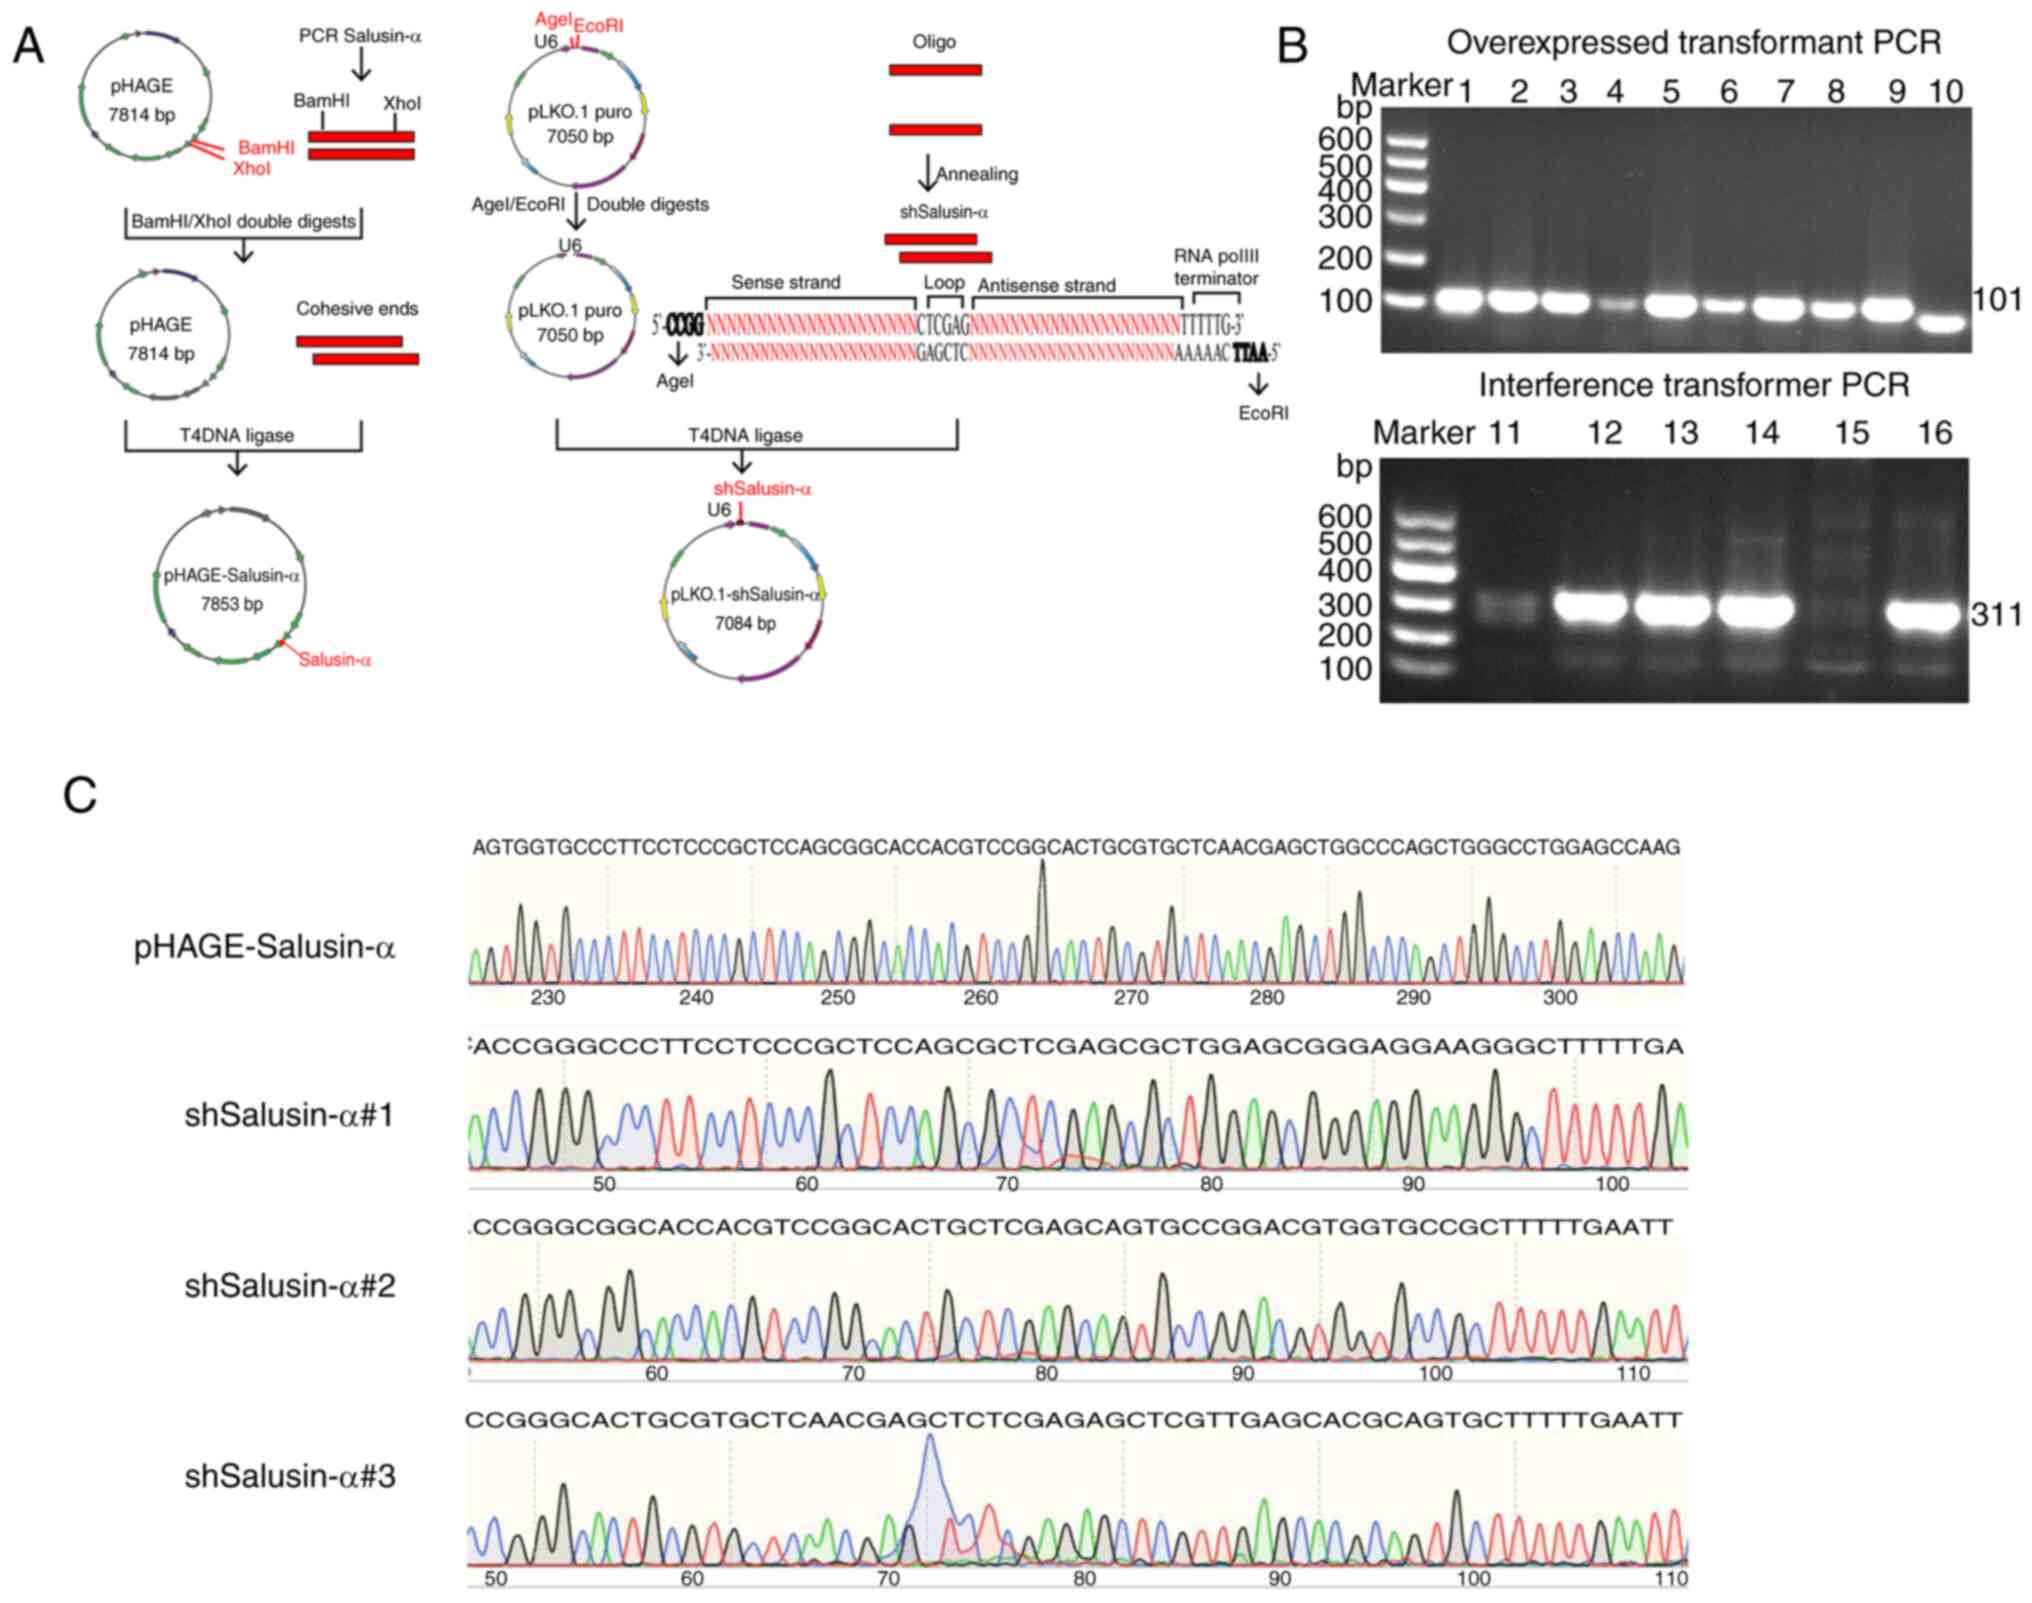
The construction process for the recombinant plasmid
is revealed in Fig. 1A. Positive
clones of the TOP10 E. coli competent cells transfected with
the recombinant plasmids pHAGE-Salusin-α and pLKO.1-shSalusin-α
were selected. The electrophoretic results of the colony PCR
products revealed that there were bands at ~100 and 300 bp,
respectively (Fig. 1B), which was
consistent with the anticipated molecular weights of 101 bp for
salusin-α and 311 bp for shSalusin-α. Subsequently, the sequencing
results of the recombinant plasmids were submitted for BLAST
analysis on NCBI. These data showed that the inserted DNA sequences
of the recombinant plasmids pHAGE-Salusin-α and pLKO.1-shSalusin-α
were completely consistent with salusin-α and the designed
shSalusin-α#1-3, respectively (Fig.
1C), indicating that the shRNA of salusin-α and salusin-α were
accurately inserted into the vectors, and the recombinant plasmids
were successfully constructed.
Identification of the lentivirus and
selection of interfering sequences
pHAGE-Salusin-α and shSalusin-α recombinant plasmids
were co-transfected with the helper plasmids psPAX2 and pMD2G,
respectively, into 70% confluent 293T cells to complete the
packaging of the lentivirus (Fig.
2A). The peak period of packaging and releasing the virus was
48-72 h after transfection. During this period, it was observed
that the 293T cells used to package the lentivirus appeared to
clearly exhibit the CPE, whereas the CPE did not appear in the
cells of the negative control (NC) group (Fig. 2B), indicating that the packaging
of the virus was successful. Similarly, the TEM photos confirmed
that lentivirus particles could be observed in the pHAGE,
pHAGE-Salusin-α, shMock and pLKO.1-shSalusin-α#1-3 groups, but they
were not observed in the NC group (Fig. 2C). Furthermore, according to the
PCR electrophoretic results, there were bands at ~100 and 300 bp
respectively, which were consistent with the expected sizes of 93
and 311 bp for salusin-α and shSalusin-α respectively, suggesting
that the lentivirus packaging was successful (Fig. 2D).
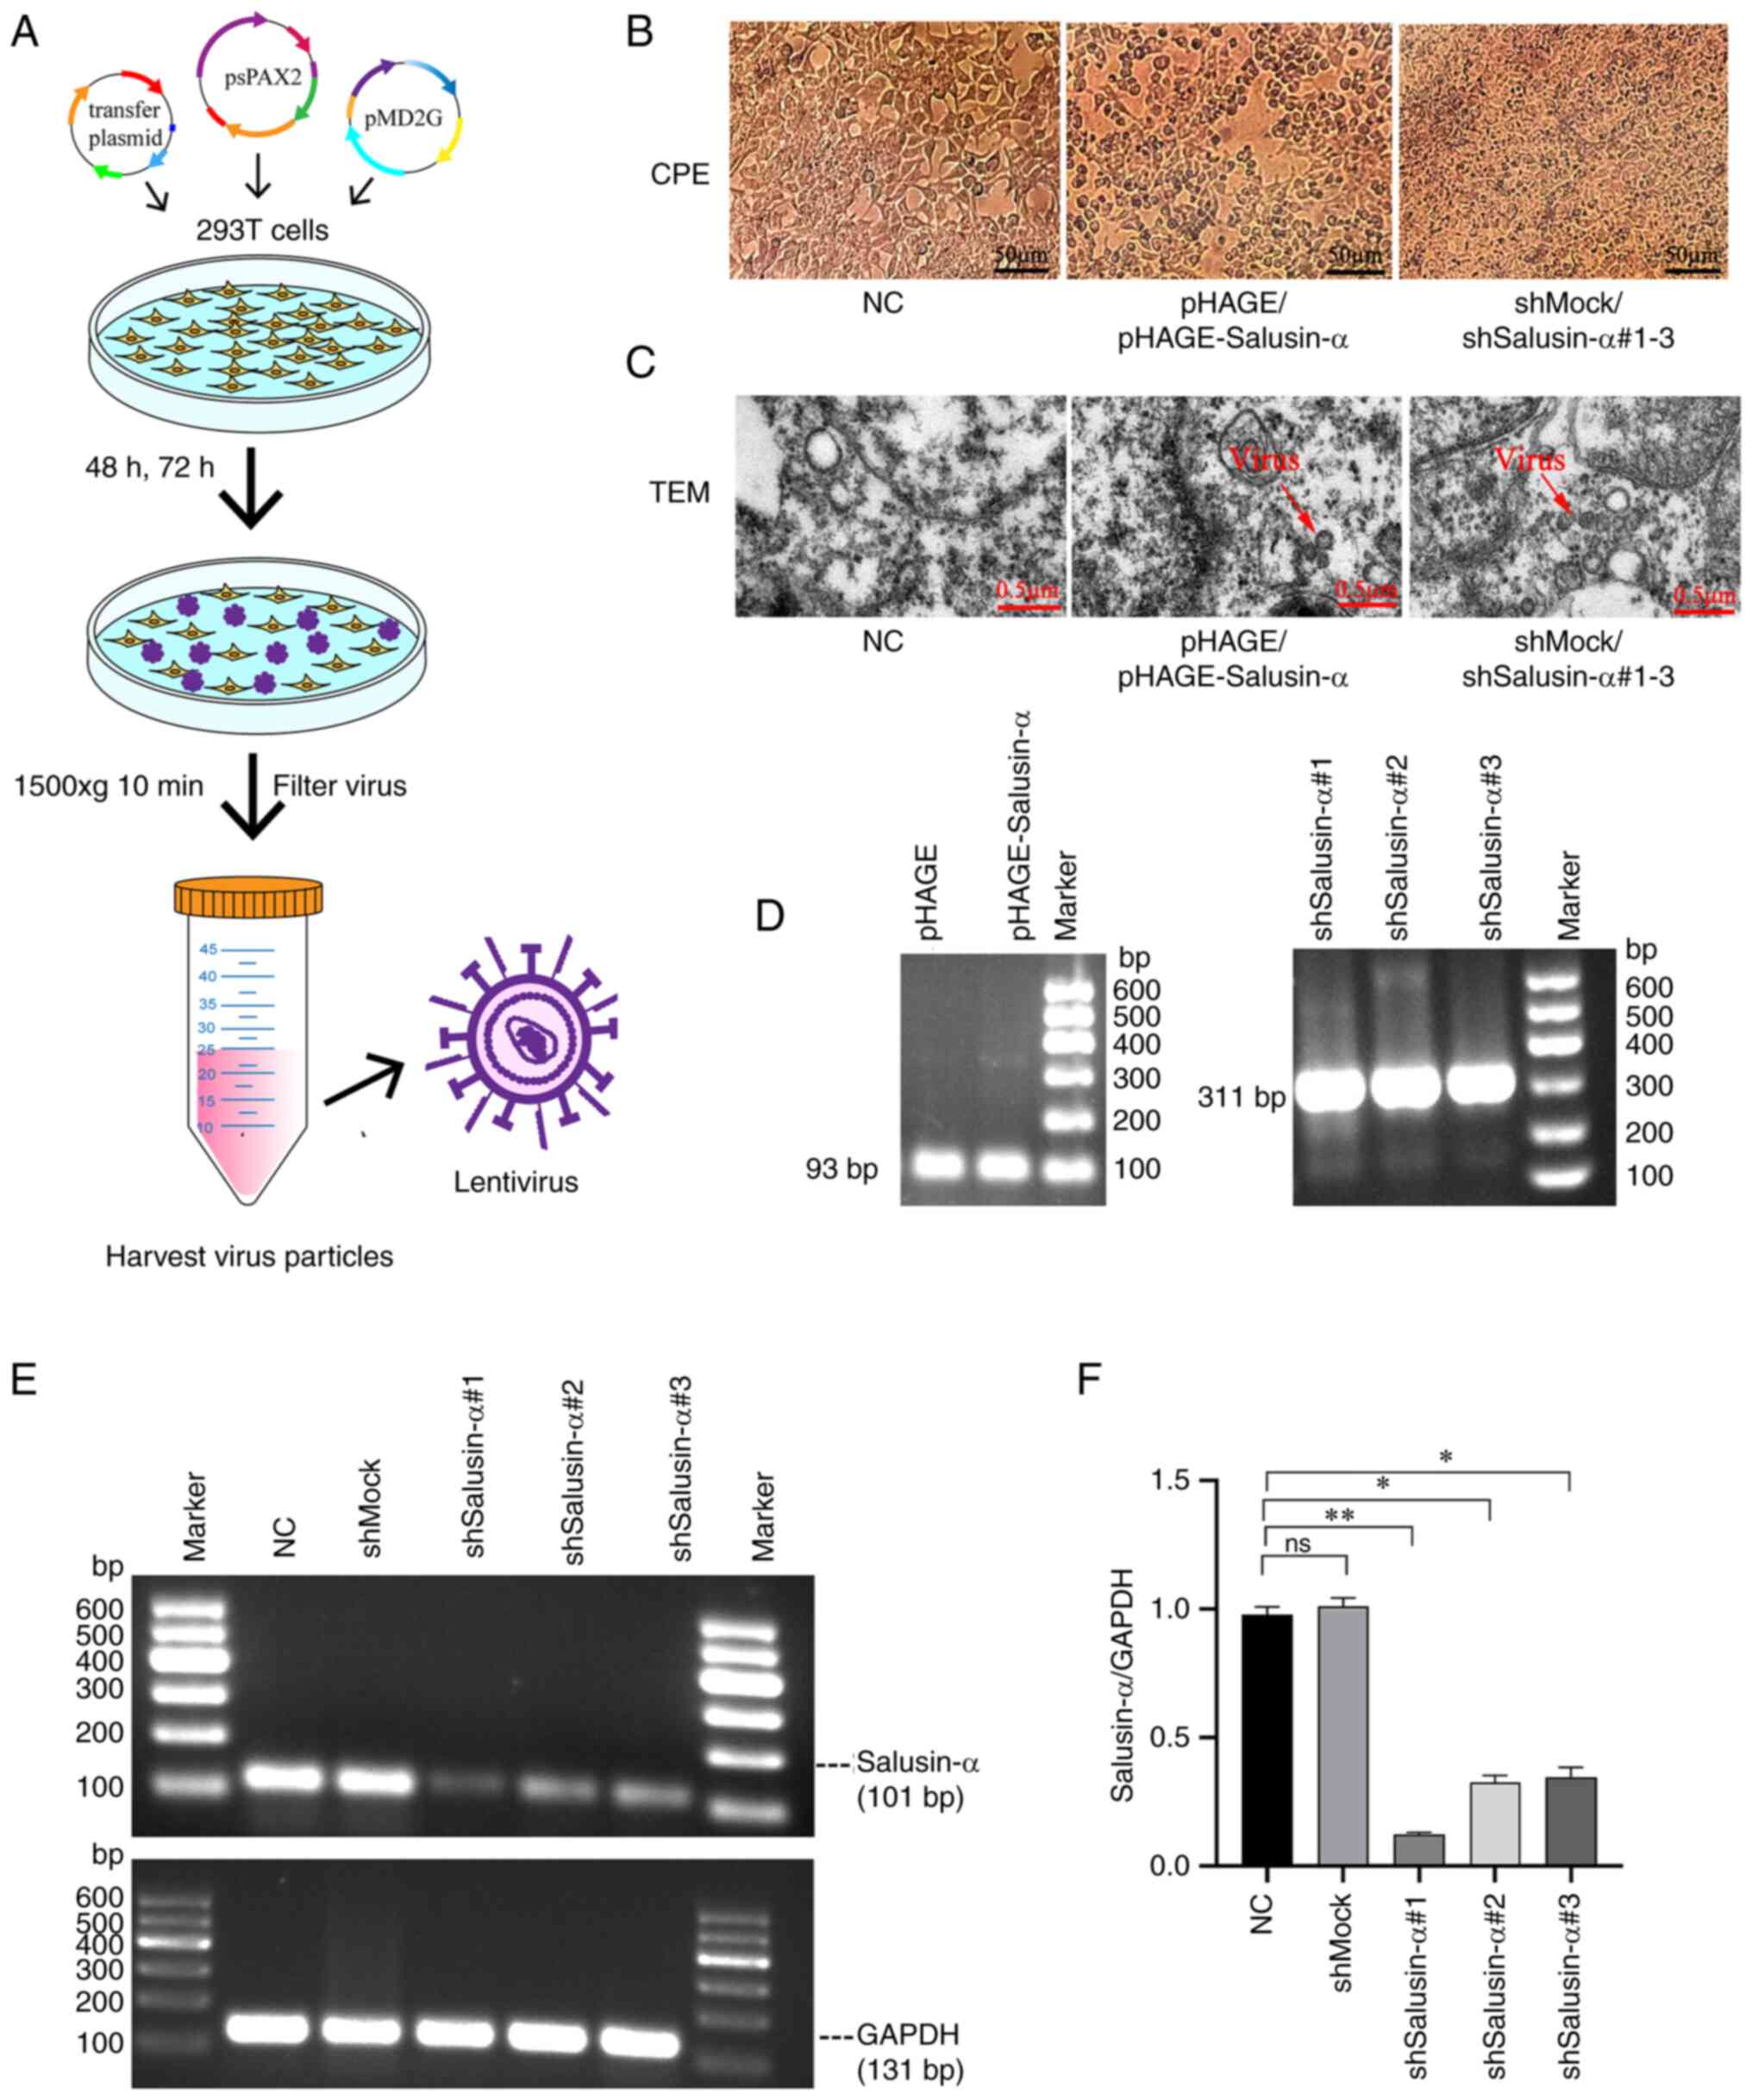 | Figure 2Generation and verification of
lentivirus, and the selection of the interference sequence. (A)
Schematic diagram of the lentivirus packaging process. (B) After 48
h of plasmid transfection, 293T cells in the pHAGE,
pHAGE-Salusin-α, shMock and shSalusin-α#1-3 groups exhibited CPE,
whereas the NC group grew normally without CPE. Scale bar, 50
µm. (C) After 72 h of plasmid transfection, TEM of 293T
cells was performed for each group. The red arrows indicate the
lentiviral particle. No viral particles were observed in the NC
group. Scale bar, 0.5 µm. (D) Graphs of the electrophoretic
results after RNA extraction, reverse transcription and then PCR
from each group of viral fluids. Sizes of 93 and 311 bp for
identified for WPRE and the shSalusin-α#1-3 sequences,
respectively. It should be noted that WPRE is a
post-transcriptional regulatory sequence on the pHAGE plasmid; 293T
cells do not contain this sequence. (E) The interference effect of
pLKO.1-shSalusin-α#1, 2 and 3 was analyzed by semi-quantitative
PCR, and the sequence with the best interference effect was
selected for subsequent experiments by comparing the ratio of
salusin-α/GAPDH. (F) The relative expression levels of salusin-α
gene in 293T cells for each group are shown. Data are presented as
the mean ± SD. *P<0.05 and **P<0.01 by
t-test; ns, no significant difference; NC, negative control;
'shMock' is a meaningless RNA used as a control for shSalusin-α;
shSalusin-α#1-3, pLKO.1-shSalusin-α#1-3 represent interference
salusin-α; pHAGE-Salusin-α represents overexpression salusin-α;
CPE, cytopathic effect; TEM, transmission electron microscopy;
WPRE, woodchuck hepatitis virus post-transcriptional regulatory
element; sh-, short hairpin. |
PCR products with the PCR cycle numbers 20-32 were
detected via electrophoresis. When the cycle number was 22, the
band of salusin-α began to appear, although after cycle numbers 30
and 32, the brightness of the band did not change (data not shown),
indicating that this was the beginning of the plateauing-out
period. Based on these results, 28 cycles were selected as the
number of cycles of SQ-PCR in these experiments for salusin-α. With
the same analytical method, the results revealed that, for AdipoR2,
26 was selected as the number of cycles of SQ-PCR (data not shown).
Subsequently, 293T cells were infected with the synthetic shMock
and pLKO.1-shSalusin-α#1-3 viruses. After 24 h, SQ-PCR was used to
detect gene expression and to evaluate the interference efficiency
of pLKO.1-shSalusin-α#1-3. In the present study, the
electrophoretic band brightness of salusin-α in the
pLKO.1-shSalusin-α#1, 2 and 3 groups was lower compared with that
in the shMock and NC groups, indicating that the designed three
interfering sequences could all inhibit the expression of the
salusin-α gene, but under the same treatment conditions, compared
with the NC and shMock groups, the mRNA level of salusin-α in the
293T cells decreased most significantly in the pLKO.1-shSalusin-α#1
group (P<0.05) (Fig. 2E and
F). Therefore, the pLKO.1-shSalusin-α#1 group was chosen for
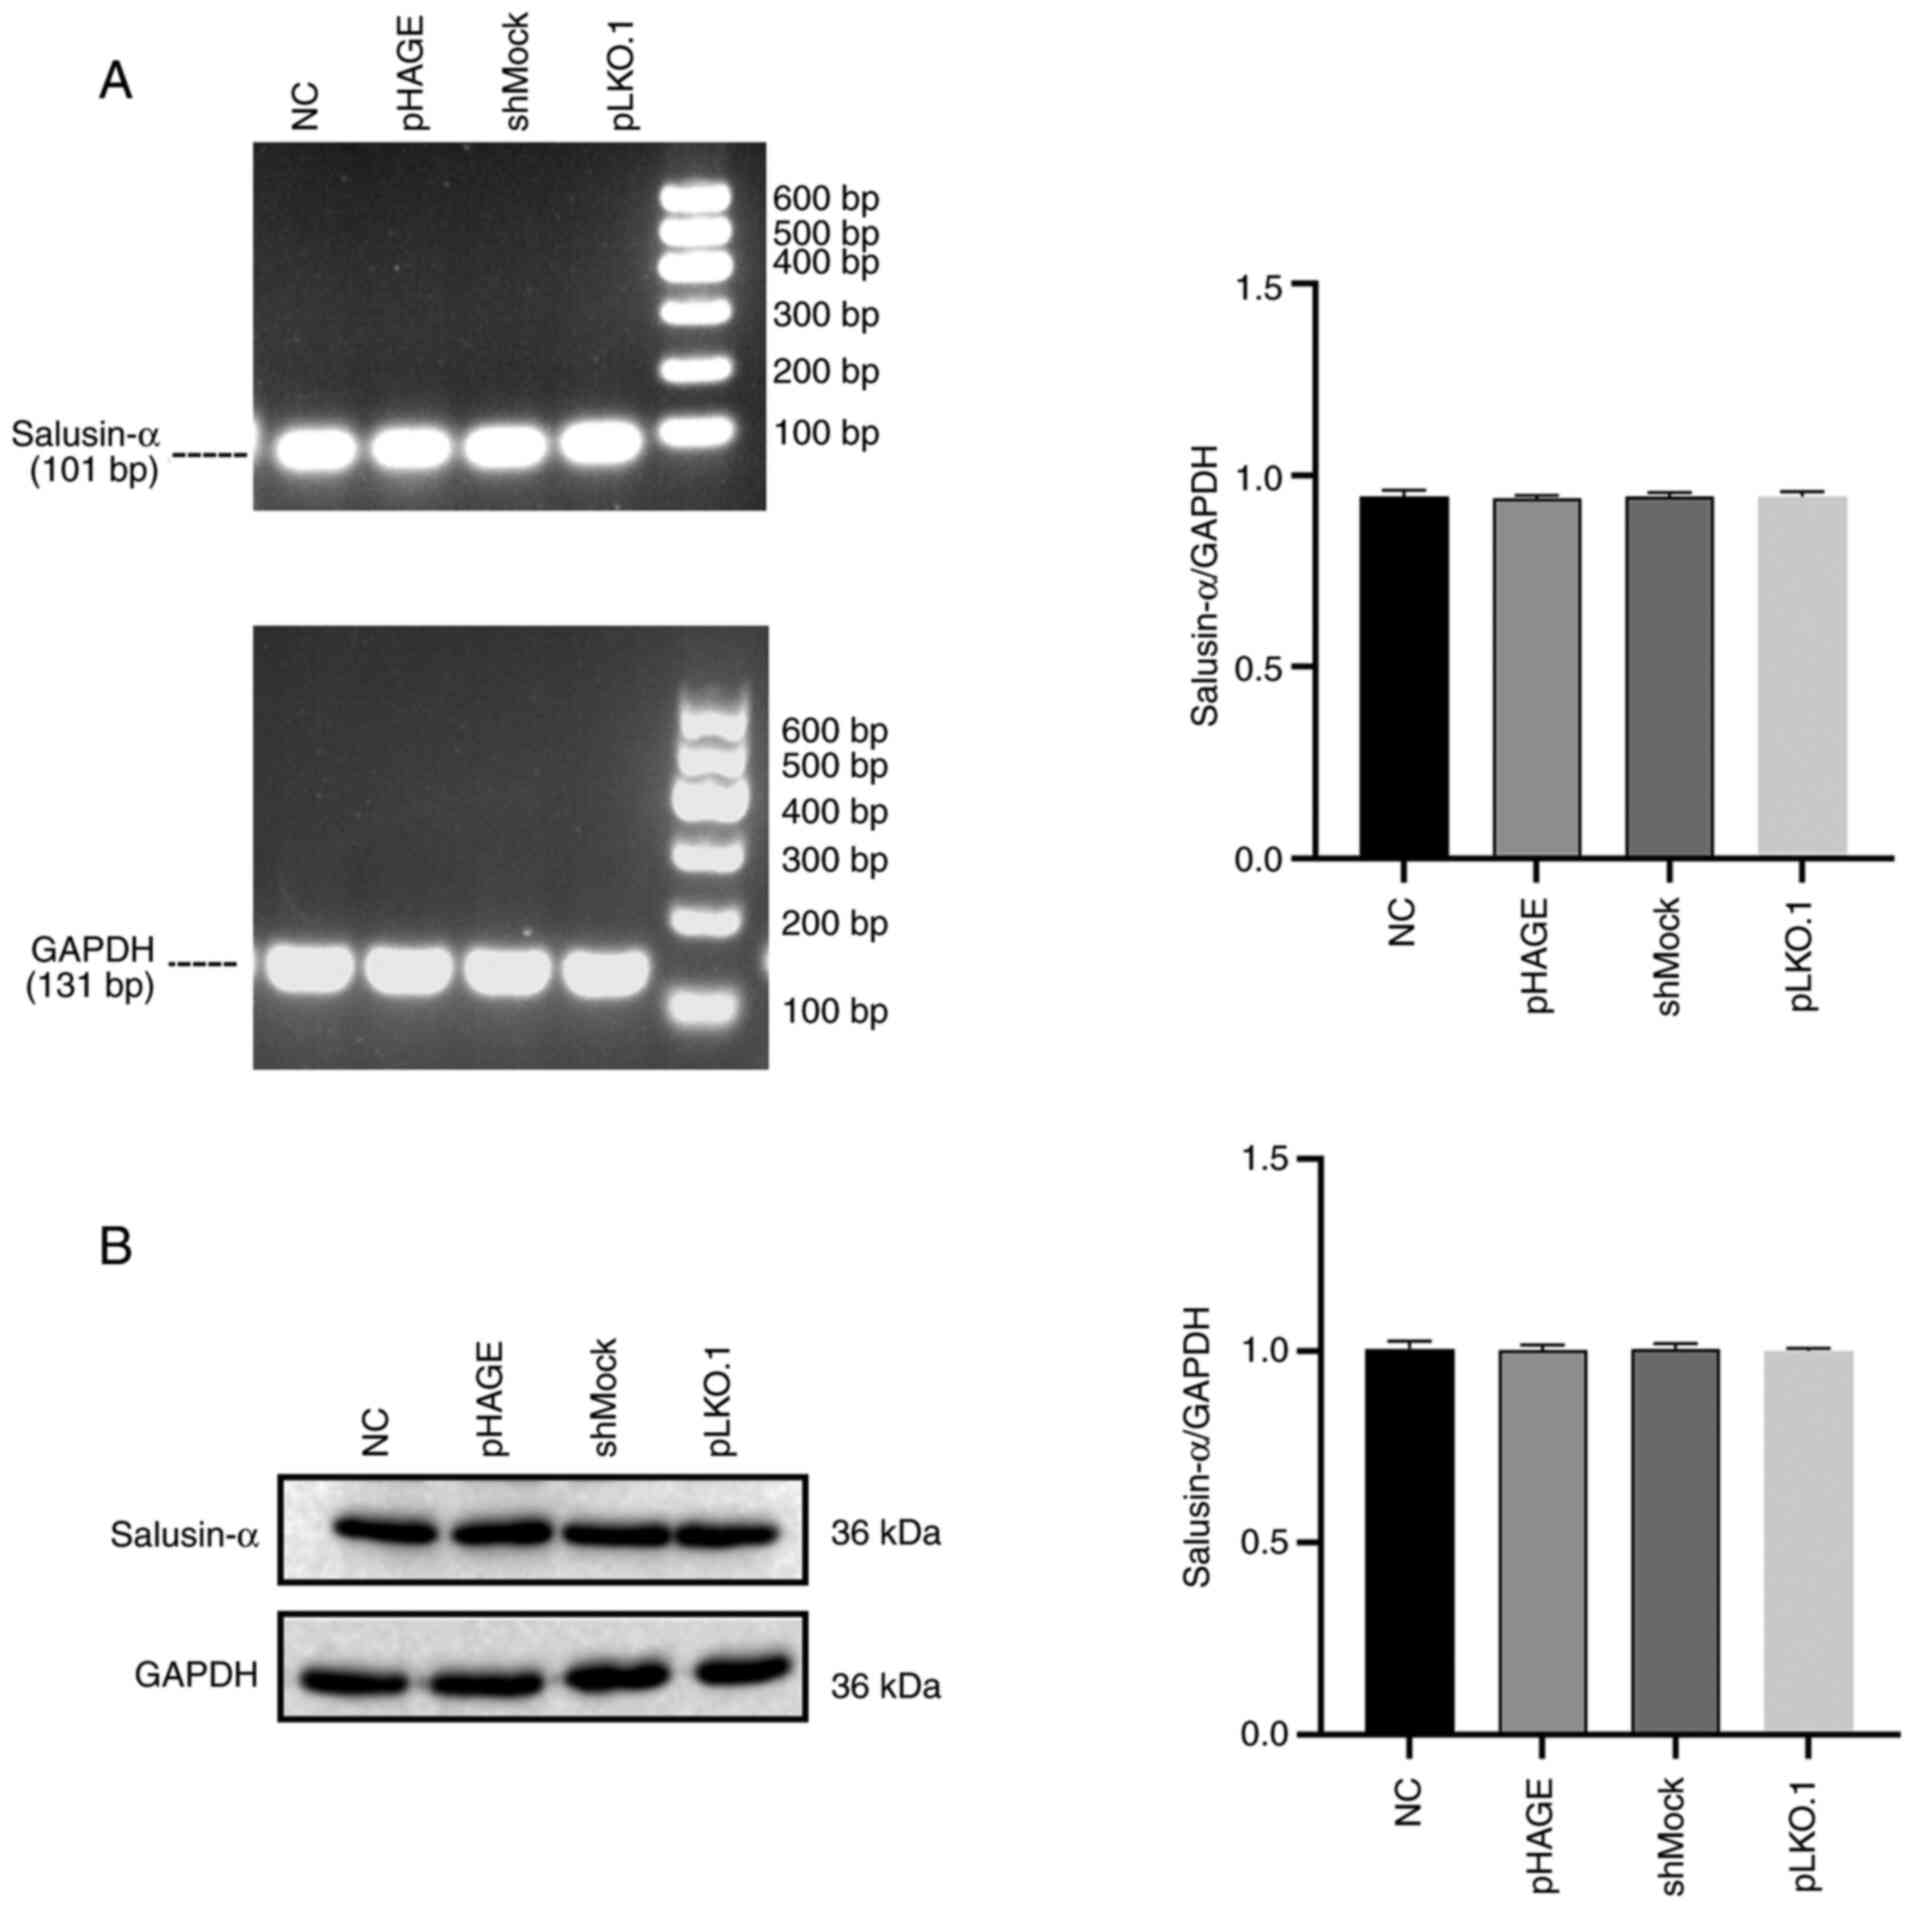
subsequent experiments. Furthermore, comparison results of each
control group demonstrated that there were no significant
difference in the expression level of salusin-α mRNA and protein
among the control groups (Fig. 3,
P>0.05). Therefore, in the next interference experiment, only
shMock was used as the control.
Effects of overexpression and
interference with salusin-α on AdipoR2 expression in 293T
cells
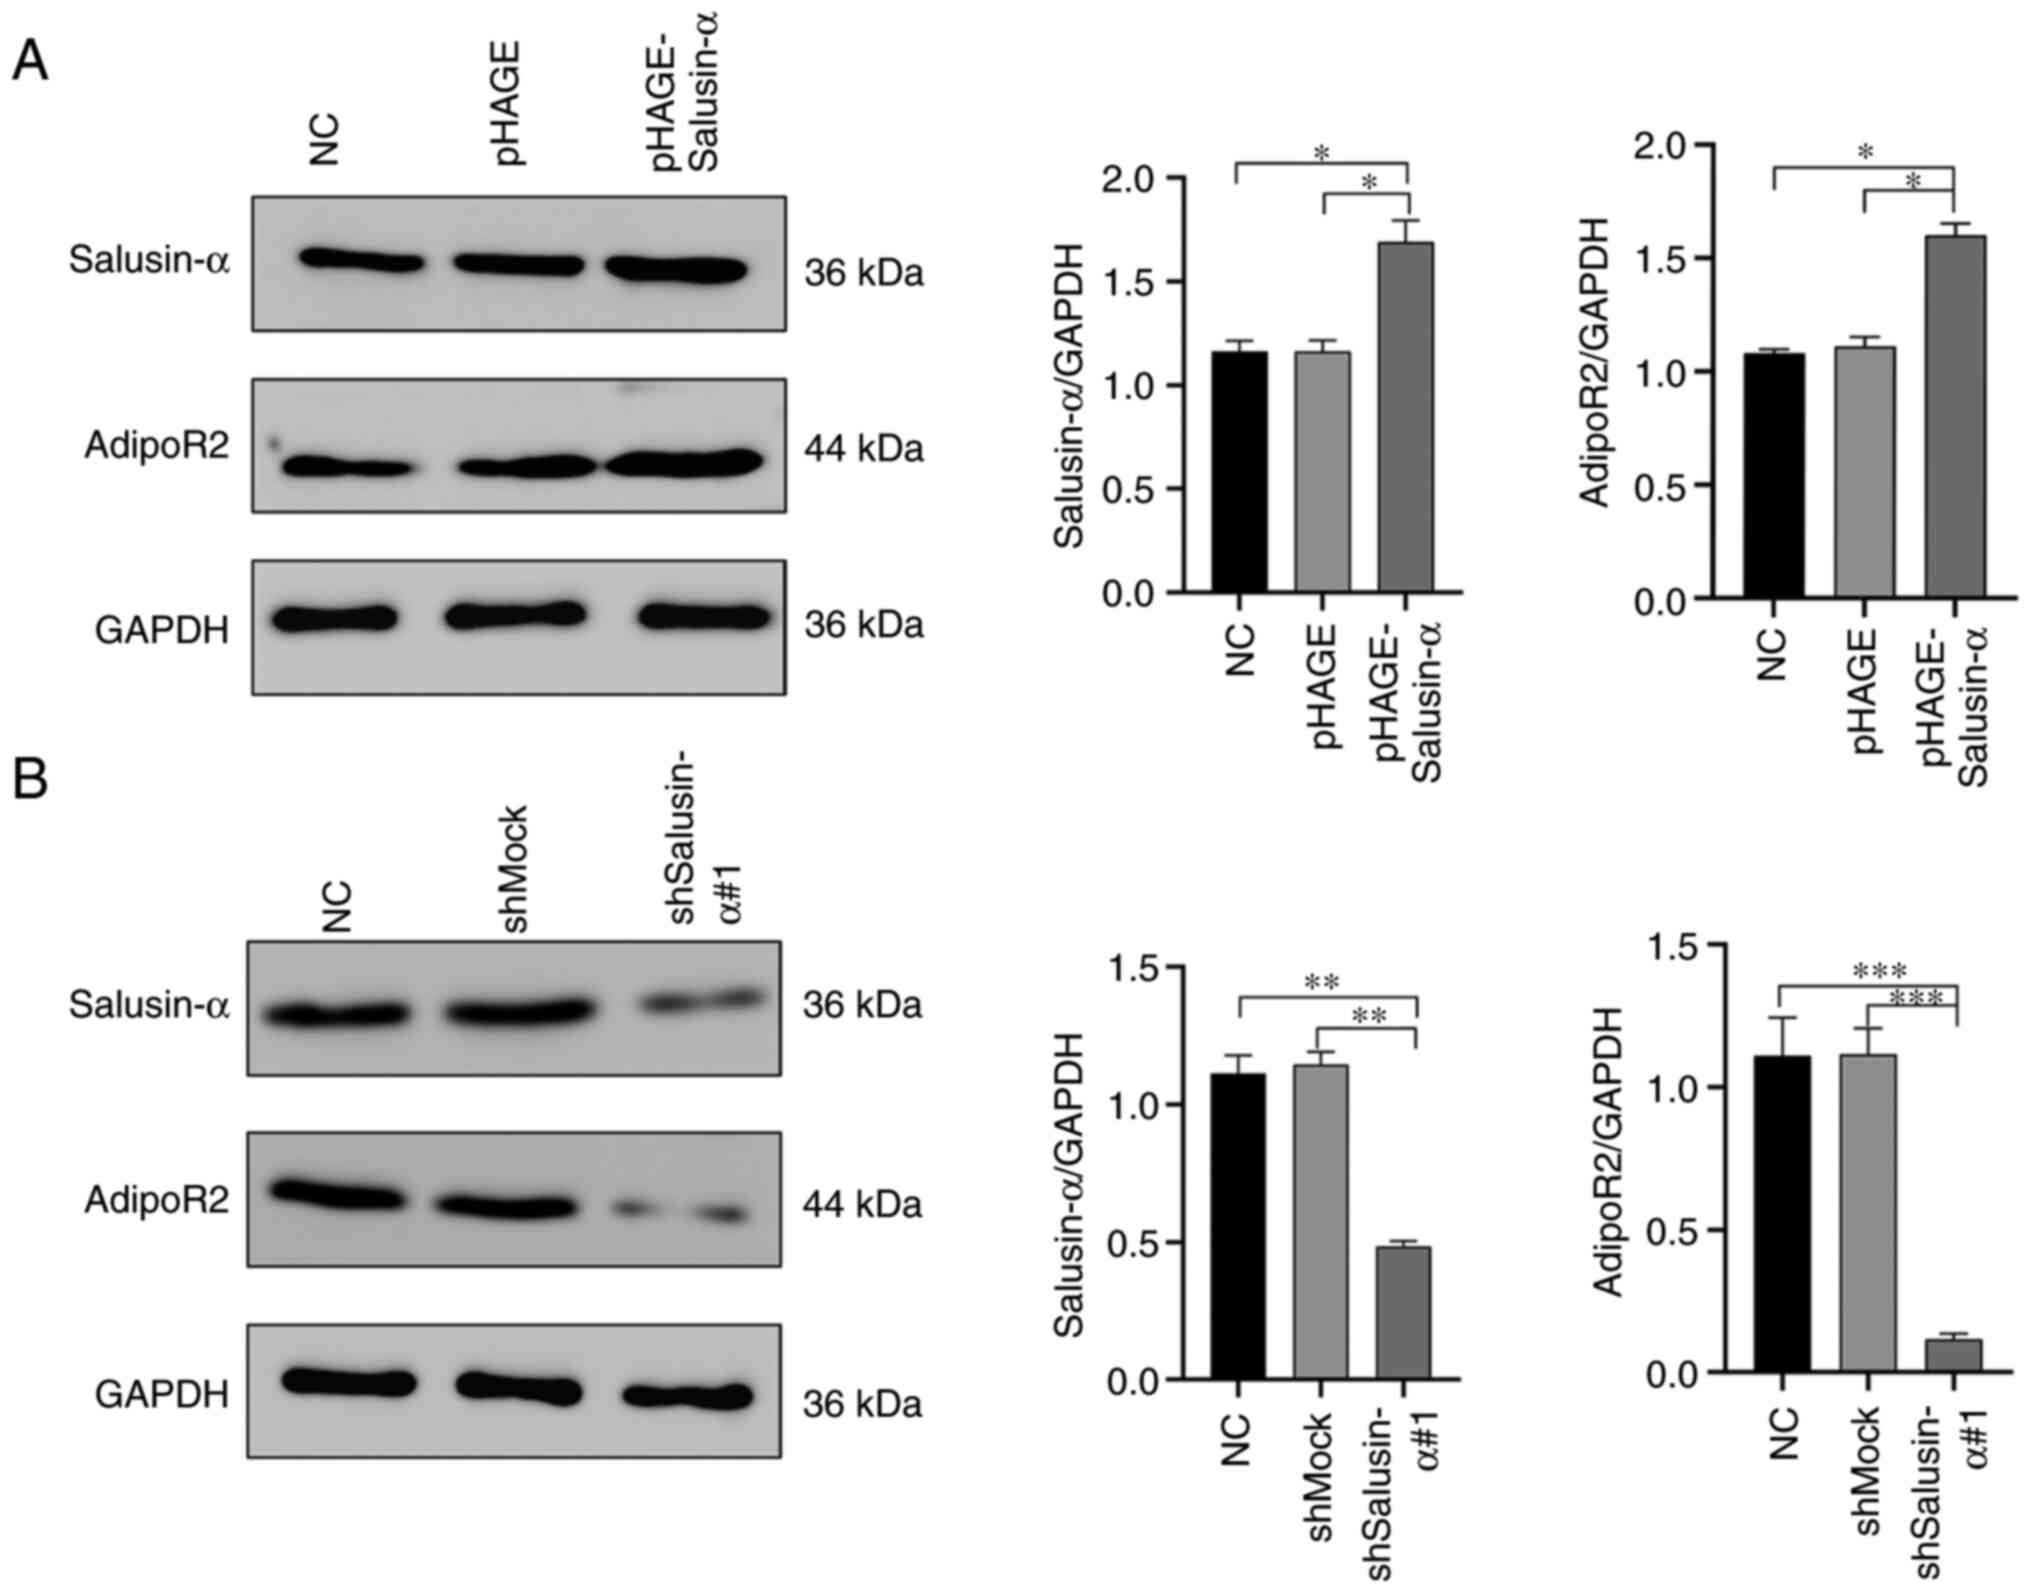
The mRNA and protein expression of salusin-α and
AdipoR2 in the 293T cells were detected by SQ-PCR and WB analysis.
It was clearly revealed that, in the cells infected with
pHAGE-Salusin-α virus, the expression levels of salusin-α mRNA and
protein were significantly increased (P<0.05), as well as the
expression levels of AdipoR2 mRNA and protein (Fig. 4A and B). On the other hand, in the
cells infected with pLKO.1-shSalusin-α virus, the mRNA and protein
levels of salusin-α were significantly reduced (P<0.05),
resulting in a significant inhibition of the expression of AdipoR2
(Fig. 4A and C). However, these
changes were not observed in the NC, pHAGE or shMock groups
(Fig. 4). Collectively, these
results demonstrated that salusin-α has a positive regulatory
effect on AdipoR2.
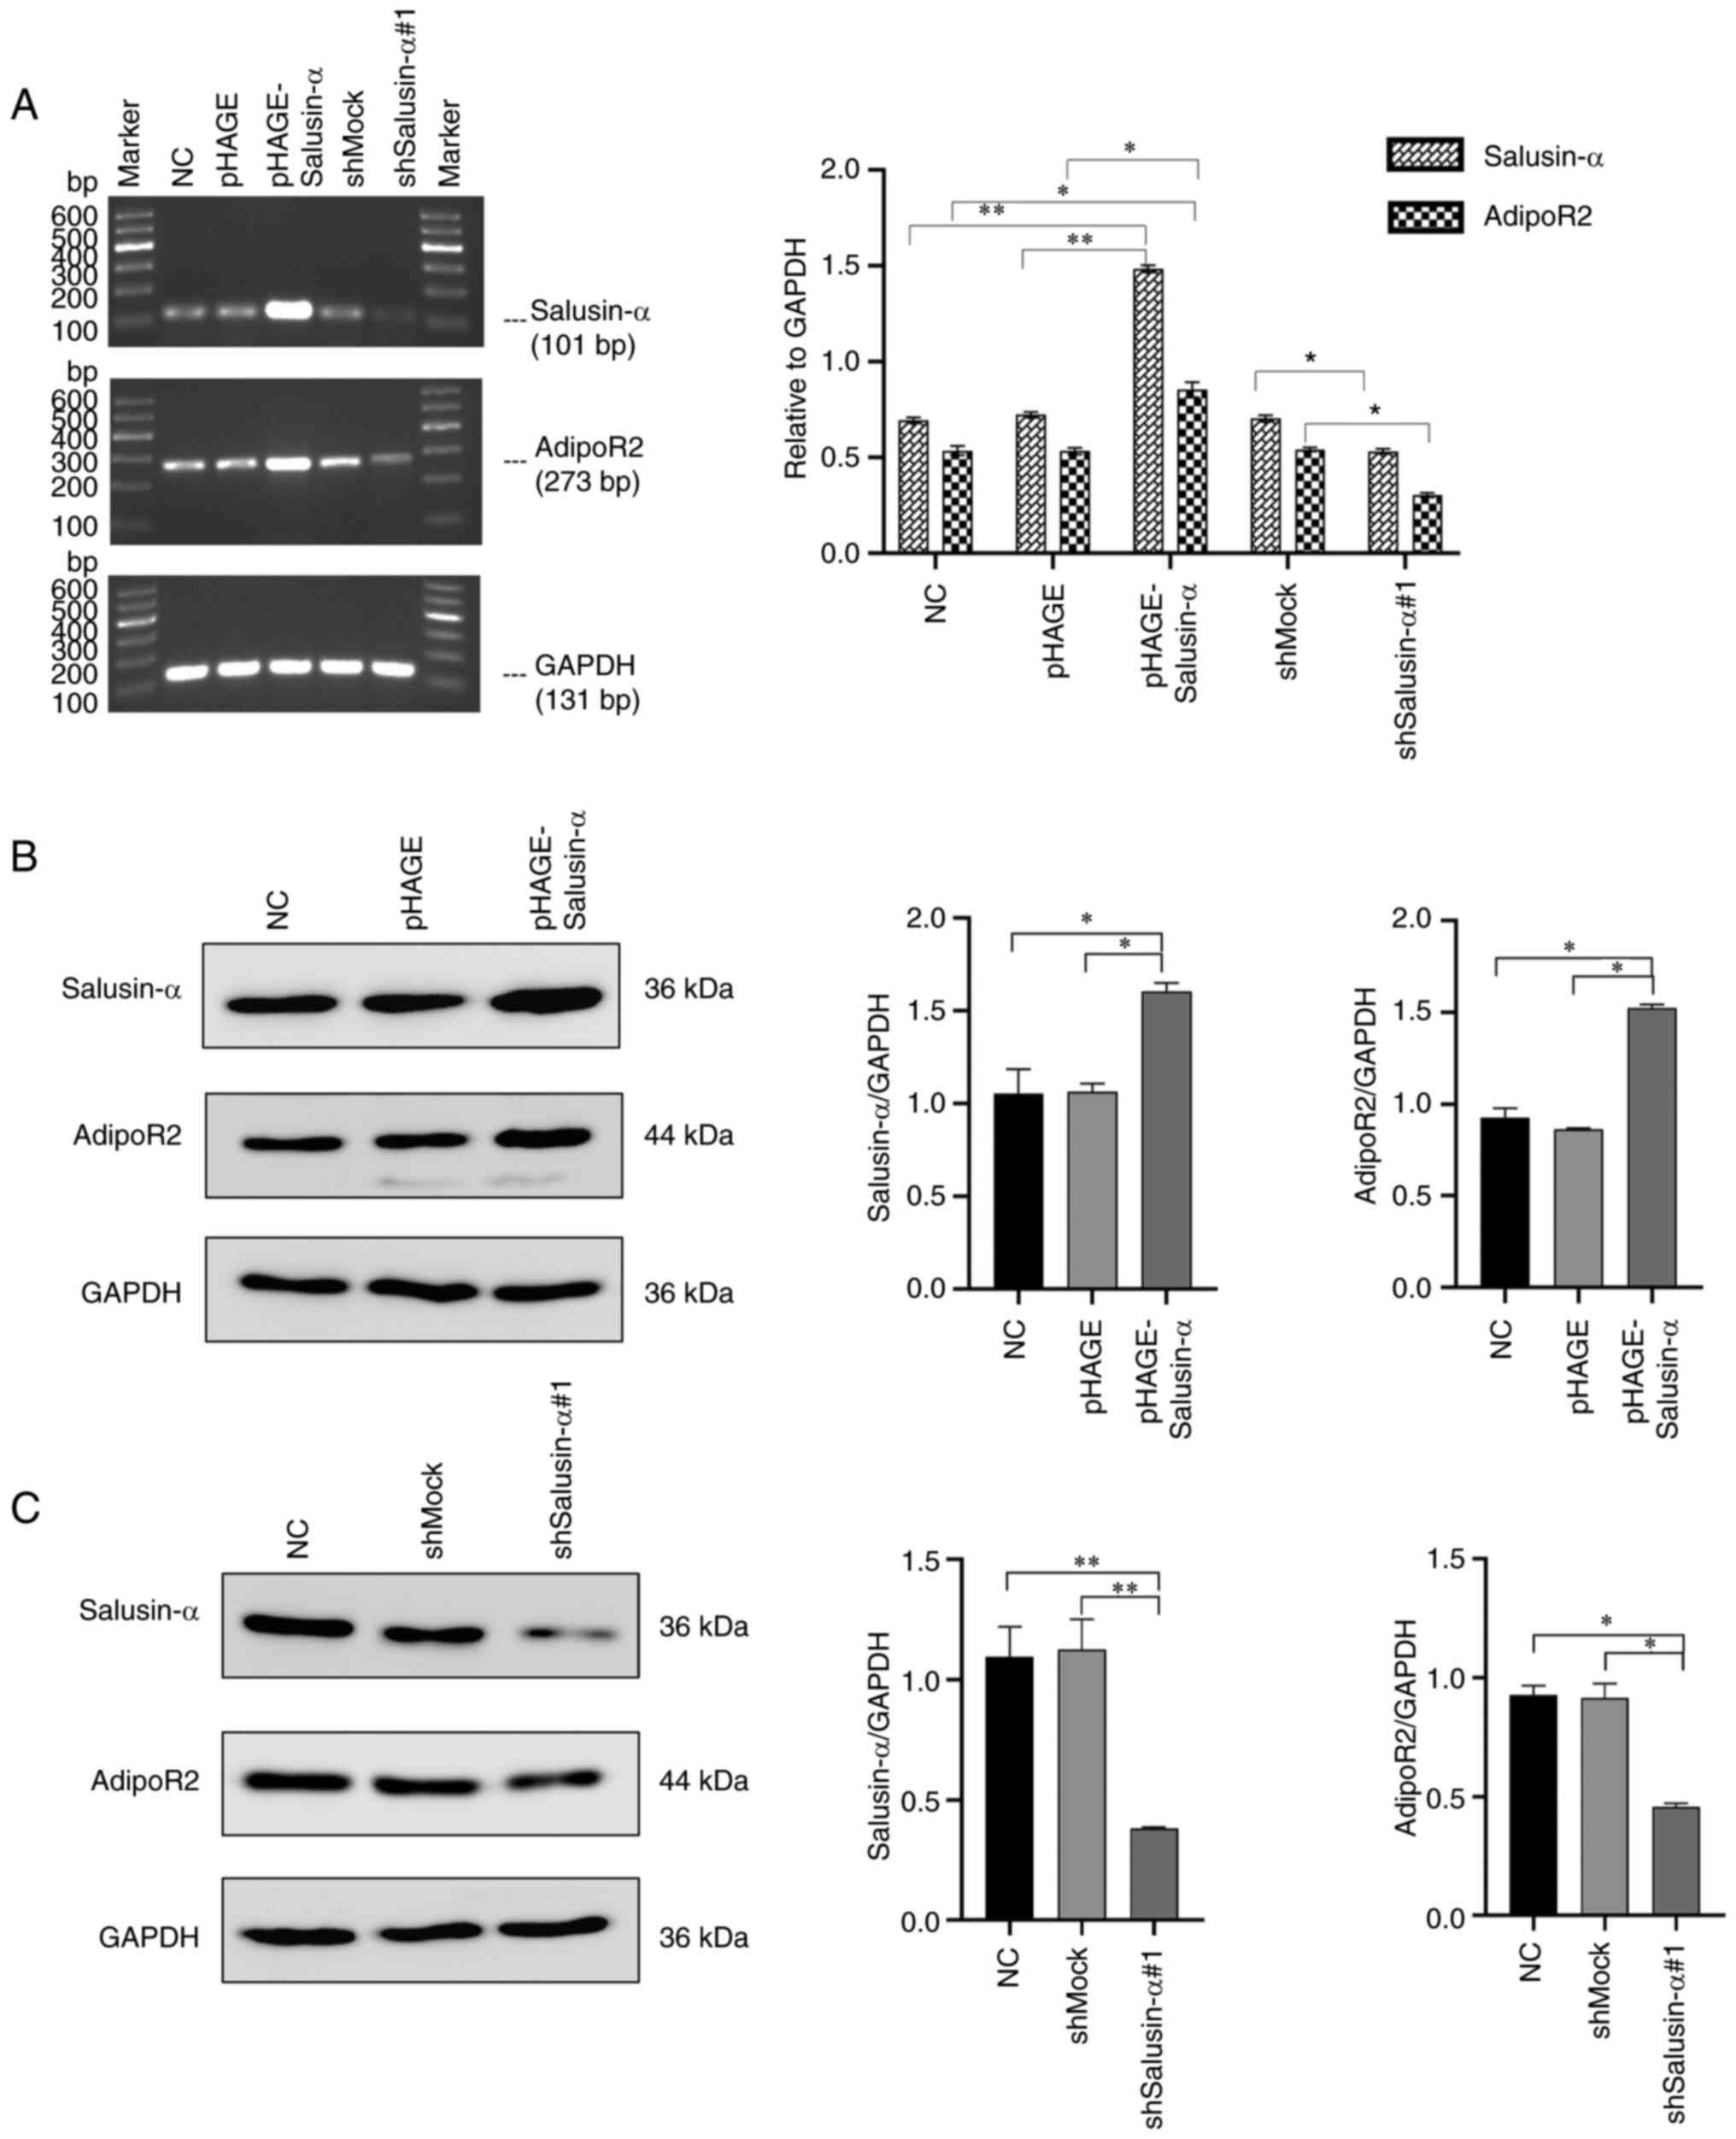 | Figure 4Overexpression or interference of
Salusin-α in 293T cells upregulates or inhibits the expression of
AdipoR2. (A) After infecting the cells with lentivirus for 24 h,
the relative expression levels of salusin-α and AdipoR2mRNA in the
293T cells of each group were detected by semi-quantitative PCR.
(B) After infection with overexpression salusin-α lentivirus for 24
h, WB was used to detect the relative expression level of salusin-α
and AdipoR2 protein in 293T cells of each group. Data are shown as
the mean ± SD. (C) After infection with interference salusin-α
lentivirus for 24 h, WB was used to detect the relative expression
level of salusin-α and AdipoR2 protein in 293T cells of each group.
Data are presented as the mean ± SD. *P<0.05 and
**P<0.01 by t-test. AdipoR2, adiponectin receptor 2;
WB, western blotting; NC, negative control; shMock, a meaningless
RNA as a control for shSalusin-α; shSalusin-α#1,
pLKO.1-shSalusin-α#1, representing interference salusin-α;
pHAGE-Salusin-α, represents overexpression salusin-α; sh-, short
hairpin. |
Effects of overexpression and
interference with salusin-α on AdipoR2 protein expression in HepG2
cells
Subsequently, given the aforementioned results
wherein the association between salusin-α and AdipoR2 in 293T cells
was studied, and since hepatocytes have an important role in
regulating lipid metabolism and salusin-α and AdipoR2 are both
involved in lipid metabolism, HepG2 cells were chosen to explore
further the association between salusin-α and AdipoR2. The cultured
HepG2 cells were infected with pHAGE-Salusin-α,
pLKO.1-shSalusin-α#1 and the control virus. After culturing for 48
h, the cells were collected for WB detection. As expected, in this
experiment, compared with the non-infected NC group and the
infected pHAGE or shMock virus groups, the expression level of
AdipoR2 in the HepG2 cells infected with pHAGE-Salusin-α increased
significantly (Fig. 5A), whereas
the opposite results were obtained in the pLKO.1-shSalusin-α#1
group (Fig. 5B) (all P<0.05).
Furthermore, no significant differences were observed among the NC,
pHAGE and shMock groups for AdipoR2 expression in HepG2 cells
(P>0.05).
Effects of overexpression and
interference of salusin-α on the PPARa-ApoA5/SREBP-1c pathway via
regulating AdipoR2
In order to further explore whether overexpression
of salusin-α can activate the PPARα/ApoA5/SREBP-1c signaling
pathway via the regulation of AdipoR2, thereby inhibiting lipid
metabolism in HepG2 cells, the effects of overexpression or
interference of salusin-α on the expression levels of PPARα, ApoA5
and SREBP-1c by were detected using WB analysis. As demonstrated in
Fig. 6A, compared with the NC
group, the overexpression of salusin-α led to a significant
increase in the expression levels of PPARα and ApoA5in HepG2 cells,
although the expression level of SREBP-1c was opposed to PPARα and
ApoA5. However, in the pLKO.1-shSalusin-α#1 group, the expression
levels of PPARα and ApoA5 were clearly inhibited, whereas the
expression of SREBP-1c was moderately increased (Fig. 6B). No significant differences were
observed in the expression levels of these proteins in the NC,
pHAGE or shMock groups (Fig. 6).
Furthermore, it is noteworthy that the changes in the intracellular
protein levels after adding thapsigargin and PBA conformed with the
anticipated results. After adding thapsigargin to the
pHAGE-Salusin-α group, the expression of AdipoR2 was significantly
decreased compared with the pHAGE-Salusin-α group without
thapsigargin treatment, as well as the protein levels of PPARα and
ApoA5, although the SREBP-1c protein level increased, reversing the
changes of these protein levels caused by the increase in salusin-α
protein level (Fig. 6A). However,
co-incubation of PBA with HepG2 cells infected with
pLKO.1-shSalusin-α#1 led to a clear increase in the expression
levels of AdipoR2, PPARα and ApoA5, although the levels of SREBP-1c
protein decreased, which were the opposite of the changes of these
protein levels caused by the decrease of salusin-α protein level
(Fig. 6B). Taken together, these
data clearly confirmed that overexpression of salusin-α could
inhibit lipid metabolism in HepG2 cells through upregulating
AdipoR2 expression to activate the PPARα-ApoA5/SREBP-1c signaling
pathway.
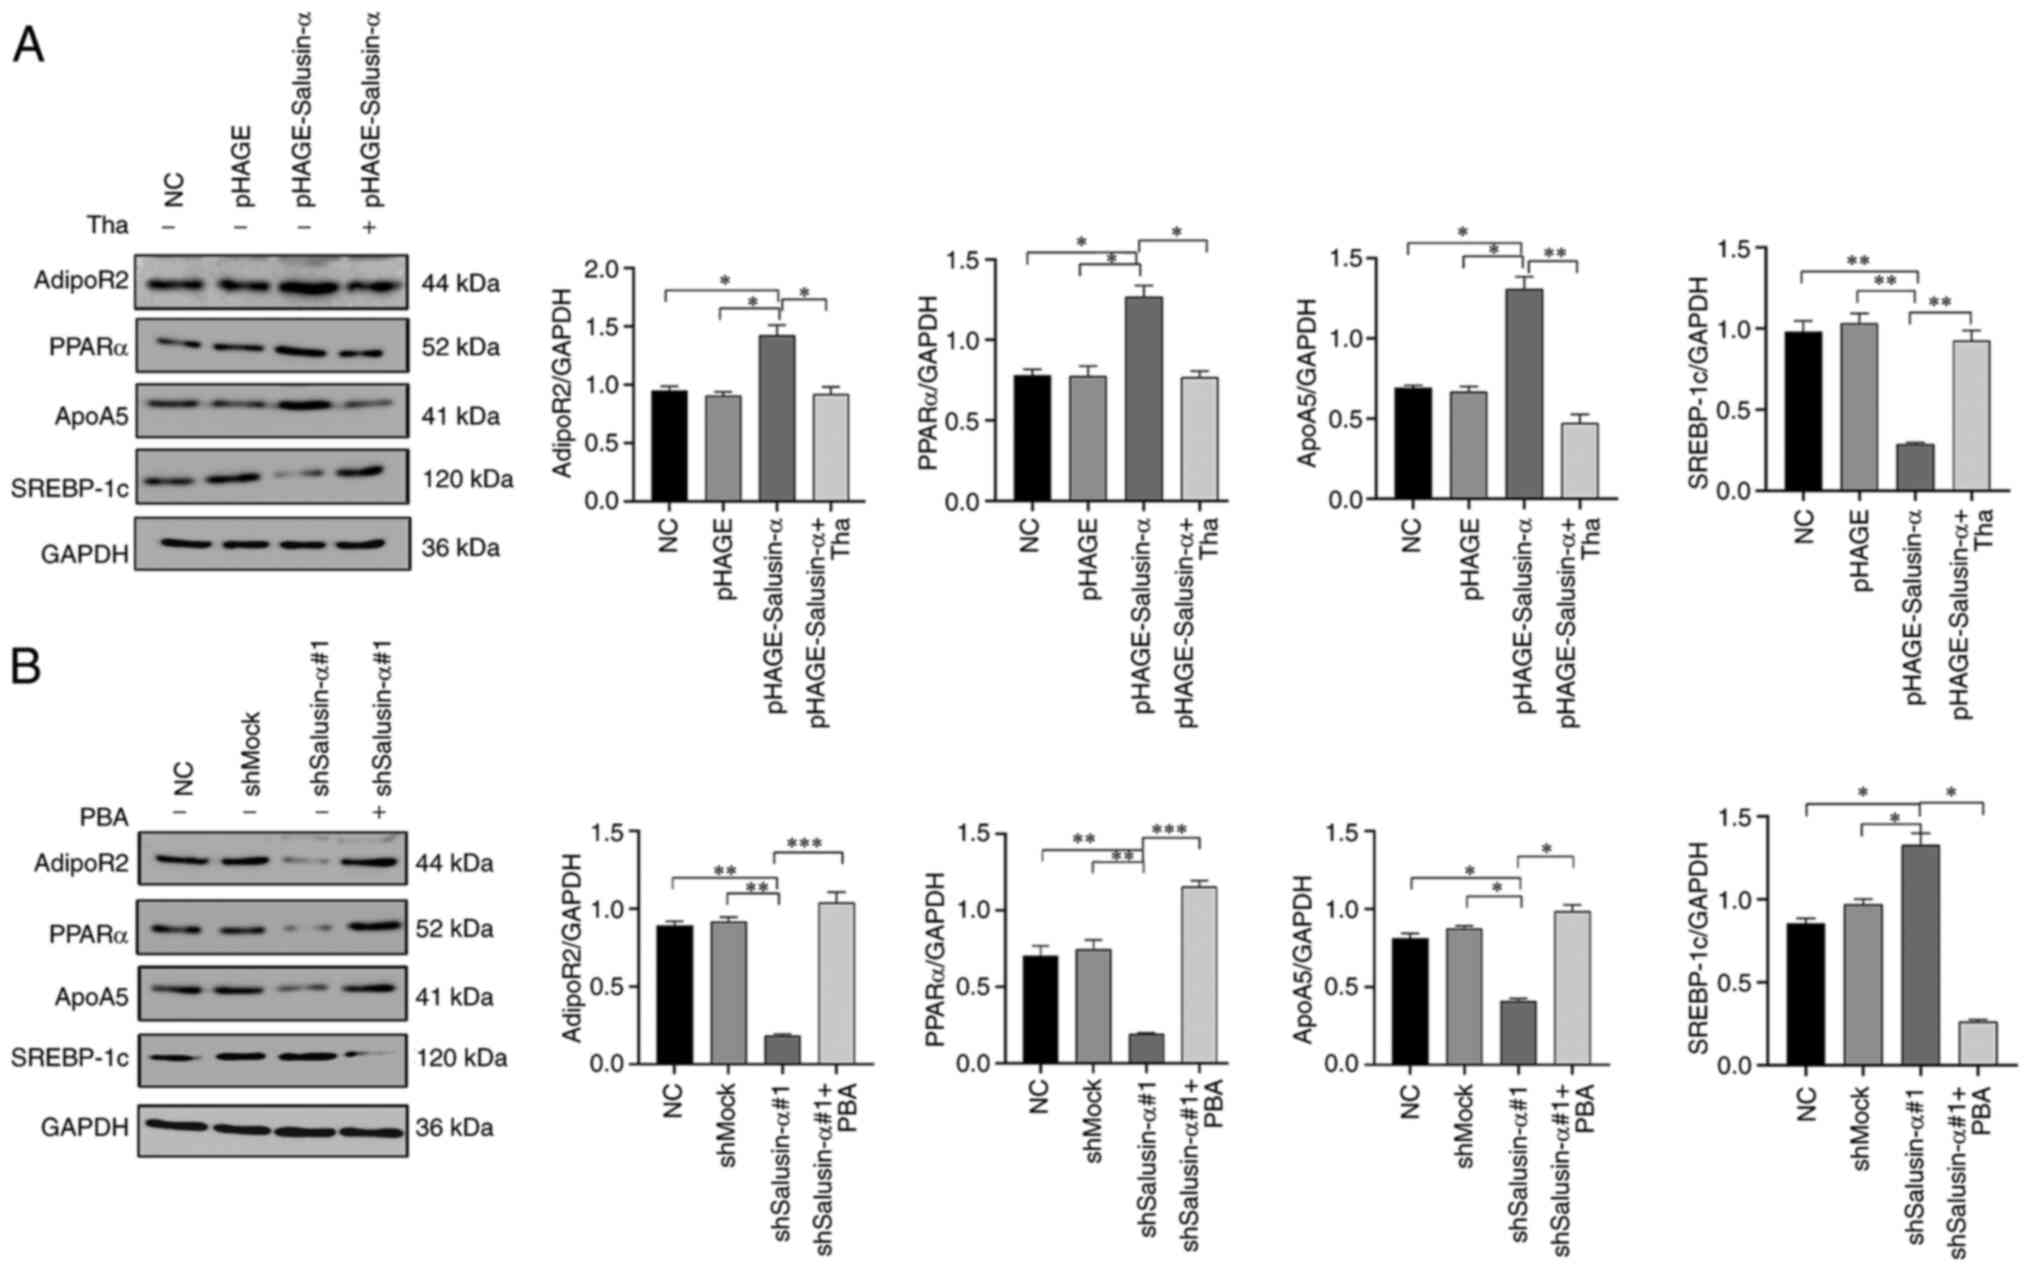 | Figure 6Effects of Salusin-α overexpression
or interference on the levels of AdipoR2, APPRα, ApoA5 and
SREBP-1c. (A) HepG2 cells were transfected with pHAGE and
pHAGE-Salusin-α. Two groups of HepG2 cells infected with
pHAGE-Salusin-α, after 24 h of culture, one of the pHAGE-Salusin-α
groups was treated with Tha for 24 h, whereas the other groups were
continued to cultivate and remained unchanged. WB analysis detected
the changes in the levels of AdipoR2, PPARα, ApoA5 and SREBP-1c
proteins. (B) HepG2 cells were transfected with shMock and
shSalusin-α#1. Two groups of HepG2 cells infected with
shSalusin-α#1, then after 24 h, one of the shSalusin-α#1 groups was
treated with PBA for 24 h, whereas the other groups were continued
to cultivate and remain unchanged. WB analysis detected the changes
in the protein levels of AdipoR2, PPARα, ApoA5 and SREBP-1c. The
data are presented as the mean ± SD. *P<0.05,
**P<0.01 and ***P<0.001 by t-test. NC,
negative control; shMock, a meaningless RNA as a control for
shSalusin-α; shSalusin-α#1, pLKO.1-shSalusin-α#1, representing
interference salusin-α; pHAGE-Salusin-α, representing
overexpression salusin-α; Tha, thapsigargin; PBA, 4-phenyl butyric
acid; AdipoR2, adiponectin receptor 2; PPARα, peroxisome
proliferator-activated receptor-α; ApoA5, apolipoprotein A5;
SREBP-1c, sterol regulatory element-binding transcription factor 1;
sh-, short hairpin. |
Discussion
Salusin-α and adiponectin are two bioactive peptides
that are associated with lipid metabolism. Previous studies have
shown that adiponectin activates PPARα by binding with AdipoR2,
thereby effecting changes in downstream molecules associated with
lipid synthesis (9,17,18). Notably, salusin-α has also been
shown to cause an increase in the expression of PPARα signaling
molecules in hepatocytes, thereby inhibiting lipid synthesis in
hepatocytes (19). However, to
date, few studies have reported on whether salusin-α can elicit
changes in PPARα mediated through AdipoR2. In the present study,
for the first time to the best of our knowledge, the association
between salusin-α and AdipoR2 was explored by synthesizing
overexpression and interfering salusin-α lentivirus vectors in 293T
cells, which revealed that salusin-α overexpression could
upregulate AdipoR2, leading to the activation of the
PPARα/ApoA5/SREBP-1c signaling pathway to inhibit lipid synthesis
in HepG2 cells.
In recent years, salusin-α and adiponectin are two
vasoactive peptides that have been found to inhibit
atherosclerosis. A previous study showed that dyslipidemia is an
important risk factor for atherosclerosis (21). It is well-established that the
liver fulfills important roles in the processes of lipid
metabolism. Excessive cholesterol and lipid accumulation will lead
to a liver overload, resulting in liver lipid metabolism disorder
and forming fatty liver, which then induces atherosclerosis
(19,22,23). Therefore, how to interfere with
that lipid metabolism disorder, thereby inhibiting lipid
accumulation in liver cells and to prevent fatty liver and
atherosclerosis, is a current 'hot spot' in clinical research.
PPARα is a signaling molecule that is associated with lipid
metabolism in liver cells, and regulated by adiponectin through
AdipoR2 (24). A large number of
studies have shown that AdipoR2 is predominantly expressed in the
liver, mainly acting on PPARα (9,17,18,25). However, salusin-α inhibits lipid
synthesis in hepatocytes through PPARα (19), although it remains unclear whether
salusin-α regulation could affect PPARα via AdipoR2. It was
surmised that salusin-α could regulate lipid metabolism by AdipoR2;
therefore, in these experiments, differently from the previous
injection of salusin-α protein into mice (19), the lentivirus system was used to
transfer the salusin-α gene into the cell chromosome to achieve
long-term expression of the target protein. First, the
overexpression and interference salusin-α recombinant plasmids were
constructed, after which they were packaged into 293T cells with
the creation of overexpression and interference salusin-α
lentiviruses for the infection of target cells, with the aim of
directly upregulating or inhibiting the expression of salusin-α in
cells at the genetic level. In addition, the target gene introduced
by lentiviral construction cοuld be stably expressed in cells
without disappearing as a consequence of cell division (26,27). Another advantage was that this
system also eliminated experimental interference caused by other
human factors, rendering it more a more accurate and convenient
method for detecting subsequent signal pathway molecules.
In order to verify the aforementioned hypothesis,
the synthetic overexpression and interfering salusin-α viruses were
first transfected into 293T cells. First, 23 pairs of primers were
designed for peptide genes associated with atherosclerosis, and the
correlation between the expression of these genes and the
overexpression of salusin-α gene was detected using the RT-qPCR
method (data not shown). The results obtained showed that the
overexpression of salusin-α caused a significant promotion of the
expression of AdipoR2, whereas interfering with salusin-α
expression effectively inhibited the expression of AdipoR2,
indicating that there was a certain association between salusin-α
and AdipoR2. Regarding salusin-α, it was still unknown whether it
could directly act on AdipoR2 or indirectly act on AdipoR2 through
adiponectin or other molecules, and this problem required
additional investigations to confirm the nature of the association.
Furthermore, since salusin-α and AdipoR2 are closely associated
with lipid metabolism and the liver is an important site of lipid
metabolism, HepG2 cells were chosen for subsequent experiments. As
expected, after infecting HepG2 cells with salusin-α overexpression
and interference lentivirus, the changes of AdipoR2 were consistent
with those in 293T cells. Furthermore, according to previous
studies (28,29), there are a number of cell
signaling pathways that are considered to be involved in lipid
synthesis in hepatocytes, among which the PPARα/ApoA5/SREBP-1c
signaling pathway is one of the most important. In addition, a
range of studies have confirmed that AdipoR2 can promote ApoA5, or
inhibit the expression of SREBP-1c, by activating PPARα, inhibiting
lipid synthesis and thereby reducing the excessive accumulation of
lipid in hepatocytes (30,31).
Whether salusin-α can inhibit lipid synthesis in hepatocytes
through regulating the PPARα/ApoA5/SREBP-1c signaling pathway via
upregulating AdipoR2 has rarely been reported. Based on the
research aims of the present study, the overexpression and
interference salusin-α viruses were transferred into HepG2 cells,
and it was subsequently found that, after infection with
overexpression salusin-α lentivirus, the expression levels of
AdipoR2, PPARα and ApoA5 in HepG2 cells were increased, whereas
that of SREBP-1c was decreased. However, in HepG2 cells infected
with interfering salusin-α lentivirus, the opposite results were
obtained. Moreover, in order to confirm that the changes in the
levels of PPARα, ApoA5 and SREBP-1c were caused by the changes in
the level of AdipoR2, the inhibitor (thapsigargin) and the agonist
(PBA) of AdipoR2 were also added in subsequent experiments
(20,32). Thapsigargin is an endoplasmic
reticulum stress inducer which has been shown to induce an increase
of ATF3 transcription; furthermore, ATF3 is able to bind to a
segment of the AdipoR2 promoter to inhibit the expression of
AdipoR2 (20). Therefore,
thapsigargin reduces the expression of AdipoR2. After the addition
of AdipoR2 inhibitors, it was found that the expression of AdipoR2,
PPARα and ApoA5 in HepG2 cells was decreased, whereas that of
SREBP-1c was increased. By contrast, PBA was found to reduce
endoplasmic reticulum stress and lower the expression level of
ATF3, thereby promoting the expression of AdipoR2 (33). The findings of the present study
revealed that, after the addition of the AdipoR2 agonist, the
expression levels of AdipoR2, PPARα and ApoA5 in HepG2 cells were
increased, whereas that of SREBP-1c was decreased. It must be
acknowledged that, in the present study, shSalusin-α#1 did not
completely abolish the influence of salusin-α; therefore, whether
salusin-α possibly exerts a different role through other signaling
pathways requires further study.
Based on all the information and data in the present
study, it is possible to propose a new hypothesis whereby salusin-α
alters the expression of AdipoR2, and thereby regulates lipid
metabolism through the PPARα/ApoA5/SREBP-1c signaling pathway
(Fig. 7). Overexpression of
salusin-α may promote the increase in AdipoR2 expression, and
activate PPARα. PPARα is a type of nuclear transcription factor,
which is able to promote the metabolism of chyle particles and very
low-density lipoprotein, promote the hydrolysis of TG and fatty
acid oxidation (34-36). In addition, PPARα has two
functions; on the one hand, it can combine with ApoA5 to promote an
increase in ApoA5 expression, and on the other hand, it is able to
inhibit the expression of SREBP-1c. ApoA5 is a relatively new
member of apolipoprotein superfamily, discovered in 2001, which has
been shown to be associated with the content of TG, and it is also
the only known apolipoprotein that can reduce plasma TG (17,37). Notably, SREBP-1c regulates the
expression of several enzymes that catalyze the synthesis of fatty
acids, cholesterol, TG and phospholipids (18,38,39). Ultimately, both of these actions
result in an increase in fatty acid oxidation, thereby leading to
the decomposition of intracellular lipids. In the current series of
experiments, it was found that an increase in salusin-α expression
upregulated AdipoR2, which in turn activated the
PPARα/ApoA5/SREBP-1c signaling pathway, thereby regulating lipid
metabolism. However, how salusin-α interacts with AdipoR2 remains
unclear, and the present study has only featured in vitro
experiments; therefore, further studies are required to reveal the
mode of action between salusin-α and AdipoR2.
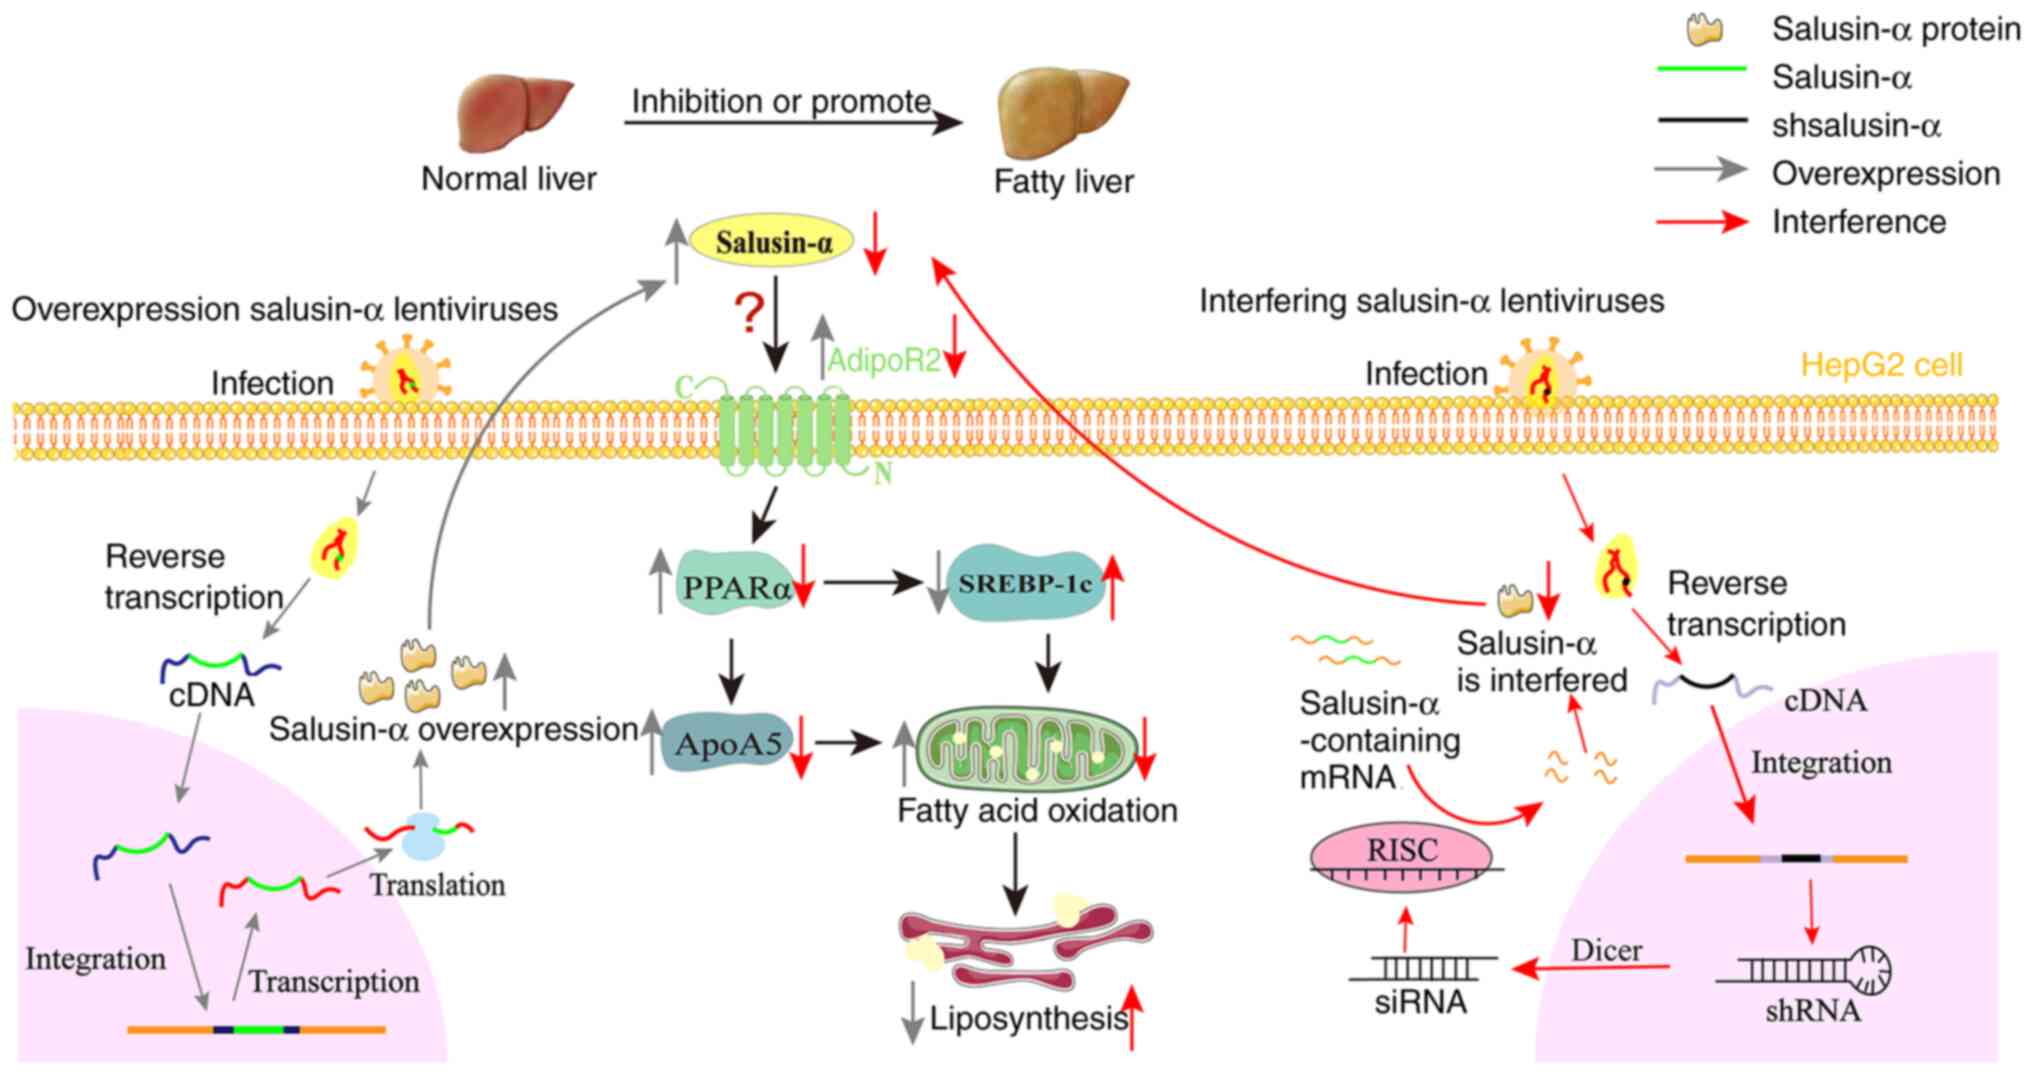 | Figure 7Overexpression of salusin-α
upregulates AdipoR2 and activates the PPARα/ApoA5/SREBP-1c pathway.
Based on the present study, the following hypothesis is proposed:
Salusin-α and the interference sequences were transported into
cells by lentivirus, and after a series of modification, the
expression level of salusin-α was changed. Salusin-α can influence
AdipoR2, and its overexpression leads to upregulation of the
AdipoR2 expression level, thereby upregulating the expression of
PPARα in hepatocytes, whereas PPARα upregulates the expression of
ApoA5 and inhibits the expression of SREBP-1c, ultimately promoting
fatty acid oxidation and reducing lipid accumulation in
hepatocytes. There are numerous possibilities that could account
for how salusin-α interacts with AdipoR2: It may be that salusin-α
directly binds with AdipoR2 and activates it, or salusin-α
indirectly acts on AdipoR2 through adiponectin, and so on; these
aspects need to be confirmed by subsequent research. The gray arrow
represents the mechanism process of overexpression lentivirus
transporting salusin-α and regulating salusin-α expression. The red
arrow represents the mechanism process that interferes with the
lentivirus to transport the interfering sequence of salusin-α and
thus regulates salusin-α. shsalusin-α, Interference sequence of
salusin-α. PPARα, peroxisome proliferator-activated receptor-α;
ApoA5, apolipoprotein A5; SREBP-1c, sterol regulatory
element-binding transcription factor 1; AdipoR2, adiponectin
receptor 2; sh-, short hairpin. |
In conclusion, in the present study, it was reported
for the first time to the best of our knowledge, that
overexpression of salusin-α inhibits lipid anabolism in HepG2 cells
through upregulating AdipoR2, resulting in the activation of the
PPARαApoA5/SREBP-1c signaling pathway. Therefore, salusin-α is a
potential target molecule associated with lipid metabolism that may
be recruitable in clinical interventions targeted against
atherosclerosis.
Availability of data and materials
The datasets used and/or analyzed during the current
study are available from the corresponding author on reasonable
request.
Authors' contributions
YW and HZ designed the study and confirm the
authenticity of all the raw data. CY and GG performed the
sequencing experiments and provided critical advice during the
preparation of the manuscript. HZ, AX, SW, QZ and XD prepared
materials, collected data and performed analysis. All authors
commented on previous versions of the manuscript, and read and
approved the final manuscript.
Ethics approval and consent to
participate
Not applicable.
Patient consent for publication
Not applicable.
Competing interests
The authors declare that they have no competing
interests.
Acknowledgments
The authors are grateful to Dr Duan Qiuhong
(Department of Basic Medicine of Wuhan Huazhong University of
Science and Technology) for providing the lentiviral plasmids and
293T cells.
Funding
The present study was supported by the Top 1% of ESI discipline
creation projects of Hubei University of Chinese Medicine (grant
nos. 100702020506 and 100702020518) and the Research Plan Projects
of the Hubei Provincial Department of Education (grant no.
B2018099).
References
|
1
|
Shichiri M, Ishimaru S, Ota T, Nishikawa
T, Isogai T and Hirata Y: Salusins: Newly identified bioactive
peptides with hemodynamic and mitogenic activities. Nat Med.
9:1166–1172. 2003. View
Article : Google Scholar : PubMed/NCBI
|
|
2
|
Suzuki N, Shichiri M, Akashi T, Sato K,
Sakurada M, Hirono Y, Yoshimoto T, Koyama T and Hirata Y: Systemic
distribution of salusin expression in the rat. Hypertens Res.
30:1255–1262. 2007. View Article : Google Scholar
|
|
3
|
Raposeiras-Roubin S, Rosselló X, Oliva B,
Fernández-Friera L, Mendiguren JM, Andrés V, Bueno H, Sanz J,
Martínez de Vega V, Abu-Assi E, et al: Triglycerides and residual
atherosclerotic risk. J Am Coll Cardiol. 77:3031–3041. 2021.
View Article : Google Scholar : PubMed/NCBI
|
|
4
|
Qian K, Feng L, Sun Y, Xiong B, Ding Y,
Han P, Chen H, Chen X, Du L and Wang Y: Overexpression of Salusin-α
inhibits vascular intimal hyperplasia in an atherosclerotic rabbit
model. Biomed Res Int. 2018:89739862018. View Article : Google Scholar
|
|
5
|
Niepolski L and Grzegorzewska AE: Salusins
and adropin: New peptides potentially involved in lipid metabolism
and atherosclerosis. Adv Med Sci. 61:282–287. 2016. View Article : Google Scholar : PubMed/NCBI
|
|
6
|
Grzegorzewska AE, Niepolski L, Sikora J,
Janków M, Jagodziński PP and Sowińska A: Effect of lifestyle
changes and atorvastatin administration on dyslipidemia in
hemodialysis patients: A prospective study. Pol Arch Med Wewn.
124:443–451. 2014.PubMed/NCBI
|
|
7
|
Fang H and Judd RL: Adiponectin regulation
and function. Compr Physiol. 8:1031–1063. 2018. View Article : Google Scholar : PubMed/NCBI
|
|
8
|
Parida S, Siddharth S and Sharma D:
Adiponectin, obesity, and cancer: Clash of the Bigwigs in health
and disease. Int J Mol Sci. 20:25192019. View Article : Google Scholar : PubMed/NCBI
|
|
9
|
Zha D, Wu X and Gao P: Adiponectin and its
receptors in diabetic kidney disease: Molecular mechanisms and
clinical potential. Endocrinology. 158:2022–2034. 2017. View Article : Google Scholar : PubMed/NCBI
|
|
10
|
Lee IK, Kim G, Kim DH and Kim BB:
PEG-BHD1028 peptide regulates insulin resistance and fatty acid
β-oxidation, and mitochondrial biogenesis by binding to two
heterogeneous binding sites of adiponectin receptors, AdipoR1 and
AdipoR2. Int J Mol Sci. 22:8842021. View Article : Google Scholar
|
|
11
|
Furukawa K, Hori M, Ouchi N, Kihara S,
Funahashi T, Matsuzawa Y, Miyazaki A, Nakayama H and Horiuchi S:
Adiponectin down-regulates acyl-coenzyme A: Cholesterol
acyltransferase-1 in cultured human monocyte-derived macrophages.
Biochem Biophys Res Commun. 317:831–836. 2004. View Article : Google Scholar : PubMed/NCBI
|
|
12
|
Yanai H and Yoshida H: Beneficial effects
of adiponectin on glucose and lipid metabolism and atherosclerotic
progression: Mechanisms and perspectives. Int J Mol Sci.
20:11902019. View Article : Google Scholar : PubMed/NCBI
|
|
13
|
Ipsen DH, Lykkesfeldt J and Tveden-Nyborg
P: Molecular mechanisms of hepatic lipid accumulation in
non-alcoholic fatty liver disease. Cell Mol Life Sci. 75:3313–3327.
2018. View Article : Google Scholar : PubMed/NCBI
|
|
14
|
Younossi ZM, Corey KE and Lim JK: AGA
clinical practice update on lifestyle modification using diet and
exercise to achieve weight loss in the management of nonalcoholic
fatty liver disease: Expert review. Gastroenterology. 160:912–918.
2021. View Article : Google Scholar
|
|
15
|
Perakakis N, Stefanakis K and Mantzoros
CS: The role of omics in the pathophysiology, diagnosis and
treatment of non-alcoholic fatty liver disease. Metabolism.
111:1543202020. View Article : Google Scholar :
|
|
16
|
Scherer A and Dufour JF: Treatment of
non-alcoholic fatty liver disease. Dig Dis. 34:27312016. View Article : Google Scholar
|
|
17
|
Alborn WE, Johnson MG, Prince MJ and
Konrad RJ: Definitive N-terminal protein sequence and further
characterization of the novel apolipoprotein A5 in human serum.
Clin Chem. 52:514–517. 2006. View Article : Google Scholar : PubMed/NCBI
|
|
18
|
Peng CH, Yang MY, Yang YS, Yu CC and Wang
CJ: Antrodia cinnamomea prevents obesity, dyslipidemia, and the
derived fatty liver via regulating AMPK and SREBP signaling. Am J
Chin Med. 45:67832017. View Article : Google Scholar
|
|
19
|
Tang K, Wang F, Zeng Y, Chen X and Xu X:
Salusin-α attenuates hepatic steatosis and atherosclerosis in high
fat diet-fed low density lipoprotein receptor deficient mice. Eur J
Pharmacol. 830:76862018. View Article : Google Scholar
|
|
20
|
Koh IU, Lim JH, Joe MK, Kim WH, Jung MH,
Yoon JB and Song J: AdipoR2 is transcriptionally regulated by ER
stressinducible ATF3 in HepG2 human hepatocyte cells. FEBS J.
277:2304–2317. 2010. View Article : Google Scholar : PubMed/NCBI
|
|
21
|
Poznyak A, Grechko AV, Poggio P,
Myasoedova VA, Alfieri V and Orekhov AN: The diabetes
mellitus-atherosclerosis connection: The role of lipid and glucose
metabolism and chronic inflammation. Int J Mol Sci. 21:18352020.
View Article : Google Scholar : PubMed/NCBI
|
|
22
|
Qian H, Chao X, Williams J, Fulte S, Li T,
Yang L and Ding WX: Autophagy in liver diseases: A review. Mol
Aspects Med. 82:1009732021. View Article : Google Scholar : PubMed/NCBI
|
|
23
|
Dong Y, Yu C, Ma N, Xu X, Wu Q, Lu H, Gong
L, Chen J and Ren J: MicroRNA-379-5p regulates free cholesterol
accumulation and relieves diet induced-liver damage in db/db mice
via STAT1/HMGCS1 axis. Mol Biomed. 3:252022. View Article : Google Scholar : PubMed/NCBI
|
|
24
|
Yang Q, Zhang Y, Li L, Li J, Li Y, Han L
and Wang M: D-chiro-Inositol facilitates adiponectin biosynthesis
and activates the AMPKα/PPARs pathway to inhibit high-fat
diet-induced obesity and liver lipid deposition. Food Funct.
13:7192–7203. 2022. View Article : Google Scholar : PubMed/NCBI
|
|
25
|
Tomita K, Oike Y, Teratani T, Taguchi T,
Noguchi M, Suzuki T, Mizutani A, Yokoyama H, Irie R, Sumimoto H, et
al: Hepatic AdipoR2 signaling plays a protective role against
progression of nonalcoholic steatohepatitis in mice. Hepatology.
48:458–473. 2008. View Article : Google Scholar : PubMed/NCBI
|
|
26
|
Moreira AS, Cavaco DG, Faria TQ, Alves PM,
Carrondo MJT and Peixoto C: Advances in Lentivirus purification.
Biotechnol J. 16:e20000192021. View Article : Google Scholar
|
|
27
|
Yew CT, Gurumoorthy N, Nordin F, Tye GJ,
Wan Kamarul Zaman WS, Tan JJ and Ng MH: Integrase deficient
lentiviral vector: Prospects for safe clinical applications. PeerJ.
10:e137042022. View Article : Google Scholar : PubMed/NCBI
|
|
28
|
Prieur X, Coste H and Rodriguez JC: The
human apolipoprotein AV gene is regulated by peroxisome
proliferator-activated receptor-alpha and contains a novel
farnesoid X-activated receptor response element. J Biol Chem.
278:25468–25480. 2003. View Article : Google Scholar : PubMed/NCBI
|
|
29
|
Joshi A, Upadhyay KK, Vohra A, Shirsath K
and Devkar R: Melatonin induces Nrf2-HO-1 reprogramming and
corrections in hepatic core clock oscillations in non-alcoholic
fatty liver disease. FASEB J. 35:e218032021. View Article : Google Scholar : PubMed/NCBI
|
|
30
|
Kim M, Kim M, Yoo HJ, Bang YJ, Lee SH and
Lee JH: Apolipoprotein A5 gene variants are associated with
decreased adiponectin levels and increased arterial stiffness in
subjects with low high-density lipoprotein-cholesterol levels. Clin
Genet. 94:438–444. 2018. View Article : Google Scholar : PubMed/NCBI
|
|
31
|
Wen F, An C, Wu X, Yang Y, Xu J, Liu Y,
Wang C, Nie L, Fang H and Yang Z: MiR-34a regulates mitochondrial
content and fat ectopic deposition induced by resistin through the
AMPK/PPARα pathway in HepG2 cells. Int J Biochem Cell Biol.
94:133–145. 2018. View Article : Google Scholar
|
|
32
|
Yu S, Gao L, Zhang C, Wang Y, Lan H, Chu
Q, Li S and Zheng X: Glycine ameliorates endoplasmic reticulum
stress induced by thapsigargin in porcine oocytes. Front Cell Dev
Biol. 9:7338602021. View Article : Google Scholar : PubMed/NCBI
|
|
33
|
Ozcan U, Yilmaz E, Ozcan L, Furuhashi M,
Vaillancourt E, Smith RO, Görgün CZ and Hotamisligil GS: Chemical
chaperones reduce ER stress and restore glucose homeostasis in a
mouse model of type 2 diabetes. Science. 313:1137–1140. 2006.
View Article : Google Scholar : PubMed/NCBI
|
|
34
|
Sinha RA, Rajak S, Singh BK and Yen PM:
Hepatic lipid catabolism via PPARα-lysosomal crosstalk. Int J Mol
Sci. 21:23912020. View Article : Google Scholar
|
|
35
|
Lee YH, Jang HJ, Kim S, Choi SS, Khim KW,
Eom HJ, Hyun J, Shin KJ, Chae YC, Kim H, et al: Hepatic MIR20B
promotes nonalcoholic fatty liver disease by suppressing PPARA.
Elife. 10:e704722021. View Article : Google Scholar : PubMed/NCBI
|
|
36
|
Brocker CN, Patel DP, Velenosi TJ, Kim D,
Yan T, Yue J, Li G, Krausz KW and Gonzalez FJ: Extrahepatic PPARα
modulates fatty acid oxidation and attenuates fasting-induced
hepatosteatosis in mice. J Lipid Res. 59:2140–2152. 2018.
View Article : Google Scholar : PubMed/NCBI
|
|
37
|
Luo F, Guo Y, Ruan GY, Peng R and Li XP:
Estrogen lowers triglyceride via regulating hepatic APOA5
expression. Lipids Health Dis. 16:722017. View Article : Google Scholar : PubMed/NCBI
|
|
38
|
Ferré P, Phan F and Foufelle F: SREBP-1c
and lipogenesis in the liver: An update1. Biochem J. 478:3723–3739.
2021. View Article : Google Scholar : PubMed/NCBI
|
|
39
|
Li L, Zhang X, Ren H, Huang X, Shen T,
Tang W, Dou L and Li J: miR-23a/b-3p promotes hepatic lipid
accumulation by regulating SREBP-1c and Fas. J Mol Endocrinol.
68:35492021.
|