Introduction
Numerous causes, including genetic, immunological
and viral, can induce psoriasis, a common chronic inflammatory skin
condition (1). Furthermore,
there are multiple cytokine imbalances and intracellular signal
transduction abnormalities in the onset of psoriasis. Psoriasis is
linked to excessive activation of neutrophils, dendritic and T
cells and keratinocytes, resulting in proliferation of the
epidermal spinous layer, hyperkeratosis and parakeratosis,
disappearance of the granular layer and epidermal microabscesses
(1-3).
Psoriatic arthritis, lymphadenitis and
cardiovascular disorders are among the side effects of severe
psoriasis (1,4,5).
The long-term nature and recurrence of the condition imposes a
burden on the lives and wellbeing of patients. Although there is no
cure for psoriasis, numerous targeted therapies effectively
alleviate symptoms or slow their progression, including TNF-α
inhibitors etanercept, adalimumab and infliximab (1). Identifying disease biomarkers may
aid personalized treatment methods to maximize therapeutic
effects.
microRNAs (miRNAs or miRs) are highly conserved
non-coding RNAs that are key post-transcriptional epigenetic
factors. miRNAs are involved in translational regulation, either by
binding to target mRNA to degrade it or by physically blocking
transcription factors to prevent protein synthesis (6). By controlling keratinocyte
differentiation and hyperplasia, triggering apoptosis and
immunological activation, miRNAs can be crucial in psoriasis
(7). miRNAs have been proven to
be effective biomarkers for psoriasis diagnosis, prognosis and
therapy monitoring (8).
Upregulation of miR-155 can disrupt normal epidermal barrier
formation by lowering loricrin (a protein component of the
keratinocyte envelope) production in keratinocytes in a human
external skin model (9). There
is also evidence that skin lesions and peripheral blood mononuclear
cells of patients with psoriasis have higher miR-155 expression
levels, which is key for the proliferation, programmed cell death
and inflammatory response of HaCaT cells. miR-155 may therefore
have a key role in the pathophysiology of psoriasis (10,11).
As a transcriptional corepressor, IFN regulatory
factor 2 binding protein 2 (IRF2BP2) inhibits basal transcription
and suppresses enhancer activation and gene expression (12). IRF2BP2 is widely expressed in
different types of cell and tissue, such as bone marrow, skin,
liver, dendritic cells, basophil cells, and naive CD4 T cells,
potentially influencing cellular signaling pathways (13). IRF2BP2 has a role in maintaining
physiological cell homeostasis by controlling cellular processes,
including angiogenesis, inflammation, cell cycle and the immune
response (12,14,15).
Furthermore, studies have demonstrated the
importance of IRF2BP2 in controlling the inflammatory process
(12,16-20). IRF2BP2 has a critical role in
macrophage-mediated inflammation. Chen et al (16) confirmed that upregulation of
IRF2BP2 regulates expression of kruppel-like factor 2 (KLF2), an
anti-inflammatory transcription factor, and promotes M2 macrophage
differentiation. Moreover, via suppressing NF-κB activation,
IRF2BP2 upregulation in the heart decreases the synthesis of
pro-inflammatory cytokines (20). However, it is unclear how IRF2BP2
contributes to the inflammatory response in psoriasis.
Bioinformatics enrichment tools have served a key
role in analyzing gene function and identifying potential
regulatory mechanisms of gene networks in high-throughput
biological studies (21-23). By using bioinformatics data
mining, key genes associated with diseases can be efficiently
identified, promoting understanding of disease pathogenesis.
Furthermore, effective biomarkers or targets can be utilized to aid
in patient diagnosis and treatment.
The aim of the present study was to screen
differentially expressed genes and differentially expressed miRNAs
in psoriasis by bioinformatics and to explore the role of miR-155
in the occurrence and development of the psoriasis inflammatory
response and its molecular mechanism, which may provide a new
approach for targeted treatment of this disease.
Materials and methods
Microarray
A total of four datasets (GSE166388, GSE153007,
GSE115293 and GSE145305) that included gene expression profiles
from patients with psoriasis and healthy controls were obtained
from The Gene Expression Omnibus (GEO) database (ncbi.nlm.nih.gov/geo). The mRNA expression profiles of
four psoriasis and four normal samples were included in the
GSE166388 microarray dataset, whereas the mRNA expression profiles
of 14 psoriasis and five normal samples were included in GSE153007.
GSE115293 and GSE145305 both contained miRNA expression profiles
from four psoriasis and four normal samples. The psoriasis samples
were obtained from biopsy of diseased skin from patients with
psoriasis and the control samples were obtained from biopsy of
normal skin from healthy volunteers.
Identification of differentially
expressed genes (DEGs) and miRNAs (DEMs)
DEGs and DEMs were identified using GEO2R
(ncbi.nlm.nih.gov/geo/geo2r/), an
interactive web application that compares samples from GEO database
to identify DEGs. The screening criteria for DEGs and DEMs were
P<0.05 and |logFold-change|≥1. Using online bioinformatics tool
ChiPlot (chiplot.online/), data were presented as heat maps and
volcano plots. GSE166388 and GSE153007 datasets were used to obtain
mRNAs and the GSE115293 and GSE145305 datasets were used to obtain
miRNAs associated with psoriasis. The online bioinformatics program
Venny 2.1.0. (bioinfogp.cnb.csic.es/tools/venny/) was used to
calculate intersecting DEGs and DEMs.
Gene ontology (GO) and kyoto encyclopedia
of genes and genomes (KEGG) enrichment analysis
For all the overlapping DEGs, GO function annotation
and KEGG pathway enrichment analyses were conducted using Metascape
(version 3.5.20240101, metascape.org/gp/index.html#/main/step1). A
significance level of P<0.01 was applied. R tool org.Hs.eg.db
(version 3.1.0, bioconductor.org/) was used for GO annotation of
overlapping DEGs. KEGG pathway gene annotation for overlapping DEGs
was obtained using KEGG REST API (version 20230301, kegg.jp/kegg/rest/keggapi.html).
Enrichment results were obtained by enrichment analysis using the
clusterProfiler R package (version 3.14.3; bioconductor.org/packages/release/bioc/html/clusterProfiler.html).
Statistical significance was defined as P<0.05 and false
discovery rate (FDR)<0.1.
Prediction of miRNA targets
The downstream target genes of overlapping DEMs in
the GSE115293 and GSE145305 datasets were predicted using the
online bioinformatics tool miRNet (mirnet.ca/miRNet/home.xhtml).
The online bioinformatics program Venny 2.1.0 was utilized to
identify the intersections between the projected target genes and
DEGs. These intersections were used as point-dysregulated target
genes for construction of regulatory networks.
miRNA-mRNA network construction and core
module analysis
Target gene protein-protein interaction (PPI) files
with a highest confidence level >0.9 were acquired from the
STRING online database (cn.string-db.org/). To create an interaction network
between DEMs and DEGs, the PPI, miRNA and downstream target gene
data were combined and imported into the Cytoscape 3.9.1
(cytoscape.org/) for visual analysis. Based on the
degree method, the top 10 elements in the network were calculated
using the cytoHubba 0.1 (apps.cytoscape.org/apps/cytohubba) plugin for
Cytoscape. The component that received the highest score was
selected for further research.
Screening of co-expressed genes between
HaCaT cell line and psoriatic skin
The raw RNA-sequencing data from the GSE202683
dataset was obtained from GEO database, which contained gene
expression levels of four HaCaT cell samples from normal
individuals. The sequencing results of these samples in the dataset
were compared using the online bioinformatics tool Venny 2.1.0 and
the overlapping genes were identified. Using a Venn diagram, the
intersection of the HaCaT genes and the DEGs was identified to
extract co-expressed genes between the psoriatic skin samples and
the HaCaT cell line for further screening.
Prediction of hsa-miR-155-5p targets
miRTarBase 9.0 (mirtarbase.cuhk.edu.cn/~miRTarBase/miRTarBase_2022/php/search.php)
and TargetScan 8.0 (targetscan.org/vert_80/) were used to predict the
downstream target genes of hsa-miR-155-5p. Venny 2.1.0 was used to
obtain the intersection between co-expressed genes of DEGs and
HaCaT cells and predicted target genes.
Cell culture
Culture of the immortalized human keratinocyte cell
line HaCaT (cat. no. CL-0090; Procell Life Science & Technology
Co., Ltd.) was conducted at 37°C and 5% CO2 in complete
medium, which consisted of 89% MEM, 10% FBS (both Procell Life
Science & Technology Co., Ltd.) and 1% penicillium-streptomycin
(Wuhan Servicebio Technology Co., Ltd.). The HaCaT cells were
authenticated using STR profiling.
Viability of HaCaT cells treated with
lipopolysaccharide (LPS)
HaCaT cells in the logarithmic growth phase were
seeded at a density of 2×10⁴ cells/well in 96-well
plates, then cultured at 37°C with 5% CO2 overnight. LPS
(Sigma-Aldrich; Merck KGaA) was administered at doses of 0.0, 0.1,
0.5, 1.0, 2.0 and 5.0 μg/ml at room temperature. Following
6, 12 and 24 h stimulation, Cell Counting Kit-8 (CCK-8) reagent
(Dojindo Laboratories, Inc.) was added to each well. Cells were
incubated for a further 2 h at 37°C in 5% CO2 and
microplate reader was used to measure the absorbance at 450 nm.
Construction of HaCaT cell inflammatory
model
An inflammatory model was induced in HaCaT cells by
LPS stimulation. HaCaT cells in the logarithmic growth phase were
seeded into 6-well plates and incubated overnight at 37°C with 5%
CO2. Subsequently, the medium was replaced and the cells
were stimulated with fresh medium containing 1 μg/ml LPS at
37°C in 5% CO2 for 6 h to establish the inflammatory
cell model. The aforementioned complete medium was added to the
cells for subsequent culture or transfection. Four treatment groups
were subsequently established: Negative control (untreated cells),
LPS, mimic and LPS + mimic. LPS + mimic group was stimulated with 1
μg/ml LPS for 6 h then transfected with miR-155 mimic.
Cell transfection
miR-155-5p mimic (forward, 5'-UUA AUG CUA AUC GUG
AUA GGG GUU-3' and reverse, 5'-CCC CUA UCA CGA UUA GCA UUA AUU-3'),
mimic negative control (NC; forward, 5'-GCG ACG AUC UGC CUA AGA UDT
DT-3' and reverse, 5'-AUC UUA GGC AGA UCG UCG CDT DT-3'),
miR-155-5p inhibitor (AAC CCC UAU CAC GAU UAG CAU UAA), inhibitor
NC (GUC CCU CAC AUC AUA AGC UAA UAA), small interfering
(si)-IRF2BP2 (forward, 5'-CUA GUG GAG AGG UCU AUU GTT-3' and
reverse, 5'-CAA UAG ACC UCU CCA CUA GCU-3') and si-NC (forward,
5'-GCG ACG AUC UGC CUA AGA UDT DT-3' and reverse, 5'-AUC UUA GGC
AGA UCG UCG CDT DT-3') were purchased from Suzhou GenePharma Co.,
Ltd. For in vitro transfection, HaCaT cells were transfected
using Lipo8000 (Beyotime Institute of Biotechnology). The
concentration of nucleic acid used is 20 μM. Following
transfection for 6 h, the culture medium was changed to a complete
medium, and the transfected cells continued to be cultured at 37°C
in 5% CO2 for 48 h for subsequent experiments.
Measurement of cell proliferation
HaCaT cells in the logarithmic growth phase were
seeded in 96-well plates and cultivated overnight at 37°C in an
incubator with 5% CO2. Following transfection, CCK-8
reagent was added to each well and the cells were placed in an
incubator with 5% CO2 at 37°C. After 2 h, a microplate
reader was used to measure the absorbance at 450 nm.
Reverse transcription-quantitative PCR
(RT-qPCR)
Following the manufacturer's instructions, total RNA
was isolated from the transfected cells using TRIzol (Thermo Fisher
Scientific, Inc.) and reverse-transcribed. cDNA was synthesized
with ReverTra Ace® qPCR RT kit (Toyobo Life Science,
Inc.), according to the manufacturer's protocol. qPCR was performed
in the CFX Connect real-time system (Bio-Rad Laboratories, Inc.)
using SYBR Green qPCR Mix (Monad Biotech Co., Ltd.). The
thermocycling conditions were as follows: Initial denaturation at
95°C for 30 sec; followed by 40 cycles of denaturation at 95°C for
10 sec, and annealing and extension at 60°C for 30 sec. U6 and
GAPDH were used to standardize the levels of miRNA and gene
expression and the 2-ΔΔCq method was employed to
calculate the relative expression (24). Table I contains primer sequences that
were utilized in the RT-qPCR.
 | Table IPrimers used in reverse
transcription-quantitative PCR. |
Table I
Primers used in reverse
transcription-quantitative PCR.
| Primer | Sequence,
5'→3' |
|---|
| hsa-miR-155-5p | F:
CCACGGTCTTAATGCTAATCGTGAT |
| R:
ATCCAGTGCAGGGTCCGAGG |
| U6 | F:
AGAGAAGATTAGCATGGCCCCTG |
| R:
AGTGCAGGGTCCGAGGTATT |
| IRF2BP2 | F:
TCCTCTTTTGTGTCTCCGCC |
| R:
GGCGGACTGTTGCTATTCCT |
| IL-6 | F:
TTCGGTCCAGTTGCCTTCTC |
| R:
CTGAGATGCCGTCGAGGATG |
| IL-1β | F:
AAGTACCTGAGCTCGCCAGT |
| R:
CTTGCTGTAGTGGTGGTCGG |
| KLF2 | F:
CGCTGAGTGAACCCATCCT |
| R:
CTGTTGAGGTCGTCGTCGG |
| p65 | F:
GGCGAGAGGAGCACAGATAC |
| R:
GCCTCATAGAAGCCATCCCG |
| GAPDH | F:
AATTCCATGGCACCGTCAAG |
| R:
AGCATCGCCCCACTTGATTT |
ELISA
A total of 8×10⁵ HaCaT cells/well were
seeded into a 6-well plate, then incubated at 37°C with 5%
CO2 overnight. The cells were induced with LPS for 6 h,
as aforementioned. Following transfection, HaCaT cell supernatant
was extracted and centrifuged for 20 min at 1,000 × g at 4°C
independently. Levels of IL-1β (cat. no. E-EL-H0149) and IL-6 (cat.
no. E-EL-H6156) were determined using ELISA kits (Elabscience
Biotechnology, Inc.) following the manufacturer's instructions.
Western blotting (WB)
Total protein was extracted from HaCaT cells using
RIPA lysis buffer and phosphatase and protease inhibitors (Beyotime
Institute of Biotechnology). BCA kit was then used to measure the
protein concentration (Wuhan Servicebio Technology Co., Ltd.).
Protein (10 μg/lane) were separated using 10% SDS-PAGE, then
transferred to PVDF membranes. The membranes were blocked at room
temperature for 15 min using rapid blocking solution (Beyotime
Institute of Biotechnology), then incubated with primary antibodies
overnight at 4°C. The primary antibodies were as follows:
Anti-β-tubulin (cat. no. 10094-1-AP; 1:20,000; Wuhan Sanying
Biotechnology), anti-GAPDH (cat. no. GB12002-100; 1:1,500; Wuhan
Servicebio Technology Co., Ltd.), anti-IRF2BP2 (cat. no.
18847-1-AP; 1:1,000; Wuhan Sanying Biotechnology), anti-KLF2 (cat.
no. A16480; 1:1,000; ABclonal Biotech Co., Ltd.), anti-p65 (cat.
no. 10745-1-AP; 1:1,000; Wuhan Sanying Biotechnology) and
anti-phosphorylated (p)-p65 (Ser536; cat. no. 3033T; 1:1,000; Cell
Signaling Technology, Inc.). HRP-linked goat anti-rabbit (cat. no.
A0208; 1:1,000; Beyotime Institute of Biotechnology) or anti-mouse
IgG antibody (cat. no. A0216; 1:1,500; Beyotime Institute of
Biotechnology) was incubated with the membrane for 1 h at room
temperature. BeyoECL Star (Beyotime Institute of Biotechnology) was
utilized to visualize the protein bands. ImageJ software (version
1.52a; National Institutes of Health) was used to analyze protein
bands.
Immunofluorescence
HaCaT cells were seeded into 24-well plates covered
with slides. Following transfection, the cells were fixed for 15
min with 4% paraformaldehyde at room temperature (Wuhan Servicebio
Technology Co., Ltd.), permeabilized for 20 min at room temperature
using 0.3% Triton-X-100 (Wuhan Servicebio Technology Co., Ltd.),
blocked at room temperature for 30 min with 5% BSA (Wuhan
Servicebio Technology Co., Ltd.) and incubated overnight with
primary antibody (anti-IRF2BP2; cat. no. 18847-1-AP; 1:200; Wuhan
Sanying Biotechnology) at 4°C. The cells were treated with
FITC-labeled fluorescent secondary antibody (cat. no. GB22303;
1:2,000; Wuhan Servicebio Technology Co., Ltd.) for 1 h at 37°C in
the dark. DAPI (Wuhan Servicebio Technology Co., Ltd.) was applied
to counterstain the nuclei at room temperature for 8 min in the
dark, and the slides were blocked at room temperature for 30 sec
with a mounting solution containing an anti-fluorescence quenching
agent (Wuhan Servicebio Technology Co., Ltd.). Finally, images were
collected using a fluorescence microscope (Olympus
Corporation).
Cell cycle measurement
HaCaT cells in the logarithmic growth phase were
seeded at a density of 8×10⁵ cells/well into 6-well
plates and cultured in an incubator with 5% CO2
overnight at 37°C. Following transfection, the cells were digested
by trypsin at 37°C for 6 min and centrifuged for 5 min at 200 × g
at 4°C, followed by PBS wash and an overnight fixation in 70% pure
ethanol at 4°C. The supernatant was removed by centrifugation for 5
min at 200 × g at 4°C, the cells were washed once with PBS then
resuspended in propidium iodide for staining at 37°C for 30 min
(Beyotime Institute of Biotechnology). After 30 min light-protected
incubation in a water bath at 37°C, cell cycle measurements were
performed using a BD Accuri C6 Plus Flow Cytometer. ModFit LT 5.0
(vsh.com/products/mflt/) was used for
analysis.
Dual-luciferase reporter assay
miR-155-5p mimic (forward, 5'-UUA AUG CUA AUC GUG
AUA GGG GUU-3' and reverse, 5'-CCC CUA UCA CGA UUA GCA UUA AUU-3'),
mimic negative control (NC; forward, 5'-GCG ACG AUC UGC CUA AGA UDT
DT-3' and reverse, 5'-AUCU UAG GCA GAU CGU CGC DTD T-3') were
purchased from Suzhou GenePharma Co., Ltd. The binding site between
miR-155-5p and IRF2BP2 was predicted by starBase website
(rnasysu.com/encori/). The miR-155-5p
target sequence on IRF2BP2 was cloned into the pmirGLO vector
(Suzhou GenePharma Co., Ltd.), and the dual fluorescein reporter
vector IRF2BP2-wild type (WT) or -mutant (MUT) was constructed.
293T cells (cat. no. GNHu17; Cell Bank/Stem Cell Bank, Chinese
Academy of Sciences) were cultured at 37°C and 5% CO2 in
complete medium. 293T cells were co-transfected with miR-155-5p
mimic/mimic NC and IRF2BP2-WT/MUT using Lipofectamine 2000
(Invitrogen; Thermo Fisher Scientific, Inc.). Following
co-transfection for 6 h, the culture medium was changed to a
complete medium, and the transfected cells continued to be cultured
at 37°C in 5% CO2 for 24 h. luciferase activity was
assessed using the dual-luciferase reporter gene assay system
(Vazyme Biotech Co., Ltd.) according to the manufacturer's
instructions. Firefly luciferase activity was normalized to
Renilla luciferase activity.
Statistical analysis
All data are presented as the mean ± standard
deviation. GraphPad Prism (version 8.0.1; Dotmatics) was used for
statistical analyses. Unpaired Student's t test was used to for
comparisons between two groups. One-way ANOVA followed by Tukey's
post hoc test was used to compare >2 groups. All experiments
were repeated three times. P<0.05 was considered to indicate a
statistically significant difference.
Results
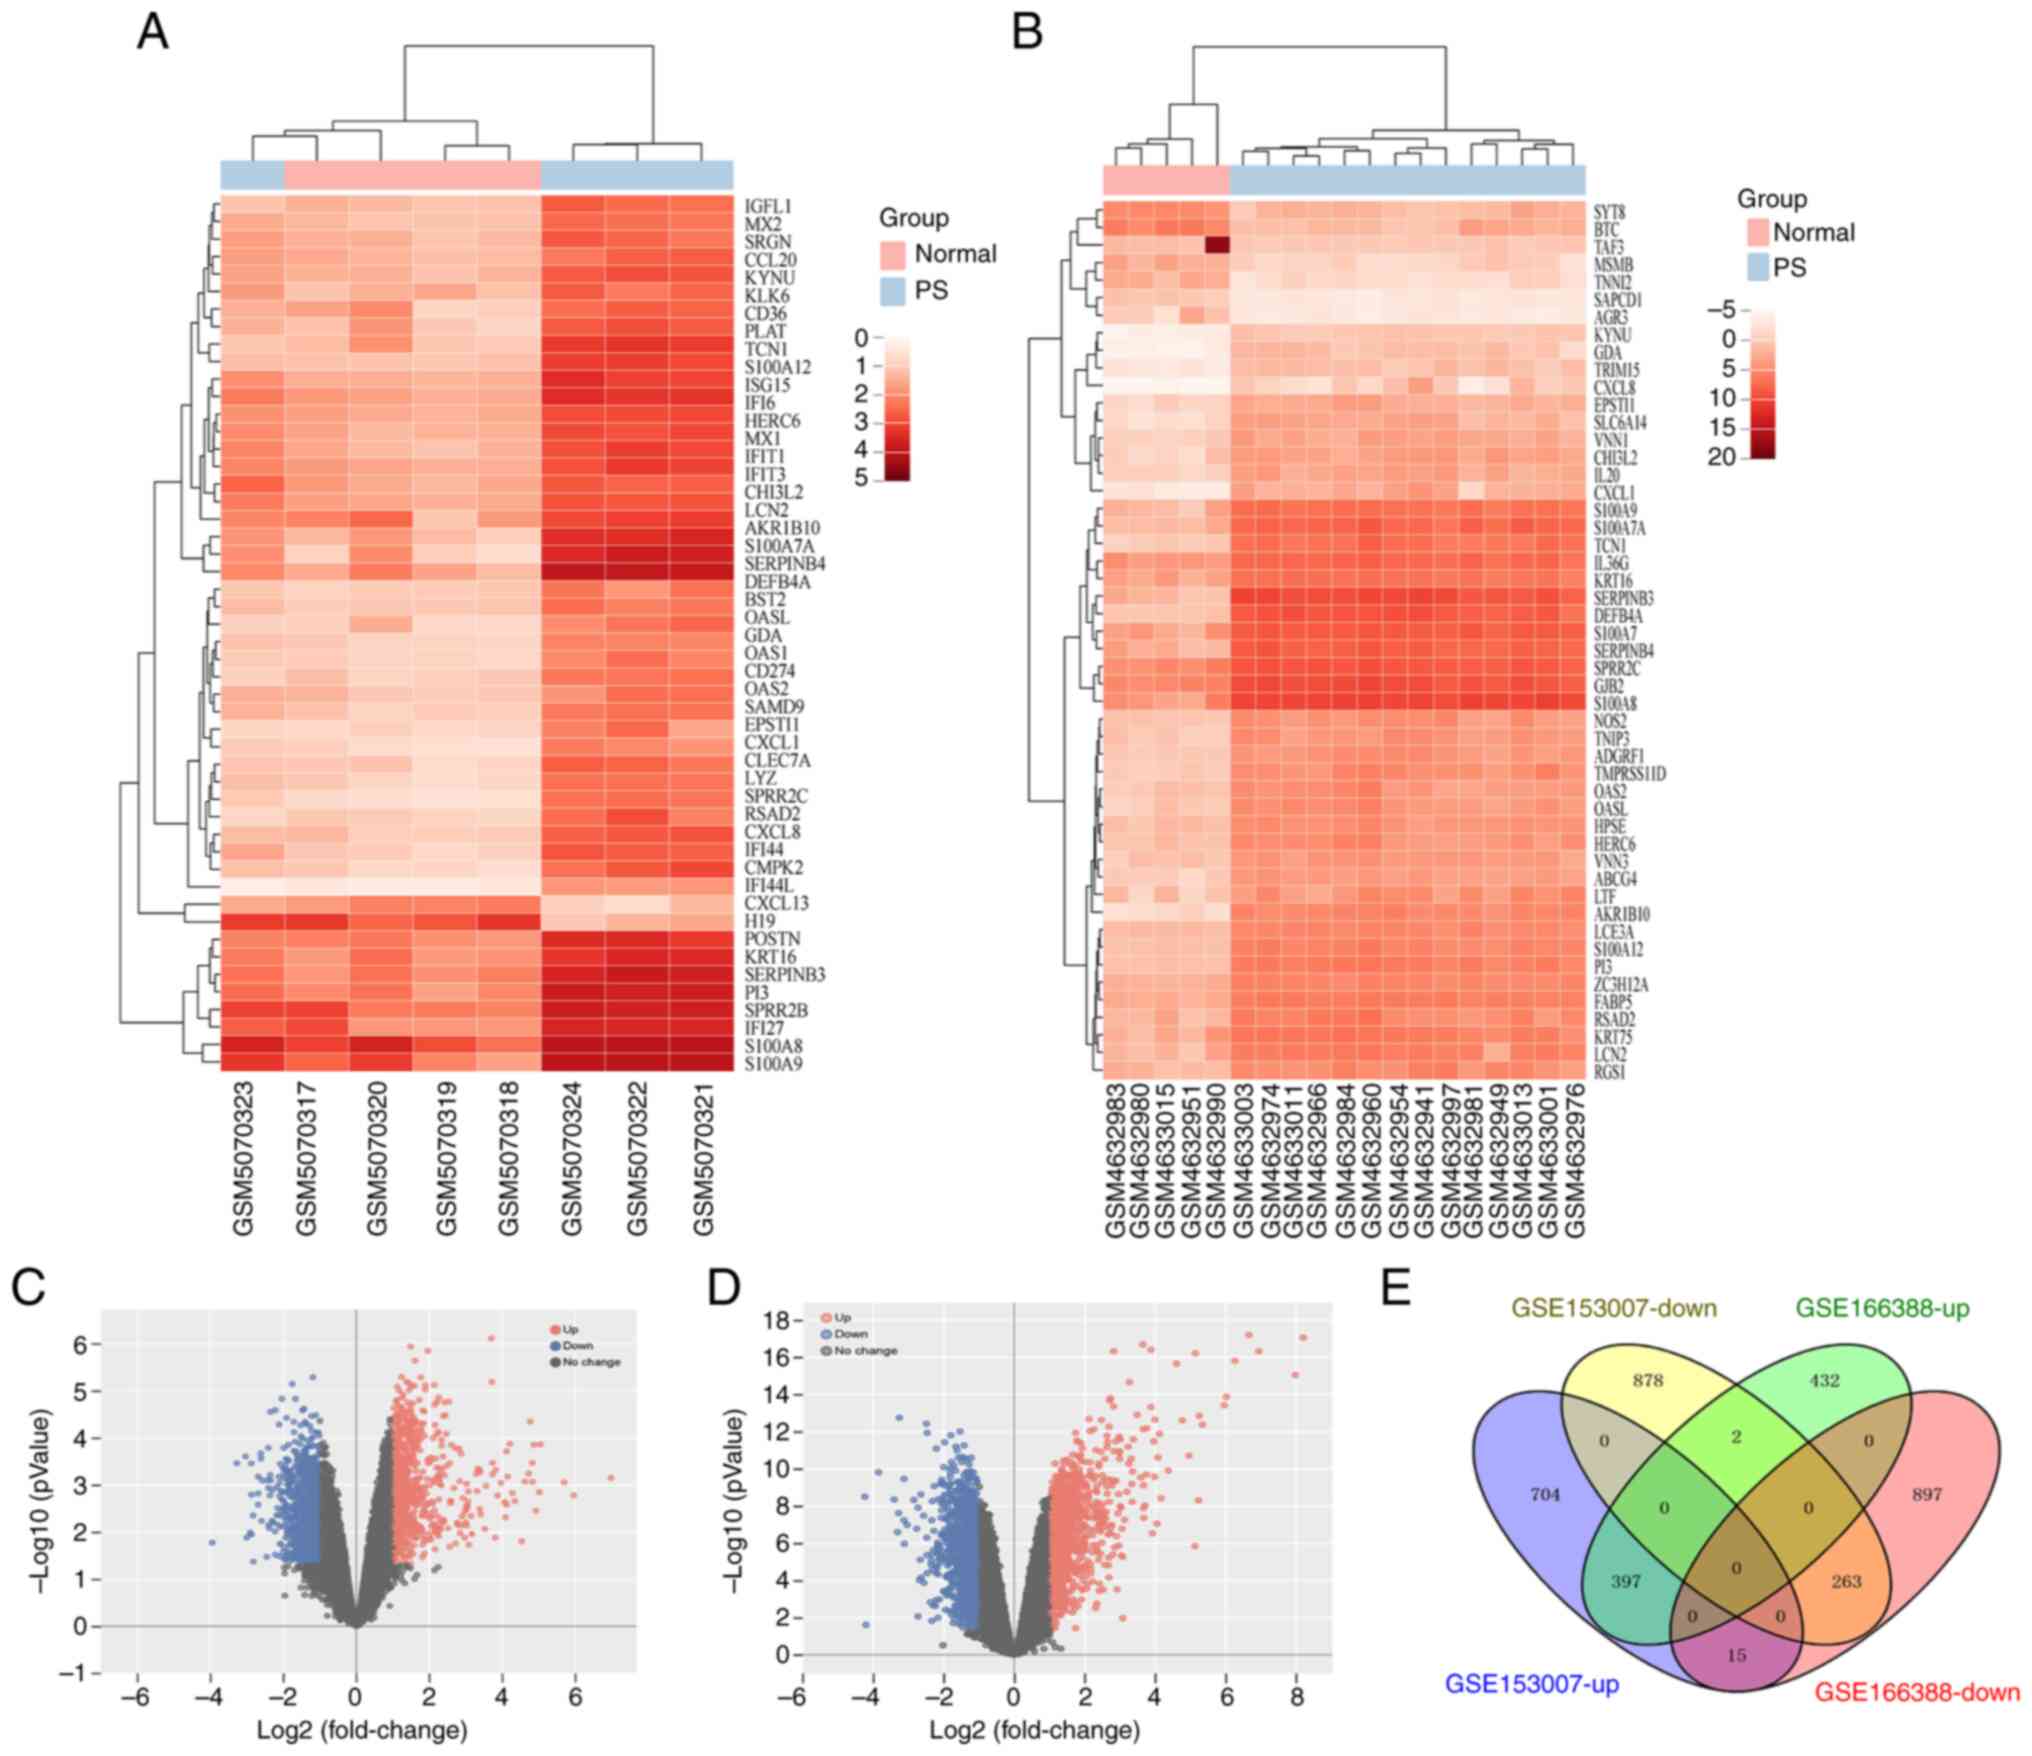
Identification of 660 overlapping DEGs in
gene datasets of psoriasis
The raw data from two datasets (GSE166388 and
GSE153007) were obtained from the GEO database to identify DEGs
associated with psoriasis using GEO2R. There were 2,006 (831 up-
and 1,175 downregulated) in the GSE166388 dataset, and 2,259 DEGs
(1,116 up- and 1,143 downregulated mRNAs) in the GSE153007 dataset
(Fig. 1). In addition, 660
overlapping DEGs, comprising 263 downand 397 upregulated mRNAs,
were obtained using the online bioinformatics program Venny 2.1.0
(Fig. 1E).
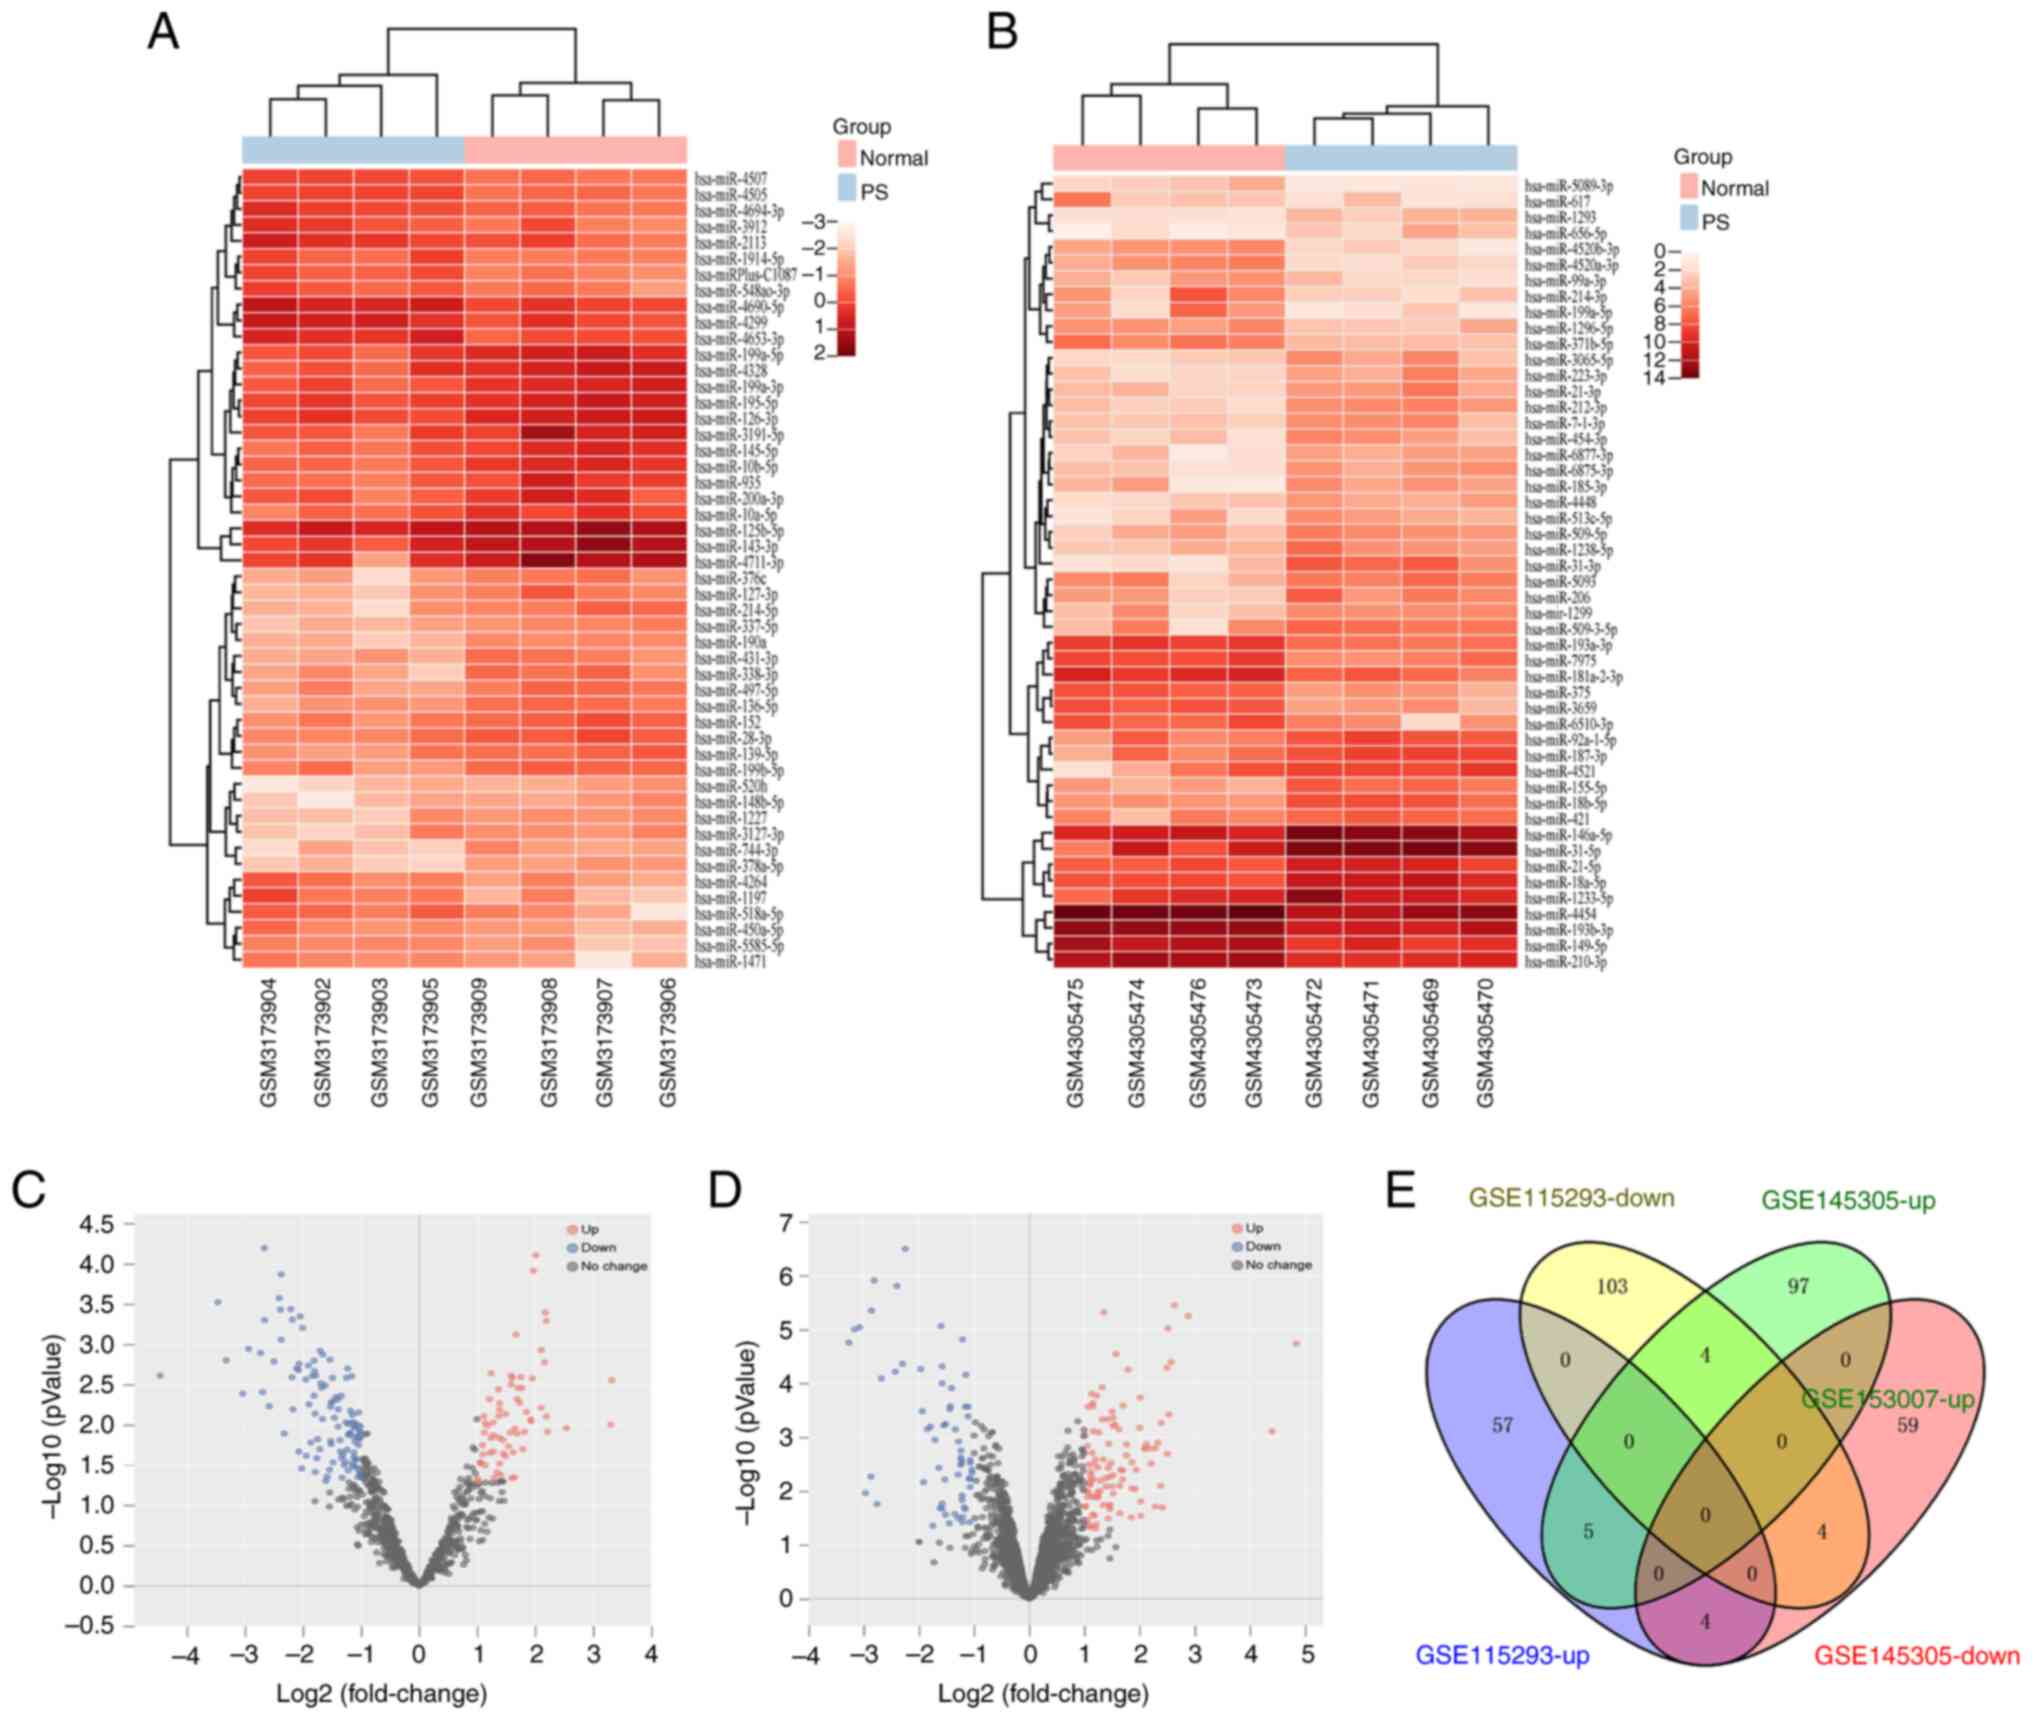
Identification of nine intersecting DEMs
in miRNA datasets of psoriasis
The raw data from GSE115293 and GSE145305 were
obtained from the GEO database to identify DEMs. The GSE115293
dataset had 177 (66 up- and 111 downregulated), whereas the
GSE145305 dataset contained 173 DEMs (106 up- and 67 downregulated;
Fig. 2). Additionally, nine
intersecting DEMs were identified using Venny 2.1.0. These DEMs
included five up- and four downregulated miRNAs (Fig. 2E; Table II).
| Table IIOverlapping differentially expressed
miRs between GSE115293 and GSE145305. |
Table II
Overlapping differentially expressed
miRs between GSE115293 and GSE145305.
| miR | Regulation |
|---|
| hsa-miR-132-3p | Up |
|
hsa-miR-4725-3p | Up |
| hsa-miR-25-5p | Up |
| hsa-miR-155-5p | Up |
| hsa-miR-378h | Up |
|
hsa-miR-371b-5p | Down |
|
hsa-miR-125b-5p | Down |
| hsa-miR-497-5p | Down |
|
hsa-miR-199a-5p | Down |
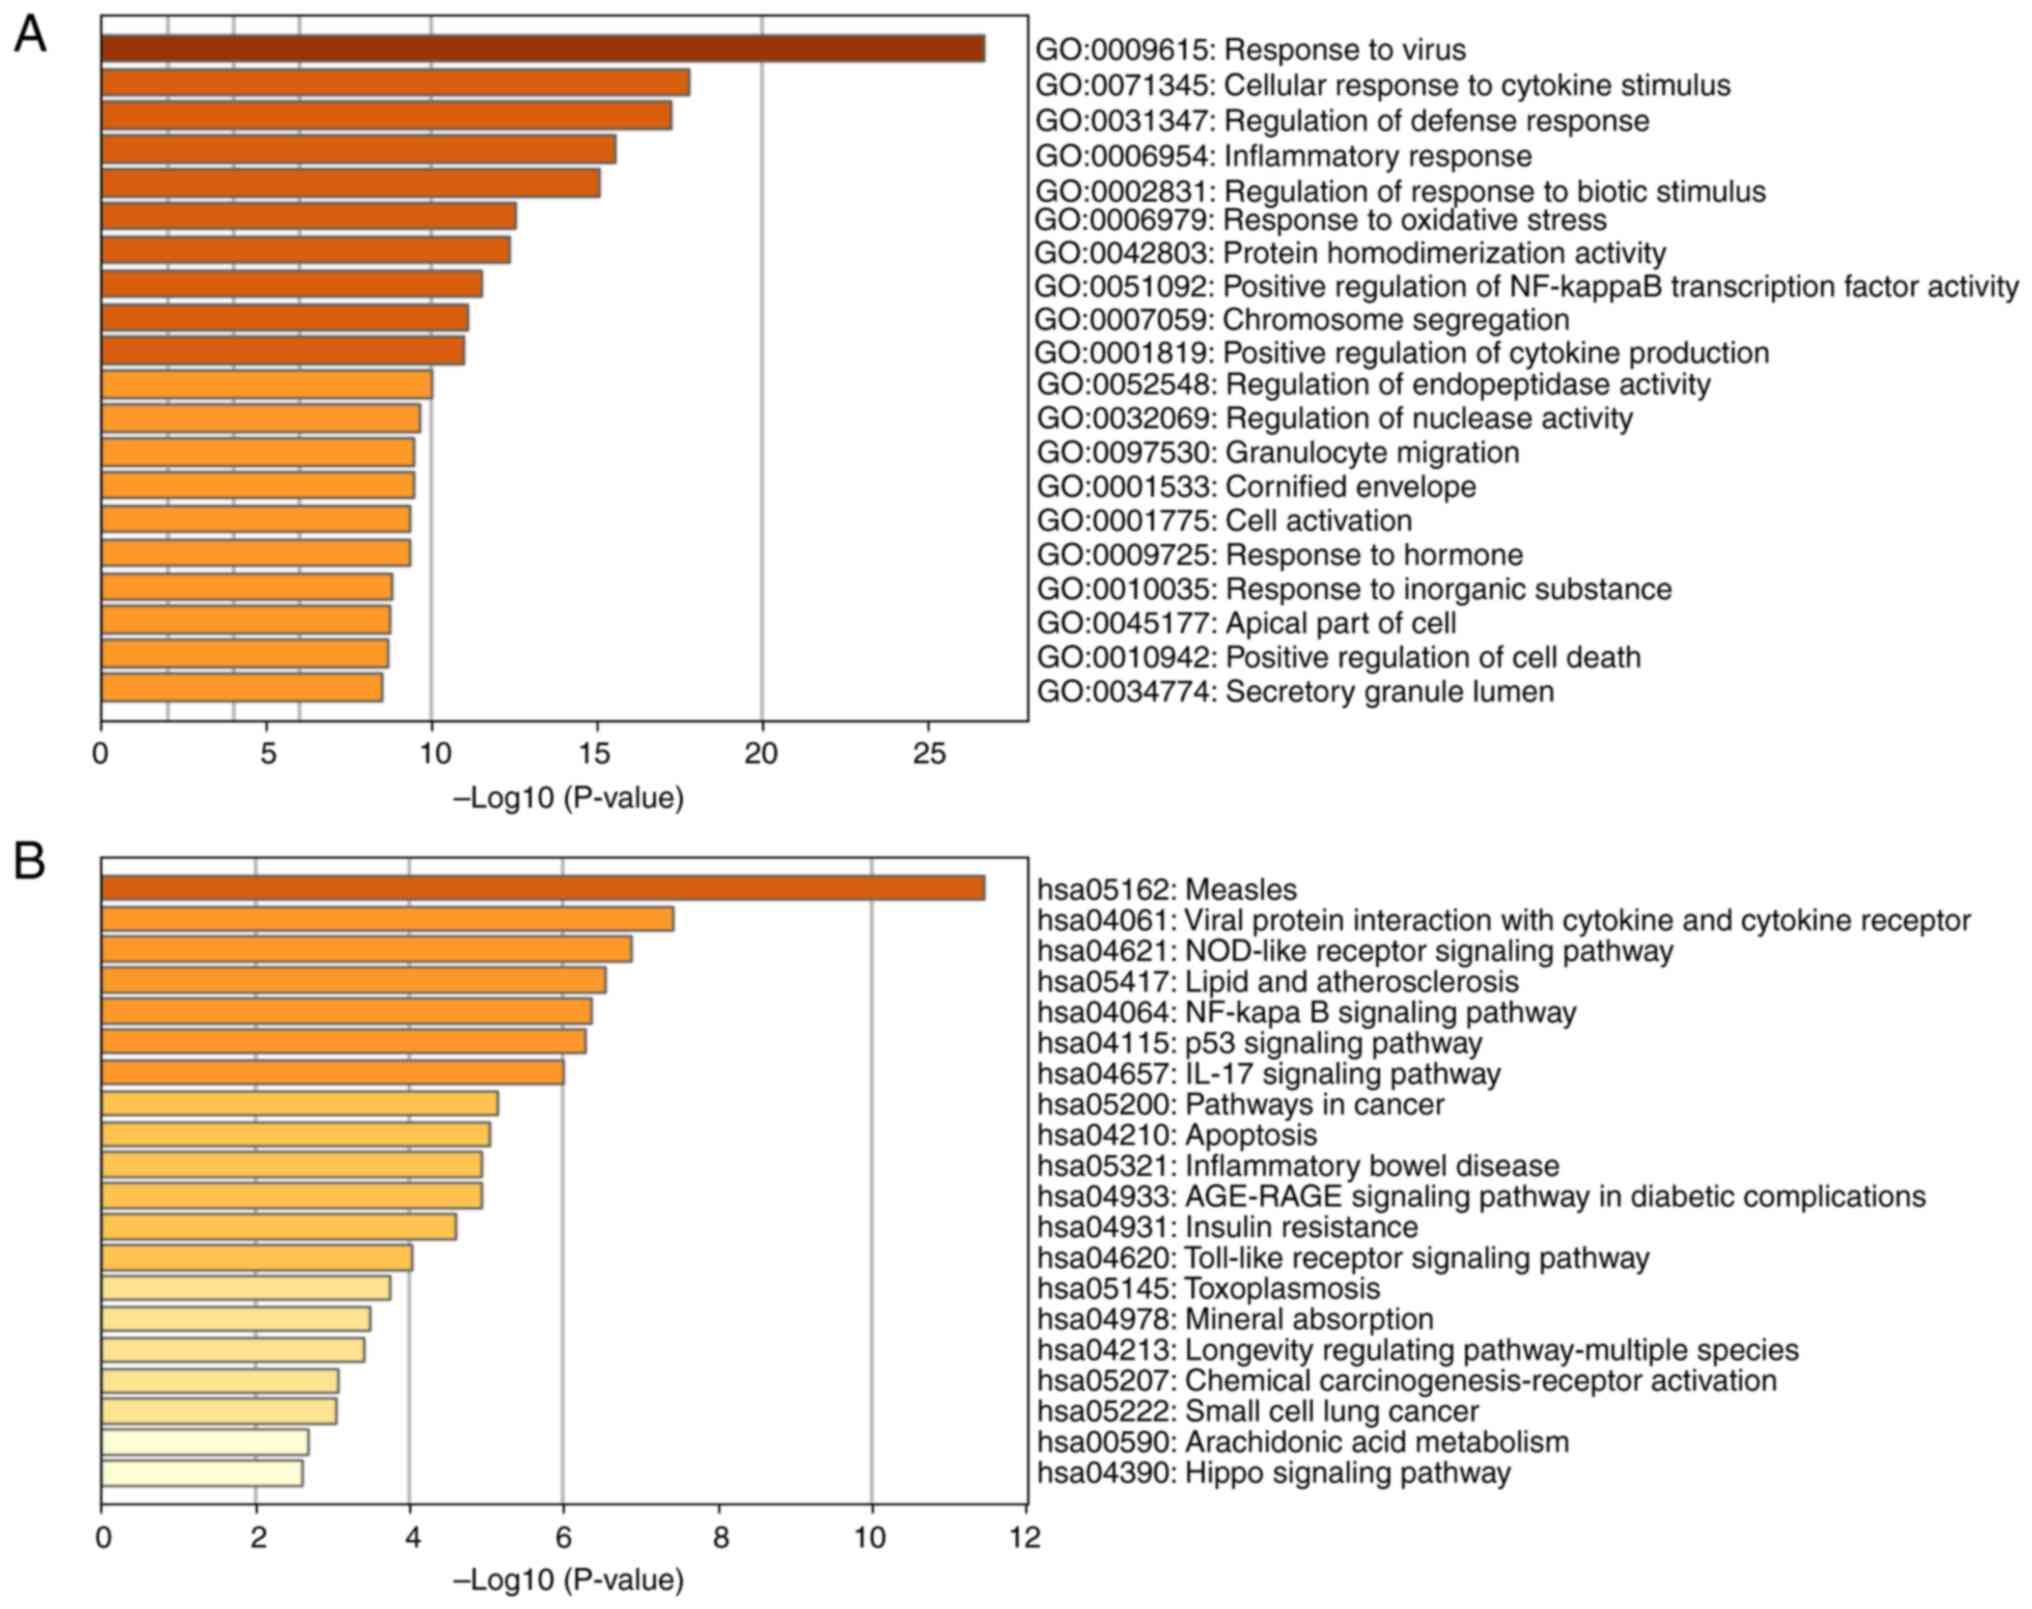
GO and KEGG enrichment analysis of
intersecting DEGs
First, all 660 identified intersecting DEGs were
subjected to GO and KEGG analysis using Metascape to investigate
their pathways and functions. The top 20 KEGG pathways and GO
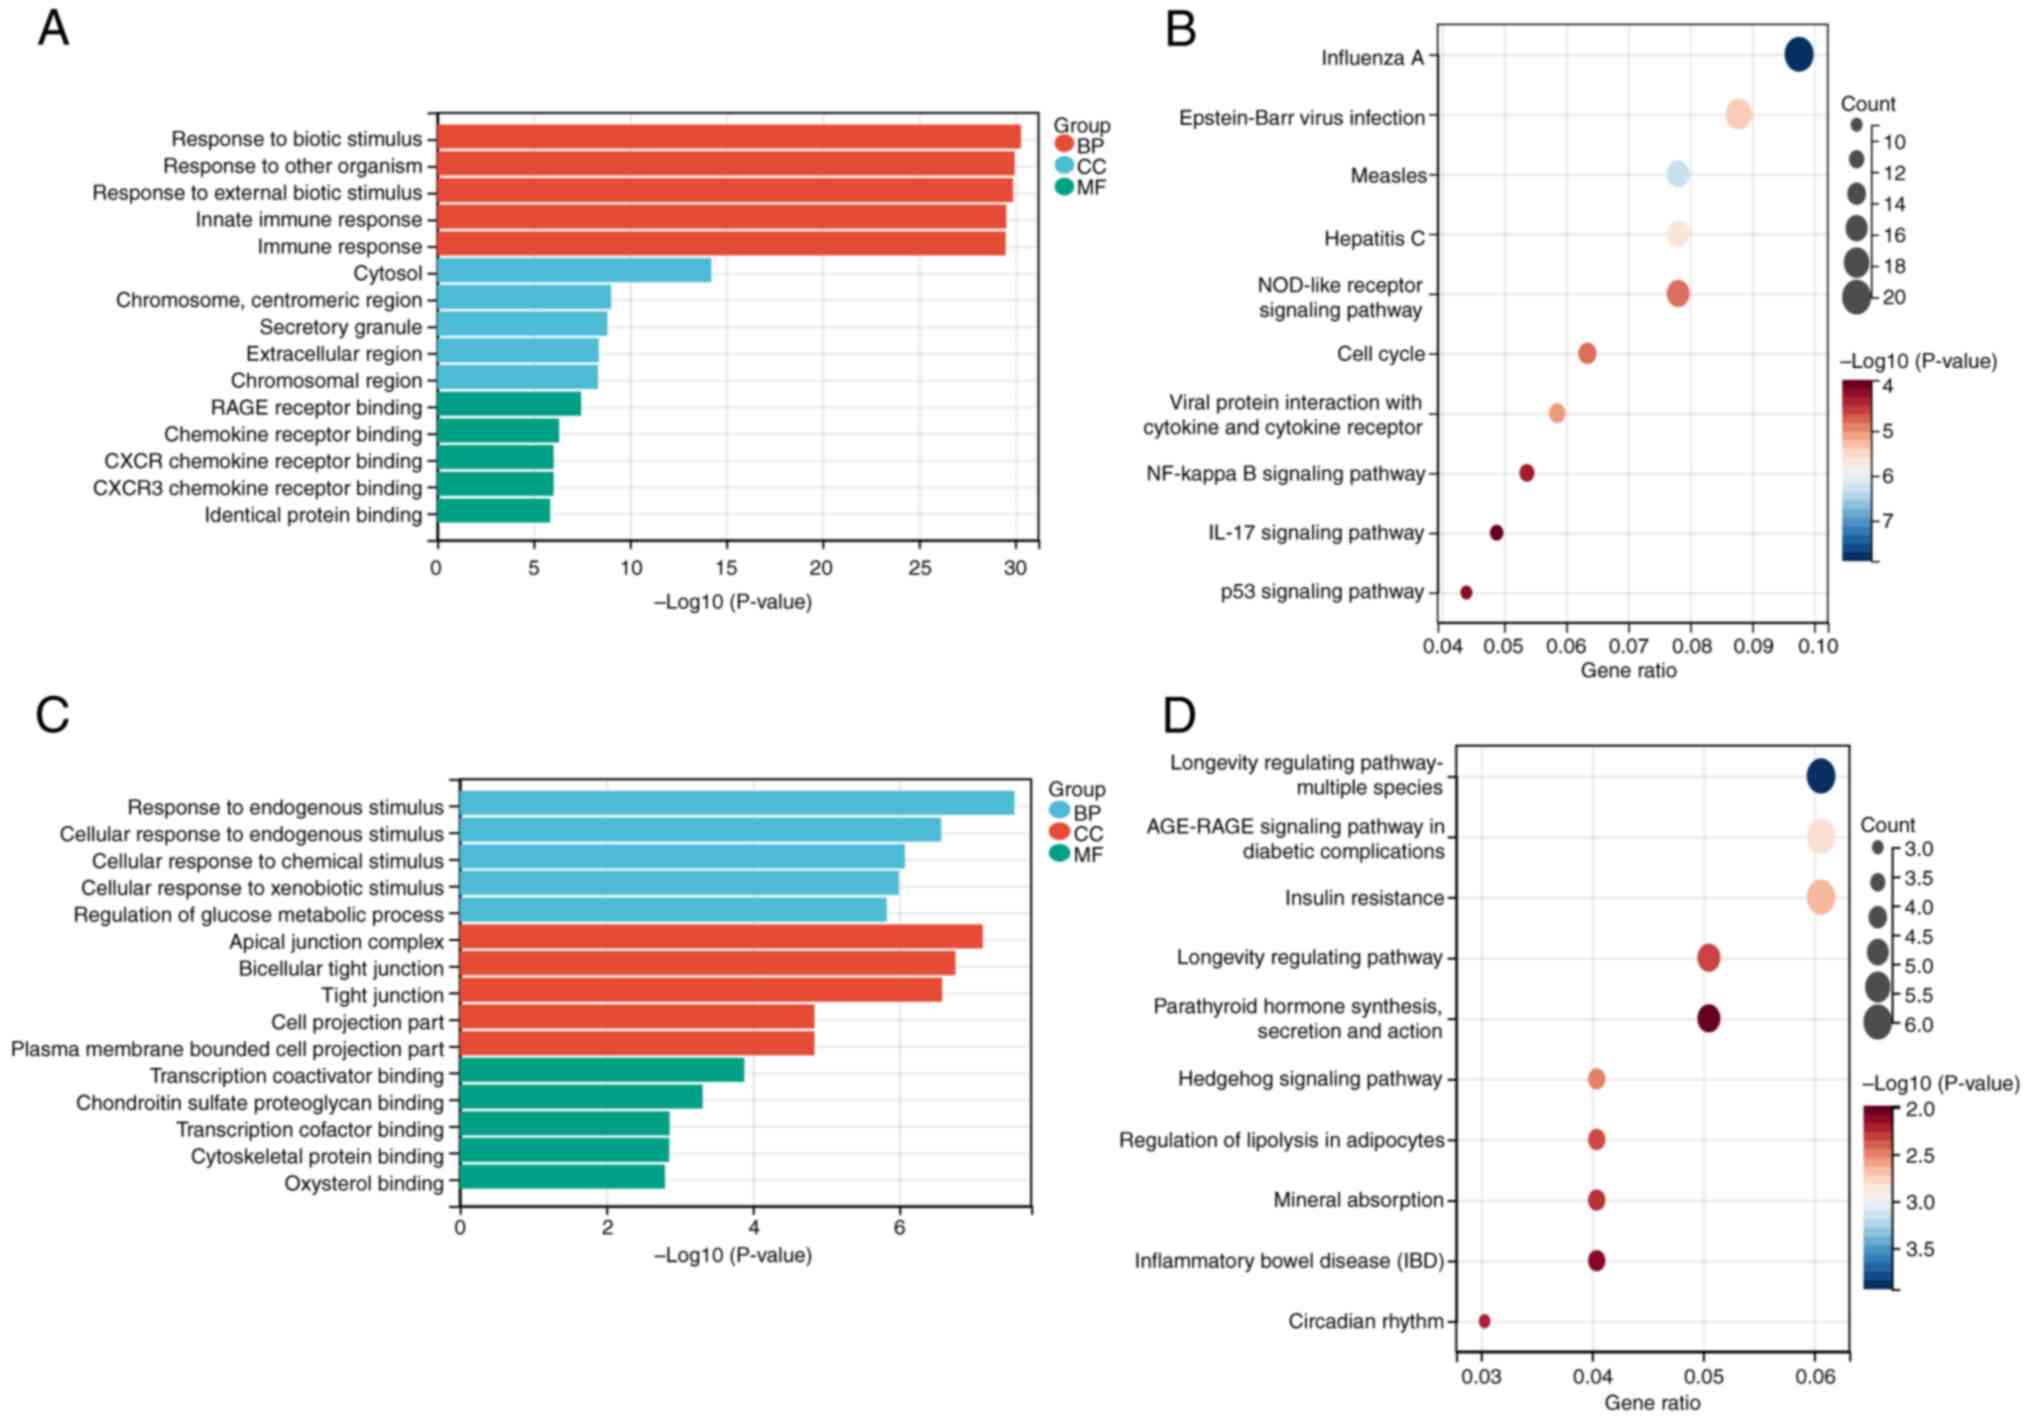
functional annotation results are shown in Fig. 3A and B. The top 10 KEGG pathways
and top 5 GO annotations (including BP, CC and MF) were then
applied to 397 overlapping up- and 263 downregulated genes between
GSE166388 and GSE153007. According to the results, 'response to
biotic stimulus' in BP, 'cytosol' in CC and 'RAGE receptor binding'
in MF were the most enriched terms for upregulated genes in the GO
analysis (Fig. 4A). 'Measles',
'influenza A' and 'Epstein-Barr virus infection' were the primary
enriched pathways in KEGG analysis of the upregulated genes
(Figs. 4B and S1). Concurrently, 'response to
endogenous stimulus' in BP, 'apical junction complex' in CC and
'transcription coactivator binding' in MF were the most enriched
terms for downregulated genes in GO analysis (Fig. 4C). 'Insulin resistance',
'AGE-RAGE signaling in diabetic complications' and 'longevity
regulating pathway-multiple species' were the key enriched pathways
for downregulated genes in the KEGG enrichment analysis (Figs. 4D and S2).
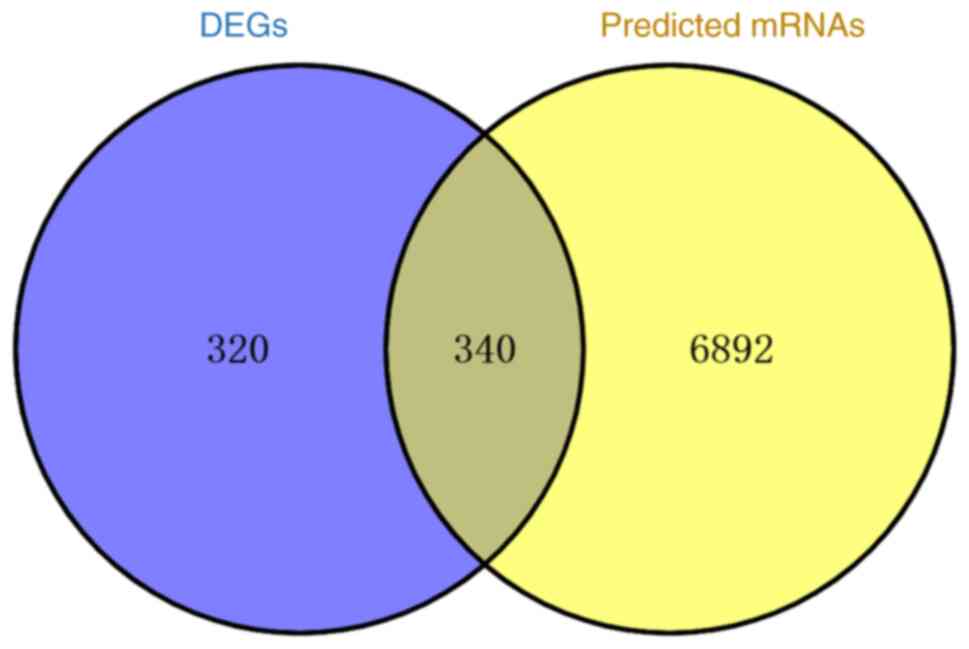
Prediction of miRNA targets
Using miRNet, the downstream target genes of nine
intersecting DEMs were predicted, yielding 7,232 anticipated target
genes. To identify target genes for construction of the miRNA-mRNA
network, 660 crossover DEGs and projected miRNA target genes were
trimmed simultaneously using Venny 2.1.0 (Fig. 5), resulting in 340 dysregulated
crossover target genes.
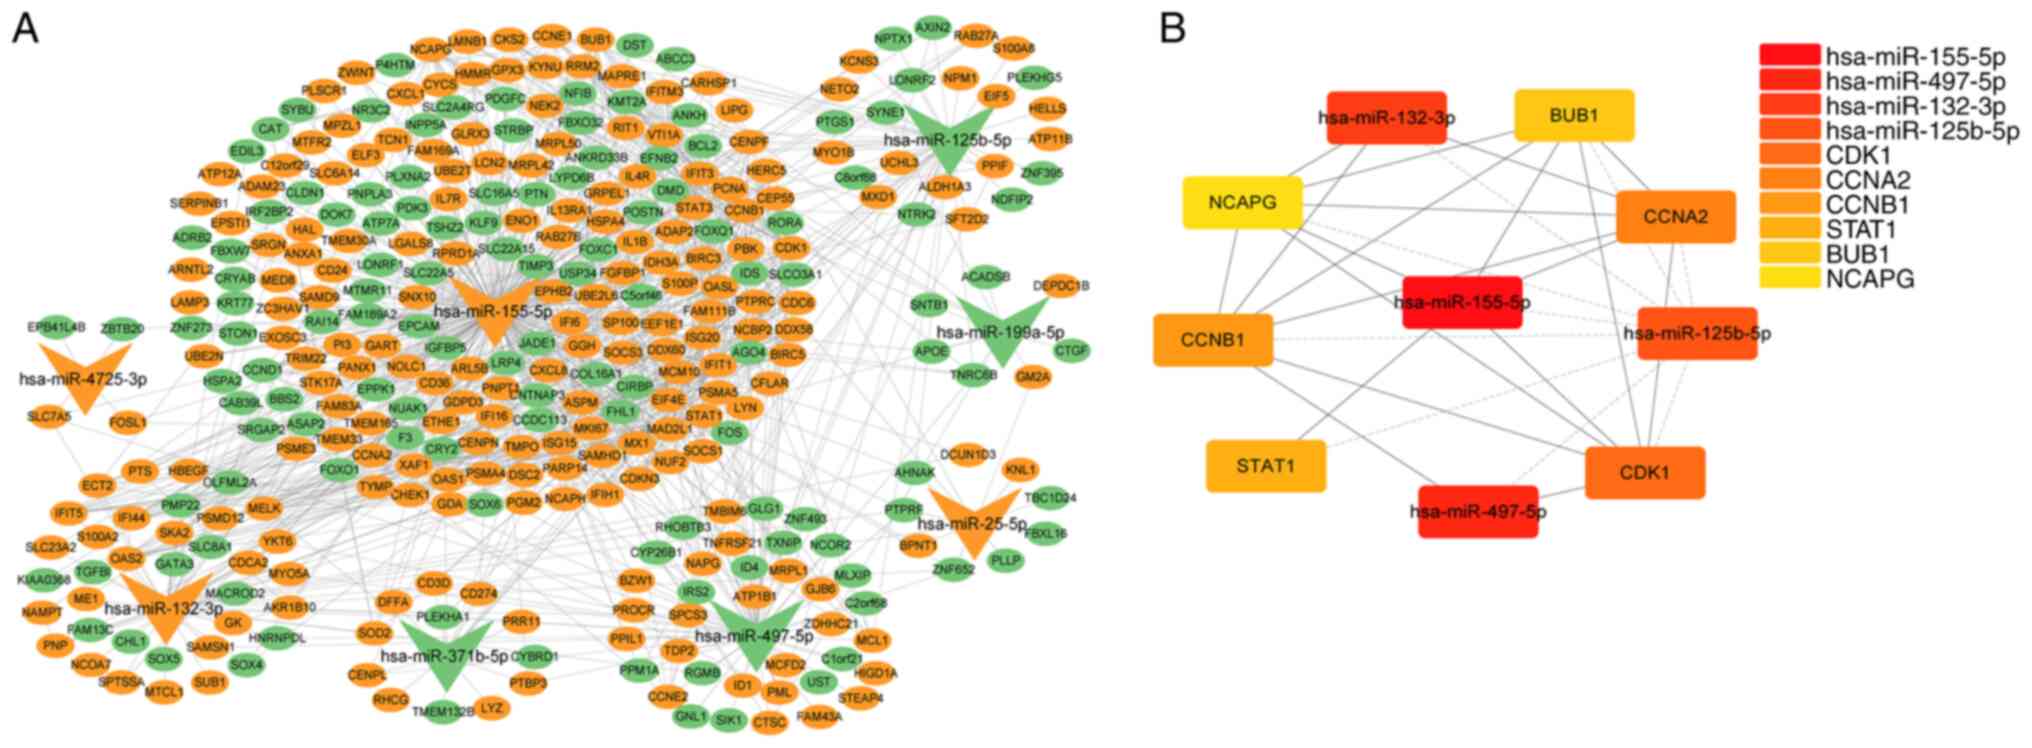
miRNA-mRNA network construction and core
network analysis
PPI data from STRING and miRNA and corresponding
downstream target gene data were combined and imported into
Cytoscape 3.9.1 to establish an interaction network between
psoriasis DEMs and 340 target mRNAs (Fig. 6A). hsa-miR-155-5p was linked with
the most target genes, while hsa-miR-4725-3p was linked with the
least number of target genes. The degree approach was employed to
extract the core network using the cytoHubba plugin in Cytoscape
(Fig. 6B). The top 10 elements
in psoriasis included six hub genes with elevated expression,
including cyclin dependent kinase 1, cyclin A2), CCNB1 (cyclin B1),
STAT1, BUB1 mitotic checkpoint serine/threonine kinase) and NCAPG
(non-SMC condensin I complex subunit G, as well as four miRNAs,
including upregulated hsa-miR-155-5p and hsa-miR-132-3p and
downregulated hsa-miR-497-5p and hsa-miR-125b-5p (Table III). hsa-miR-155-5p, which was
upregulated in psoriatic skin, had the highest score and greatest
number of associated genes, suggesting it may serve a key role in
controlling the onset and progression of psoriasis. Therefore, the
function of hsa-miR-155-5p in the control of psoriasis was
investigated.
| Table IIITop10 elements of the core network in
miRNA-mRNA network construction. |
Table III
Top10 elements of the core network in
miRNA-mRNA network construction.
| Node | Degree | Regulation |
|---|
| hsa-miR-155-5p | 258 | Up |
| hsa-miR-497-5p | 70 | Down |
| hsa-miR-132-3p | 57 | Up |
|
hsa-miR-125b-5p | 50 | Down |
| CDK1 | 31 | Up |
| CCNA2 | 28 | Up |
| CCNB1 | 26 | Up |
| STAT1 | 24 | Up |
| BUB1 | 23 | Up |
| NCAPG | 22 | Up |
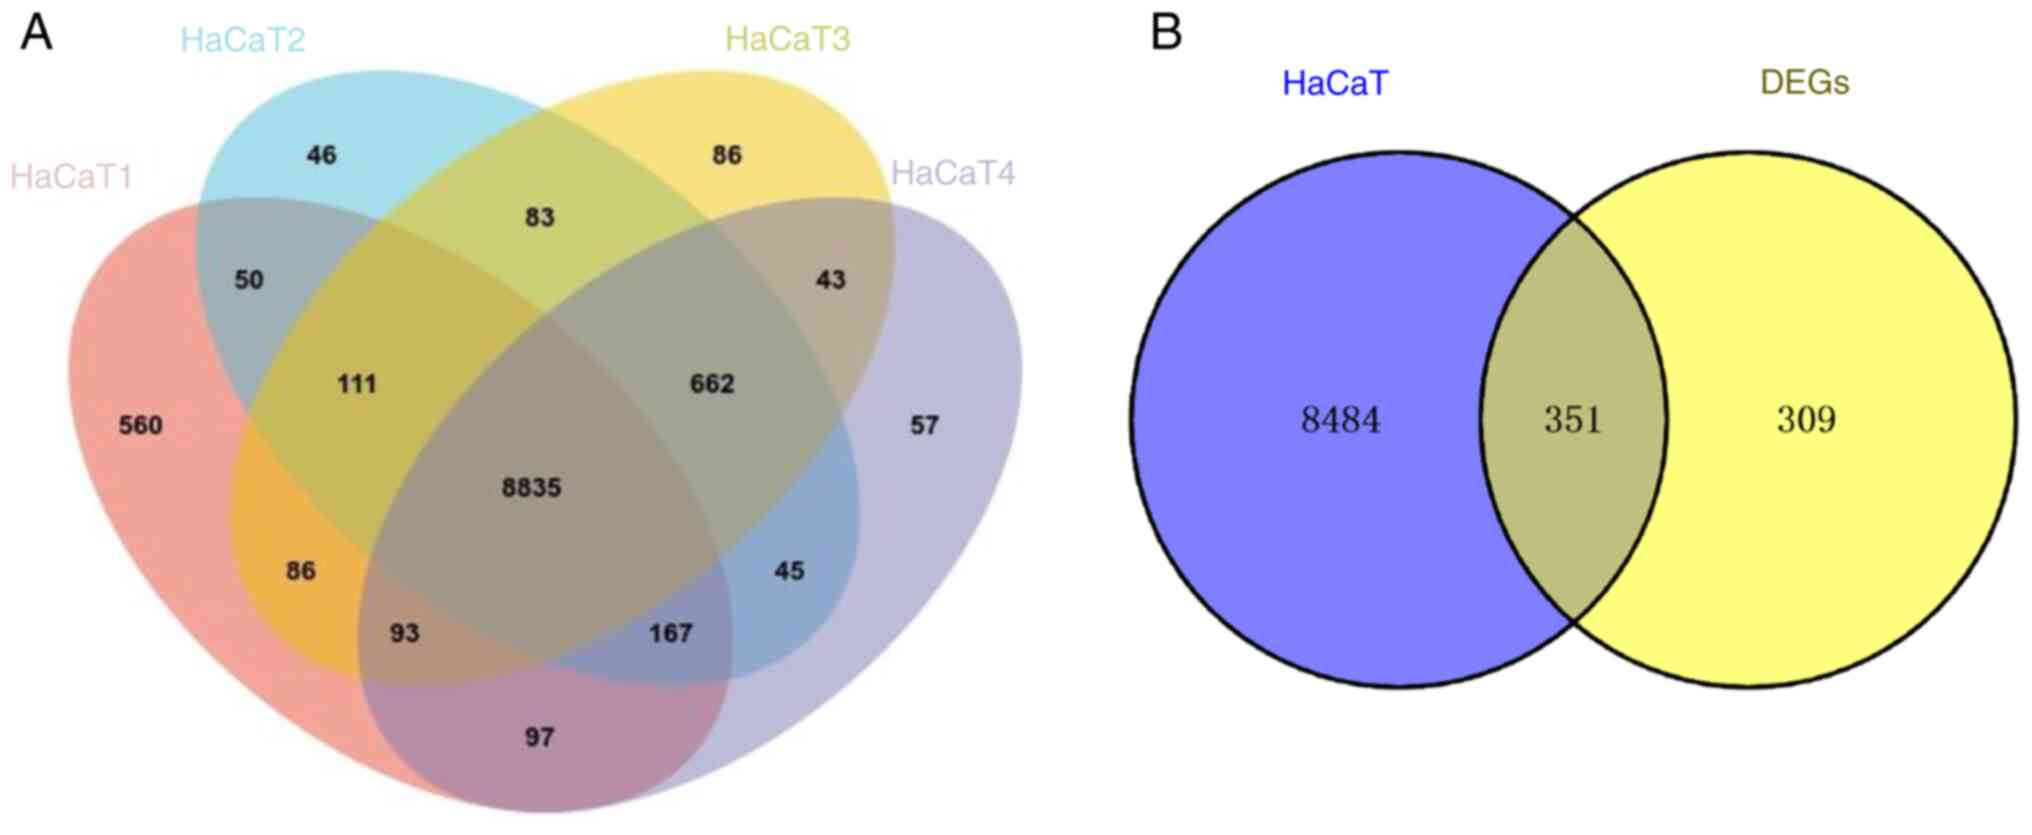
Screening of co-expressed genes between
HaCaT cell line and psoriatic skin
The original data from GSE202683 dataset was
obtained from the GEO database, which contained gene sequencing
results from four HaCaT cell samples. The expression data were
analyzed using Venny 2.1.0 to obtain 8,835 overlapping genes that
were expressed in HaCaT cells (Fig.
7A). To facilitate screening of target genes, a Venn diagram
was used to illustrate the intersect of the 8,835 overlapping genes
and 660 significantly DEGs screened in psoriatic skin. From this
intersect, 351 co-expressed genes between HaCaT cell line and
psoriatic skin were identified (Fig.
7B).
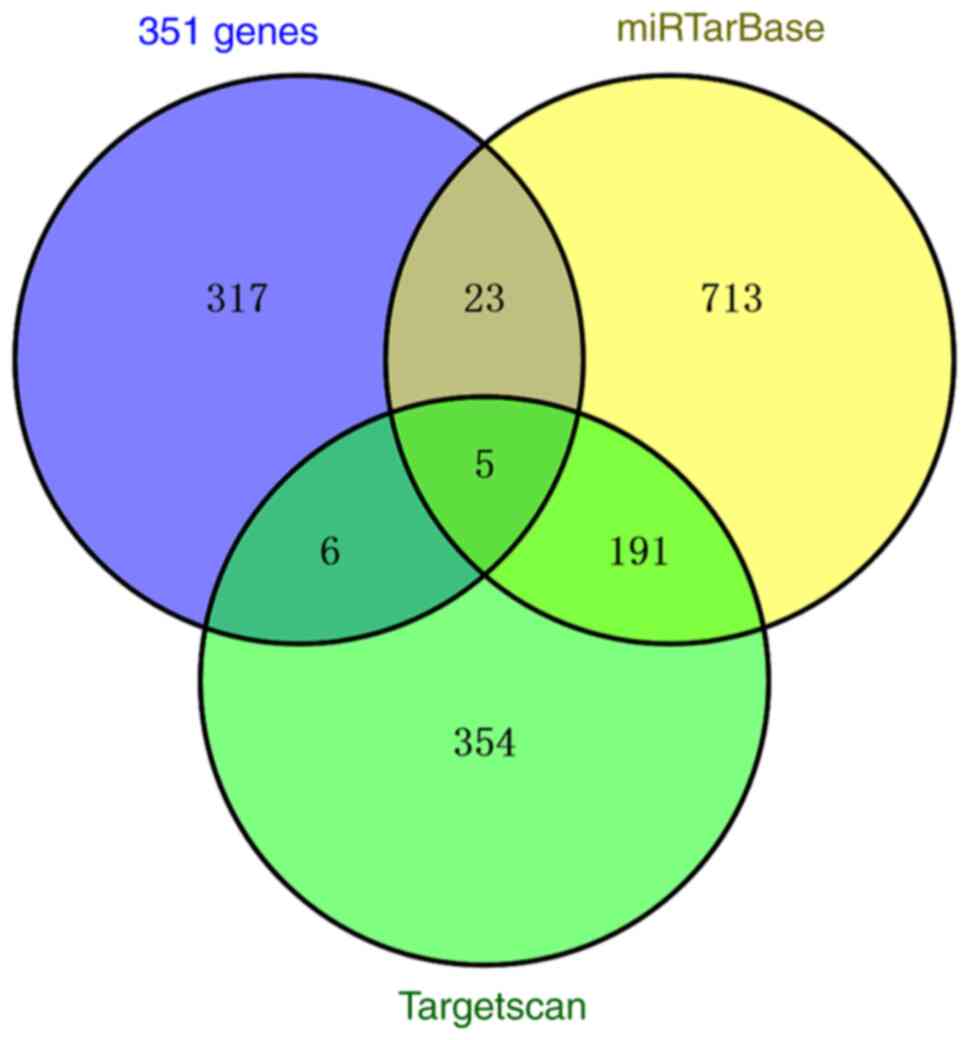
Prediction of hsa-miR-155-5p targets
The downstream target genes of miR-155 were
predicted using TargetScan and miRTarBase. In TargetScan database,
556 genes were predicted, whereas 932 genes were predicted in
miRTarBase. In addition, intersection of 351 co-expressed genes and
predicted target genes was determined using Venny 2.1.0, from which
five candidate genes were obtained, including IRF2BP2, claudin 1,
CARHSP1 (calcium regulated heat stable protein 1), ARL5B (ADP
ribosylation factor like GTPase 5B and TMEM33 (transmembrane
protein 33) (Fig. 8). Psoriasis
etiology is associated with immunological and inflammatory
responses and research has shown that IRF2BP2 is associated with
inflammatory responses (12).
Therefore, IRF2BP2 was selected for further investigation.
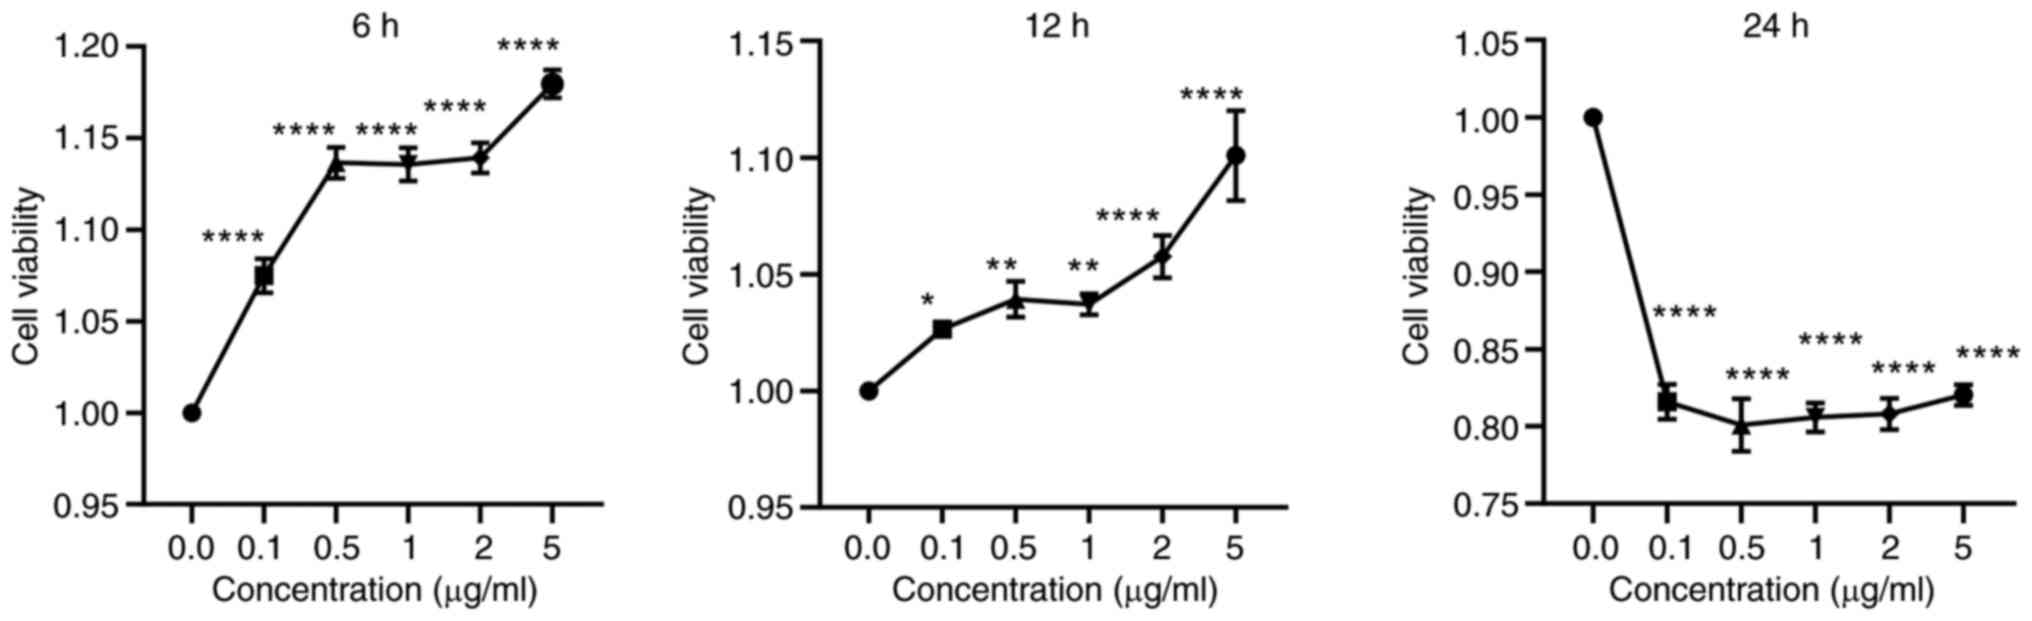
Impact of LPS on HaCaT cell
viability
The viability of HaCaT cells treated with LPS was
assessed using CCK-8 reagent (Fig.
9). Compared with 0.0 μg/ml LPS, HaCaT cell viability
increased after 6 and 12 h of LPS stimulation but decreased after
24 h. After 6 and 12 h of LPS stimulation, the cell viability of
HaCaT cells changed significantly when the concentration of LPS was
0.0-0.5 μg/ml and 2-5 μg/ml. The viability of HaCaT
cells was the highest after LPS stimulation for 6 h. Since the
change of LPS concentration has a great influence on the viability
of HaCaT cells, and when the LPS stimulation concentration is ~1
μg/ml, the viability of HaCaT cells is relatively stable.
Therefore, treatment with 1 μg/ml LPS for 6 h was selected
for subsequent experiments.
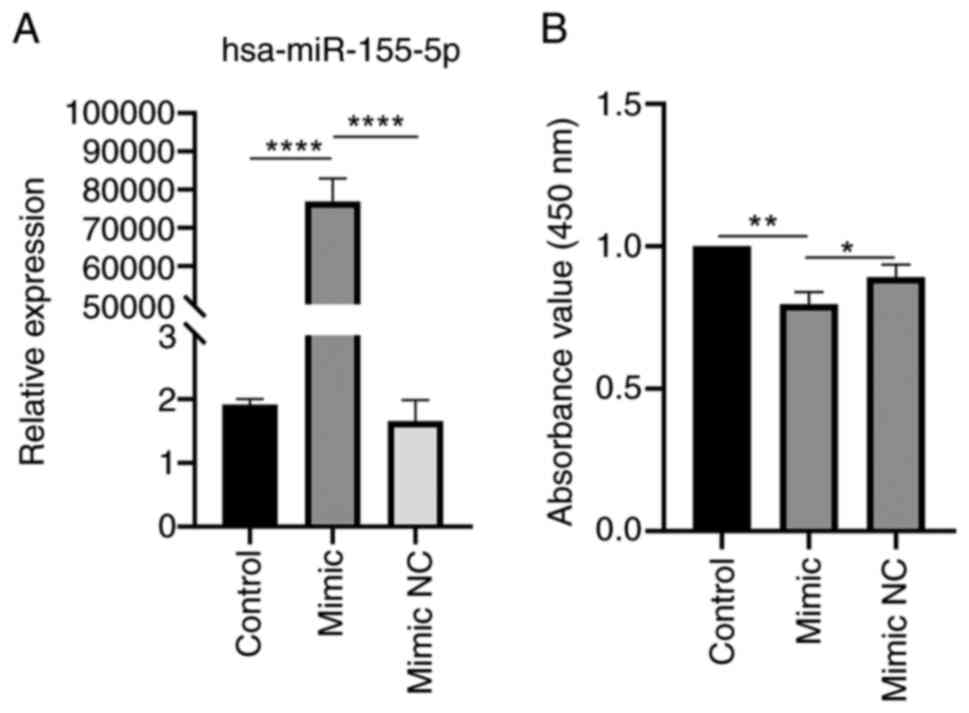
Proliferation of HaCaT cells is inhibited
by miR-155-5p over-expression
HaCaT cells were transfected with miR-155 mimic and
NC to evaluate the effect of miR-155 on the biological function of
cells. miR-155 mimic significantly enhanced expression of miR-155
(Fig. 10A). HaCaT cell
proliferation was assessed using CCK-8 reagent 48 h after
transfection. miR-155 mimic significantly suppressed HaCaT cell
proliferation compared with control and mimic NC group (Fig. 10B). Overexpressing miR-155 may
prevent proliferation of HaCaT cells.
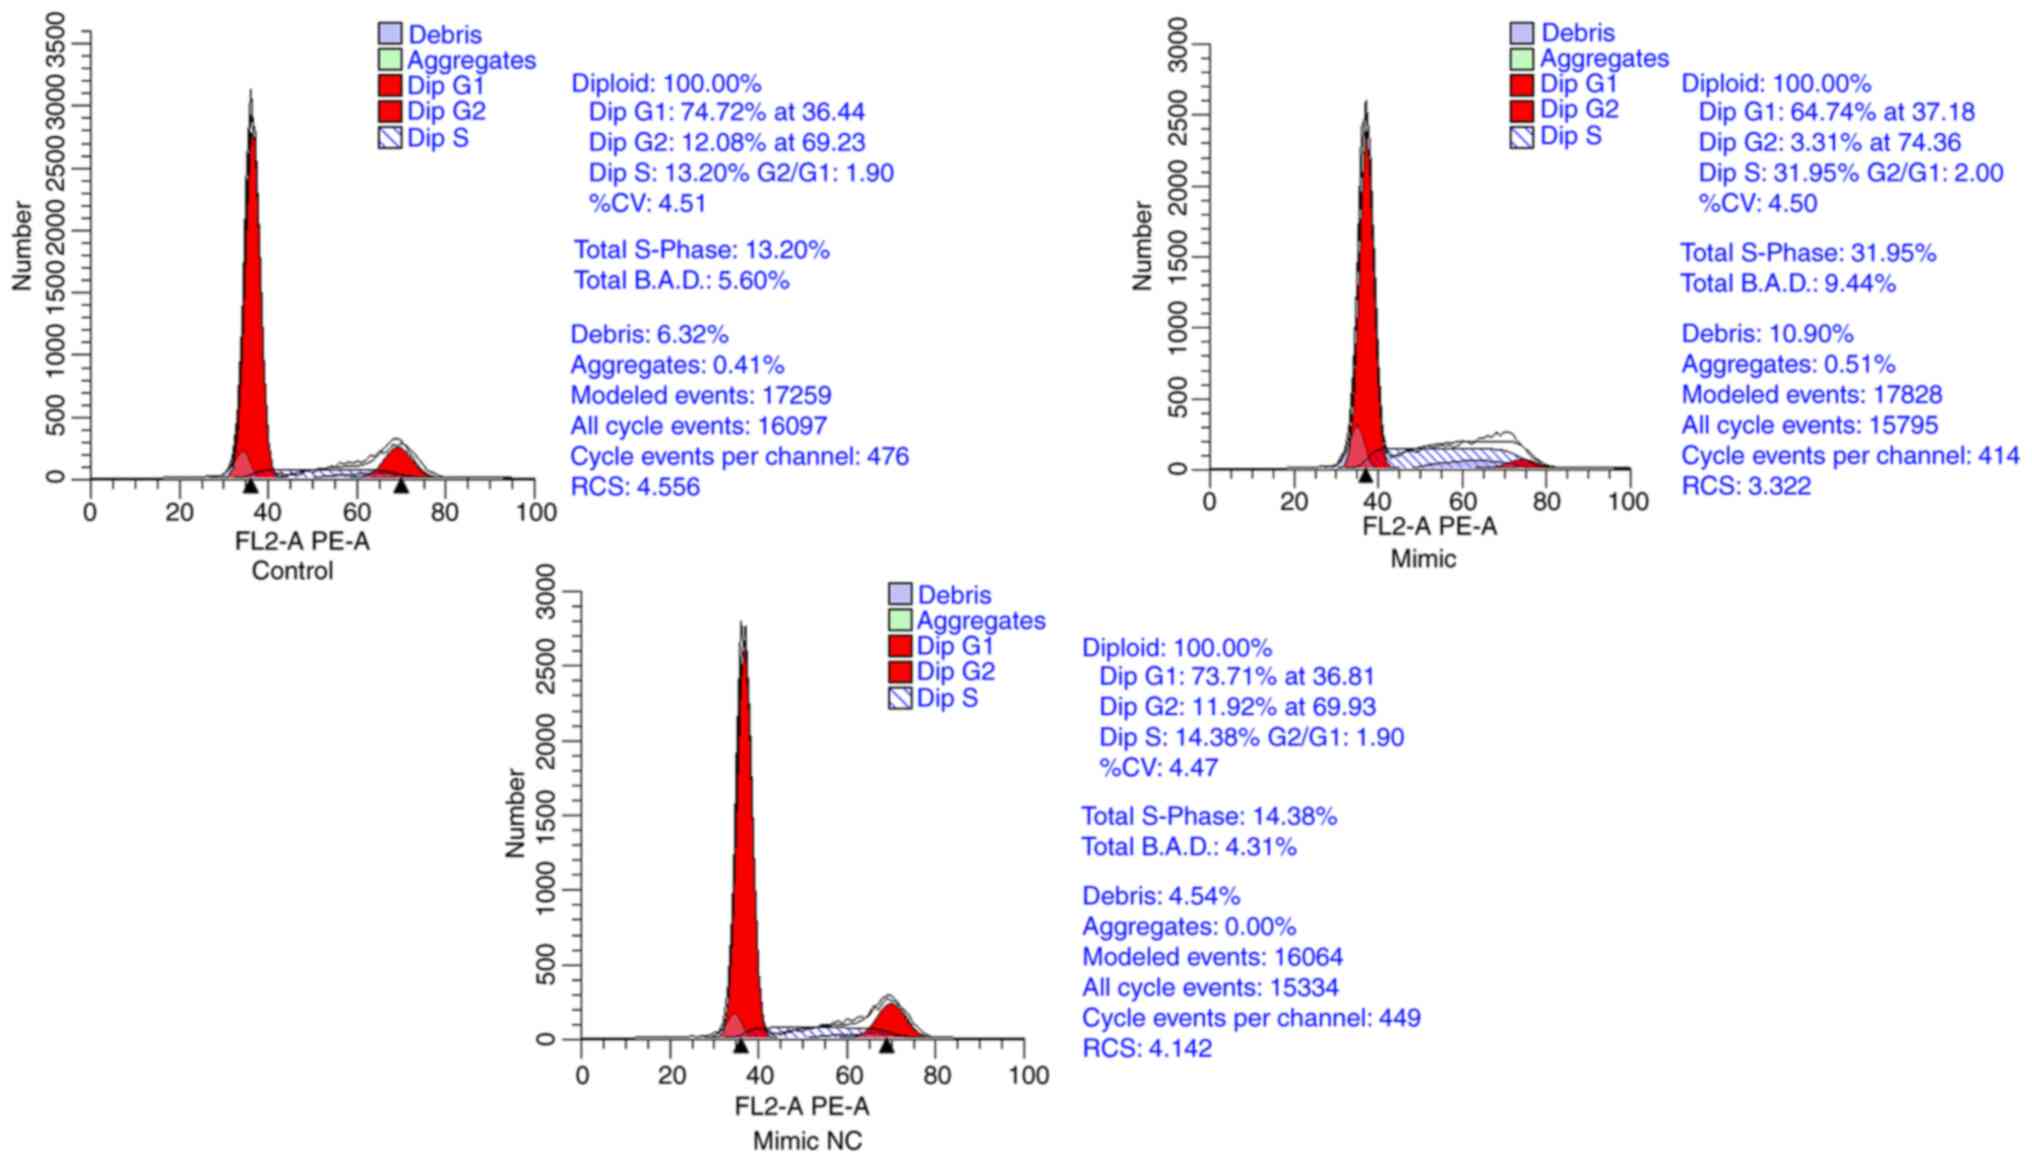
Overexpression of miR-155-5p arrests
cells in S phase
Following transfection with the miR-155 mimic and
corresponding mimic NC, flow cytometry was conducted. miR-155 mimic
group had significantly fewer cells in G1 and G2 phases and
significantly more cells in S phase compared with the control and
mimic NC groups. However, there was no significant difference in
the cell cycle distribution between the control and mimic NC groups
(Fig. 11). Overexpression of
miR-155 promoted cells from G1 phase into S phase and arrested
cells in the S phase, thus significantly the number of cells in S
phase.
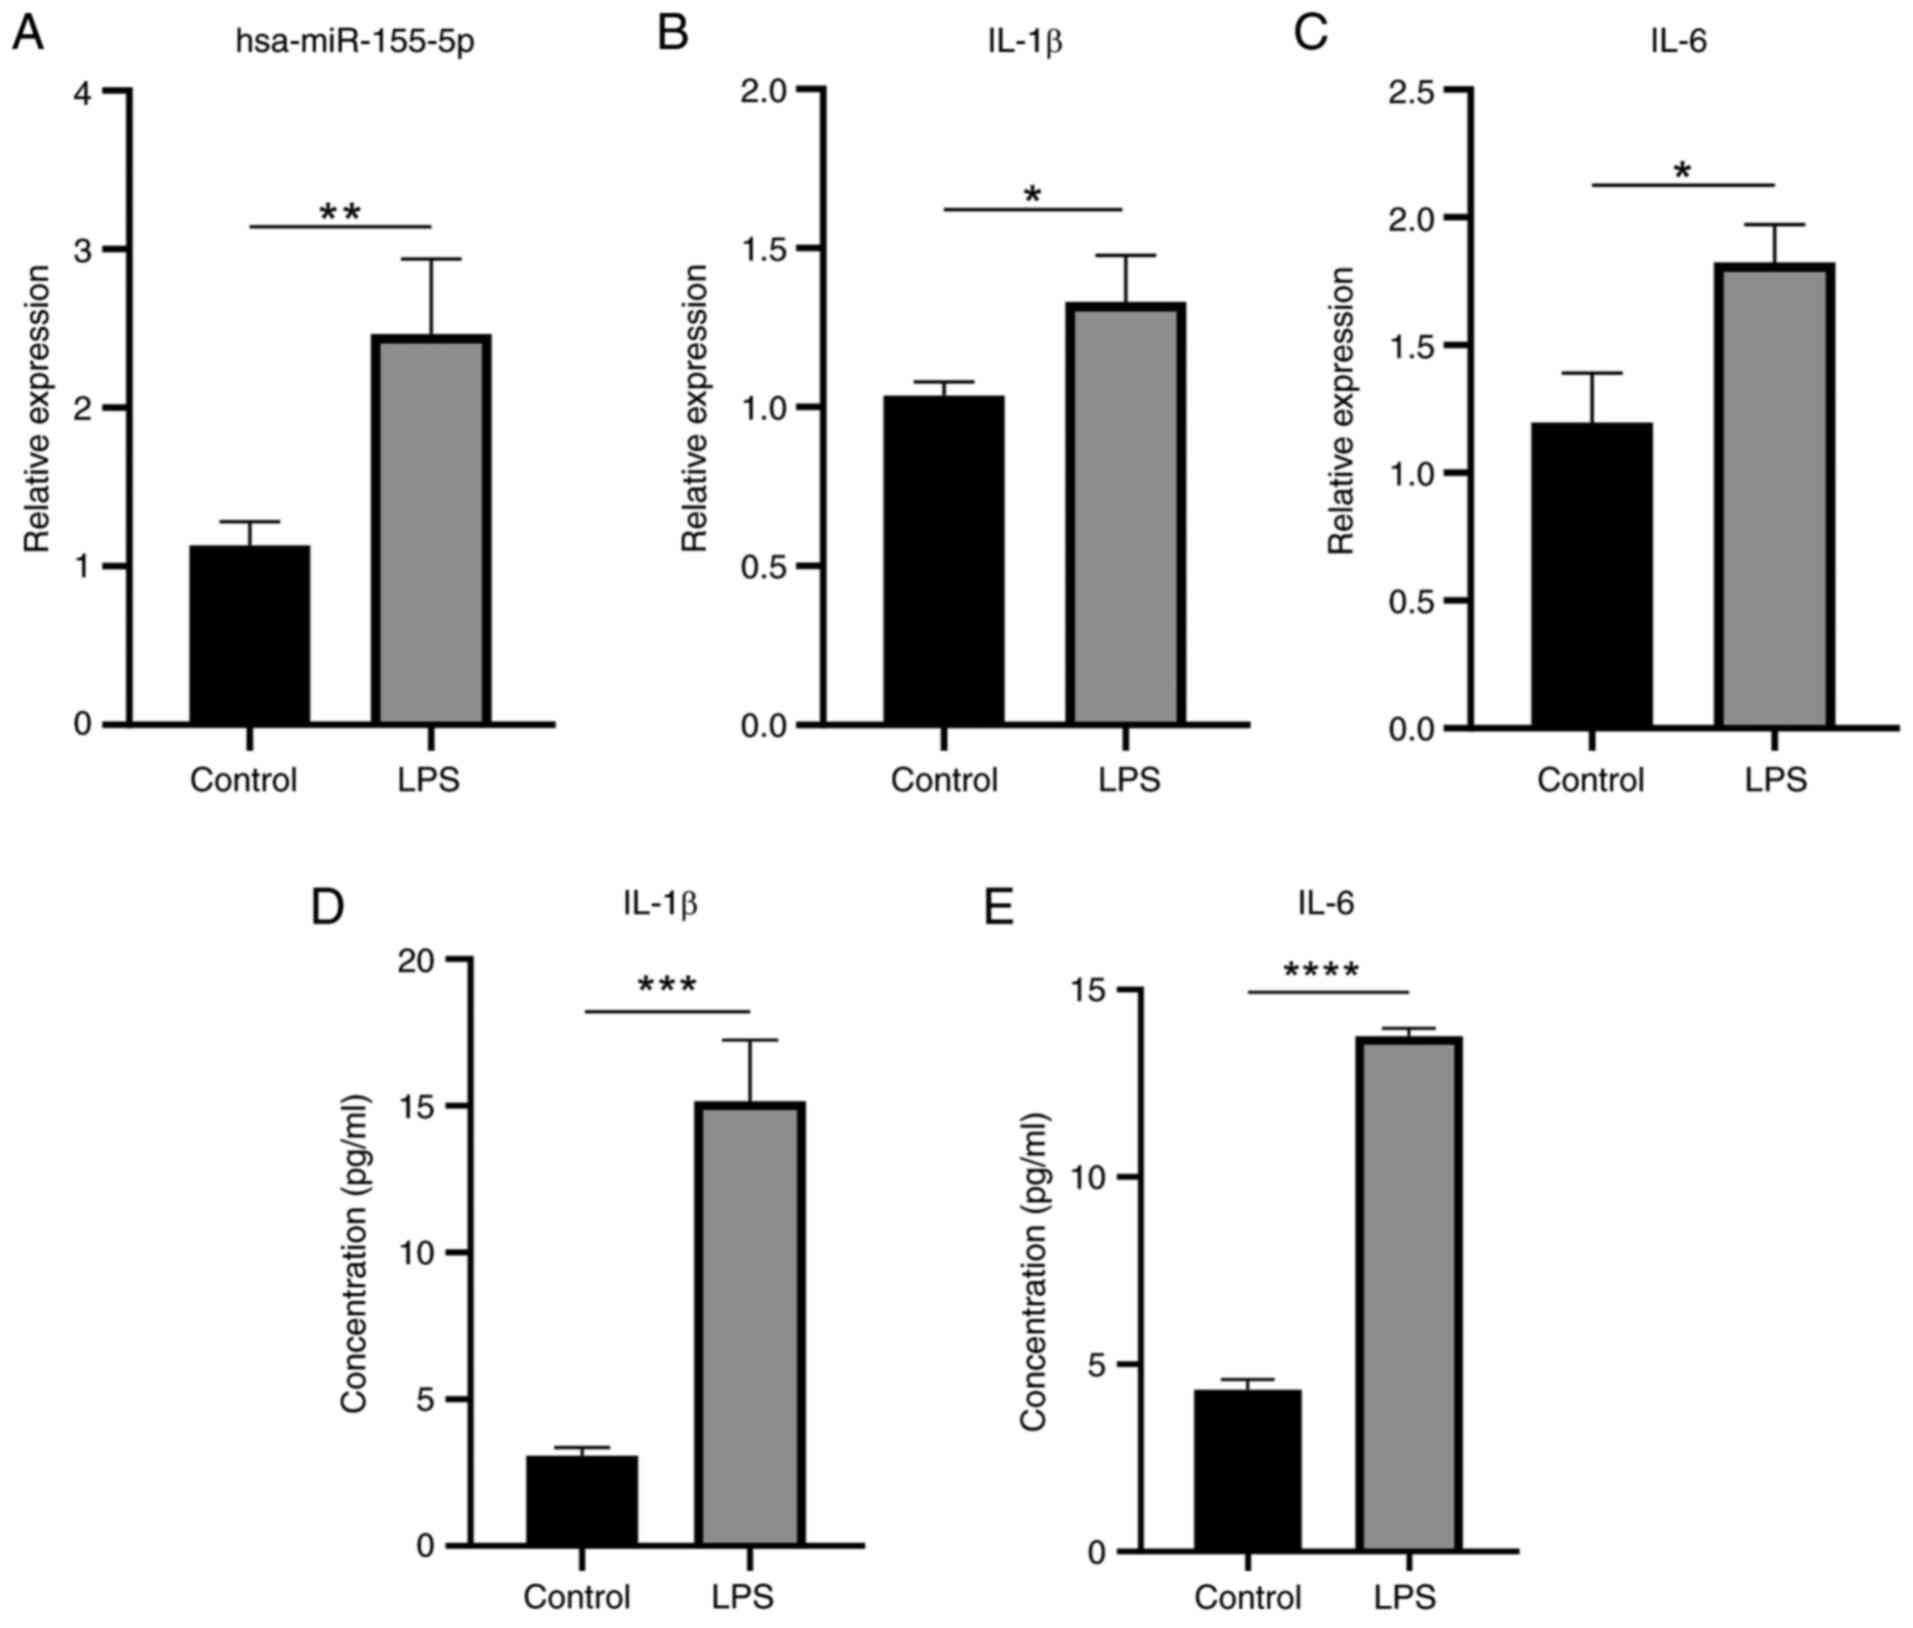
miR-155 and pro-inflammatory cytokines
are expressed at higher levels following LPS stimulation
RT-qPCR results showed that miR-155 expression was
significantly higher following LPS stimulation compared with
untreated control (Fig. 12A).
Similarly, levels of IL-1β and IL-6 inflammatory cytokines were
also higher (Fig. 12B and C).
ELISA demonstrated IL-1β and IL-6 levels were significantly
elevated following LPS stimulation (Fig. 12D and E). These results
suggested that LPS promoted the secretion of inflammatory factors
by HaCaT cells. LPS was successfully used to establish an in
vitro inflammatory cell model. In line with the aforementioned
bioinformatics study, levels of miR-155 were raised during in
vitro inflammatory stimulation.
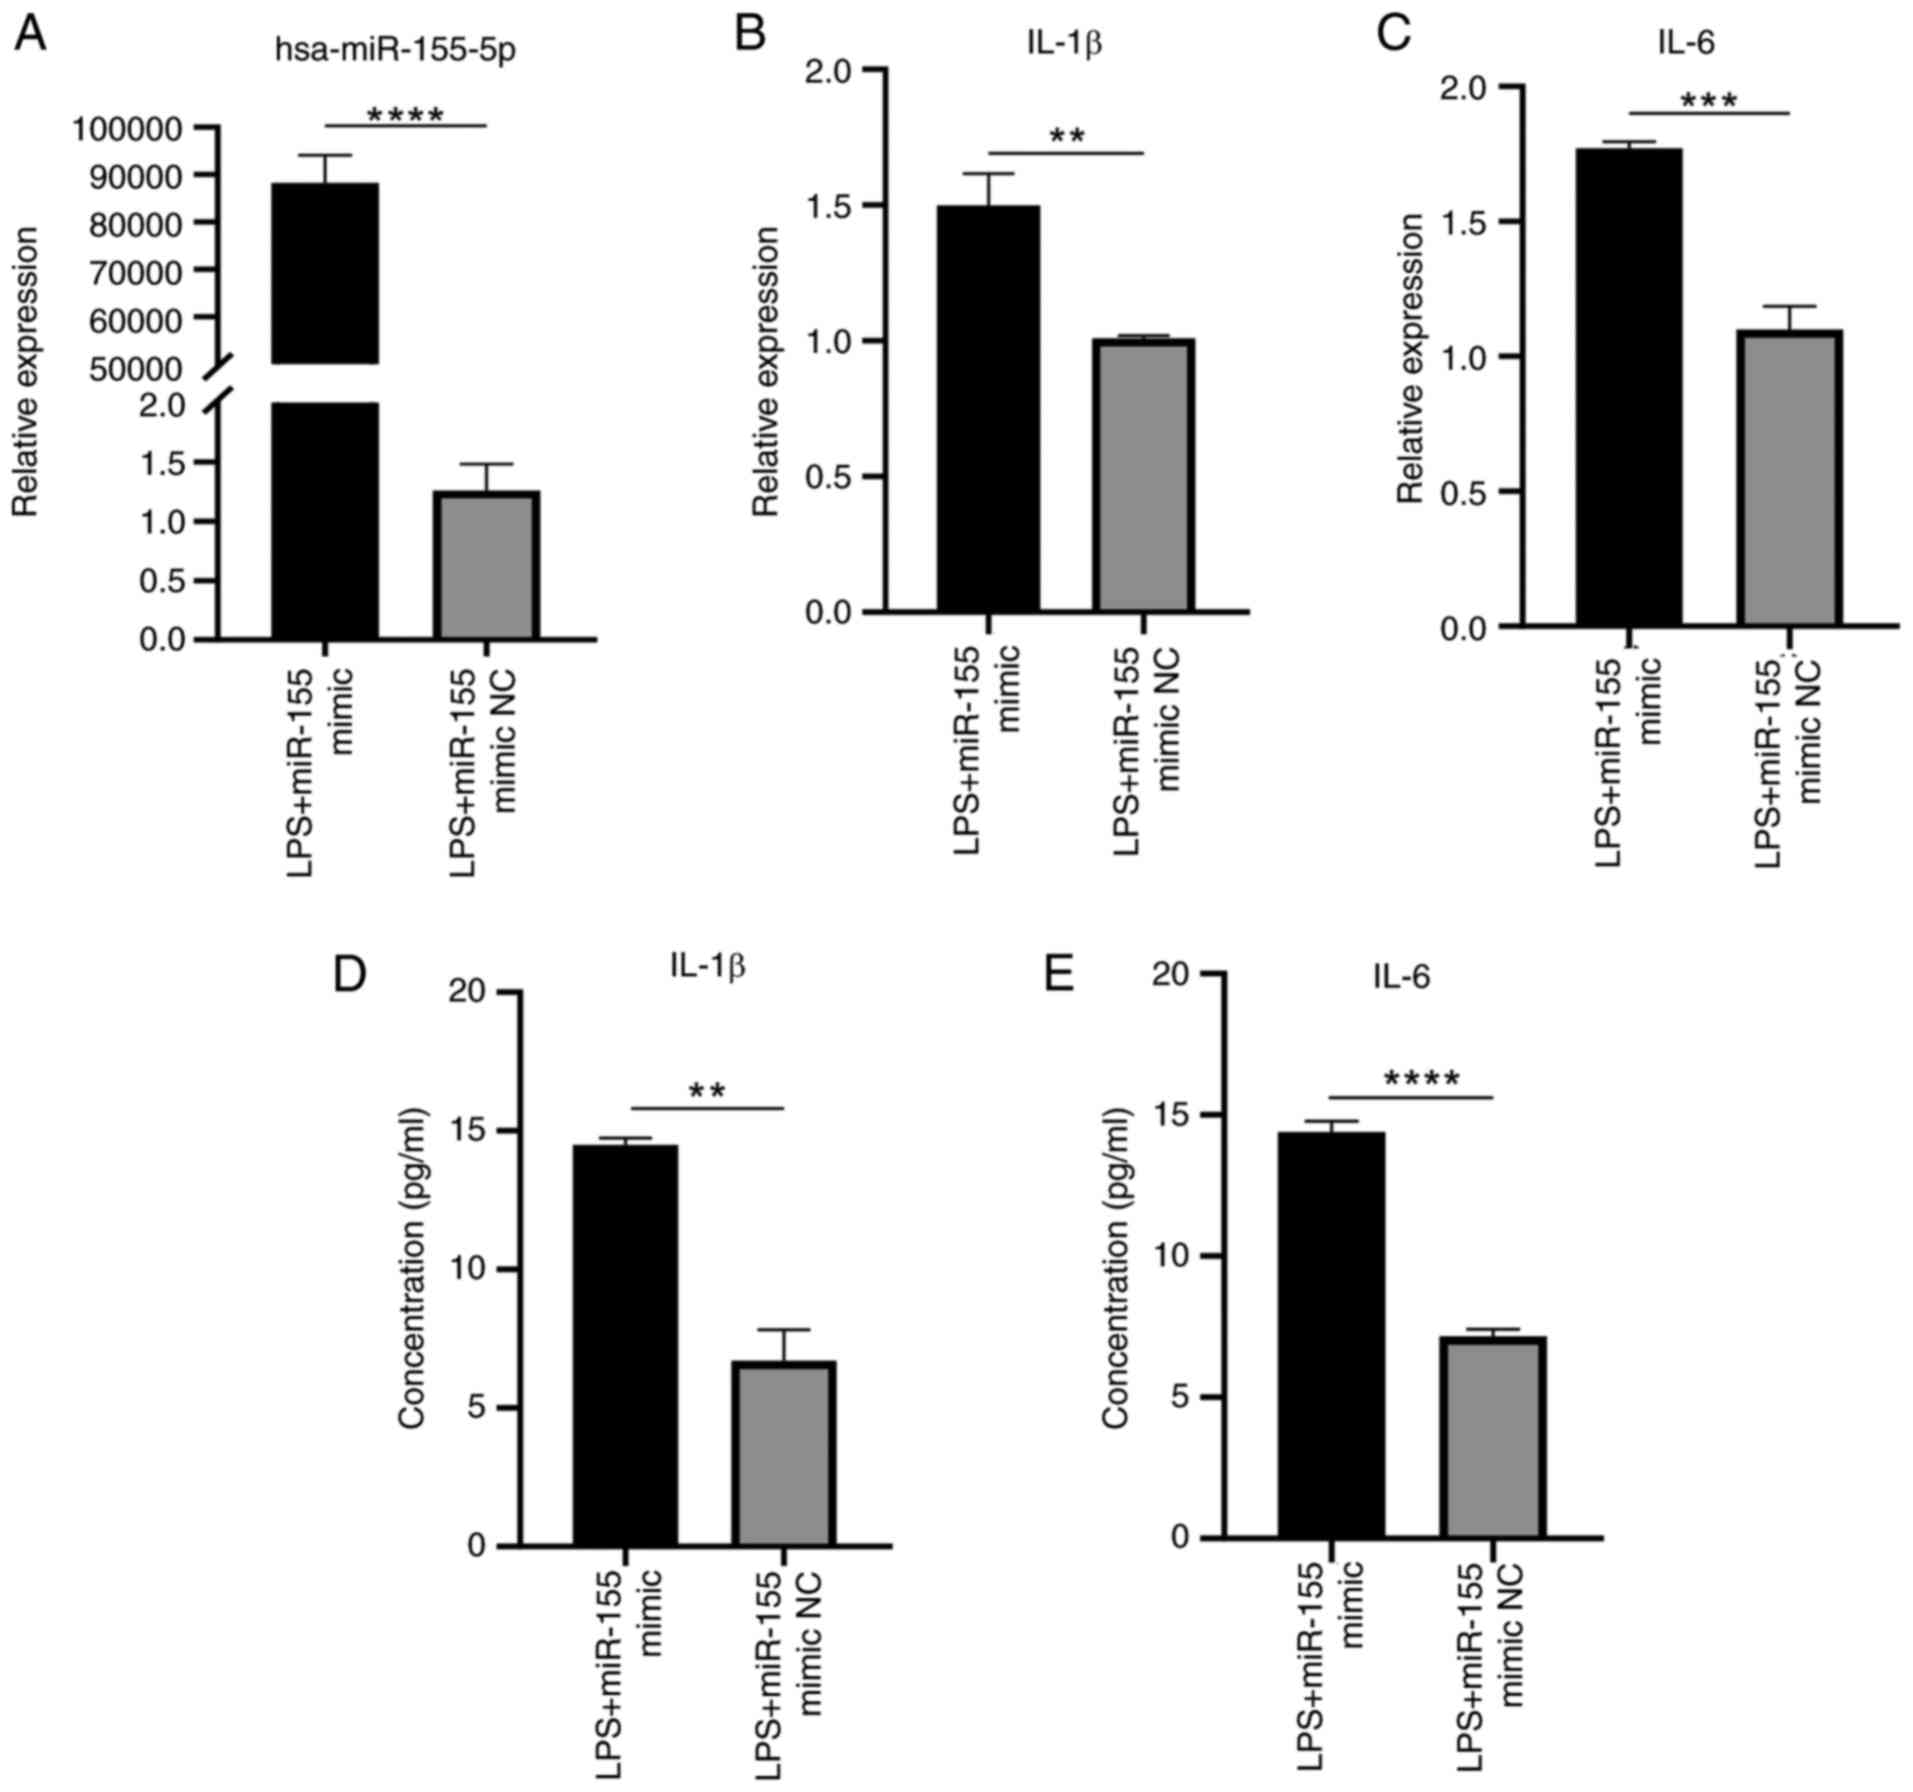
Overexpression of miR-155 enhances
inflammatory response of HaCaT cells following LPS stimulation
RT-qPCR results demonstrated that overexpression of
miR-155 significantly increased expression of miR-155 and
inflammatory response, as indicated by the increased IL-1β and IL-6
levels compared with NC group (Fig.
13A-C). ELISA showed that the concentrations of IL-1β and IL-6
secreted by HaCaT cells stimulated with LPS were significantly
enhanced by sustained overexpression of miR-155 (Fig. 13D and E). These findings
verified that overexpression of miR-155 increased the response to
inflammation in HaCaT cells.
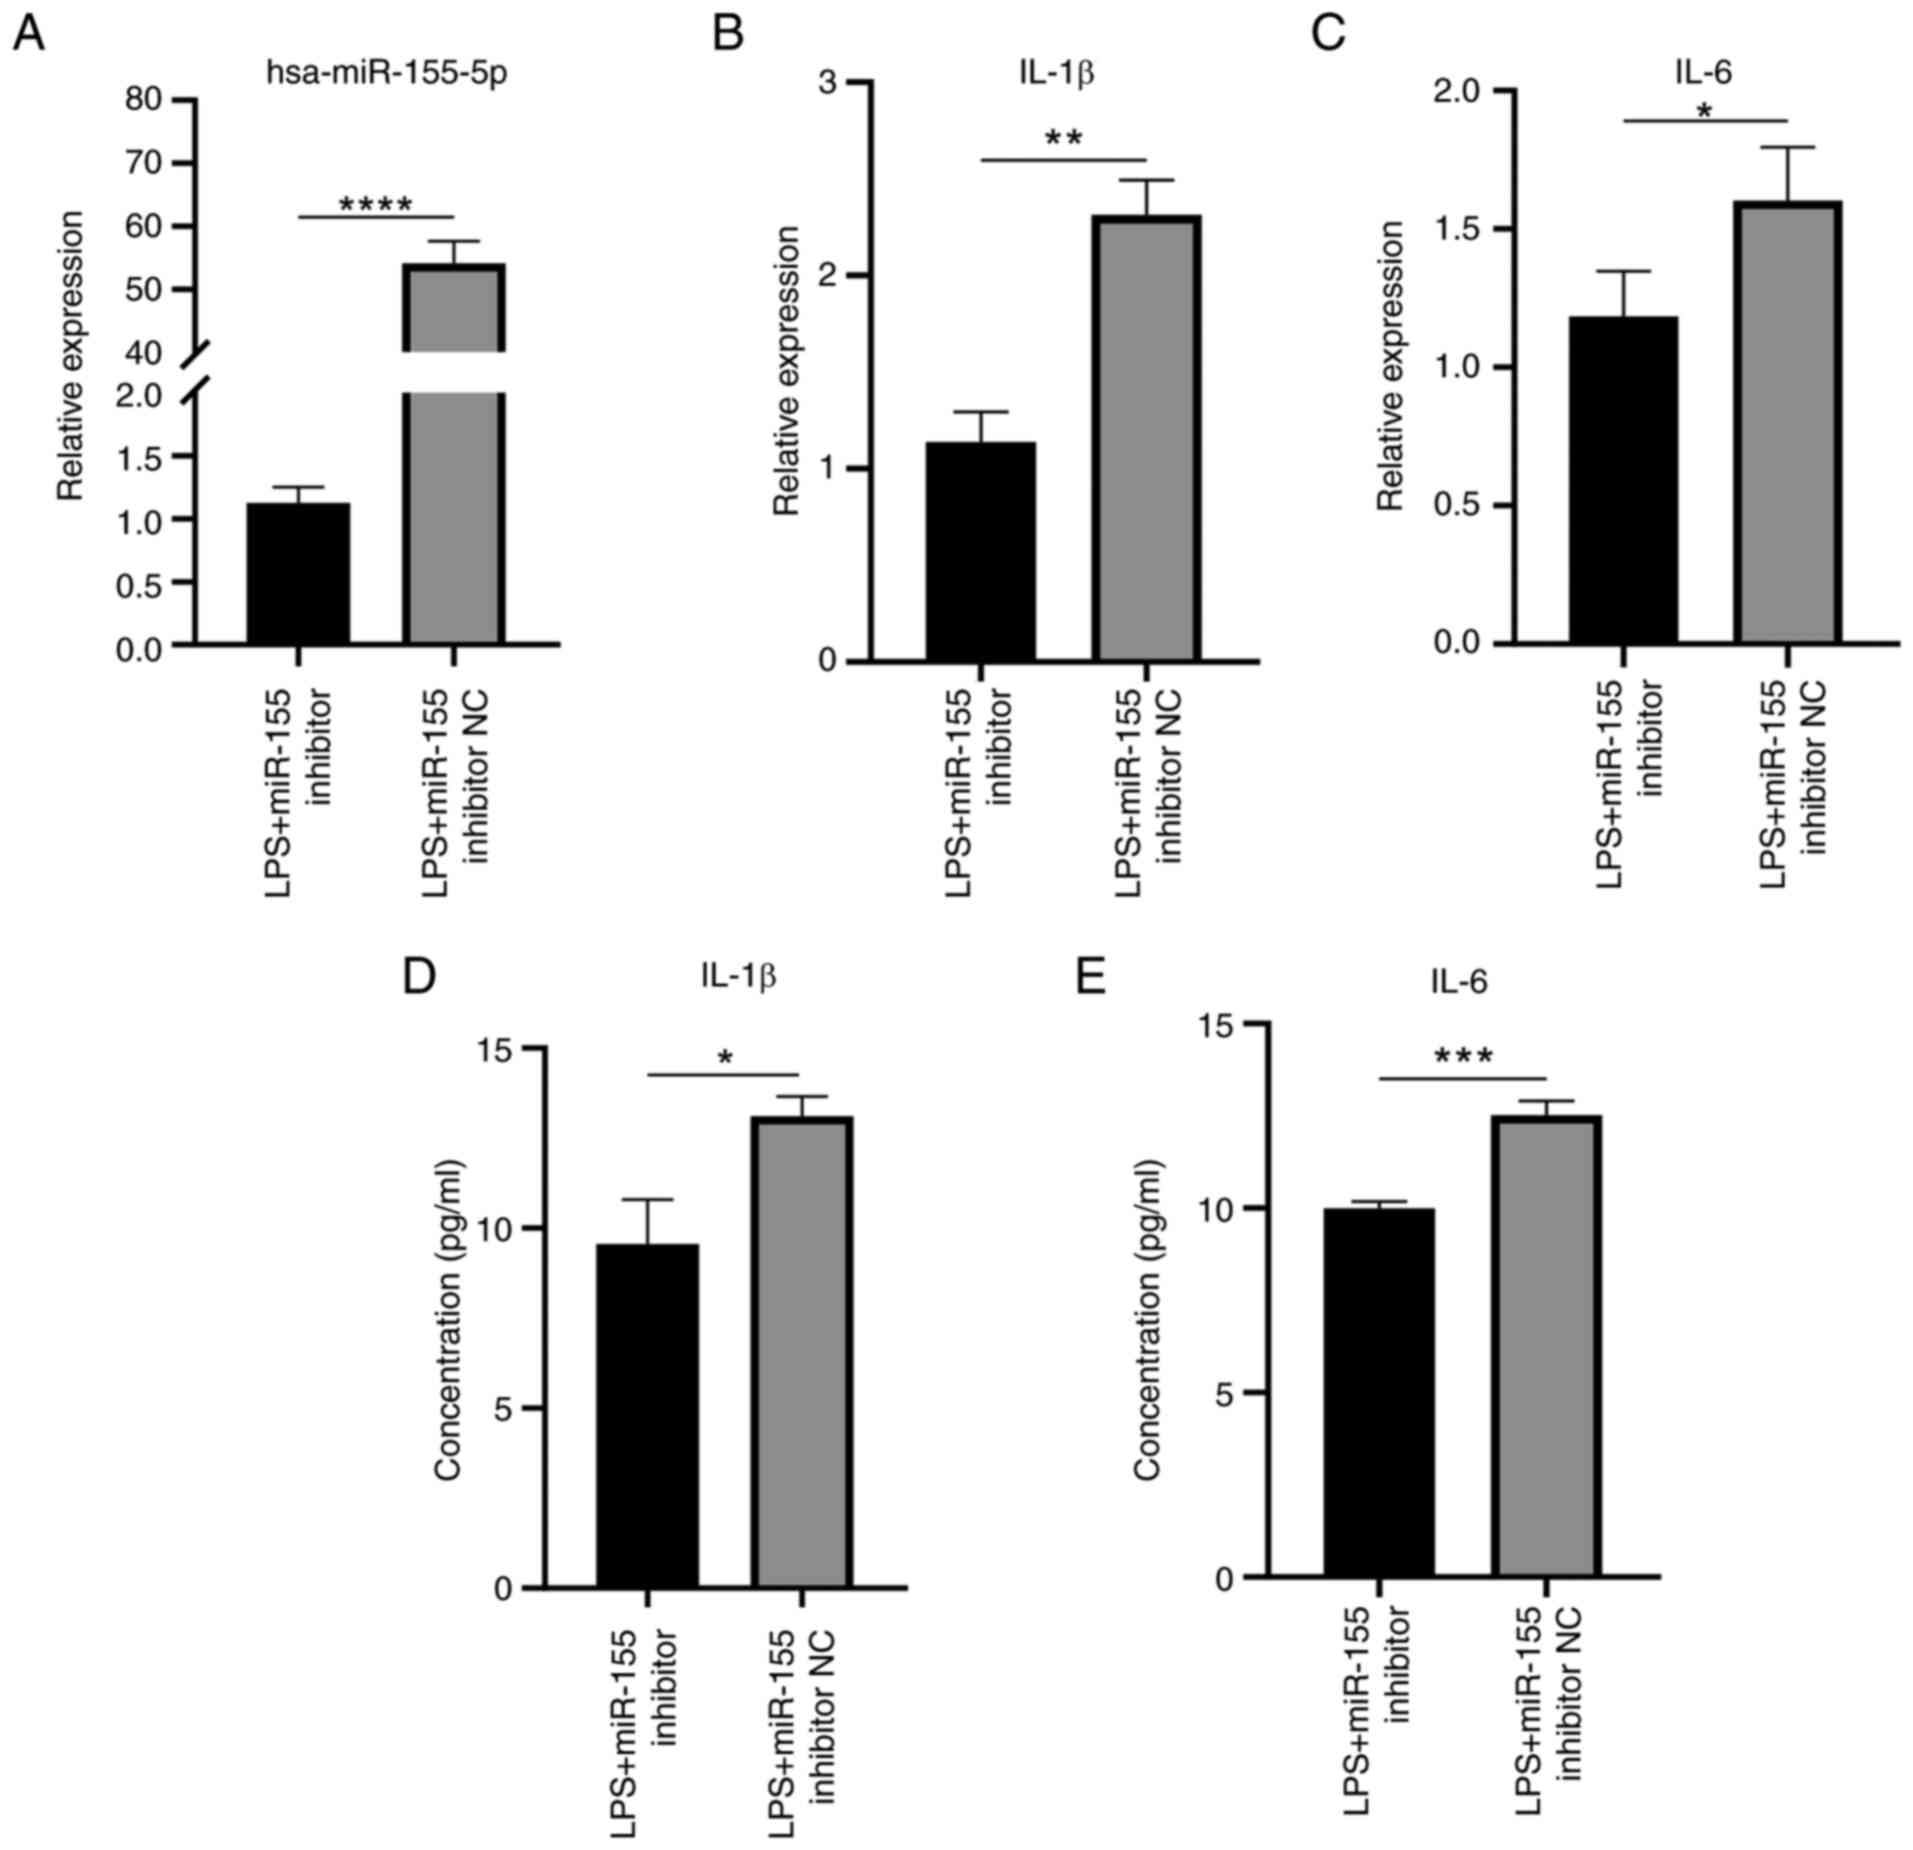
Inflammatory response induced by LPS
stimulation in HaCaT cells is suppressed by silencing miR-155
RT-qPCR demonstrated that suppressing miR-155
expression during LPS stimulation significantly decreased miR-155
expression levels compared with NC (Fig. 14A). Silencing miR-155 expression
significantly reduced the expression of IL-1β and IL-6 (Fig. 14B-E). Taken together, these
findings indicated a significant decrease in the inflammatory
response of HaCaT cells under inflammatory conditions when
miR-155-5p was silenced.
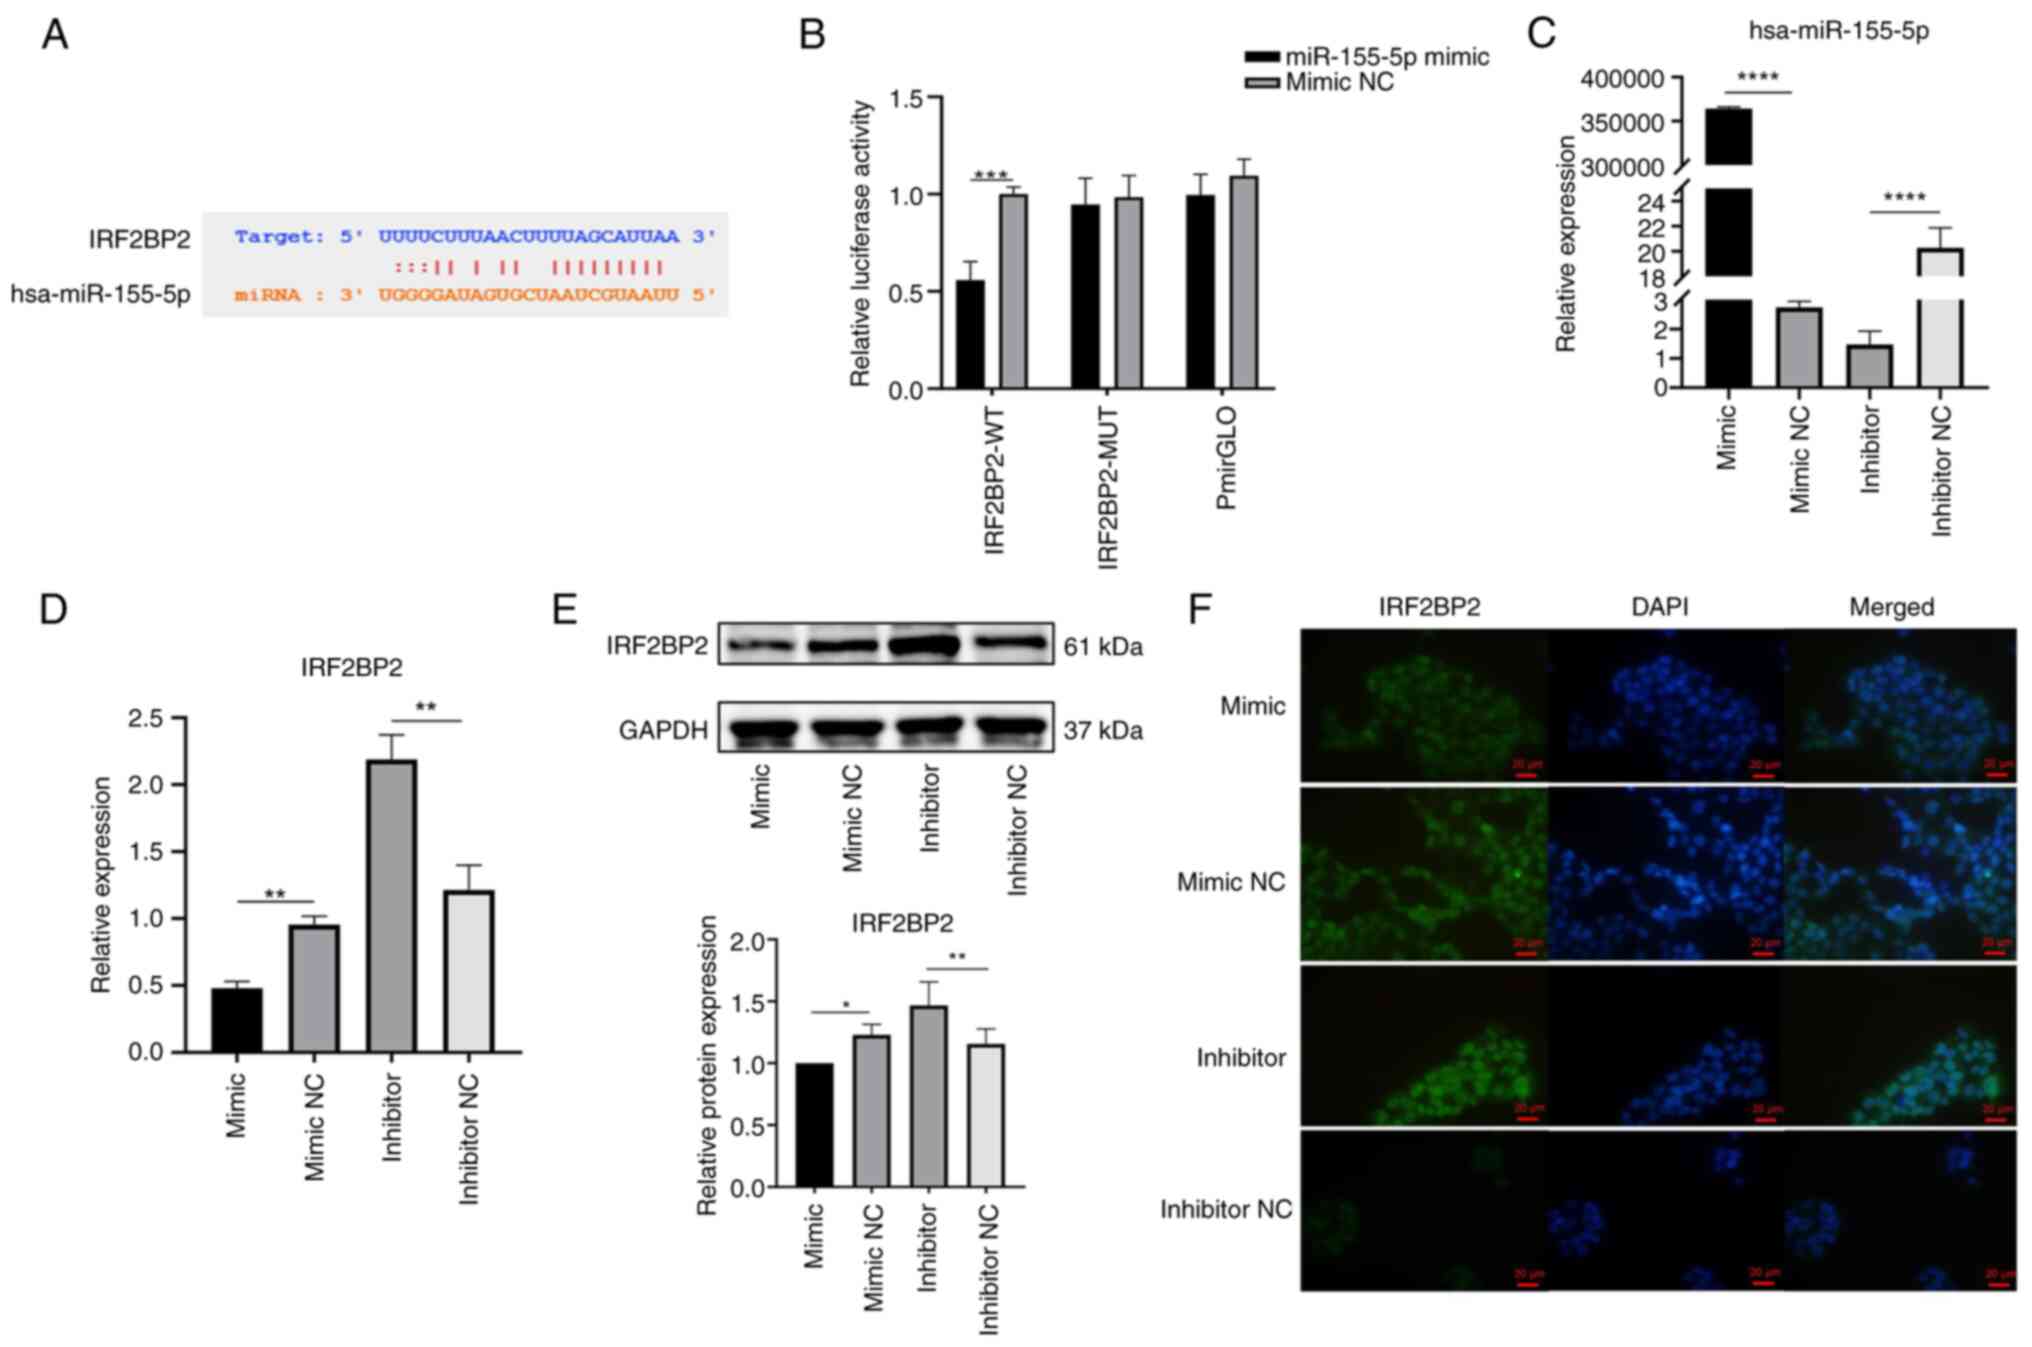
miR-155-5p interacts with IRF2BP2 to
negatively regulate IRF2BP2 expression
starBase was used to predict binding sites between
miR-155-5p and IRF2BP2 (Fig.
15A). Dual-luciferase reporter assay was used to verify whether
miR-155-5p targeted IRF2BP2. miR-155-5p mimic significantly
inhibited luciferase activity of IRF2BP2-WT in 293T cells, while
luciferase activity of IRF2BP2-MUT and pmirGLO groups did not
change (Fig. 15B). HaCaT cells
were transfected with miR-155-5p mimic/mimic NC or miR-155-5p
inhibitor/inhibitor NC to determine the association between
miR-155-5p and IRF2BP2. The expression of miR-155-5p was
significantly elevated following transfection with miR-155 mimic
and significantly decreased upon transfection with miR-155
inhibitor (Fig. 15C). The
RT-qPCR showed that, compared with the NC group, the IRF2BP2 gene
expression was decreased upon transfection with miR-155 mimic and
increased by miR-155 inhibitor (Fig. 15D). The results of the WB
experiments confirmed overexpression of miR-155 reduced IRF2BP2
protein expression and miR-155 silencing promoted IRF2BP2 protein
expression (Fig. 15E).
Overexpression of miR-155 decreased nuclear expression of IRF2BP2
protein, and inhibition of miR-155 enhanced the nuclear expression
of IRF2BP2 protein (Fig. 15F)
suggesting miR-155-5p decreased IRF2BP2 expression and that IRF2BP2
was a target gene of miR-155-5p.
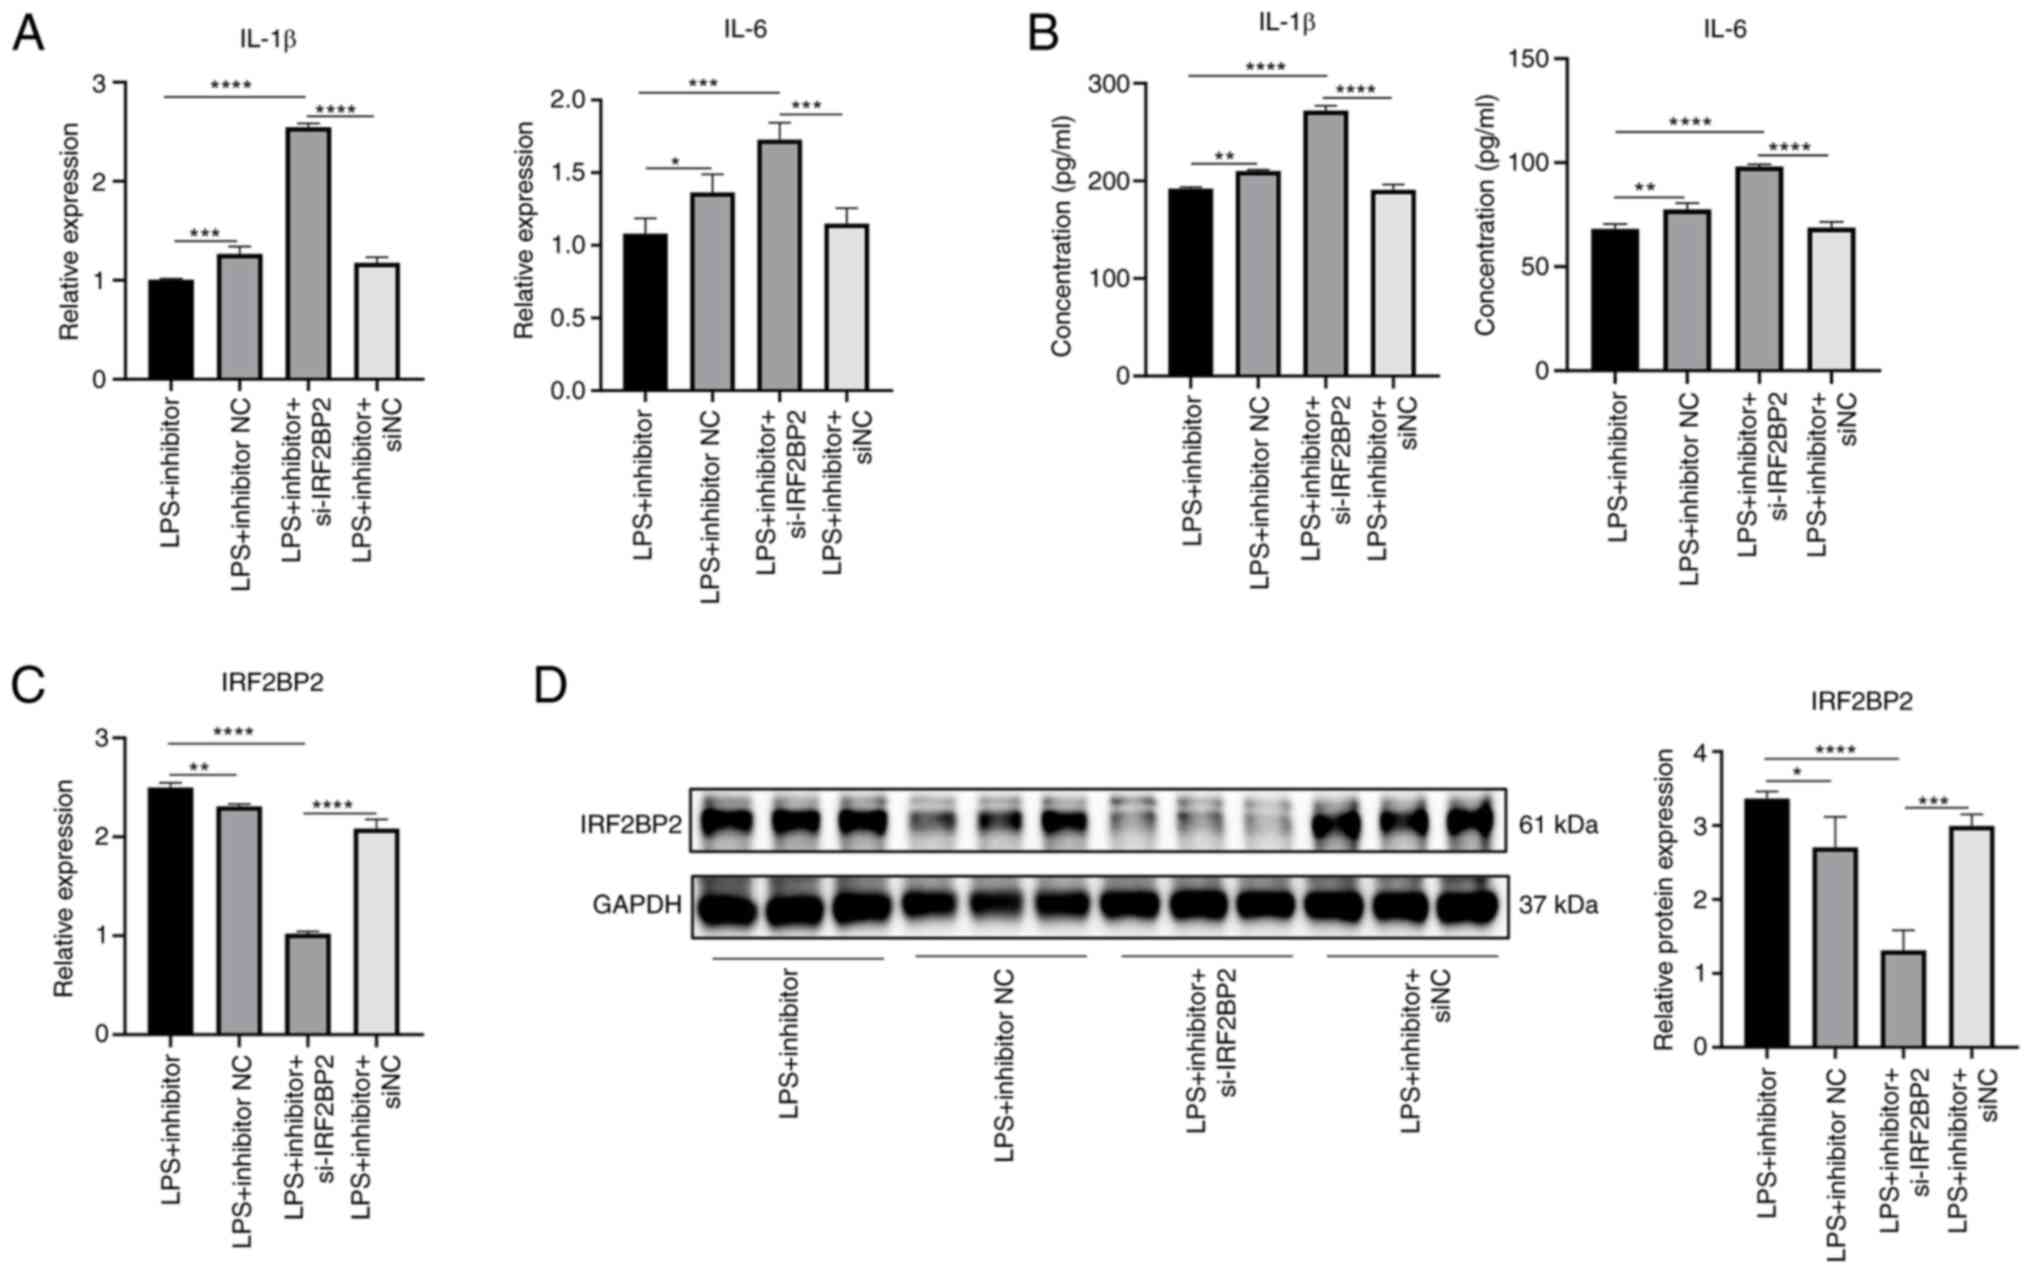
Suppression of inflammatory cytokine
expression by miR-155-5p inhibitor is reversed by knockdown of
IRF2BP2
Knockdown efficiency of si-IRF2BP2 is shown in
Fig. S3. RT-qPCR and ELISA
showed that under LPS stimulation, the gene expression and protein
secretion of IL-1β and IL-6 were significantly decreased in the
miR-155 inhibitor group compared with inhibitor NC group (Fig. 16A and B). Under LPS stimulation,
gene expression and protein secretion levels of IL-1β and IL-6 in
miR-155 inhibitor + si-IRF2BP2 group were significantly increased
compared with miR-155 inhibitor group (Fig. 16A and B). miR-155 inhibitor
increased expression of IRF2BP2 gene and protein under LPS
stimulation (Fig. 16C and D).
However, expression levels of IRF2BP2 gene and protein were
significantly decreased in the miR-155 inhibitor + si-IRF2BP2
compared with the miR-155 inhibitor group. Collectively, these
results suggested that inhibition of inflammatory cytokine
expression by miR-155-5p inhibitor was reversed by knockdown of
IRF2BP2 and miR-155-5p regulated inflammation in HaCaT cells by
targeting IRF2BP2.
miR-155 may promote inflammatory response
of HaCaT cells via the IRF2BP2/KLF2/NF-κB pathway
To examine the molecular mechanism underlying how
miR-155 targets IRF2BP2 to promote inflammation in HaCaT cells, an
inflammation model was induced by stimulating cells with 1
μg/ml LPS for 6 h. Gene expression levels of IRF2BP2, KLF2
and p65 were determined by RT-qPCR and protein expression levels of
IRF2BP2, KLF2, p65 and p-p65 were determined by WB. Following LPS
stimulation, gene expression levels of IRF2BP2 and KLF2 were
decreased, while the expression of p65 was increased compared with
the control group (Fig. 17A).
RT-qPCR (Fig. 17B) and WB
(Fig. 17C-E) results confirmed
that the IRF2BP2 expression was significantly reduced in the LPS,
mimic and LPS + mimic groups compared with the control. Similarly,
KLF2 expression was suppressed. However, compared with the control
group, p-p65 protein expression was higher in the LPS, mimic and
LPS + mimic groups. In summary, under inflammatory conditions,
overexpression of miR-155 inhibited IRF2BP2 and decreased KLF2
expression. p-p65 protein expression increased and secretion of
inflammatory factors IL-1β and IL-6 were enhanced, thereby
promoting the inflammatory response of HaCaT cells.
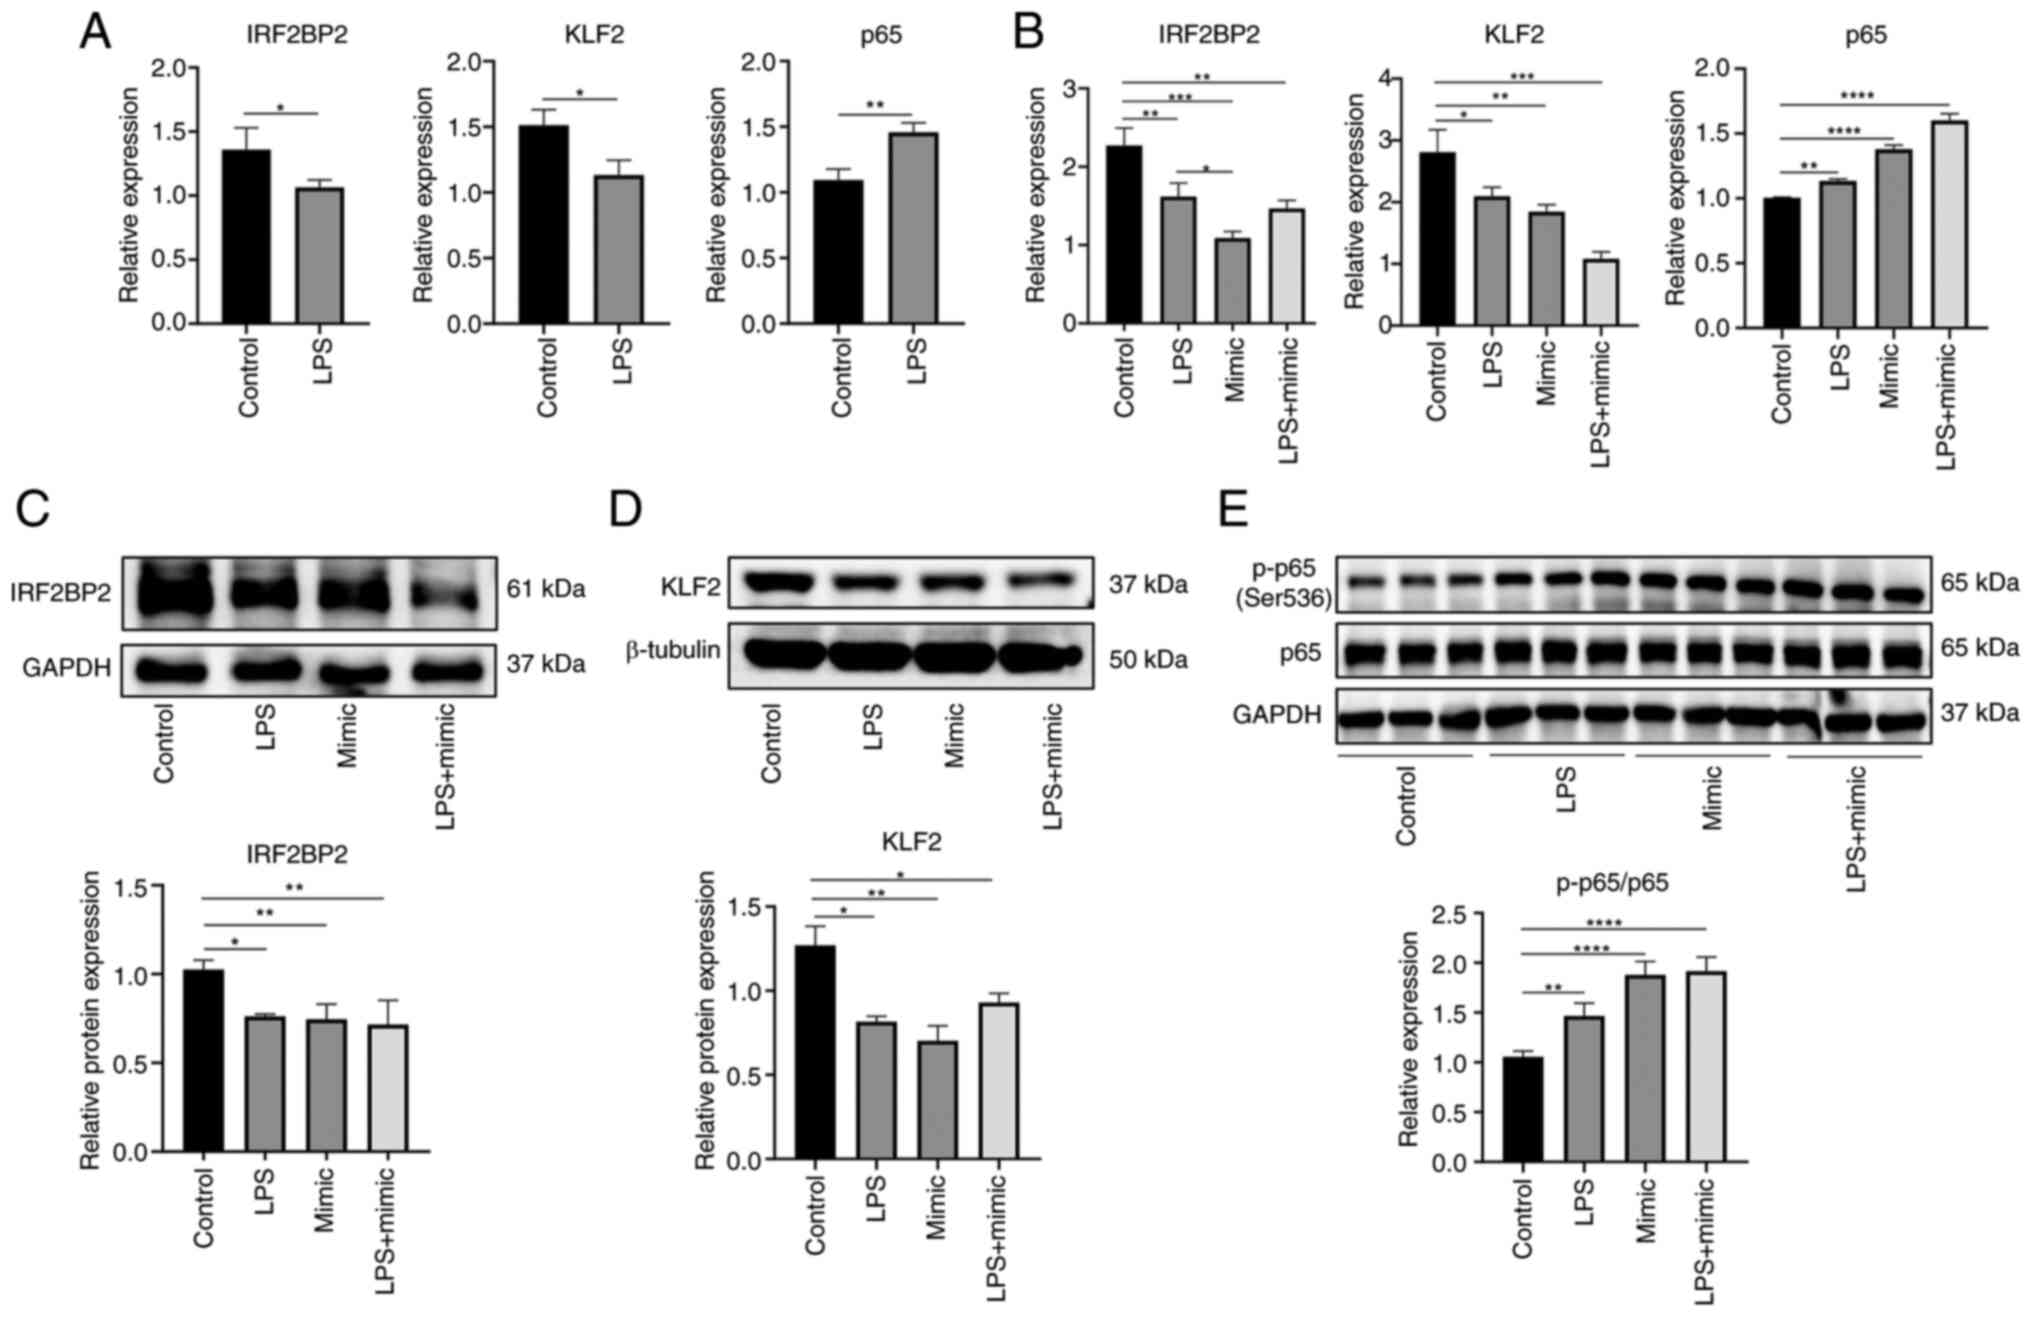 | Figure 17Effect of miR-155 on IRF2BP2, KLF2
and p65 following LPS stimulation. mRNA expression of IRF2BP2, KLF2
and p65 following (A) LPS stimulation and (B) transfection was
determined by reverse transcription-quantitative PCR. Relative
protein expression levels of (C) IRF2BP2, (D) KLF2 and (E)
p65/p-p65 were measured by western blotting. *P<0.05,
**P<0.01, ***P<0.001,
****P<0.0001. LPS, lipopolysaccharide; miR, microRNA;
IRF2BP2, IFN regulatory factor 2 binding protein 2; p-,
phosphorylated; KLF2, kruppel-like factor 2; NC, negative
control. |
Discussion
Psoriasis is a chronic and recurrent inflammatory
skin condition with a complicated pathophysiology. The molecular
processes underlying the onset and recurrence of this illness may
be impacted by numerous variables, including immunological, genetic
and environmental factors. According to a previous study, skin
barrier malfunction and clinical psoriasis may result from
interaction between immune cells and epidermal keratinocytes, which
may stimulate signaling pathways, promote production of
inflammatory chemokines and cytokines and induce aberrant
differentiation and overproliferation of epidermal keratinocytes
(25). Further study of the
molecular mechanisms underlying proliferation and aberrant
differentiation of epidermal keratinocytes may therefore promote
understanding of the pathogenesis of psoriasis (26).
Small non-coding RNAs known as miRNAs are key for
controlling post-transcriptional gene expression. To control
translational suppression or degradation, miRNAs bind in entire or
partial complementation to the 3'-untranslated region of mRNAs that
code for proteins (27,28). miRNAs control keratinocyte
differentiation, proliferation, apoptosis and inflammation and
activation of T cell subsets, in addition to serving numerous roles
in inflammatory skin disorders (29,30). A previous study observed notable
upregulation of miR-155, miR-146a and miR-21 in skin lesions from
patients with psoriasis (31).
The pathogenesis of psoriasis is associated with dysregulation of
miRNA expression and regulatory targets, which may be useful
indicators for diagnosis, monitoring disease progression and
assessing efficacy of treatment (32,33). Therefore, understanding
miRNA-mediated regulatory mechanisms of psoriasis offers
opportunity to uncover the pathogenesis and improve the treatment
strategy for this condition.
In psoriasis, upregulation of miR-155 reduces
loricrin levels in keratinocytes, which alters the functions of the
epidermal barrier (9). In
addition, toll-like receptor 4 activation enhances the inflammatory
response triggered by miR-155 in an in vitro keratinocyte
model (34). miR-155 also
promotes cell proliferation and inhibits apoptosis in psoriasis via
the PTEN signaling pathway (11). Furthermore, by targeting tumor
protein p53 inducible nuclear protein 1, miR-155 increases
glycolysis in psoriatic mesenchymal stem cells. Compared with
normal human bone marrow mesenchymal stem cells, psoriatic
mesenchymal stem cells showed significantly higher glycolysis
levels and dysregulated glucose metabolism, highlighting its role
in metabolic problems associated with psoriasis (35). In the pathophysiology of
psoriasis, the production and release of proinflammatory cytokines
such as TNF-α, IFN-γ, and IL-1β are increased (1). Wang et al (36) showed that miR-155 affects
development of psoriasis by regulating the GATA binding protein
3)/IL37 axis, which regulates the production of proinflammatory
cytokines IL-6 and C-X-C motif chemokine ligand 8 in response to
TNF-α activation. Additionally, tissue with psoriatic lesions
exhibits a notable increase in miR-155 expression (36). Beer et al (9) discovered that proinflammatory
cytokines IL-17, INF-γ and IL-1β effectively increase miR-155
expression in keratinocytes in vitro. These findings align
with the present upregulation of miR-155 expression and promotion
of inflammatory factor production after establishing an in
vitro inflammatory model with LPS.
According to Xu et al (11), miR-155 affects progression of the
cell cycle in HaCaT cells by controlling genes that are part of the
signaling pathway associated with cyclin, which causes the cell
cycle to move from G1 to the S phase. IRF2BP2 has an important role
in both cell cycle regulation and proliferation: Koeppel et
al (37) demonstrated that
overexpression of IRF2BP2 increased the number of cells in S phase
and decreasing the number of cells in G2 phase. The present study
demonstrated that overexpression of miR-155 in HaCaT cells
significantly impacted cell cycle progression, causing most cells
to transition from G1 to the S phase and preventing entry into the
G2 phase, resulting in a notable increase in S phase cells. These
results aligned with those previously reported (11,37). The present study also verified
that miR-155 directly targeted IRF2BP2 expression.
NF-κB controls production of growth genes and the
immunological response and is found in the cytoplasm. NF-κB is
associated with several physiological and pathological processes as
it is essential in cell proliferation, inflammation and
carcinogenesis (38,39). Following activation of the NF-κB
pathway, p-IκBα is activated and degraded and the p65/p50 complex
is activated by post-translational modification and transported to
the nucleus to participate in transcriptional regulation of
downstream target genes (38). A
previous study demonstrated that LPS stimulation induces the
activation and signaling of the NF-κB (p65/p50) proinflammatory
transcription factor complex, thereby promoting expression of
p65/p50 and subsequently upregulating miR-146a and miR-155
(40). In line with previous
research (40), the present
study demonstrated that both LPS stimulation and miR-155
overexpression significantly increased levels of p-p65 protein at
ser536. Increased phosphorylation of the p65 subunit led to
activation of the NF-κB pathway.
Using chromatin immunoprecipitation and luciferase
reporter assay, a previous study discovered that IRF2BP2 binds KLF2
promoter and promotes KLF2 expression in a myocyte enhancer factor
2C-dependent manner (16). As
members of the zinc finger family of DNA-binding transcription
factors, KLFs are key for a number of biological processes,
including inflammation, differentiation and proliferation (41). In addition to serving as a key
regulator in certain aberrant and pathological conditions such as
rheumatoid arthritis, atherosclerosis and bacterial infection, KLF2
also regulates immune cell activity and function (42-45). Patients experiencing either acute
or chronic inflammation exhibit a 30-50% decrease in KLF2
expression (46,47). In the present study, decreased
expression of KLF2 was confirmed by RT-qPCR and WB, consistent with
the literature (46,47). According to some studies
(46,48), KLF2 mediates inhibition of the
activity of pro-inflammatory NF-κB, thereby inhibiting the
inflammatory response. To inhibit transcriptional activity of the
NF-κB proinflammatory signal, KLF2 is recruited to the p300/cAMP
response element-binding protein-associated factor. This results in
a decrease in production of numerous inflammatory genes and
cytokines such as IL-1, IL-8 and TNF-α (42,46,48,49).
According to Masalha et al (50), miR-155 exerts a positive feedback
function in controlling inflammatory signals. By binding to their
receptors, pro-inflammatory cytokines such as IL-1β, IFN-γ, TNF-α
and IFN-α trigger inflammatory signals via NF-κB. This increases
expression of miR-155 due to NF-κB binding to miR-155 promoter. In
addition, miR-155 targets PTEN and suppressor of cytokine signaling
1, two inflammatory signaling inhibitors. The PI3K/AKT pathway,
which activates NF-κB, is inhibited by PTEN. Thus, by blocking PTEN
via the PI3K/AKT pathway, miR-155 triggers inflammatory and NF-κB
signals. Sustained inflammatory signaling results in greater
secretion of inflammatory chemokines, increasing the cytokine
repertoire at the inflammation site. This increases signaling that
activates miR-155 expression, maintaining inflammation in psoriasis
(50).
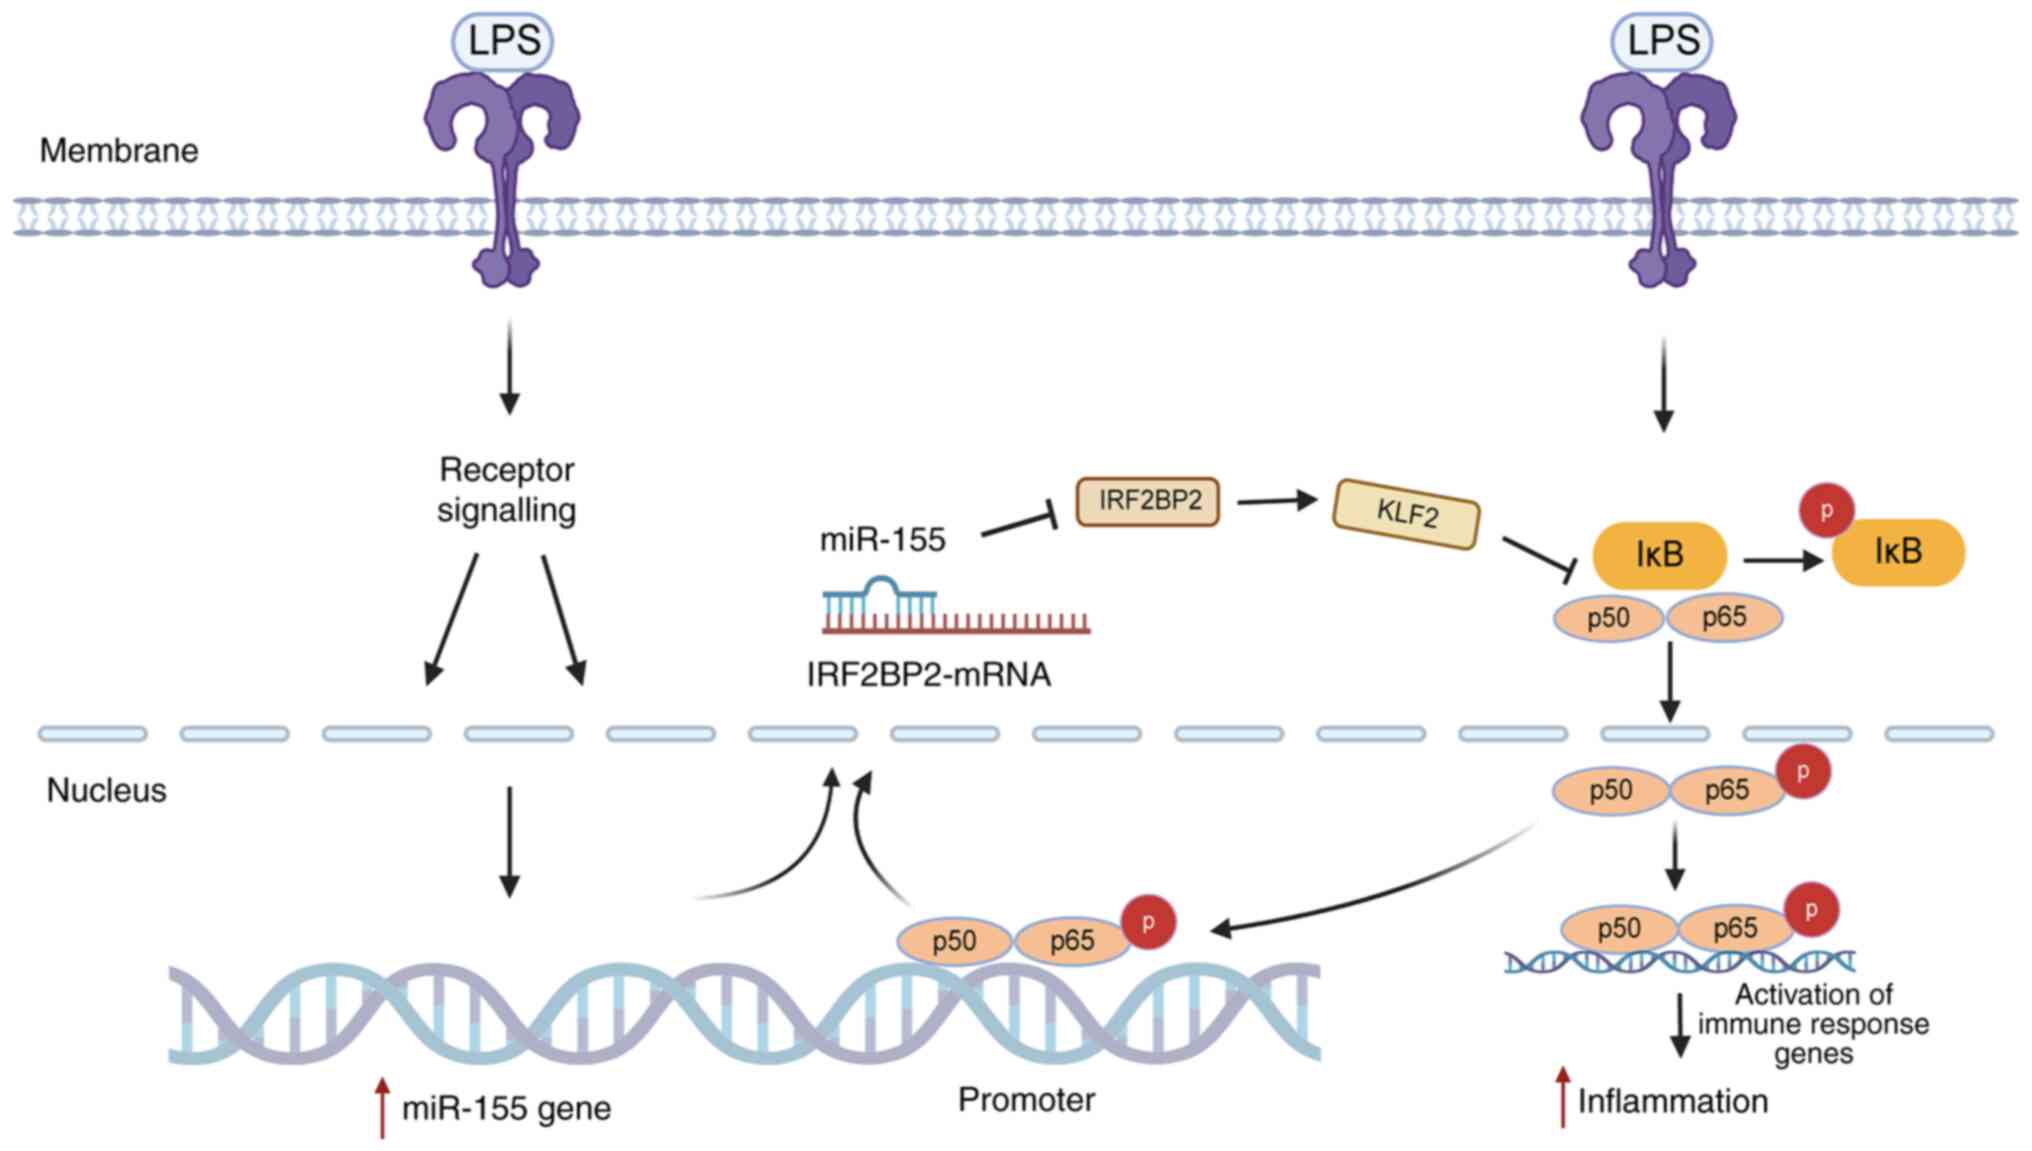
The present study discovered that miR-155 expression
was increased in HaCaT cells following LPS stimulation. High
miR-155 expression inhibited the target gene, IRF2BP2, leading to
decreased expression of KLF2 gene. This weakened the inhibitory
effect of the KLF2 anti-inflammatory gene on NF-κB activity. The
transcriptional activation domain of p65 was activated, expression
of p-p65 protein was enhanced and the activation of NF-κB in the
nucleus increased inflammatory factor expression, promoting the
inflammatory response of HaCaT cells. Activated NF-κB binds to the
miR-155 promoter to increase the expression of miR-155. Thus, a
novel positive feedback loop may exist in which miR-155 enhances
p-p65 expression via IRF2BP2/KLF2, activates NF-κB, promotes
self-expression and maintains the inflammatory state in psoriasis
(Fig. 18).
The present study identified miR-155 and IRF2BP2 as
potential psoriasis biomarkers. In the LPS-stimulated HaCaT
inflammatory cell model, overexpression of miR-155 promoted the
inflammatory response, while inhibition of miR-155 attenuated it.
Suppression of inflammatory cytokine expression by miR-155-5p
inhibitor was reversed by knockdown of IRF2BP2. Mechanistically,
miR-155 was shown to regulate inflammation in HaCaT cells via
IRF2BP2/KLF2/NF-κB.
In conclusion, based on bioinformatics analysis of
clinical samples from patients with psoriasis, the present study
confirmed that miRNA-155 decreased IRF2BP2 expression. miRNA-155
also decreased KLF2 expression, which reduced the inhibitory effect
of KLF2 on NF-κB transcription activity and increased p-p65 protein
expression, thereby increasing expression of inflammatory genes and
cytokines. This mechanism results in heightened inflammatory
reactions and harm to tissue and keratinocytes and may serve a role
in the onset of psoriasis. The results of the present study
therefore provide new information on how miR-155 controls
development and course of psoriasis.
The present study also had certain limitations.
miR-155 inhibitors were not used for dual verification and few
psoriasis-associated indicators were detected. Further studies are
required to detect psoriasis-associated indicators such as TNF-α,
IL-17 and IL-23 and determine whether IRF2BP2 overexpression can
reverse the increase of inflammatory cytokines induced by miR-155
mimic.
Supplementary Data
Availability of data and materials
The data generated in the present study may be
requested from the corresponding author.
Authors' contributions
WQ and KG conceived and designed the study. LC and
XX performed bioinformatics analysis. LC and CL performed the
statistical analysis. LC and WQ drafted the manuscript. WQ and KG
reviewed and edited the manuscript. LC and WQ confirm the
authenticity of all the raw data. All authors have read and
approved the final manuscript.
Ethics approval and consent to
participate
Not applicable.
Patient consent for publication
Not applicable.
Competing interests
The authors declare that they have no competing
interests.
Acknowledgements
Not applicable.
Funding
The present study was supported by National Natural Science
Foundation of China (grant no. 31671092) and The Research Fund of
Jianghan University (grant no. 2023KJZX29).
References
|
1
|
Boehncke WH and Schön MP: Psoriasis.
Lancet. 386:983–994. 2015. View Article : Google Scholar : PubMed/NCBI
|
|
2
|
Hwang ST, Nijsten T and Elder JT: Recent
highlights in psoriasis research. J Invest Dermatol. 137:550–556.
2017. View Article : Google Scholar : PubMed/NCBI
|
|
3
|
Chiricozzi A, Romanelli P, Volpe E,
Borsellino G and Romanelli M: Scanning the immunopathogenesis of
psoriasis. Int J Mol Sci. 19:1792018. View Article : Google Scholar : PubMed/NCBI
|
|
4
|
Ciccia F, Triolo G and Rizzo A: Psoriatic
arthritis. N Engl J Med. 376:2094–2095. 2017. View Article : Google Scholar : PubMed/NCBI
|
|
5
|
Griffiths CEM, Armstrong AW, Gudjonsson JE
and Barker JNWN: Psoriasis. Lancet. 397:1301–1315. 2021. View Article : Google Scholar : PubMed/NCBI
|
|
6
|
Dopytalska K, Czaplicka A, Szymańska E and
Walecka I: The essential role of microRNAs in inflammatory and
autoimmune skin diseases-a review. Int J Mol Sci. 24:91302023.
View Article : Google Scholar : PubMed/NCBI
|
|
7
|
Dopytalska K, Ciechanowicz P, Wiszniewski
K, Szymańska E and Walecka I: The role of epigenetic factors in
psoriasis. Int J Mol Sci. 22:92942021. View Article : Google Scholar : PubMed/NCBI
|
|
8
|
Yang SC, Alalaiwe A, Lin ZC, Lin YC,
Aljuffali IA and Fang JY: Anti-inflammatory microRNAs for treating
inflammatory skin diseases. Biomolecules. 12:10722022. View Article : Google Scholar : PubMed/NCBI
|
|
9
|
Beer L, Kalinina P, Köcher M, Laggner M,
Jeitler M, Abbas Zadeh S, Copic D, Tschachler E and Mildner M:
miR-155 contributes to normal keratinocyte differentiation and is
upregulated in the epidermis of psoriatic skin lesions. Int J Mol
Sci. 21:92882020. View Article : Google Scholar : PubMed/NCBI
|
|
10
|
García-Rodríguez S, Arias-Santiago S,
Blasco-Morente G, Orgaz-Molina J, Rosal-Vela A, Navarro P,
Magro-Checa C, Martínez-López A, Ruiz JC, Raya E, et al: Increased
expression of microRNA-155 in peripheral blood mononuclear cells
from psoriasis patients is related to disease activity. J Eur Acad
Dermatol Venereol. 31:312–322. 2017. View Article : Google Scholar
|
|
11
|
Xu L and Leng H, Shi X, Ji J, Fu J and
Leng H: MiR-155 promotes cell proliferation and inhibits apoptosis
by PTEN signaling pathway in the psoriasis. Biomed Pharmacother.
90:524–530. 2017. View Article : Google Scholar : PubMed/NCBI
|
|
12
|
Pastor TP, Peixoto BC and Viola JPB: The
transcriptional co-factor IRF2BP2: A new player in tumor
development and microenvironment. Front Cell Dev Biol.
9:6553072021. View Article : Google Scholar : PubMed/NCBI
|
|
13
|
Fagerberg L, Hallström BM, Oksvold P,
Kampf C, Djureinovic D, Odeberg J, Habuka M, Tahmasebpoor S,
Danielsson A, Edlund K, et al: Analysis of the human
tissue-specific expression by genome-wide integration of
transcriptomics and antibody-based proteomics. Mol Cell Proteomics.
13:397–406. 2014. View Article : Google Scholar :
|
|
14
|
Ma YL, Xia JL and Gao X: Suppressing
Irf2bp2 expressions accelerates metabolic syndrome-associated brain
injury and hepatic dyslipidemia. Biochem Biophys Res Commun.
503:1651–1658. 2018. View Article : Google Scholar : PubMed/NCBI
|
|
15
|
Ramalho-Oliveira R, Oliveira-Vieira B and
Viola JPB: IRF2BP2: A new player in the regulation of cell
homeostasis. J Leukoc Biol. 106:717–723. 2019. View Article : Google Scholar : PubMed/NCBI
|
|
16
|
Chen HH, Keyhanian K, Zhou X, Vilmundarson
RO, Almontashiri NA, Cruz SA, Pandey NR, Lerma Yap N, Ho T, Stewart
CA, et al: IRF2BP2 reduces macrophage inflammation and
susceptibility to atherosclerosis. Circ Res. 117:671–683. 2015.
View Article : Google Scholar : PubMed/NCBI
|
|
17
|
Cruz SA, Hari A, Qin Z, Couture P, Huang
H, Lagace DC, Stewart AFR and Chen HH: Loss of IRF2BP2 in microglia
increases inflammation and functional deficits after focal ischemic
brain injury. Front Cell Neurosci. 11:2012017. View Article : Google Scholar : PubMed/NCBI
|
|
18
|
Feng X, Lu T, Li J, Yang R, Hu L, Ye Y,
Mao F, He L, Xu J, Wang Z, et al: The tumor suppressor interferon
regulatory factor 2 binding protein 2 regulates Hippo pathway in
liver cancer by a feedback loop in mice. Hepatology. 71:1988–2004.
2020. View Article : Google Scholar
|
|
19
|
Hari A, Cruz SA, Qin Z, Couture P,
Vilmundarson RO, Huang H, Stewart AFR and Chen HH:
IRF2BP2-deficient microglia block the anxiolytic effect of enhanced
postnatal care. Sci Rep. 7:98362017. View Article : Google Scholar : PubMed/NCBI
|
|
20
|
Li T, Luo Q, He L, Li D, Li Q, Wang C, Xie
J and Yi C: Interferon regulatory factor-2 binding protein 2
ameliorates sepsis-induced cardiomyopathy via AMPK-mediated
anti-inflammation and anti-apoptosis. Inflammation. 43:1464–1475.
2020. View Article : Google Scholar : PubMed/NCBI
|
|
21
|
Huang da W, Sherman BT and Lempicki RA:
Bioinformatics enrichment tools: Paths toward the comprehensive
functional analysis of large gene lists. Nucleic Acids Res.
37:1–13. 2009. View Article : Google Scholar
|
|
22
|
Piruzian E, Bruskin S, Ishkin A, Abdeev R,
Moshkovskii S, Melnik S, Nikolsky Y and Nikolskaya T: Integrated
network analysis of transcriptomic and proteomic data in psoriasis.
BMC Syst Biol. 4:412010. View Article : Google Scholar : PubMed/NCBI
|
|
23
|
Gauthier J, Vincent AT, Charette SJ and
Derome N: A brief history of bioinformatics. Brief Bioinform.
20:1981–1996. 2019. View Article : Google Scholar
|
|
24
|
Livak KJ and Schmittgen TD: Analysis of
relative gene expression data using real-time quantitative PCR and
the 2(-Delta Delta C(T)) method. Methods. 25:402–408. 2001.
View Article : Google Scholar
|
|
25
|
Ni X and Lai Y: Keratinocyte: A trigger or
an executor of psoriasis? J Leukoc Biol. 108:485–491. 2020.
View Article : Google Scholar : PubMed/NCBI
|
|
26
|
Xiuli Y and Honglin W: miRNAs flowing up
and down: The concerto of psoriasis. Front Med (Lausanne).
8:6467962021. View Article : Google Scholar : PubMed/NCBI
|
|
27
|
Bartel DP: MicroRNAs: Genomics,
biogenesis, mechanism, and function. Cell. 116:281–297. 2004.
View Article : Google Scholar : PubMed/NCBI
|
|
28
|
Guo H, Ingolia NT, Weissman JS and Bartel
DP: Mammalian microRNAs predominantly act to decrease target mRNA
levels. Nature. 466:835–840. 2010. View Article : Google Scholar : PubMed/NCBI
|
|
29
|
Jinnin M: Various applications of
microRNAs in skin diseases. J Dermatol Sci. 74:3–8. 2014.
View Article : Google Scholar : PubMed/NCBI
|
|
30
|
Wu R, Zeng J, Yuan J, Deng X, Huang Y,
Chen L, Zhang P, Feng H, Liu Z, Wang Z, et al: MicroRNA-210
overexpression promotes psoriasis-like inflammation by inducing Th1
and Th17 cell differentiation. J Clin Invest. 128:2551–2568. 2018.
View Article : Google Scholar : PubMed/NCBI
|
|
31
|
Raaby L, Langkilde A, Kjellerup RB, Vinter
H, Khatib SH, Hjuler KF, Johansen C and Iversen L: Changes in mRNA
expression precede changes in microRNA expression in lesional
psoriatic skin during treatment with adalimumab. Br J Dermatol.
173:436–447. 2015. View Article : Google Scholar : PubMed/NCBI
|
|
32
|
Sonkoly E, Wei T, Janson PC, Sääf A,
Lundeberg L, Tengvall-Linder M, Norstedt G, Alenius H, Homey B,
Scheynius A, et al: MicroRNAs: Novel regulators involved in the
pathogenesis of psoriasis? PLoS One. 2:e6102007. View Article : Google Scholar : PubMed/NCBI
|
|
33
|
Liu Q, Wu DH, Han L, Deng JW, Zhou L, He
R, Lu CJ and Mi QS: Roles of microRNAs in psoriasis: Immunological
functions and potential biomarkers. Exp Dermatol. 26:359–367. 2017.
View Article : Google Scholar
|
|
34
|
Luo Q, Zeng J, Li W, Lin L, Zhou X, Tian
X, Liu W, Zhang L and Zhang X: Silencing of miR-155 suppresses
inflammatory responses in psoriasis through inflammasome NLRP3
regulation. Int J Mol Med. 42:1086–1095. 2018.PubMed/NCBI
|
|
35
|
Liu Y, Zhao X, Li J, Zhou L, Chang W, Li
J, Hou R, Li J, Yin G, Li X and Zhang K: MiR-155 inhibits TP53INP1
expression leading to enhanced glycolysis of psoriatic mesenchymal
stem cells. J Dermatol Sci. 105:142–151. 2022. View Article : Google Scholar : PubMed/NCBI
|
|
36
|
Wang H, Zhang Y, Luomei J, Huang P, Zhou R
and Peng Y: The miR-155/GATA3/IL37 axis modulates the production of
proinflammatory cytokines upon TNF-α stimulation to affect
psoriasis development. Exp Dermatol. 29:647–658. 2020. View Article : Google Scholar : PubMed/NCBI
|
|
37
|
Koeppel M, van Heeringen SJ, Smeenk L,
Navis AC, Janssen-Megens EM and Lohrum M: The novel p53 target gene
IRF2BP2 participates in cell survival during the p53 stress
response. Nucleic Acids Res. 37:322–335. 2009. View Article : Google Scholar
|
|
38
|
Liang Y, Zhou Y and Shen P: NF-kappaB and
its regulation on the immune system. Cell Mol Immunol. 1:343–350.
2004.
|
|
39
|
Wu J, Ding J, Yang J, Guo X and Zheng Y:
MicroRNA roles in the nuclear factor kappa B signaling pathway in
cancer. Front Immunol. 9:5462018. View Article : Google Scholar : PubMed/NCBI
|
|
40
|
Alexandrov P, Zhai Y, Li W and Lukiw W:
Lipopolysaccharide-stimulated, NF-kB-, miRNA-146a- and
miRNA-155-mediated molecular-genetic communication between the
human gastrointestinal tract microbiome and the brain. Folia
Neuropathol. 57:211–219. 2019. View Article : Google Scholar : PubMed/NCBI
|
|
41
|
McConnell BB and Yang VW: Mammalian
Krüppel-like factors in health and diseases. Physiol Rev.
90:1337–1381. 2010. View Article : Google Scholar : PubMed/NCBI
|
|
42
|
Jha P and Das H: KLF2 in regulation of
NF-κB-mediated immune cell function and inflammation. Int J Mol
Sci. 18:23832017. View Article : Google Scholar
|
|
43
|
Das M, Lu J, Joseph M, Aggarwal R, Kanji
S, McMichael BK, Lee BS, Agarwal S, Ray-Chaudhury A, Iwenofu OH, et
al: Kruppel-like factor 2 (KLF2) regulates monocyte differentiation
and functions in mBSA and IL-1β-induced arthritis. Curr Mol Med.
12:113–125. 2012. View Article : Google Scholar : PubMed/NCBI
|
|
44
|
Mahabeleshwar GH, Qureshi MA, Takami Y,
Sharma N, Lingrel JB and Jain MK: A myeloid hypoxia-inducible
factor 1α-Krüppel-like factor 2 pathway regulates gram-positive
endotoxin-mediated sepsis. J Biol Chem. 287:1448–1457. 2012.
View Article : Google Scholar
|
|
45
|
Novodvorsky P and Chico TJA: The role of
the transcription factor KLF2 in vascular development and disease.
Prog Mol Biol Transl Sci. 124:155–188. 2014. View Article : Google Scholar : PubMed/NCBI
|
|
46
|
Das H, Kumar A, Lin Z, Patino WD, Hwang
PM, Feinberg MW, Majumder PK and Jain MK: Kruppel-like factor 2
(KLF2) regulates proinflammatory activation of monocytes. Proc Natl
Acad Sci USA. 103:6653–6658. 2006. View Article : Google Scholar : PubMed/NCBI
|
|
47
|
Mahabeleshwar GH, Kawanami D, Sharma N,
Takami Y, Zhou G, Shi H, Nayak L, Jeyaraj D, Grealy R, White M, et
al: The myeloid transcription factor KLF2 regulates the host
response to polymicrobial infection and endotoxic shock. Immunity.
34:715–728. 2011. View Article : Google Scholar : PubMed/NCBI
|
|
48
|
Nayak L, Goduni L, Takami Y, Sharma N,
Kapil P, Jain MK and Mahabeleshwar GH: Kruppel-like factor 2 is a
transcriptional regulator of chronic and acute inflammation. Am J
Pathol. 182:1696–1704. 2013. View Article : Google Scholar : PubMed/NCBI
|
|
49
|
SenBanerjee S, Lin Z, Atkins GB, Greif DM,
Rao RM, Kumar A, Feinberg MW, Chen Z, Simon DI, Luscinskas FW, et
al: KLF2 Is a novel transcriptional regulator of endothelial
proinflammatory activation. J Exp Med. 199:1305–1315. 2004.
View Article : Google Scholar : PubMed/NCBI
|
|
50
|
Masalha M, Sidi Y and Avni D: The
contribution of feedback loops between miRNAs, cytokines and growth
factors to the pathogenesis of psoriasis. Exp Dermatol. 27:603–610.
2018. View Article : Google Scholar : PubMed/NCBI
|