Introduction
In 2020, it was estimated that >1.9 million new
cases of colorectal cancer (CRC) were diagnosed globally, which was
associated with ~935,000 deaths; this accounted for ~10% of all
cancer incidences and deaths worldwide (1). Despite significant advances in
diagnosis and treatment, CRC continues to have a high mortality
rate and is a significant health burden worldwide (2-4).
Therefore, conducting comprehensive research into the molecular
mechanisms involved in the occurrence and development of CRC to
identify potential molecular targets has scientific and clinical
importance. This research could improve early diagnosis, prognostic
assessment and the development of targeted treatments for CRC.
Our previous study conducted a screening for
differentially expressed genes across 14 pairs of primary CRC
lesions and adjacent non-cancerous tissues [Gene Expression Omnibus
(GEO) accession no. GSE113513; https://www.ncbi.nlm.nih.gov/gds//] (5). This previous study revealed that
the levels of FGGY carbohydrate kinase domain containing (FGGY)
were elevated in CRC tissues (5). However, the functions and
biological mechanisms of FGGY in the progression of CRC are still
largely unexplored. This motivated a further investigation into
understanding the function of FGGY in CRC.
The FGGY gene is a member of the carbohydrate
kinases family, which is evolutionarily conserved and known for its
ability to phosphorylate an array of sugar substrates (6). The family of FGGY carbohydrate
kinases includes enzymes such as L-fuculokinase, gluconokinase,
glycerol kinase, D-ribulose kinase and L-xylulose kinase (7). FGGY was initially identified as
being associated with sporadic amyotrophic lateral sclerosis
(8,9). Moreover, FGGY has been reported to
influence dietary obesity in mice by modulating lipid metabolism
(9,10). In addition, a previous study
revealed that functional variations in the FGGY gene are associated
with the development and progression of lung squamous cell
carcinoma (LUSC) (11). Notably,
a tumor-specific and frequent L1-gene chimeric transcript involving
FGGY (L1-FGGY) has been identified in LUSC. FGGY has been
demonstrated to regulate cell proliferation and metabolic pathways
(11,12). Nevertheless, its clinical
significance and molecular mechanisms in CRC remain largely
unexplored. The present study utilized gene expression datasets
(GSE113513 and GSE20916) from the GEO, online bioinformatics
databases, cDNA array-based quantification and a tissue microarray
(TMA) to analyze FGGY expression in CRC samples. Furthermore, a
series of in vitro and in vivo experiments were
conducted with CRC cell lines and a nude mouse xenograft model to
investigate the function and potential molecular mechanisms of FGGY
in CRC.
Materials and methods
Bioinformatics analysis
Differential gene expression analysis between cancer
tissues and adjacent normal tissues was performed using The Cancer
Genome Atlas (TCGA; https://cancergenome.nih.gov/) database and Gene
Expression Profiling Interactive Analysis (GEPIA; http://gepia.cancer-pku.cn/) database. In the present
study, the mRNA expression data of FGGY in both CRC and matched
non-cancerous tissues were extracted from the GEO datasets
(GSE20916 and GSE113513) (5,13) and TCGA (TCGA-COAD datasets)
databases (14). Pearson
correlation analysis was performed to evaluate the correlation
between FGGY and p53 expression at the mRNA level in CRC using the
GSE39582 GEO dataset (15) and
TCGA-COAD datasets. Furthermore, the mRNA expression levels of FGGY
in different types of digestive system cancer compared with in
tissues from healthy controls were assessed using GEPIA (COAD
datasets) (16).
Cell lines and cell culture
The CRC cell lines, HCT-8 (cat. no. TCHu18), Caco2
(cat. no. TCHu146), SW480 (cat. no. TCHu172), HCT116 (cat. no.
TCHu99) and RKO (cat. no. TCHu116), and the colorectal
adenocarcinoma cell line HT-29 (cat. no. TCHu103) were obtained
from the National Collection of Authenticated Cell Cultures. The
wild-type HCT116 cell line (HCT116/p53+/+) and
p53-knockout HCT116 cell line (HCT116/p53−/−) were
provided by Dr Yao Lin (Fujian University of Traditional Chinese
Medicine, Fuzhou, China), which were originally sourced from Dr.
Bert Vogelstein (Johns Hopkins University, Baltimore, MD, USA).
HT-29 cells were cultured in McCoy's 5A medium (Nanjing KeyGen
Biotech Co., Ltd.), whereas RKO cells were grown in MEM-α medium
(Thermo Fisher Scientific, Inc.), Caco2 cells were maintained in
DMEM (Thermo Fisher Scientific, Inc.), and HCT-8, HCT116,
HCT116/p53+/+ and HCT116/p53−/− cells were
all maintained in RPMI1640 medium (Thermo Fisher Scientific, Inc.).
Each cell line was incubated at 37°C in a humidified atmosphere
containing 5% CO2. The growth media for all cells were
supplemented with 10% FBS (Thermo Fisher Scientific, Inc.), 100
U/ml penicillin and 100 μg/ml streptomycin (Hyclone;
Cytiva). The HT-29 cell line was characterized by Suzhou Jianda
Biotechnology Co., Ltd. using short tandem repeat profiling.
Reverse transcription-quantitative PCR
(RT-qPCR)
The total RNA was extracted from the cultured cells
using RNAiso Plus reagent (Takara Biotechnology Co., Ltd.). RT into
cDNA was performed using the PrimeScript RT reagent kit (Takara
Biotechnology Co., Ltd.), strictly adhering to the guidelines
provided by the manufacturer. In addition, a cDNA array of tissue
samples, including 79 primary CRC and 15 adjacent noncancerous
tissues (cat. no. HColA095Su01), was purchased from Shanghai Outdo
Biotech Co., Ltd. The mRNA expression levels of FGGY and GAPDH were
quantified using an ABI 7500 Fast Real-Time PCR System (Applied
Biosystems; Thermo Fisher Scientific, Inc.) with SYBR Premix Ex Tag
(Takara Biotechnology Co., Ltd.). The qPCR protocol consisted of an
initial denaturation at 95°C for 10 min, followed by 40 cycles of
denaturation at 95°C for 15 sec and annealing/extension at 60°C for
60 sec. GAPDH was used as the internal control. The primer
sequences are listed in Table
SI. The mRNA expression levels were determined using the
following formula: The relative expression levels were calculated
using the 2−ΔΔCq method, where ΔΔCq=[Cq(target
gene)-Cq(GAPDH)]sample-[Cq(target gene)-Cq(GAPDH)]control (17). The experimental procedures and
protocols of this research were approved by the Human Ethics
Committee of Shanghai Outdo Biotech Co., Ltd. (no.
SHYJS-CP-1704010). The clinicopathological characteristics of the
patients with CRC included in the cDNA array are presented in
Table SII.
Immunohistochemistry (IHC) analysis of a
TMA
A TMA of CRC samples (including 101 CRC tissues and
79 adjacent noncancerous tissues; cat. no. HColA180Su15) and
digestive system neoplasms [including colon adenocarcinoma (COAD),
rectal adenocarcinoma (READ), pancreatic cancer (PAAD), esophageal
cancer (ESCA), gastric cancer (STAD) and liver hepatocellular
carcinoma (LIHC); including tumor tissues (COAD: 16; READ: 14;
PAAD: 15; ESCA: 14; STAD: 14; LIHC: 16), normal tissues from
healthy controls (colorectal tissues: 9; rectal tissues: 3;
pancreatic tissues: 3; esophageal tissues: 5; gastric tissues: 7;
liver tissues: 3) and adjacent noncancerous tissues (colorectal
tissues: 16; rectal tissues: 14; pancreatic tissue: 15; esophageal
tissues: 14; gastric tissues: 14; liver tissues: 16); cat. nos.
HDgsC140PT01 and HorgC120PG04] were obtained from Shanghai Outdo
Biotech Co., Ltd. IHC was performed to evaluate FGGY expression in
clinical tumor samples, following previously described methods
(5). Formalin-fixed,
paraffin-embedded TMA sections were dehydrated using graded ethanol
and antigen retrieval was performed by microwave heating the slides
for 20 min in sodium citrate-hydrochloric acid buffer (Fuzhou
Maixin Biotechnology Development Co., Ltd.). After permeabilization
with 0.1% Triton X-100 (cat. no. T8200; Beijing Solarbio Science
& Technology Co., Ltd.) for 10 min, the sections were then
treated with 3% H2O2 for 10 min at room
temperature, followed by incubation with a blocking reagent (cat.
no. KIT-9710; Fuzhou Maixin Biotechnology Development Co., Ltd.)
for 30 min at room temperature. Tissue sections were then incubated
with an antibody against FGGY (1:900; cat. no. PA5-120316; Thermo
Fisher Scientific, Inc.) overnight at 4°C, and with a secondary
antibody (cat. no. KIT-9710; Fuzhou Maixin Biotechnology
Development Co., Ltd.) for 1 h at room temperature.
Immunoreactivity was then visualized using an enhanced DAB kit
(cat. no. DAB-2031; Fuzhou Maixin Biotechnology Development Co.,
Ltd.). Images were captured using a Nano Zoomer 2.0 HT light
microscope slide scanner (Hamamatsu Photonics K.K.) and processed
using Nano Zoomer Digital Pathology View 1.6 software (Hamamatsu
Photonics K.K.). To assess FGGY expression, a grading system was
used; staining intensity was rated as follows: No staining, 0;
weak, 1; moderate, 2; strong, 3; and the proportion of cells
showing positive staining was rated as: 1-25%, 1; 26-50%, 2;
51-75%, 3; 76-100%, 4. The overall score for FGGY expression was
determined by multiplying the intensity score with the percentage
score.
For survival analysis, FGGY expression in CRC
tissues was categorized into either low (final score, 0-6) or high
(final score, 7-12). Kaplan-Meier survival curves were plotted for
groups with high and low FGGY expression, and were analyzed using
log-rank test. The experimental procedures and protocols of this
research were approved by the Human Ethics Committee of Shanghai
Outdo Biotech Co., Ltd. [nos. SHYJS-CP-1810005 (HColA180Su15),
SHYJS-CP-1904003 (HDgsC140PT01), SHYJS-CP-1901007 (HorgC120PG04)].
The clinicopathological characteristics of patients with CRC are
presented in Table SIII.
Lentivirus transduction
The specific short hairpin RNA (shRNA) targeting
FGGY and a non-silencing control shRNA were designed and validated
by Shanghai GeneChem Co., Ltd. The shRNA oligonucleotides were
cloned into a GV248 lentiviral vector (Shanghai GeneChem Co., Ltd.)
that included a green fluorescence protein (GFP) reporter gene.
Briefly, a second-generation system was used and 293T cells were
used as the interim cell line. For plasmid transfection, 293T cells
were subcultured and seeded into 10-cm plates at a density of
5×10⁶ cells/15 ml. The DMEM was replaced with serum-free
medium 2 h before transfection. A DNA solution containing 20
μg GV248 vector plasmid, 15 μg pHelper 1.0 carrier
plasmid, 10 μg pHelper 2.0 vector plasmid and the
corresponding volume of transfection reagent (cat. no. GRCT105;
Shanghai GeneChem Co., Ltd.) was evenly mixed. The total volume was
adjusted to 1 ml and incubated at room temperature for 15 min, then
added dropwise to the 293T cells. After 6 h of transfection, the
medium was replaced and 10 ml PBS was added. Subsequently, 20 ml
fresh medium was added, and the cells were incubated at 37°C in a
humidified atmosphere containing 5% CO2 for an
additional 48-72 h. The supernatant from the 293T cells was then
collected, centrifuged at 4,000 × g for 10 min at 4°C to remove
cell debris and filtered through a 0.45-μm filter. The
supernatant was then centrifuged at 25,000 × g for 2 h at 4°C;
after centrifugation, the supernatant was discarded, and viral
storage solution was added to completely dissolve the lentiviral
particles. For cell transduction, HCT116 and RKO cells were
subcultured, seeded into 12-well plates at a density of
0.4×10⁵ cells/well and were cultured overnight.
Lentivirus coding shRNA targeting FGGY (LV-FGGY-RNAi;
hU6-MCS-Ubiquitin-EGFP-IRES-puromycin) or the control shRNA
(sh-Ctrl; hU6-MCS-Ubiquitin-EGFP-IRES-puromycin) (18) was added at a multiplicity of
infection (MOI) of 10, with medium and Hitrans P infection
enhancement reagent (cat. no. REVG005; Shanghai GeneChem Co., Ltd.)
reaching a total volume of 500 μl/well. The specific
sequences of these shRNAs are detailed in Table SIV. The medium was changed after
12 h of transduction and fresh medium was added. The cells were
then incubated at 37°C in a humidified atmosphere containing 5%
CO2 for an additional 72 h. After 72 h, the infection
efficiency was verified by observing the number of GFP-positive
cells under a fluorescence microscope. To confirm the knockdown of
FGGY, the mRNA and protein expression levels of FGGY were assessed
using RT-qPCR and western blot analysis, respectively. After
verifying a significant decrease in FGGY expression at both the
mRNA and protein levels, the cells were collected for subsequent
experiments.
To investigate the effects of FGGY overexpression on
cell proliferation, HT-29 cells were transduced with a lentiviral
vector (GV492; Ubi-MCS-3FLAG-CBh-gcGFP-IRES-puromycin) (MOI, 10)
that encoded the full-length human FGGY gene [NCBI Gene ID: 55277;
OBiO Technology (Shanghai) Corp., Ltd.] or an empty vector control
(GV492 without FGGY insert) at the same MOI. The protocol for the
overexpression plasmid transduction was the same as that described
for shRNA transduction. The medium was changed after 12 h of
transduction and fresh medium was added. The cells were then
incubated at 37°C in a humidified atmosphere containing 5%
CO2 for an additional 72 h. After 72 h, the infection
efficiency was verified by observing the number of GFP-positive
cells under a fluorescence microscope. Successfully transduced
cells were selected using 2 μg/ml puromycin (cat. no.
A1113803; Thermo Fisher Scientific, Inc.) for 1 week, and then
maintained in medium containing 1 μg/ml puromycin. To
confirm the overexpression of FGGY, the mRNA and protein expression
levels of FGGY were assessed using RT-qPCR and western blot
analysis, respectively. After verifying a significant decrease in
FGGY expression at both the mRNA and protein levels, the cells were
collected for subsequent experiments.
Western blot analysis
After lentiviral transduction and puromycin
selection, cells were collected and lysed using RIPA lysis buffer
(Beyotime Institute of Biotechnology) supplemented with 1 mM PMSF
and protease inhibitors. The total protein concentration was
determined using the Pierce BCA Protein Assay Kit (Thermo Fisher
Scientific, Inc.). Protein lysates (50 μg) were separated by
SDS-PAGE on 10% gels and were then transferred onto polyvinylidene
difluoride membranes. These membranes were subsequently blocked
with 5% nonfat milk in TBS-0.1% Tween for 2 h at room temperature,
and then incubated with primary antibodies against FGGY (cat. no.
PA5-120316; Thermo Fisher Scientific, Inc.), p53 (cat. no.
10442-1-AP; Proteintech Group, Inc.), p21 (cat. no. 2947S; Cell
Signaling Technology, Inc.), PCNA (cat. no. 10205-2-AP; Proteintech
Group, Inc.), Bcl-2 (cat. no. 3498; Cell Signaling Technology,
Inc.), Bax (cat. no. 2772; Cell Signaling Technology, Inc.) or
GAPDH (cat no. Abp57259; Abbkine Scientific Co., Ltd.) (all at a
dilution of 1:1,000) at 4°C overnight. This was followed by
incubation with goat anti-rabbit secondary antibodies conjugated
with horseradish peroxidase (1:5,000; cat. no. 7074; Cell Signaling
Technology, Inc.) for 2 h at room temperature. Protein bands were
detected using an ECL imager (cat no. 32209; Thermo Fisher
Scientific, Inc.) and their intensities were analyzed with ImageLab
software (version 5.2.1; Bio-Rad Laboratories, Inc.). GAPDH
expression was used as a loading control. Each experiment was
performed in triplicate.
Cell viability assay
The cells were seeded in 96-well plates at a density
0.2×10⁵/ml and were cultured for 24, 48, 72, 96 or 120
h, after which 10 μl CCK-8 solution (cat. no. KTA1020;
Abbkine Scientific Co., Ltd.) was added to each well. The plates
were then incubated at 37°C for 2 h in an incubator with 5%
CO2 in the dark. Subsequently, the optical density of
each well was measured at an absorbance of 450 nm using a
microplate reader.
Cell cycle and apoptosis analyses
For the cell cycle analysis, transduced cells were
harvested and fixed in 70% ethanol at 4°C overnight. These fixed
cells were then centrifuged at 2,000 × g for 3 min at room
temperature, washed and incubated with FxCycle™ PI/RNase staining
solution (cat no. F10797; Thermo Fisher Scientific, Inc.) for 30
min at room temperature. Cell cycle progression was analyzed using
a FACSCalibur flow cytometer (BD Biosciences), with Modfit LT
version 3.0 software (Verity Software House, Inc.). For the
apoptosis analysis, transfected cells were rinsed twice with
ice-cold PBS and incubated with Annexin-V-AbFluor™ 647 Apoptosis
Detection Kit (Abbkine Scientific Co., Ltd.) for 30 min at 37°C in
the dark. The rate of apoptosis in these cells was also determined
using FACSCalibur flow cytometer (BD Biosciences). Data were
analyzed using CellQuest Pro software (version 6.0; BD
Biosciences). Each assay was conducted in triplicate.
Colony formation assay
Transduced cells were seeded in 12-well plates at a
density of 500 cells/well and were incubated at 37°C in a 5%
CO2 atmosphere for 10 days. At the end of this
incubation period, the cells were fixed using 4% paraformaldehyde
for 15 min at room temperature and were subsequently stained with
0.1% crystal violet for 15-20 min at room temperature. Colonies
were defined as clusters containing ≥50 cells and were observed
using a light microscope (Leica Microsystems GmbH) and images were
captured with a camera. The colonies were manually counted and the
relative change in colony formation was determined. Data were
normalized to the control group. Each assay was conducted in
triplicate.
Xenograft experiments in nude mice
A total of 22 male BALB/c nude mice (age, 6-8 weeks;
weight, 20-22 g) were acquired from Shanghai SLAC Laboratory Animal
Co. Ltd. The mice were housed in a controlled, pathogen-free
environment, with a stable temperature (22°C), humidity (40-70%)
and under a 12-h light/dark cycle. The mice were provided
unrestricted access to food and water. All experimental procedures
involving animals were approved by the Institutional Animal Care
and Use Committee of the Fujian University of Traditional Chinese
Medicine (approval no. FJTCM IACUC 2019052) and were conducted in
strict accordance with international guidelines (19) for the ethical use of animals in
research.
Transduced HCT116, RKO and HT-29 cells
(1×10⁶) in 100 μl medium mixed with 50% Matrigel
were subcutaneously injected into the flank of nude mice (n=5,
sh-FGGY and sh-Ctrl groups; or n=6, FGGY overexpression and control
groups). Tumor growth was monitored every other day using a vernier
caliper, with the volume calculated as: 1/2 (larger diameter x
smaller diameter2). At the end of the experimental time
point (16 days post-inoculation for shRNA groups and 20 days
post-inoculation for overexpression groups), the mice were
anesthetized using 2% isoflurane inhalation for induction and 1.5%
isoflurane inhalation for maintenance. Tumor imaging was captured
using the IVIS Spectrum live-animal imaging system (PerkinElmer,
Inc.). Signal intensity was quantified based on the photon count
per second from the region of interest. After imaging, the mice
were sacrificed by cervical dislocation, and the tissues were
harvested for further analysis.
Isobaric tags for relative and absolute
quantitation (iTRAQ) analysis and protein identification
iTRAQ analysis was used to screen differentially
expressed proteins (DEPs) after knockdown of FGGY in HCT116 cells
(20,21). The protein samples were reduced
with 10 mM DTT at 56°C for 1 h and alkylated with 55 mM IAM in the
dark for 1 h at room temperature. The protein samples were then
digested overnight at 37°C with sequencing-grade modified trypsin
(Promega Corporation) at a protein-to-trypsin ratio of 20:1. After
trypsin digestion, peptides were dried by vacuum centrifugation
(10,000 × g, 2 h, 45°C) and reconstituted in 0.5 M TEAB. The liquid
chromatography (LC)-MS/MS analysis was performed by CapitalBio
Technology Co., Ltd. using a Q Exactive mass spectrometer (Thermo
Fisher Scientific, Inc.). The peptide separation was achieved by
reversed-phase chromatography on a DIONEX nano-UPLC system, using
an Acclaim C18 PepMap100 nano-Trap column (75 μm × 2 cm)
connected to an Acclaim PepMap RSLC C18 analytical column (75
μm × 25 cm, 2 μm particle size) (all from Thermo
Fisher Scientific, Inc.). Before loading, the sample was dissolved
in mobile phase A, which consisted of 2% acetonitrile and 0.1%
formic acid. A linear gradient of mobile phase B (0.1% formic acid
in 99.9% acetonitrile) was applied, increasing from 2 to 35% over
45 min, followed by a sharp increase to 80% mobile phase B in 1
min, at a flow rate of 300 nl/min. The nano-LC was coupled online
with the Q Exactive mass spectrometer using a stainless-steel
emitter attached to a nanospray ion source. Nitrogen gas
temperature was 0.6 Mpa and nebulizer pressure was 50 psi. MS
analysis was performed in a data-dependent manner, with full scans
(350-1,600 m/z) acquired using an Orbitrap mass analyzer (Thermo
Fisher Scientific, Inc.) at a mass resolution of 70,000 at 400 m/z
in Q Exactive. The 20 most intense precursor ions from each survey
scan were selected for MS/MS analysis, which was performed at a
mass resolution of 17,500 at 400 m/z in the Orbitrap analyzer. All
tandem mass spectra were generated using the higher-energy
collision dissociation method, with a dynamic exclusion of 20 sec.
Proteins with >1.2-fold change in expression between groups and
with a P-value of <0.05 were identified as DEPs. These DEPs were
identified using volcano plots and further analyzed using
hierarchical clustering plots in R software (version 4.1.0; R
Foundation for Statistical Computing; https://www.R-project.org/) using the ggplot2 package
(version 3.3.5; https://cran.r-project.org/web/packages/ggplot2/)
for volcano plots and pheatmap package (version 1.0.12; https://cran.r-project.org/web/packages/pheatmap/) for
hierarchical clustering analysis. To ascertain the biological
pathways affected by these DEPs, Kyoto Encyclopedia of Genes and
Genomes (KEGG) pathway, Reactome pathway and PANTHER pathway
analyses were performed (22-24). The enriched pathways were
identified from the DEPs using KEGG database (https://www.genome.jp/kegg/) with a significance
cutoff of P<0.05 (25,26).
Phosphoproteome analysis and
phosphopeptide identification
Transduced cells were lysed using SDT lysis buffer
(Beyotime Institute of Biotechnology). Proteins were then digested
with trypsin using filter-aided sample preparation. A total of 100
μg peptide mixture from each sample was labeled using iTRAQ
reagent (SCIEX) adhering to the manufacturer's guidelines.
Phosphopeptide enrichment was carried out, followed by LC-MS/MS
analysis as per the manufacturer's instruction (L-3000 HPLC system;
RIGOL Technologies) (27,28).
Subsequently, identification and quantification of phosphorylated
proteins were achieved using the MASCOT engine (version 2.2; Matrix
Science), integrated into Proteome Discoverer 2.4.
Motif analysis was carried out using MeMe
(http://meme-suite.org/). The amino acid sequences
containing the modified site, and six upstream/downstream amino
acids from the modified site (resulting in a total of 13 amino acid
positions), were extracted and used for motif prediction
(parameters used: Width, 13; occurrences, 20; background, species).
Phosphopeptide sequences were analyzed with InterProScan software
(version 5.52-86.0; EMBL-EBI)to identify protein domain signatures
from the InterPro member database Pfam (22,23). Phosphopeptides showing ≥1.2-fold
difference in expression in comparative analyses and with a P-value
of <0.05 were considered differentially expressed. These
phosphopeptides were visualized using volcano plots and further
analyzed using hierarchical clustering plots. Proteins were
categorized based on their KEGG annotations with P<0.05.
Senescence β-galactosidase (SA-β-gal)
staining
Cells with knockdown of FGGY or overexpression of
FGGY were first washed with 1xPBS, and subsequently fixed with 4%
paraformaldehyde for 10-15 min at room temperature. After fixation,
the cells were washed and then incubated with β-gal staining
solution (cat no. ab102534; Abcam) in a dry incubator at 37°C
overnight. Images of the β-gal stained-cells were captured using a
light microscope (Leica Microsystems GmbH) at a ×200 magnification.
Each assay was conducted in triplicate.
Immunofluorescence staining
Cells were initially rinsed with PBS after knockdown
of FGGY, and were then fixed in 4% paraformaldehyde for 20 min at
room temperature. The cells were subsequently permeabilized with
0.1% Triton X-100, blocked with 1% BSA (cat. no. SW3015; Beijing
Solarbio Science & Technology Co., Ltd.) for 1 h at room
temperature, and were incubated overnight at 4°C with primary
antibodies against HP1γ (cat. no. 2619; Cell Signaling Technology,
Inc.), or trimethylation of H3K9 (H3k9me3; cat. no. 49-1008; Thermo
Fisher Scientific, Inc.), at a dilution of 1:200. Post-primary
antibody incubation, the cells were washed with PBS and incubated
with Goat anti-Rabbit IgG Alexa Fluor™ 647 (cat. no. A-21245;
Thermo Fisher Scientific, Inc.) at a dilution of 1:200 for 1 h at
room temperature, followed by Hoechst 33342 staining for 10 min at
room temperature. All images were captured using a fluorescence
microscope (Leica Microsystems GmbH) at a magnification of ×400.
Each assay was conducted in triplicate.
Statistical analysis
Experiments were performed at least in triplicate
and data are presented as the mean ± standard deviation.
Statistical analysis was conducted using SPSS 26.0 software (IBM
Corp). Comparisons between two datasets were made using a
two-tailed unpaired Student's t-test for normally distributed data
or Mann Whitney-U test for non-parametric data. Multiple group
comparisons were analyzed using one-way ANOVA followed by Tukey's
post hoc test or two-way ANOVA followed by Bonferroni's post hoc
test. The associations between FGGY protein expression and
clinicopathological characteristics were analyzed using
χ2 test or Fisher's exact test (when the expected counts
were ≤5 in >20% of samples) for categorical variables. The
correlation between genes was analyzed using Pearson correlation
coefficient. P<0.05 was considered to indicate a statistically
significant difference.
Results
Upregulation of FGGY expression in CRC is
associated with shorter overall survival and metastasis in patients
with CRC
The mRNA and protein expression levels of FGGY in
various types of digestive system neoplasms were determined by
GEPIA database analysis and TMA analysis in COAD, READ, PAAD, ESCA,
STAD and LIHC. There was an elevation in FGGY mRNA and protein
expression in PAAD, COAD and READ tissues compared with in normal
tissues from healthy controls (Fig.
1A-F). This increase was also observed in COAD and READ tissues
compared with in adjacent noncancerous tissues (Fig. 1A-D). However, FGGY protein
expression did not exhibit significant differences in ESCA, STAD
and LIHC tissues compared with in normal tissues from healthy
controls and adjacent noncancerous tissues (Fig. 1G-L). These findings suggested
that FGGY could serve as a potential specific marker of CRC, with
increased expression in CRC.
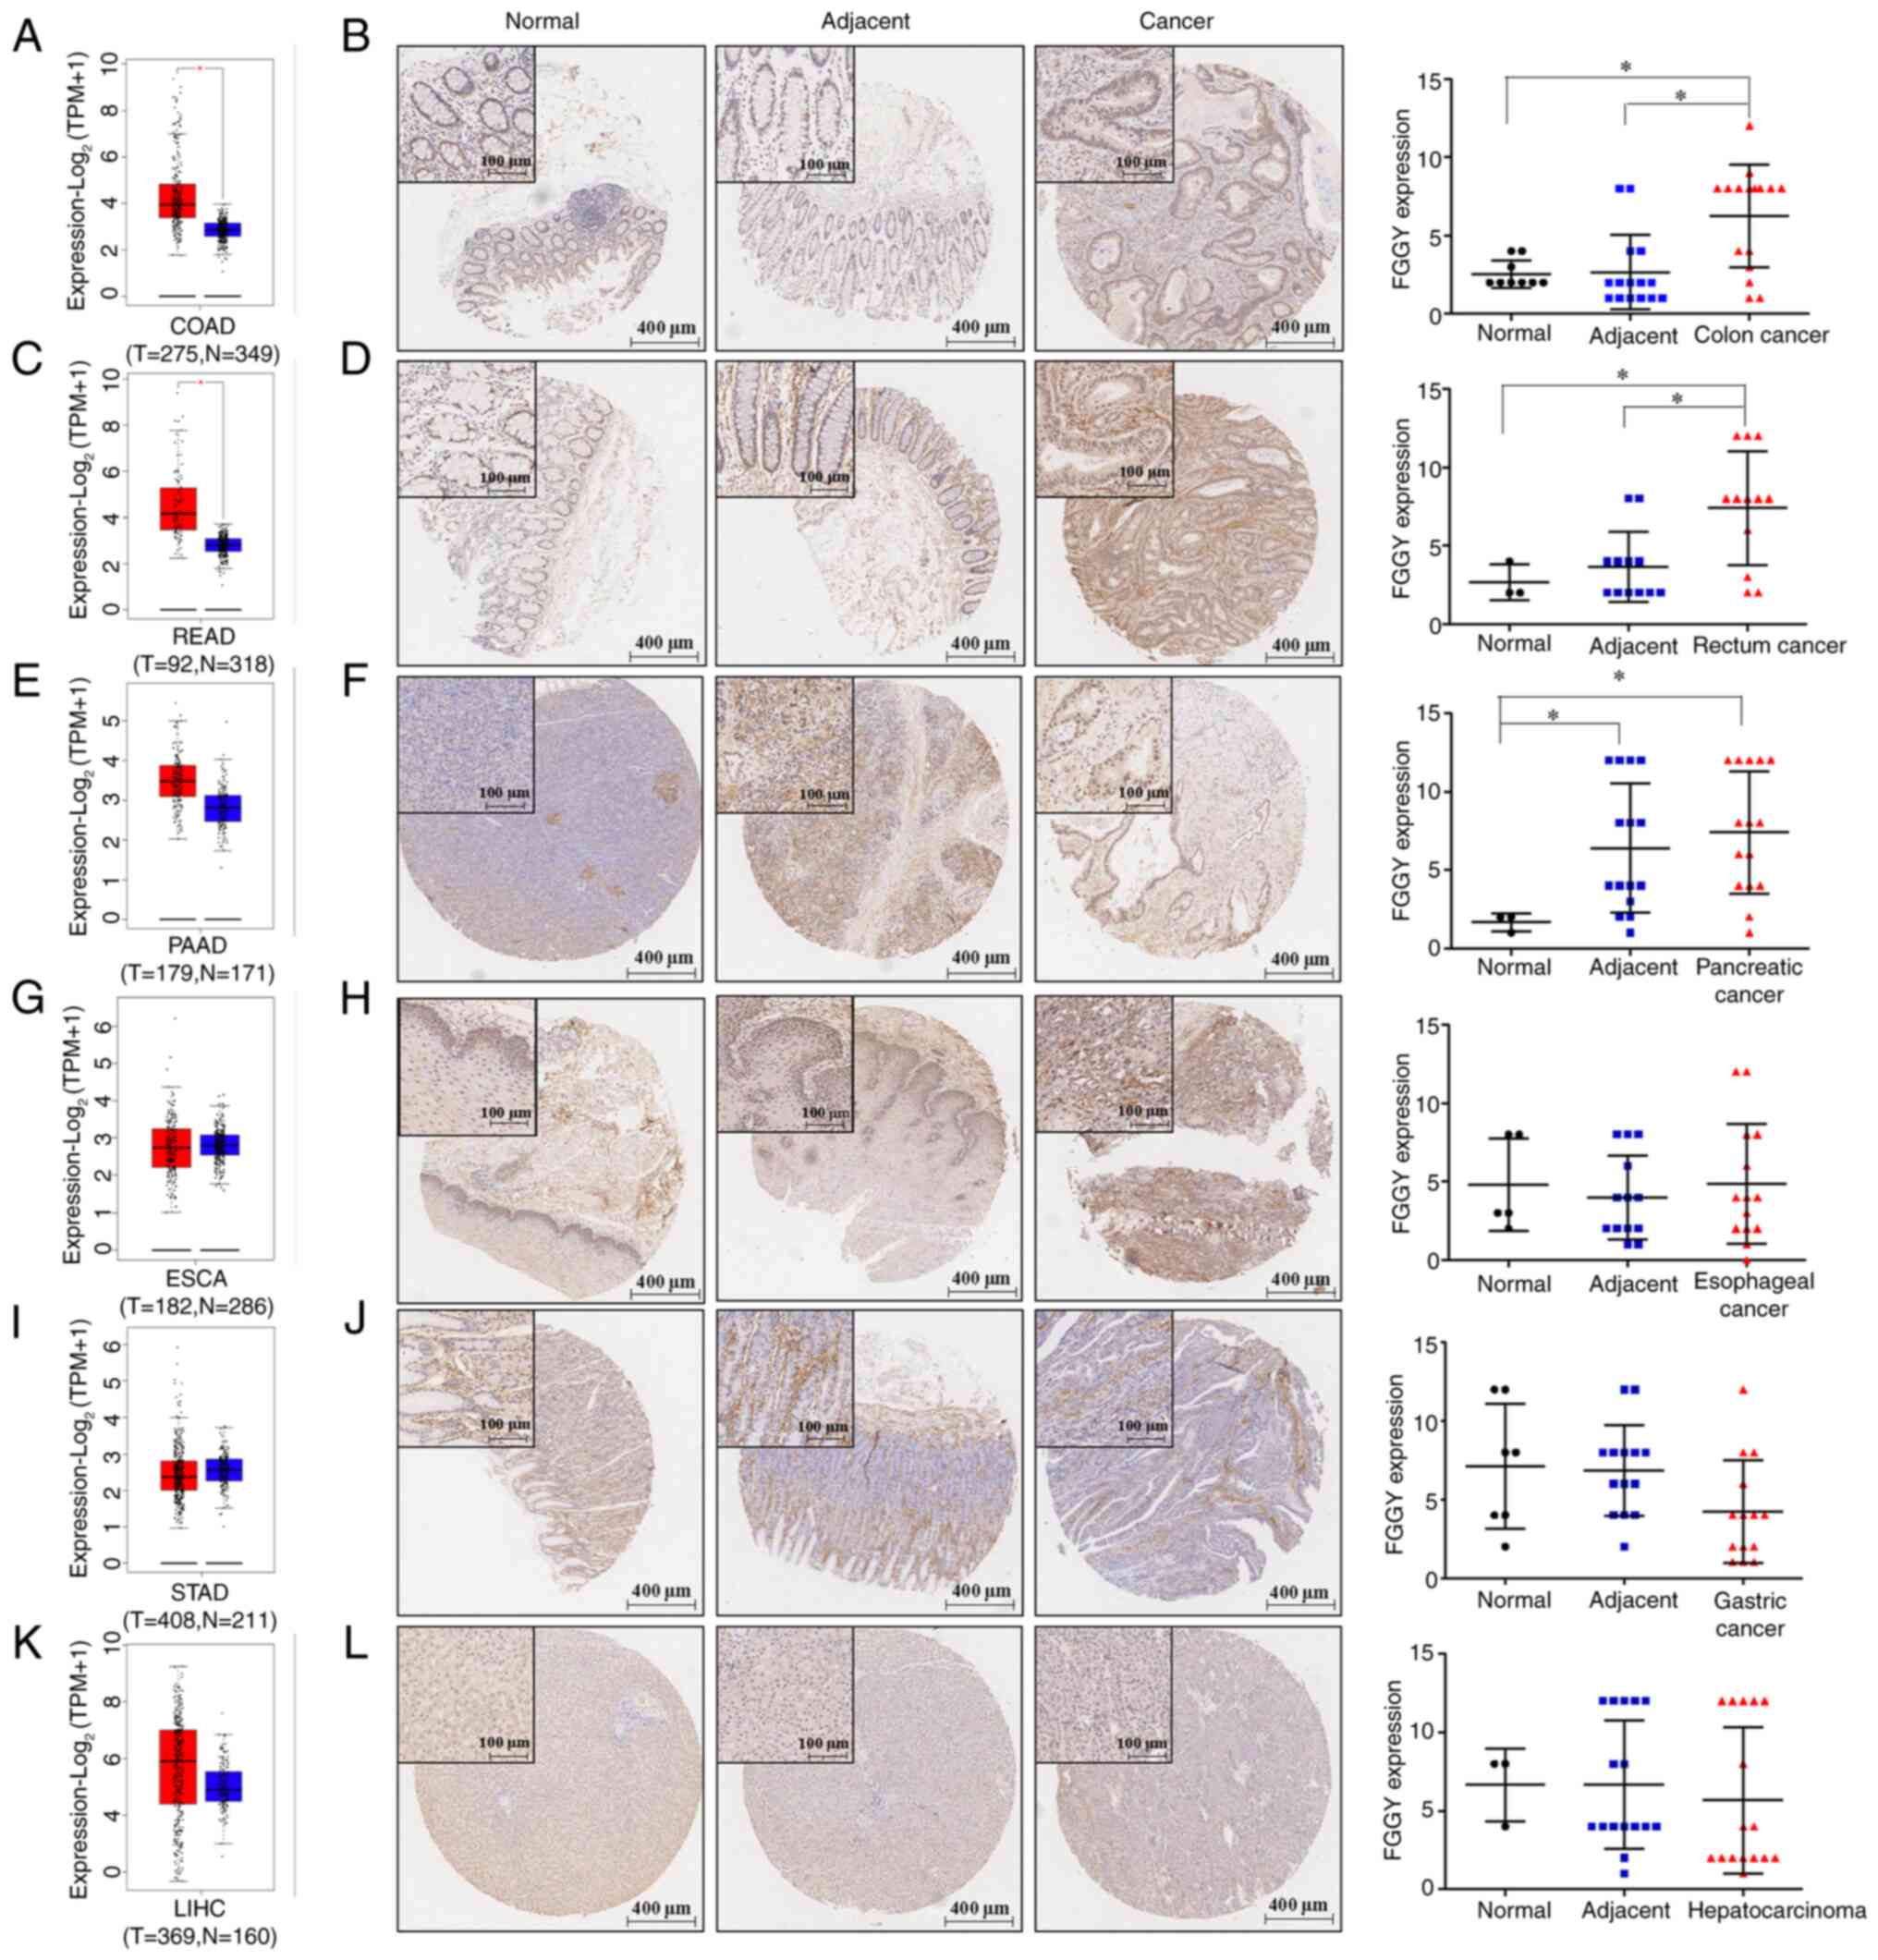 | Figure 1FGGY expression at both mRNA and
protein levels in various type of cancer tissues. FGGY expression
was analyzed in (A) COAD, (C) READ, (E) PAAD, (G) ESCA, (I) STAD
and (K) LIHC from the Gene Expression Profiling Interactive
Analysis database. FGGY expression was analyzed in (B) COAD, (D)
READ, (F) PAAD, (H) ESCA, (J) STAD and (L) LIHC from the tissue
microarray. *P<0.05. COAD, colon adenocarcinoma; ESCA
esophageal cancer; FGGY, FGGY carbohydrate kinase domain
containing; LIHC, liver hepatocellular carcinoma; N, normal; PAAD,
pancreatic cancer; READ, rectal adenocarcinoma; STAD, gastric
cancer; T, tumor; TPM, transcripts per million. |
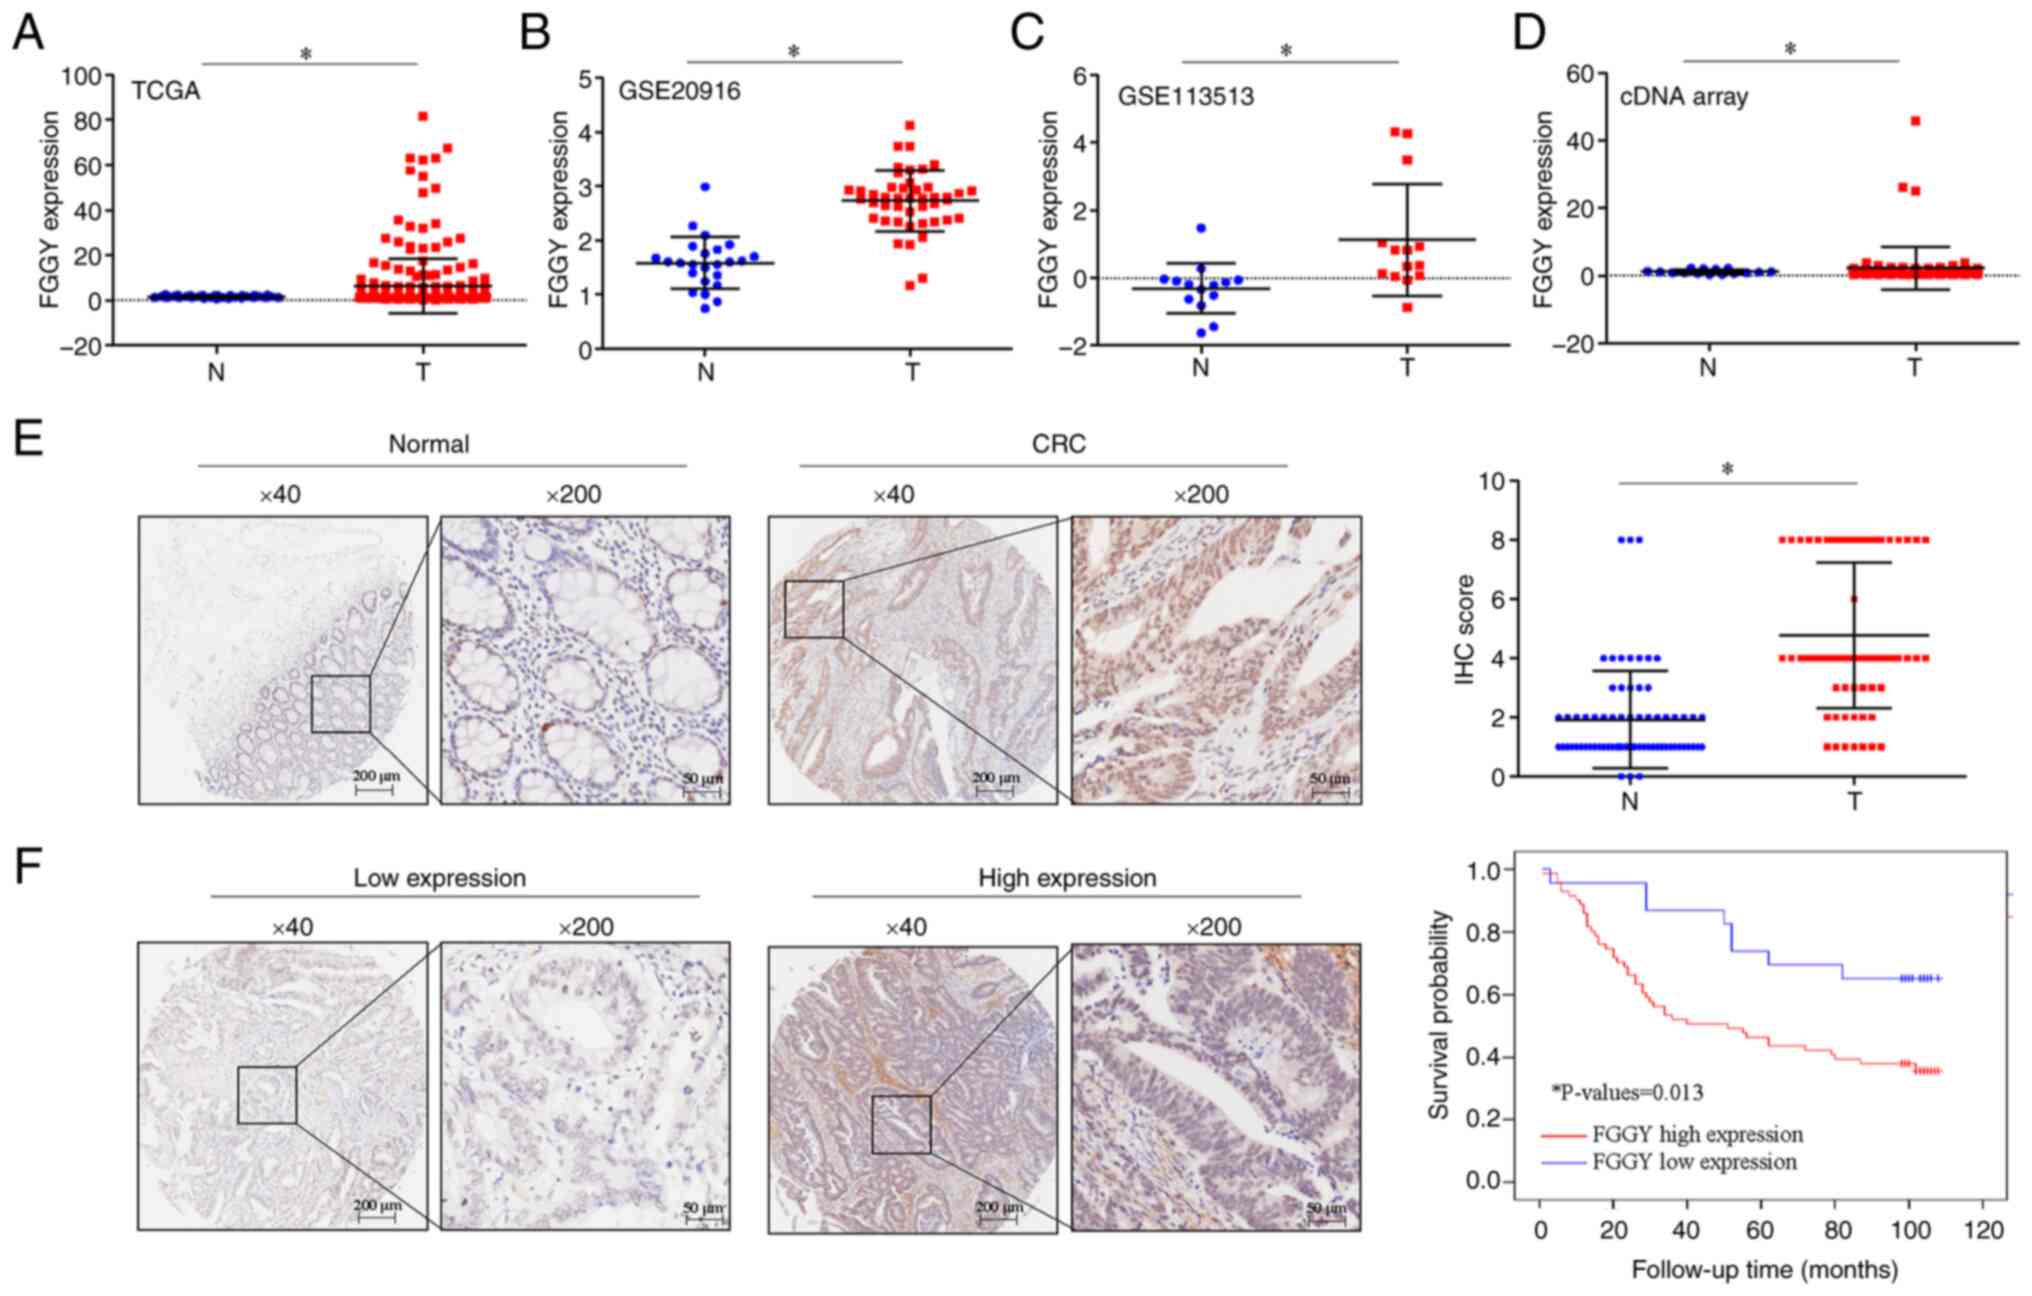
Furthermore, the analysis of TCGA and GEO datasets
(GSE20916 and GSE13513) further confirmed the upregulation of FGGY
mRNA expression in CRC tissues compared with in adjacent normal
tissues (Fig. 2A-C). This
finding was further verified at the mRNA level using a cDNA array
by RT-qPCR analysis (Fig. 2D;
n=15 pairs) and at the protein level using a TMA via IHC analysis
(Fig. 2E; n=71 pairs) in CRC
tissues compared with in adjacent normal tissues. Moreover,
survival analysis revealed an association between high FGGY protein
expression and shorter overall survival in patients with CRC
(Fig. 2F; high expression, n=71;
low expression, n=23; cutoff, 3). Analysis of the association of
FGGY with clinicopathological characteristics revealed that higher
FGGY expression was associated with N stage in patients with CRC
(Table I).
 | Table IAssociation between FGGY expression
and the clinicopathological characteristics of patients with
colorectal cancer in a tissue microarray. |
Table I
Association between FGGY expression
and the clinicopathological characteristics of patients with
colorectal cancer in a tissue microarray.
| Variable | Total (n=94)
(%) | FGGY protein
expression
| P-value |
|---|
| Low expression
(n=23) (%) | High expression
(n=71) (%) |
|---|
| Age | | | | 0.280 |
| ≤65 years | 42 (44.7) | 12 (12.8) | 30 (31.9) | |
| >65 years | 52 (55.3) | 11 (11.7) | 41 (43.6) | |
| Sex | | | | 0.554 |
| Male | 52 (55.3) | 15 (16.0) | 37 (39.4) | |
| Female | 42 (44.7) | 8 (8.5) | 34 (36.2) | |
| Pathological
stage | | | | 0.495 |
| I | 5 (5.3) | 1 (1.1) | 4 (4.3) | |
| II | 78 (83.0) | 21 (22.3) | 57 (60.6) | |
| III | 11 (11.7) | 1 (1.1) | 10 (10.6) | |
| Tumor size | | | | 0.389 |
| ≤5 cm | 48 (51.1) | 15 (16.0) | 33 (35.1) | |
| >5 cm | 46 (48.9) | 8 (8.5) | 38 (40.4) | |
| T stage | | | | 0.498 |
| T1 | 1 (1.1) | 0 (0) | 1 (1.1) | |
| T2 | 5 (5.3) | 0 (0) | 5 (5.3) | |
| T3 | 71 (75.5) | 21 (22.3) | 50 (53.2) | |
| T4 | 13 (13.8) | 2 (2.1) | 11 (11.7) | |
| N stage | | | | 0.042a |
| N0 | 56 (59.6) | 17 (18.%) | 39 (41.5) | |
| N1 | 27 (28.7) | 6 (6.4) | 21 (22.3) | |
| N2 | 11 (11.7) | 0 (0) | 11 (11.7) | |
| M stage | | | | >0.999 |
| M0 | 91 (96.8) | 22 (23.4) | 69 (73.4) | |
| M1 | 3 (3.2) | 1 (1.1) | 2 (2.1) | |
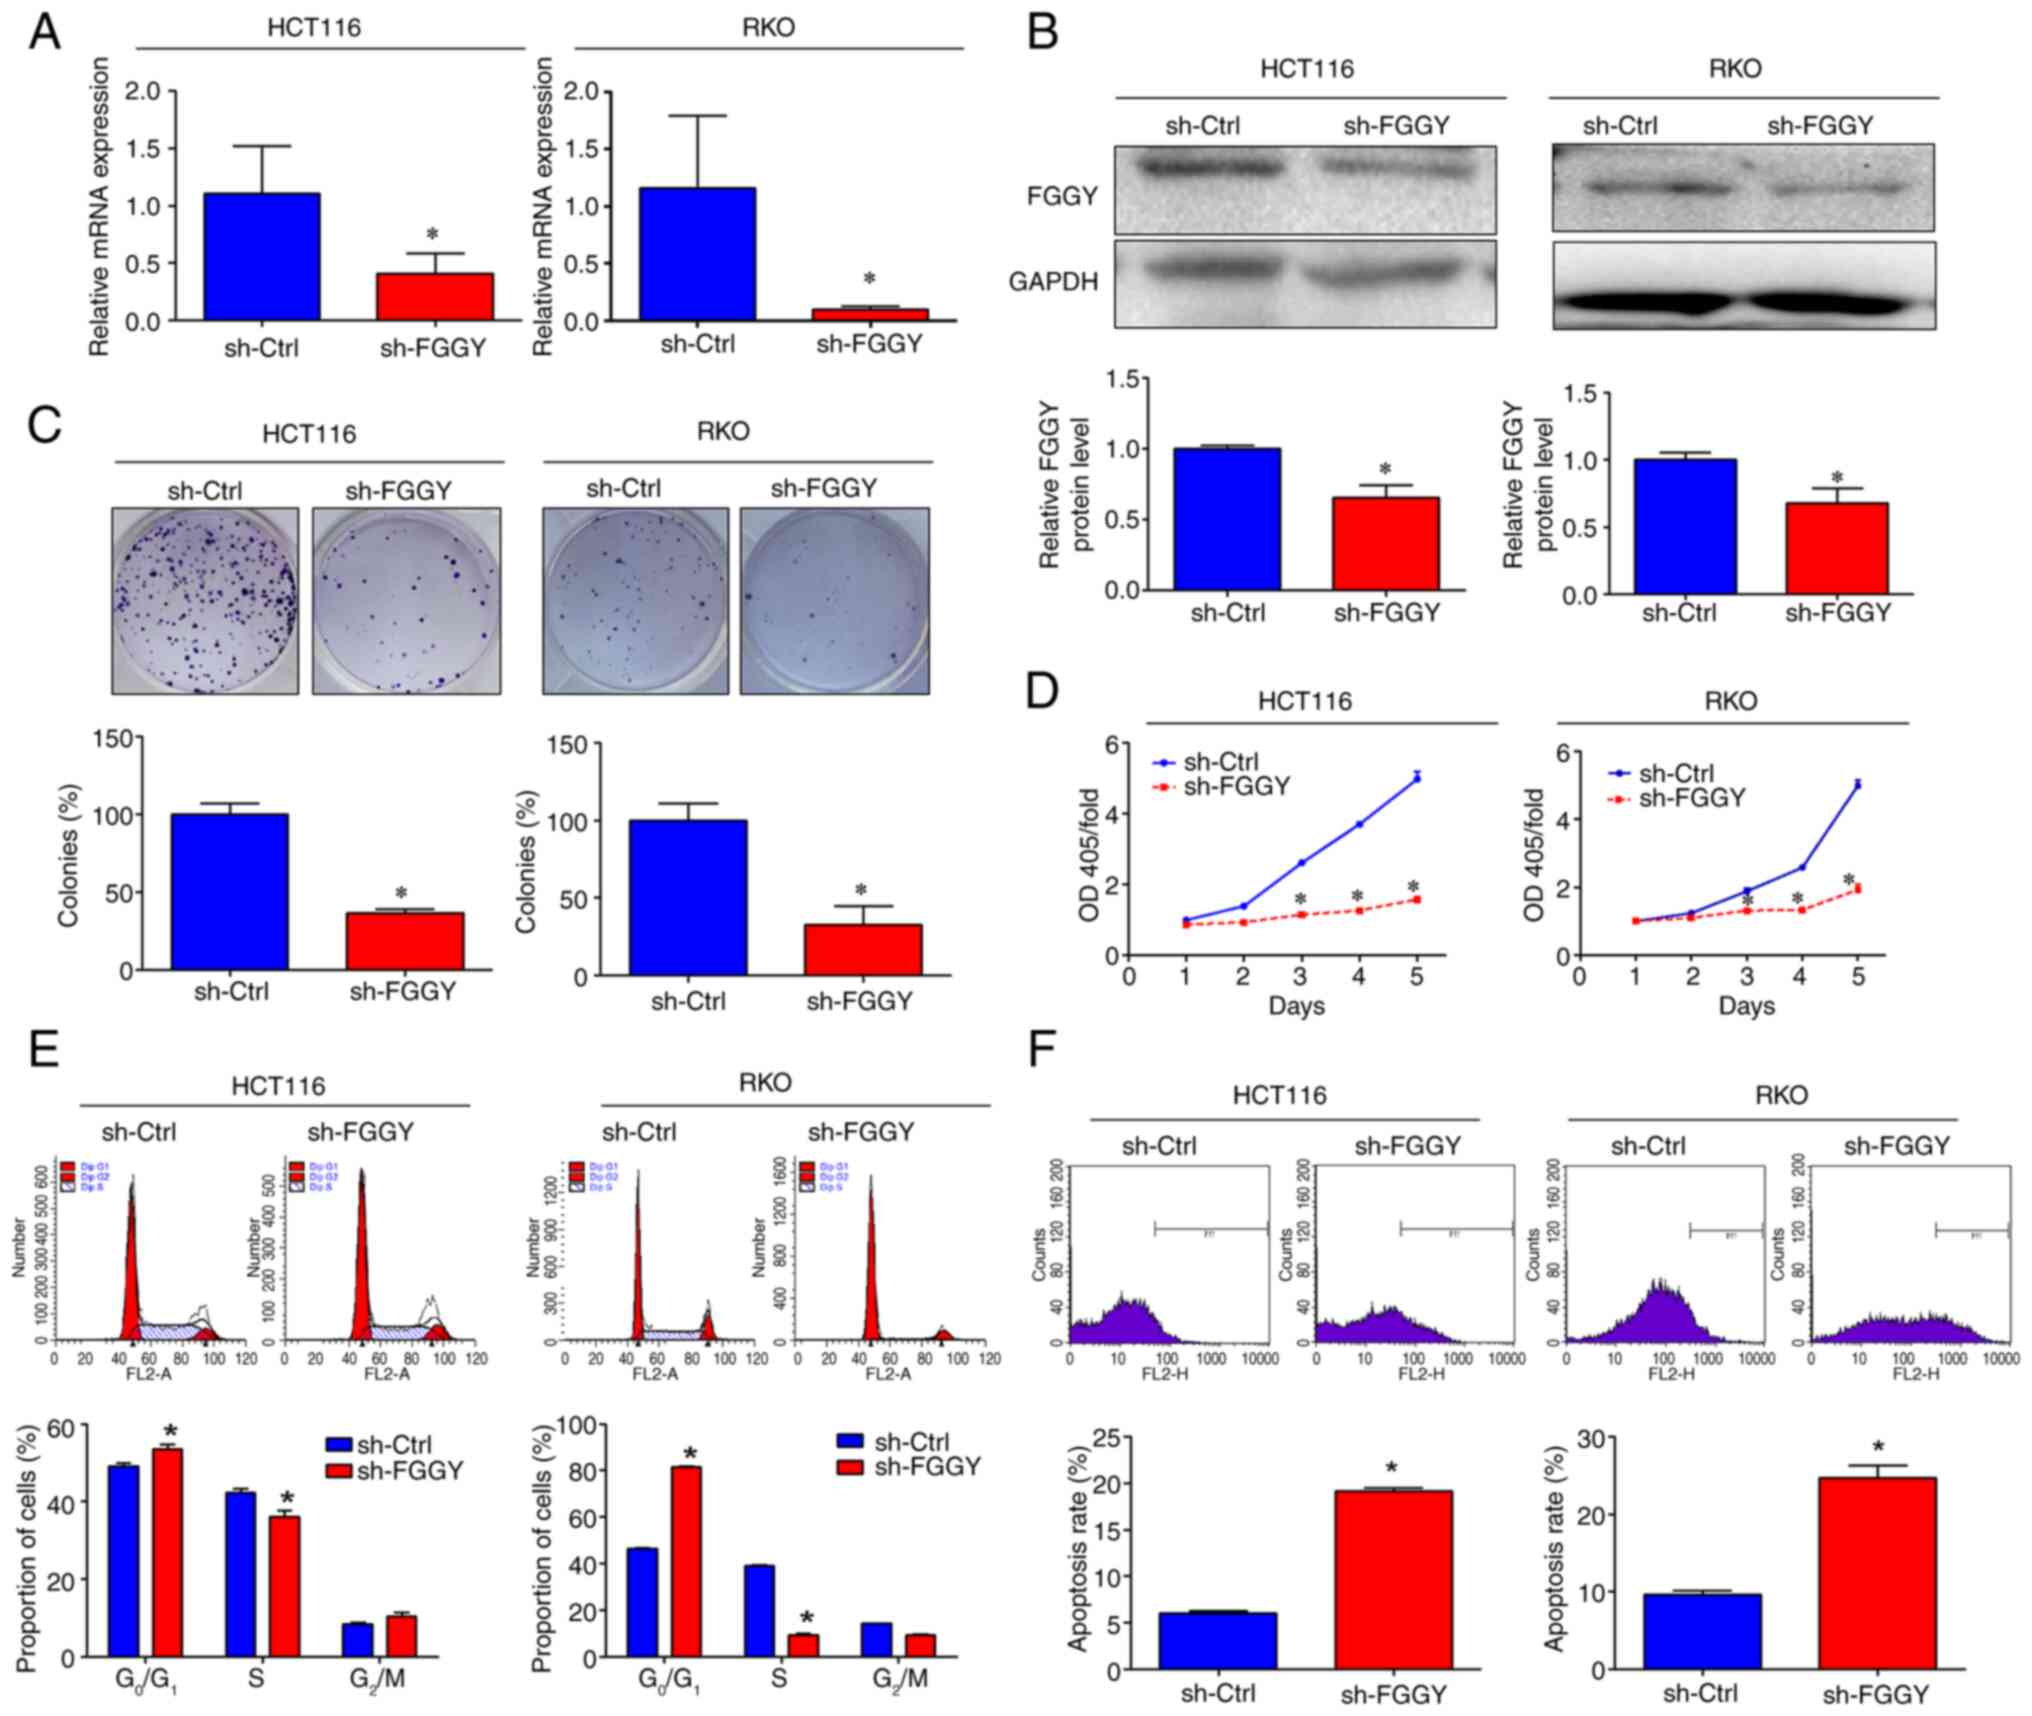
FGGY knockdown inhibits cell viability
and induces cell apoptosis in vitro
Given that the endogenous expression levels of FGGY
were relatively high in HCT116 and RKO cells, but low in HT-29
cells (Fig. S1A), the present
study chose to knock down FGGY in HCT116 and RKO cells, and to
overexpress FGGY in HT-29 cells. To investigate the role of FGGY in
CRC cell viability, three distinct shRNAs specifically targeting
FGGY were utilized, which were encoded into lentiviruses for cell
transduction. Compared with in the sh-Ctrl group, transducing
HCT116 cells with these shRNAs significantly reduced FGGY
expression at both the mRNA and protein levels (Fig. S1B and C), and decreased cell
viability (Fig. S1D). Since all
three shRNAs exhibited a comparable effect on FGGY expression and
cell viability, further experiments were conducted with a single
construct, designated as sh-FGGY (specifically, sh-FGGY-1). RT-qPCR
and western blot analysis confirmed a substantial decrease in FGGY
expression at both the mRNA and protein levels in HCT116 and RKO
cells after transduction with sh-FGGY (Fig. 3A and B). Additionally, FGGY
knockdown significantly reduced the number of colonies formed and
cell viability (Fig. 3C and D).
Furthermore, FGGY knockdown resulted in an increased proportion of
cells at the G0/G1 phase and a decreased
proportion of cells at the S phase in both HCT116 and RKO cells
(Fig. 3E). Moreover, Annexin V
staining and subsequent flow cytometric analysis revealed that FGGY
knockdown significantly elevated the percentage of early apoptotic
cells (Fig. 3F). Additionally,
FGGY knockdown increased the expression levels of the pro-apoptotic
protein Bax and decreased the expression levels of anti-apoptotic
Bcl-2 in HCT116 cells (Fig.
S2). By contrast, HT-29 cells transduced with lentiviral
vectors designed to overexpress FGGY exhibited elevated FGGY
protein expression and increased cell viability (Fig. S3A and B).
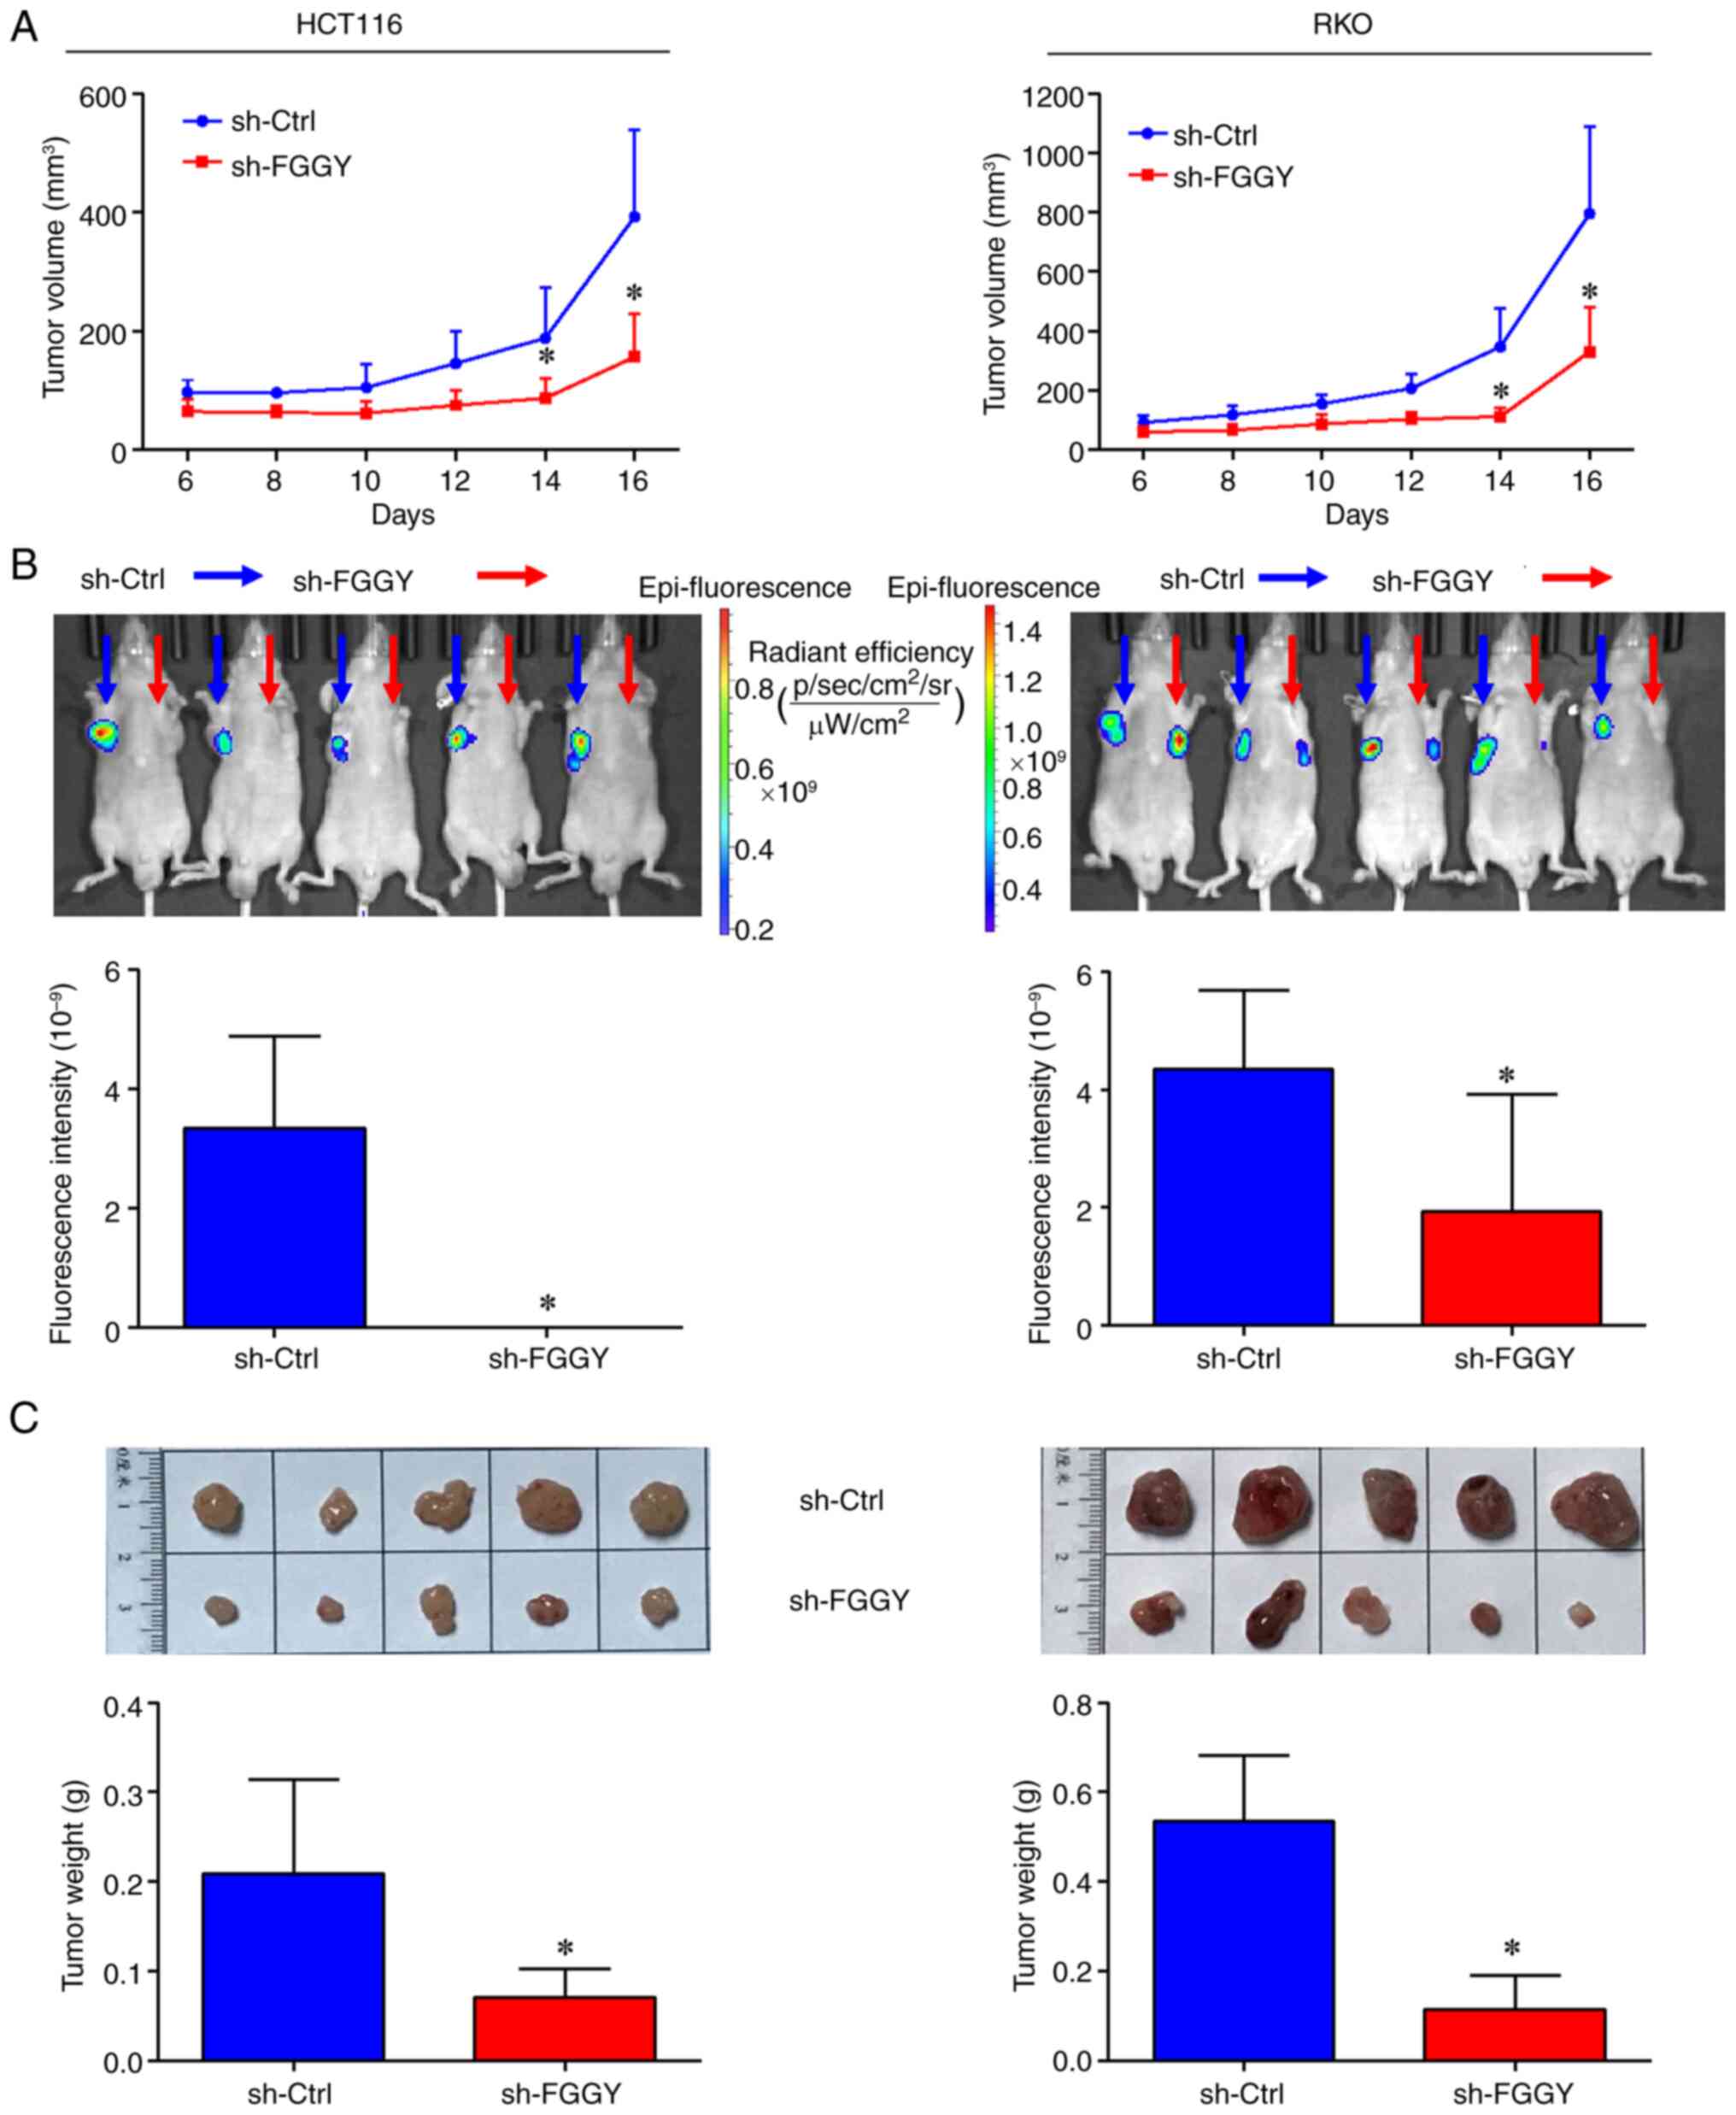
FGGY knockdown suppresses CRC tumor
growth in vivo
Analysis of tumor growth in vivo using a
xenograft mouse model revealed that, compared with in the sh-Ctrl
group, FGGY knockdown significantly inhibited CRC tumor growth in
nude mice, as indicated by a marked reduction in tumor volume
(Fig. 4A), fluorescence
intensity of tumor cells (Fig.
4B) and tumor weight (Fig.
4C). By contrast, overexpression of FGGY significantly promoted
CRC tumor growth in nude mice, as evidenced by an increase in tumor
volume (Fig. S3C), fluorescence
intensity of tumor cells (Fig.
S3D) and tumor weight (Fig.
S3E) in nude mice.
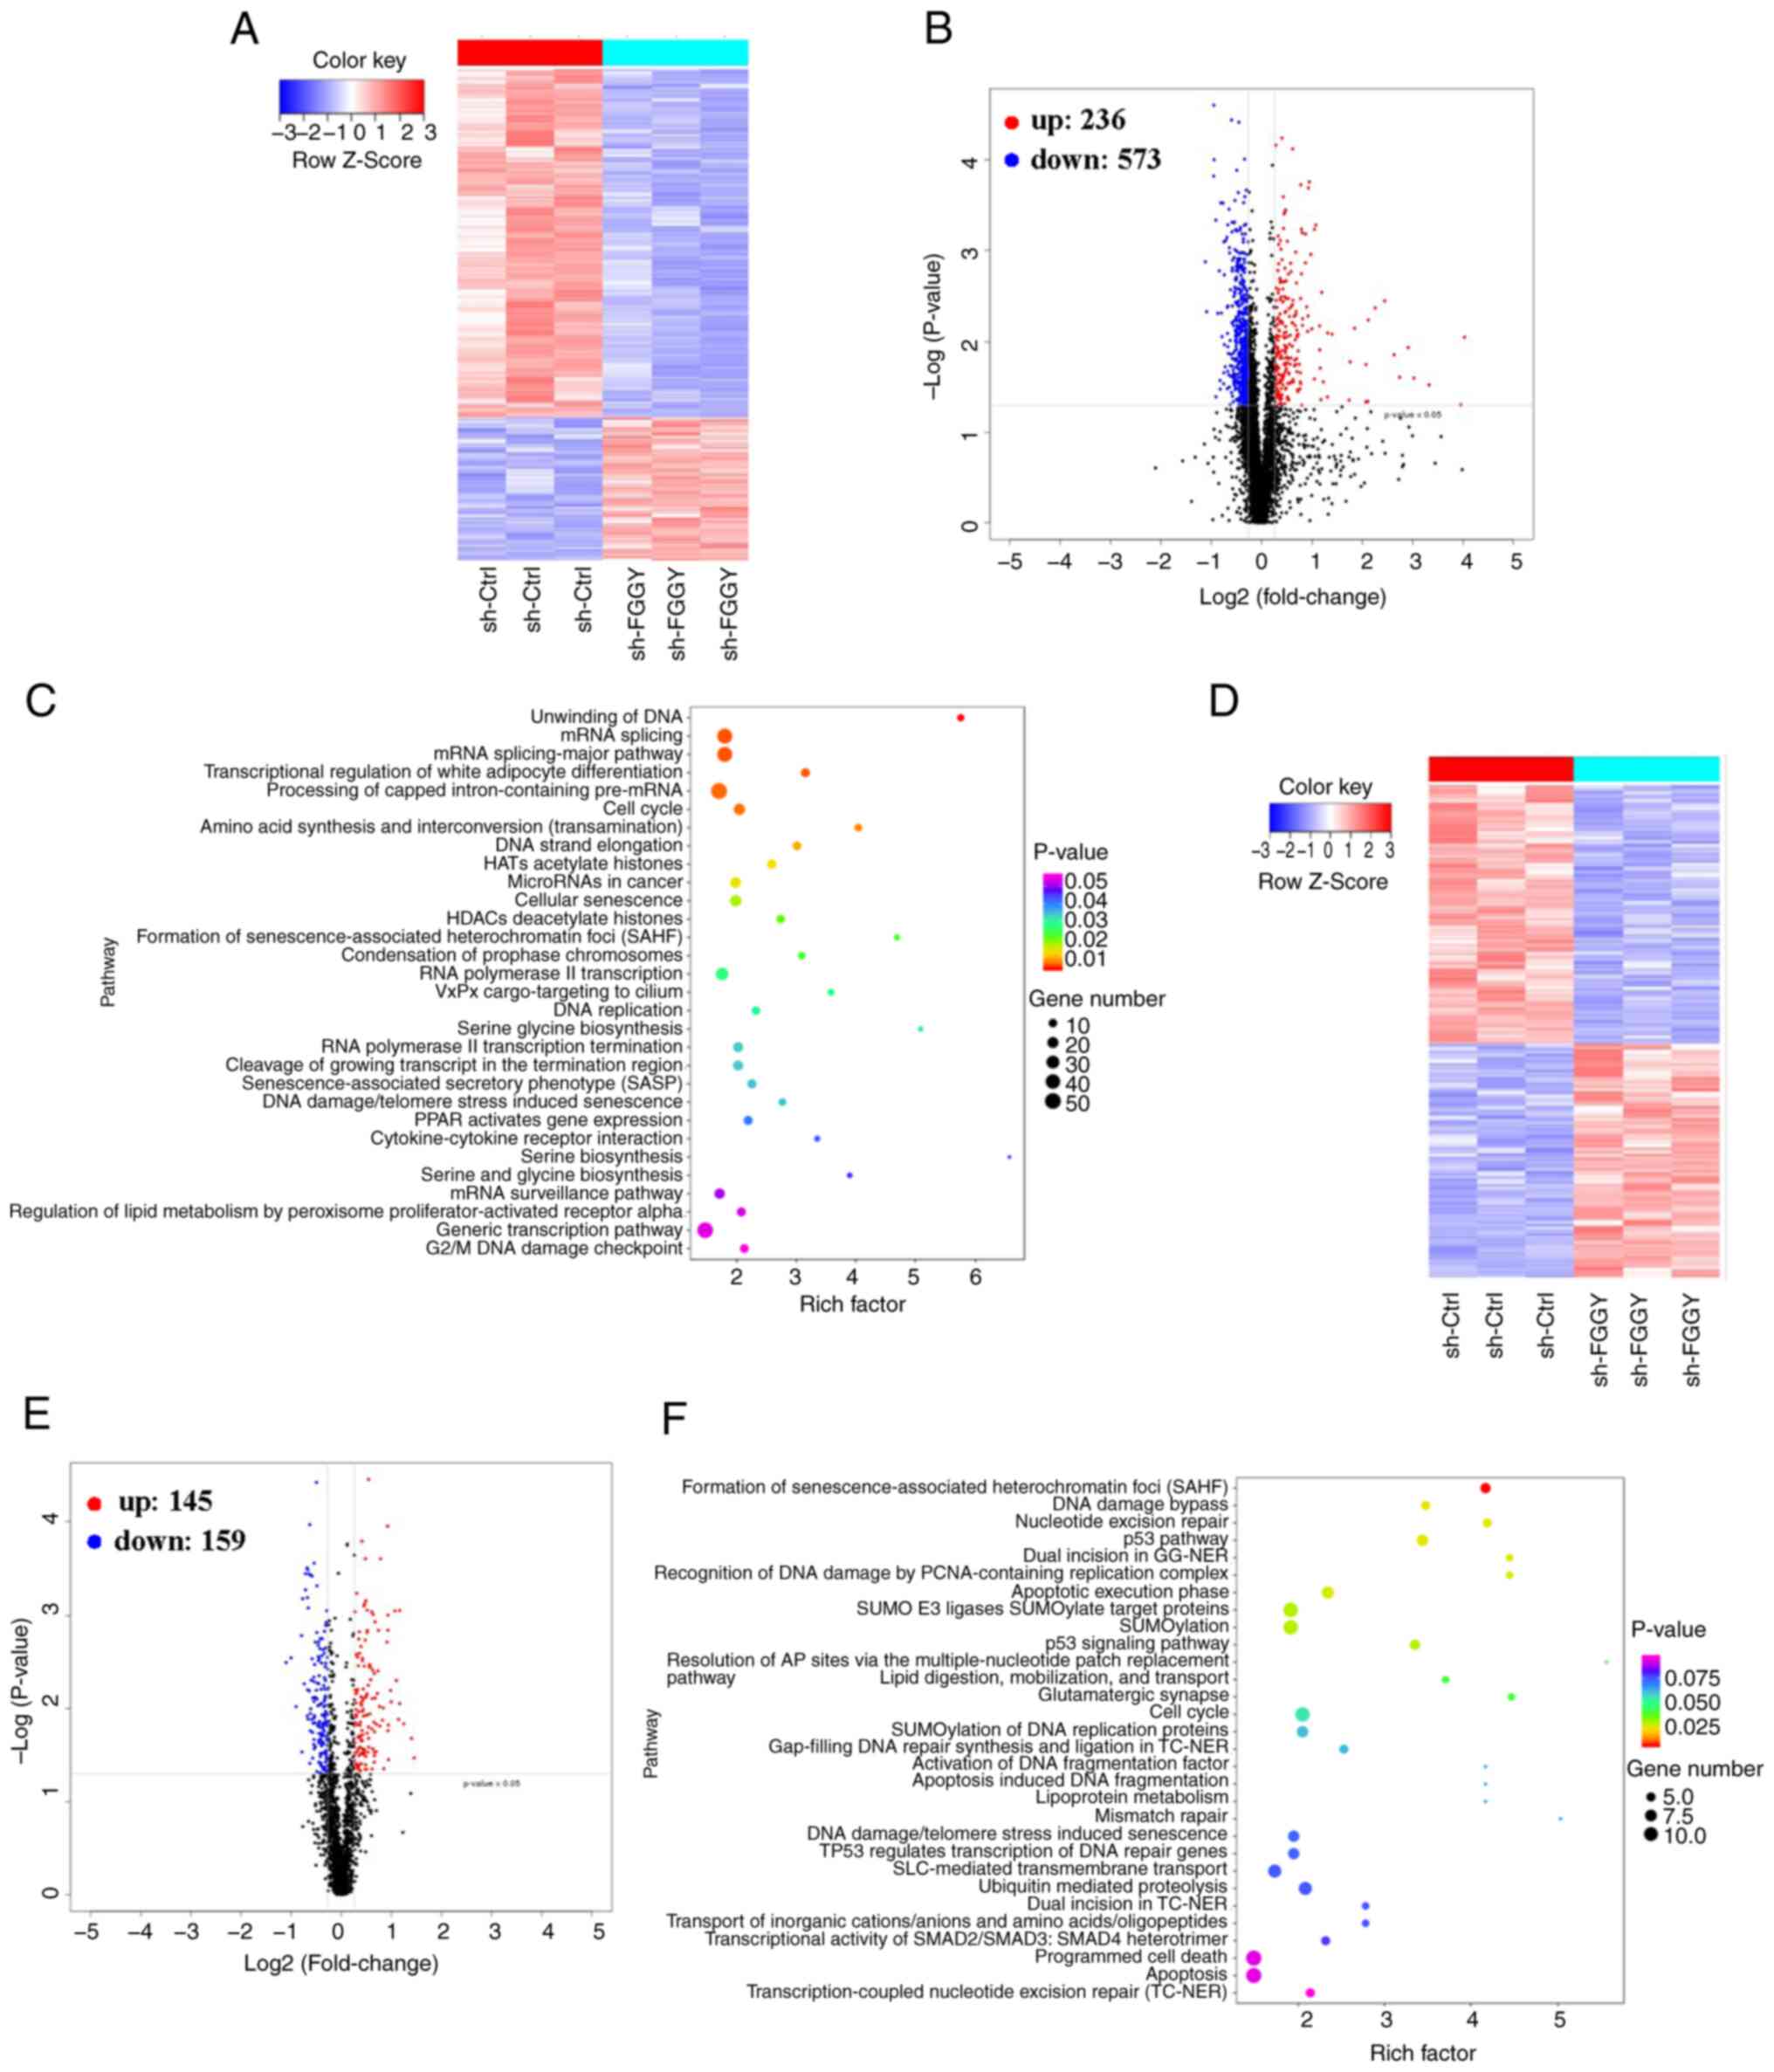
FGGY knockdown in CRC cells modulates the
expression of multiple proteins/phosphopeptides and enriches
multiple pathways
To further explore the possible mechanisms by which
FGGY knockdown inhibits tumor growth in CRC, iTRAQ and
phosphoproteomics analyses were employed to identify DEPs in HCT116
cells after FGGY knockdown. As shown in Fig. 5, a total of 809 DEPs were
identified, which included 236 proteins with increased expression
and 573 with decreased expression (fold change >1.2, P<0.05)
using iTRAQ methodology (Fig. 5A and
B; Tables SV and SVI). Additionally, phosphoproteomics
analysis identified 304 differentially expressed phosphopeptides,
comprising 145 upregulated and 159 downregulated phosphopeptides
(fold change >1.2, P<0.05) (Fig. 5D and E; Tables SVII and SVIII). The KEGG pathway enrichment
analysis revealed that these proteins and phosphopeptides were
enriched in various signaling pathways (Fig. 5C and F; Tables SIX and SX). KEGG analysis of iTRAQ revealed
enrichment in both the 'Formation of senescence-associated
heterochromatin foci (SAHF)' and the 'Senescence-associated
secretory phenotype (SASP)' (Fig.
5C). These findings suggested that cellular senescence may
serve a significant role in the effects of FGGY knockdown.
Additionally, KEGG analysis of phosphoproteomics analysis revealed
enrichment in both the 'p53 pathway' and 'p53 signaling pathway'
(Fig. 5F). Given the
well-established link between cellular senescence and the p53
pathway, the present study further investigated these two
processes. Both cellular senescence and the p53 pathway are known
to regulate cell death and tumor suppression, indicating that FGGY
may modulate the p53 signaling pathway and influence cell
senescence.
FGGY knockdown promotes CRC cell
senescence through the p53/p21 pathway
The present study aimed to elucidate how FGGY
knockdown regulates cell senescence and the p53 pathway in CRC.
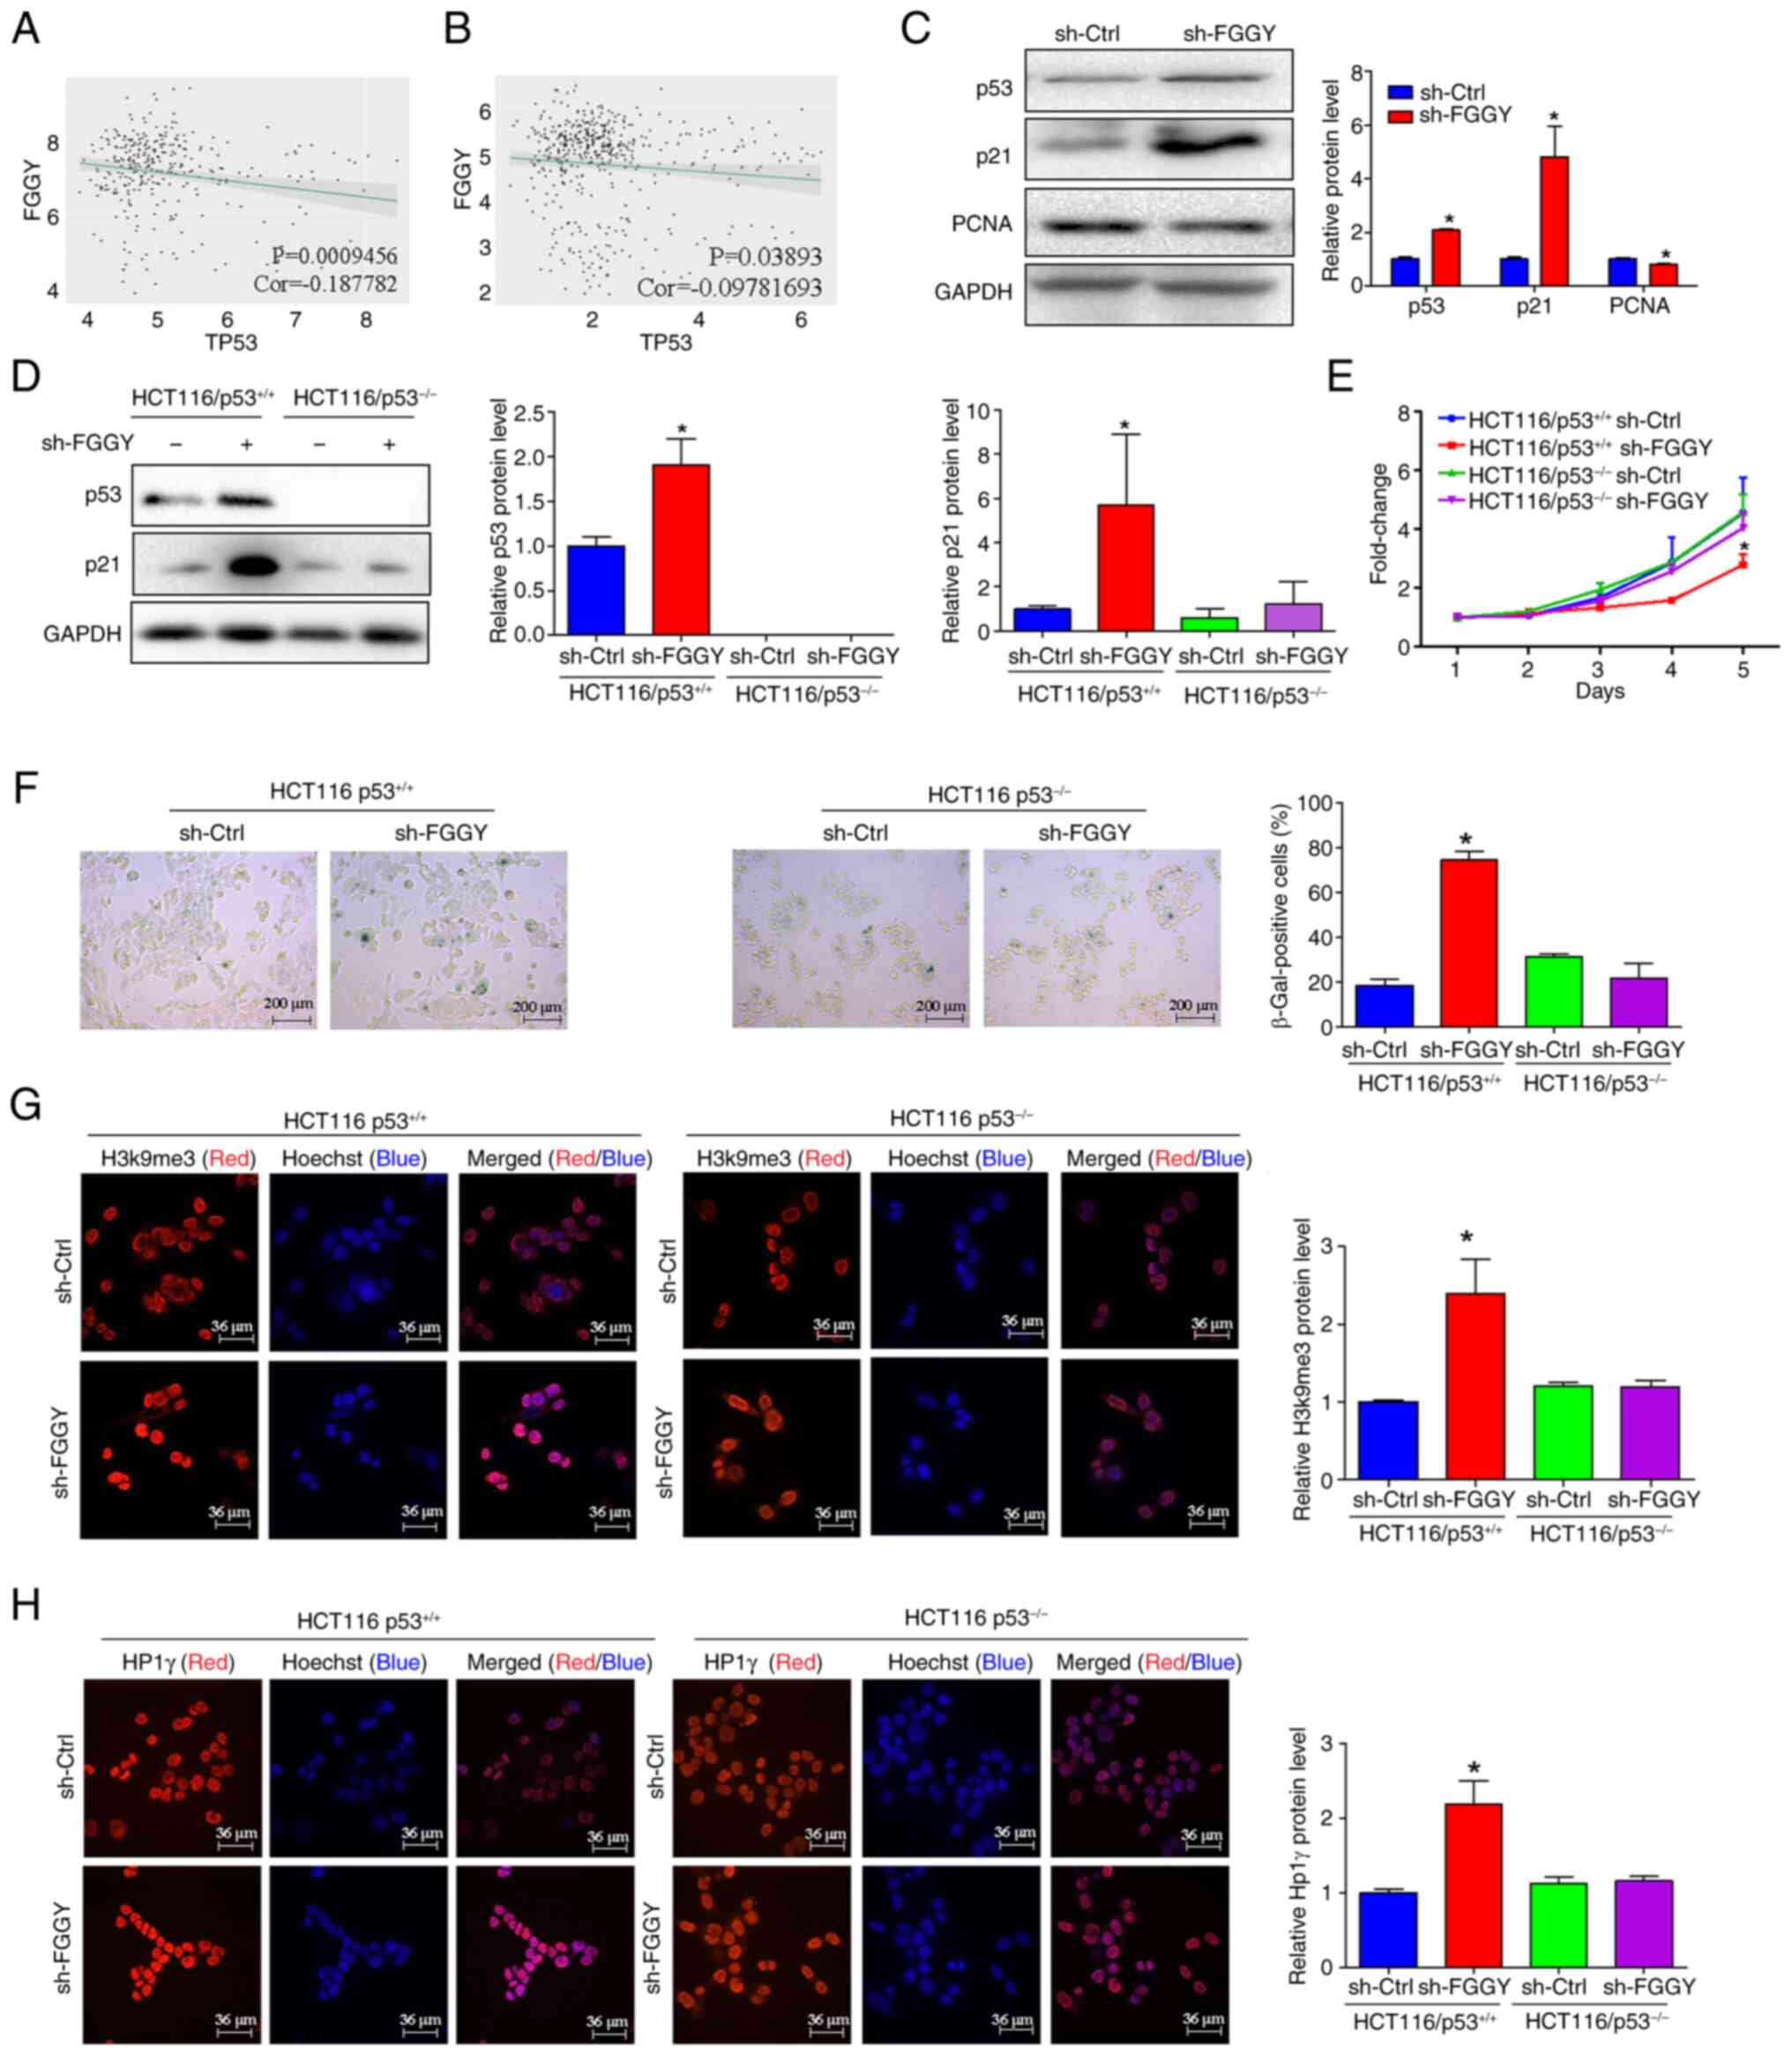
Correlation analysis of microarray expression data from the GEO and
TCGA databases revealed that a weak negative correlation existed
between FGGY and p53 expression (Fig. 6A and B). Compared with in the
control group, FGGY knockdown led to an increase in the protein
expression levels of p53 and p21, while the expression levels of
PCNA were decreased (Fig. 6C).
Notably, when comparing the two cell lines, the inhibitory effects
of FGGY knockdown on the viability of HCT116/p53+/+
cells were attenuated in HCT116/p53−/− cells (Fig. 6D and E). By contrast, HT-29 cells
transduced with lentiviral vectors designed to overexpress FGGY
exhibited decreased p53 and p21 protein expression compared with
that in cells transduced with control vectors (Fig. S3F).
Cellular senescence is characterized by increased
SA-β-gal activity, reduced cell proliferation, cell cycle arrest
and the formation of SAHF (29-31). To further investigate the
potential regulatory effects of FGGY on senescence, a SA-β-gal
activity assay was conducted in both HCT116/p53+/+ and
HCT116/p53−/− cells. The results revealed that β-gal
activity was significantly increased after FGGY knockdown in
HCT116/p53+/+ cells, but β-gal activity remained
unchanged after FGGY knockdown in HCT116/p53−/− cells
(Fig. 6F). Conversely, β-gal
activity was decreased in HT-29 cells after FGGY overexpression
(Fig. S3G). Moreover, FGGY
knockdown significantly upregulated the expression of cell
senescence markers HP1γ and H3k9me3m in HCT116/p53+/+
cells, whereas in HCT116/p53−/− cells, FGGY knockdown
did not affect the protein expression of cell senescence markers
HP1γ and H3K9me3 (Fig. 6G and
H).
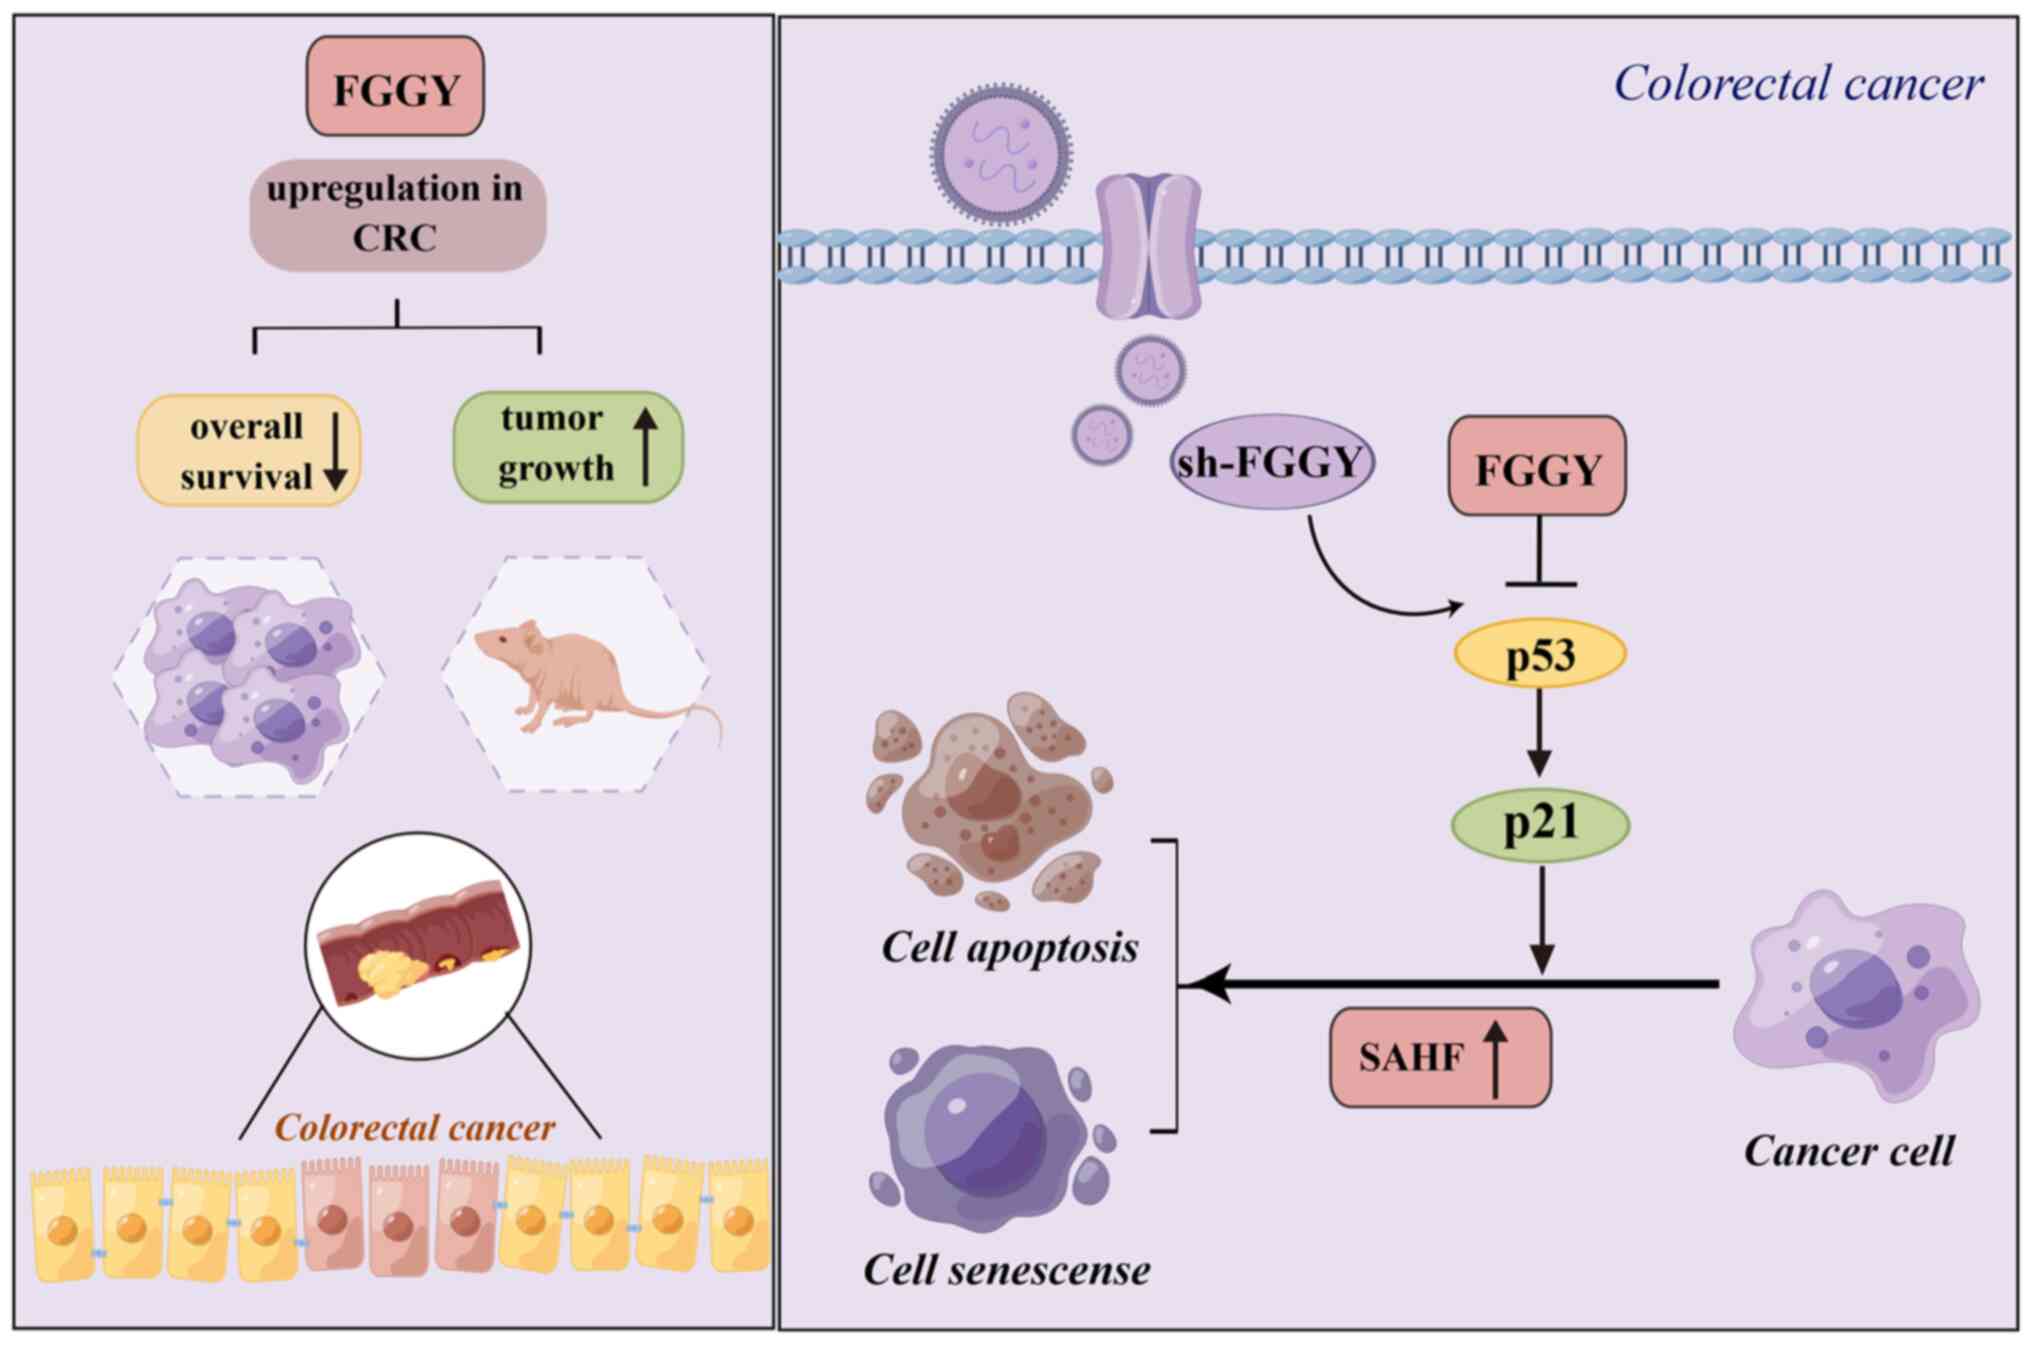
Discussion
In the present study, FGGY protein expression was
significantly upregulated in COAD and READ tissues compared with
that in normal tissues from healthy controls and adjacent
noncancerous tissues, and it was elevated in PAAD tissues compared
with that in normal tissues from healthy controls. However, there
were no significant differences in FGGY expression between tumor
and adjacent noncancerous tissues in ESCA, STAD and LIHC.
In addition, higher levels of FGGY in CRC tissues
were closely associated with advanced N stage, as well as shorter
overall survival of patients with CRC. These findings indicated
that FGGY may serve as a potential biomarker specific for CRC,
distinguishing it from other types of digestive system neoplasms.
Functional studies revealed that FGGY knockdown significantly
suppressed CRC growth by inhibiting cell viability and inducing
cell apoptosis through the modulation of multiple targets and
pathways. Notably, verification of the potential targets and
pathways revealed that FGGY knockdown triggered cell senescence
through activation of the p53/p21 signaling pathways, indicating a
promising direction for developing novel anti-CRC therapeutic
strategies.
FGGY is a gene that encodes a kinase from the FGGY
kinase family, which are recognized as phosphotransferases
(6). A previous study linked its
expression with an increased risk of sporadic amyotrophic lateral
sclerosis (8). To the best of
our knowledge, the present study is the first to reveal an
elevation in FGGY expression at both mRNA and protein levels in CRC
(including COAD and READ) tissues, compared with those in normal
tissues from healthy controls and adjacent noncancerous tissues,
which was associated with poorer prognosis and CRC progression.
Notably, analysis of TCGA data showed that FGGY expression levels
were not significantly different among normal tissues, adjacent
non-tumor tissues and tumor tissues in other digestive system
neoplasms (ESCA, STAD and LIHC), whereas its distinctive expression
pattern was only observed in CRC, suggesting its potential role as
a CRC-specific biomarker for early diagnosis and prognostic
evaluation. However, further validation using a TMA analysis with a
larger number of CRC samples is needed.
The evasion of apoptosis and uncontrolled cell
proliferation are well-recognized hallmarks of cancer, which
contribute to the disruption of cell homeostasis and an increase in
cell number, which are fundamental to tumor development (32,33). L1-FGGY had been shown to be
associated with increased cell proliferation and metabolic
dysregulation in LUSC (11). The
present findings revealed that knockdown of FGGY attenuated tumor
growth in vivo, and enhanced the apoptosis and inhibited the
viability of CRC cells in vitro. Given that cell cycle
dysregulation may contribute to the promotion of cell proliferation
(34), the present study further
investigated the impact of FGGY knockdown on cell cycle progression
and indicated that knockdown of FGGY induced cell cycle arrest at
the G0/G1 phase in CRC cells. These results
suggested that the inhibitory effect of FGGY knockdown on CRC tumor
growth may be mediated through inhibiting cell proliferation and
inducing cell apoptosis. However, to better understand the role of
FGGY in CRC, the effect of FGGY overexpression on cell cycle
arrest, apoptosis and colony formation needs to be
investigated.
The prospect of FGGY serving as a therapeutic target
encouraged an in-depth exploration of its potential mechanism on
the growth of CRC cells. Proteomics analysis utilizing iTRAQ
identified 236 upregulated and 573 downregulated proteins in CRC
cells after FGGY knockdown, whereas the phosphoproteomics analysis
identified 145 upregulated and 159 downregulated phosphopeptides.
These changes coincided with the modulation of several enriched
signaling pathways critical to CRC, including the p53 pathway, SAHF
and cellular senescence. These pathways are known to serve
essential roles in the development of CRC, thus further implying
the potential impact of targeting FGGY in CRC treatment strategies
(35,36).
Cellular senescence is a life-threatening process,
characterized by a progressive decline in cell proliferation,
differentiation and physiological function, thereby resulting in
irreversible cell cycle arrest (37). Furthermore, a disruption in this
process can result in increased proliferation and progression of
tumor cells (34). In light of
this, the present study investigated the effects of FGGY on
cellular senescence. It was revealed that knockdown of FGGY in CRC
cells increased SA-β-gal activity, and the level of SAHF markers
HP1γ and H3k9me3 in the nucleus. These findings further implied the
essential role of FGGY in regulating cellular senescence and
suggested that it may be a promising new target for anticancer
therapy.
The p53 protein, known for its tumor-suppressing
properties, serves a crucial role in inhibiting cellular
proliferation by promoting cell cycle arrest and programmed cell
death (38). The p53 pathway is
a classical pathway regulating cell senescence (39). As a significantly enriched
pathway in the present study, it may be one of potential underlying
mechanisms by which FGGY mediates cellular senescence. Thus,
restoring p53 function could be considered an effective approach to
treat CRC (34,40).
Consistent with this notion, the current study
demonstrated that FGGY knockdown resulted in an upregulation of p53
and p21 proteins, while it concurrently led to a downregulation of
PCNA expression. These findings contributed insight into the
regulatory effects of FGGY on p53, and indicated that p53 knockout
abolished the suppressive effect of FGGY knockdown on the viability
of HCT116 cells. It may thus be suggested that inhibition of tumor
growth and induction of cell senescence by FGGY knockdown partly
depends on p53 activation. In the present study, the very weak
negative correlation between FGGY and TP53 was determined using the
Pearson correlation coefficient by analyzing the gene expression
data from the GEO (GSE39582) and TCGA databases. While these
findings could be validated through colorectal TMA analysis, the
present study did not assess the protein expression of TP53 and
FGGY in TMAs nor analyze their correlation at the protein level in
this study. This limitation will be addressed in future research.
Additionally, the precise mechanism by which FGGY knockdown
activates the p53 pathway require further investigation, including
the detection of p53/21 levels and assessment of cellular
senescence in FGGY-overexpressing cells.
In the present study, the IVIS Spectrum live-animal
imaging system was employed to assess the effect of FGGY knockdown
and overexpression on CRC tumor growth in a xenograft mouse model.
Due to logistical constraints, fluorescence images of cells
inoculated at different time points (0, 1 and 6 days), which would
have facilitated longitudinal studies, were not captured. Despite
this limitation, the present results clearly demonstrated that FGGY
knockdown can suppress CRC tumor growth in vivo.
In conclusion, to the best of our knowledge, the
present study is the first to reveal that FGGY is abnormally
upregulated in CRC tissues, is associated with a poor prognosis and
serves an essential role in tumor growth. Notably, the effects of
FGGY on inducing cell senescence by partly activating the p53/p21
pathway may be one of underlying mechanisms (Fig. 7). Therefore, FGGY may serve as a
promising prognostic biomarker and a potential target for
chemotherapy in CRC treatment. The present findings propose novel
insights into the mechanism of action of FGGY in CRC.
Supplementary Data
Availability of data and materials
The proteomics data generated in the present study
may be found in the ProteomeXchange Consortium under accession
number PXD059574 or at the following URL: http://proteomecentral.proteomexchange.org/cgi/GetDataset?ID=PXD059574
and its mirror repository Integrated Proteome Resources (iProX)
under accession number IPX0010788000 or at the following URL:
https://www.iprox.cn/page/project.html?id=IPX0010788000).
All other data presented in this study are available from the
corresponding author upon reasonable request.
Authors' contributions
LYL, LL and ALS contributed to the conceptualization
and design of the study. LYL provided administrative support and
study conception. YQC contributed to study design and data
interpretation, in addition to administrative support. MZW and YC
provided study materials or patients, and collected and analyzed
clinical data. SJL and XRZ were responsible for conducting the
experiments. Data collection and assembly were carried out by QRX
and LJC. Data analysis and interpretation were performed by LHW,
YF, TJS and AJ. LYL, LL and ALS confirm the authenticity of all the
raw data. The manuscript was collaboratively written by all
authors, who read and approved the final version of the
manuscript.
Ethics approval and consent to
participate
Ethics approval for the animal experiments was
obtained from the Committee of Fujian University of Traditional
Chinese Medicine (approval no. FJTCM IACUC 2019052). Ethics
approval for the use of TMAs was granted by the Clinical Research
Ethics Committee in Outdo Biotech (nos. SHYJS-CP-1810005,
SHYJS-CP-1904003 and SHYJS-CP-1901007) The TMAs used in the present
study were commercially available products (Shanghai Outdo Biotech
Co., Ltd.), and the requirement for additional ethics approval was
waived by the institutional ethics committee due to the commercial
nature of the samples and absence of personal information.
Patient consent for publication
Not applicable.
Competing interests
The authors declare that they have no competing
interests.
Acknowledgements
Not applicable.
Funding
This research received funding from the Natural Science
Foundation of Fujian Province (grant no. 2022J011002), the National
Natural Science Foundation of China (grant nos. 82274148 and
82274188), the China Postdoctoral Science Foundation (grant no.
2023M740637), and the Fujian Provincial Health Science and
Technology Program (grant no. 2024GGA083).
References
|
1
|
Sung H, Ferlay J, Siegel RL, Laversanne M,
Soerjomataram I, Jemal A and Bray F: Cancer statistics 2020:
GLOBOCAN estimates of incidence and mortality worldwide for 36
cancers in 185 countries. CA Cancer J Clin. 71:209–249. 2021.
View Article : Google Scholar : PubMed/NCBI
|
|
2
|
Siegel RL, Miller KD, Wagle NS and Jemal
A: Cancer statistics, 2023. CA cancer J Clin. 73:17–48. 2023.
View Article : Google Scholar : PubMed/NCBI
|
|
3
|
Ladabaum U, Dominitz JA, Kahi C and Schoen
RE: Strategies for colorectal cancer screening. Gastroenterology.
158:418–432. 2020. View Article : Google Scholar
|
|
4
|
Kanth P and Inadomi JM: Screening and
prevention of colorectal cancer. BMJ. 374:n18552021. View Article : Google Scholar : PubMed/NCBI
|
|
5
|
Shen A, Chen Y, Liu L, Huang Y, Chen H, Qi
F, Lin J, Shen Z, Wu X, Wu M, et al: EBF1-mediated upregulation of
ribosome assembly factor PNO1 contributes to cancer progression by
negatively regulating the p53 signaling pathway. Cancer Res.
79:2257–2270. 2019. View Article : Google Scholar : PubMed/NCBI
|
|
6
|
Zhang Y, Zagnitko O, Rodionova I, Osterman
A and Godzik A: The FGGY carbohydrate kinase family: Insights into
the evolution of functional specificities. PLoS Comput Biol.
7:e10023182011. View Article : Google Scholar
|
|
7
|
Omelchenko MV, Makarova KS, Wolf YI,
Rogozin IB and Koonin EV: Non-homologous isofunctional enzymes: A
systematic analysis of alternative solutions in enzyme evolution.
Biol Direct. 5:312010. View Article : Google Scholar : PubMed/NCBI
|
|
8
|
Daoud H, Valdmanis PN, Dion PA and Rouleau
GA: Analysis of DPP6 and FGGY as candidate genes for amyotrophic
lateral sclerosis. Amyotroph Lateral Scler. 11:389–391. 2010.
View Article : Google Scholar
|
|
9
|
Van Es MA, Van Vught PW, Veldink JH,
Andersen PM, Birve A, Lemmens R, Cronin S, Van Der Kooi AJ, De
Visser M, Schelhaas HJ, et al: Analysis of FGGY as a risk factor
for sporadic amyotrophic lateral sclerosis. Amyotroph Lateral
Scler. 10:441–447. 2009. View Article : Google Scholar : PubMed/NCBI
|
|
10
|
Taylor JA, Shioda K, Mitsunaga S, Yawata
S, Angle BM, Nagel SC, Vom Saal FS and Shioda T: Prenatal exposure
to bisphenol a disrupts naturally occurring bimodal dna methylation
at proximal promoter of fggy, an obesity-relevant gene encoding a
carbohydrate kinase, in gonadal white adipose tissues of cd-1 mice.
Endocrinology. 159:779–794. 2018. View Article : Google Scholar :
|
|
11
|
Zhang R, Zhang F, Sun Z, Liu P, Zhang X,
Ye Y, Cai B, Walsh MJ, Ren X, Hao X, et al: LINE-1
retrotransposition promotes the development and progression of lung
squamous cell carcinoma by disrupting the tumor-suppressor gene
fggy. Cancer Res. 79:4453–4465. 2019.PubMed/NCBI
|
|
12
|
Sun Z, Zhang R, Zhang X, Sun Y, Liu P,
Francoeur N, Han L, Lam WY, Yi Z, Sebra R, et al: LINE-1 promotes
tumorigenicity and exacerbates tumor progression via stimulating
metabolism reprogramming in non-small cell lung cancer. Mol Cancer.
21:1472022.PubMed/NCBI
|
|
13
|
Skrzypczak M, Goryca K, Rubel T, Paziewska
A, Mikula M, Jarosz D, Pachlewski J, Oledzki J and Ostrowski J:
Modeling oncogenic signaling in colon tumors by multidirectional
analyses of microarray data directed for maximization of analytical
reliability. PLoS One. 5:e130912010.PubMed/NCBI
|
|
14
|
Tomczak K, Czerwińska P and Wiznerowicz M:
The cancer genome atlas (TCGA): An immeasurable source of
knowledge. Contemp Oncol (Pozn). 19:A68–A77. 2015.PubMed/NCBI
|
|
15
|
Marisa L, de Reyniès A, Duval A, Selves J,
Gaub MP, Vescovo L, Etienne-Grimaldi MC, Schiappa R, Guenot D,
Ayadi M, et al: Gene expression classification of colon cancer into
molecular subtypes: Characterization, validation, and prognostic
value. PLoS Med. 10:e10014532013.PubMed/NCBI
|
|
16
|
Li C, Tang Z, Zhang W, Ye Z and Liu F:
GEPIA2021: integrating multiple deconvolution-based analysis into
GEPIA. Nucleic Acids Res. 49:W242–W246. 2021.PubMed/NCBI
|
|
17
|
Rao X, Huang X, Zhou Z and Lin X: An
improvement of the 2ˆ(-delta delta CT) method for quantitative
real-time polymerase chain reaction data analysis. Biostat
Bioinforma Biomath. 3:71–85. 2013.PubMed/NCBI
|
|
18
|
Shen A, Liu L, Chen H, Qi F, Huang Y, Lin
J, Sferra TJ, Sankararaman S, Wei L, Chu J, et al: Cell division
cycle associated 5 promotes colorectal cancer progression by
activating the ERK signaling pathway. Oncogenesis.
8:192019.PubMed/NCBI
|
|
19
|
Hubrecht RC and Carter E: The 3Rs and
humane experimental technique: Implementing change. Animals
(Basel). 9:7542019.PubMed/NCBI
|
|
20
|
Calderón-González KG, Valero Rustarazo ML,
Labra-Barrios ML, Bazán-Méndez CI, Tavera-Tapia A, Herrera-Aguirre
ME, Sánchez del Pino MM, Gallegos-Pérez JL, González-Márquez H,
Hernández-Hernández JM, et al: Determination of the protein
expression profiles of breast cancer cell lines by quantitative
proteomics using iTRAQ labelling and tandem mass spectrometry. J
Proteomics. 124:50–78. 2015.PubMed/NCBI
|
|
21
|
Ma YT, Xiao Q, Xu X, Shao and Wang H:
iTRAQ-based quantitative analysis of cancer-derived secretory
proteome reveals TPM2 as a potential diagnostic biomarker of
colorectal cancer. Front Med. 10:278–285. 2016.PubMed/NCBI
|
|
22
|
Kanehisa M and Goto S: KEGG: Kyoto
encyclopedia of genes and genomes. Nucleic Acids Res. 28:27–30.
2000.
|
|
23
|
Milacic M, Beavers D, Conley P, Gong C,
Gillespie M, Griss J, Haw R, Jassal B, Matthews L, May B, et al:
The reactome pathway knowledgebase 2024. Nucleic Acids Res.
52:D672–D678. 2024.
|
|
24
|
Mi H and Thomas P: PANTHER pathway: An
ontology-based pathway database coupled with data analysis tools.
Methods Mol Biol. 563:123–140. 2009.PubMed/NCBI
|
|
25
|
Li F, Zhao D, Yang S, Wang J, Li Q, Jin X
and Wang W: ITRAQ-based proteomics analysis of triptolide on human
A549 lung adenocarcinoma cells. Cell Physiol Biochem. 45:917–934.
2018.PubMed/NCBI
|
|
26
|
Kanehisa M, Furumichi M, Tanabe M, Sato Y
and Morishima K: KEGG: New perspectives on genomes, pathways,
diseases and drugs. Nucleic Acids Res. 45:D353–D361. 2017.
|
|
27
|
Kulak NA, Pichler G, Paron I, Nagaraj N
and Mann M: Minimal, encapsulated proteomic-sample processing
applied to copy-number estimation in eukaryotic cells. Nat Methods.
11:319–324. 2014.PubMed/NCBI
|
|
28
|
Humphrey SJ, Azimifar SB and Mann M:
High-throughput phosphoproteomics reveals in vivo insulin signaling
dynamics. Nat Biotechnol. 33:990–995. 2015.PubMed/NCBI
|
|
29
|
Collado M, Blasco MA and Serrano M:
Cellular senescence in cancer and aging. Cell. 130:223–233.
2007.PubMed/NCBI
|
|
30
|
Kurz DJ, Decary S, Hong Y and Erusalimsky
JD: Senescence-associated (beta)-galactosidase reflects an increase
in lysosomal mass during replicative ageing of human endothelial
cells. J Cell Sci. 113:3613–3622. 2000.PubMed/NCBI
|
|
31
|
Bannister AJ, Zegerman P, Partridge JF,
Miska EA, Thomas JO, Allshire RC and Kouzarides T: Selective
recognition of methylated lysine 9 on histone H3 by the HP1 chromo
domain. Nature. 410:120–124. 2001. View Article : Google Scholar : PubMed/NCBI
|
|
32
|
Hanahan D and Weinberg RA: Hallmarks of
cancer: The next generation. Cell. 144:646–674. 2011. View Article : Google Scholar : PubMed/NCBI
|
|
33
|
Hanahan D and Weinberg RA: The hallmarks
of cancer. Cell. 100:57–70. 2000. View Article : Google Scholar : PubMed/NCBI
|
|
34
|
Kramer HB, Lai CF, Patel H, Periyasamy M,
Lin ML, Feller SM, Fuller-Pace FV, Meek DW, Ali S and Buluwela L:
LRH-1 drives colon cancer cell growth by repressing the expression
of the CDKN1A gene in a p53-dependent manner. Nucleic Acids Res.
44:582–594. 2016. View Article : Google Scholar :
|
|
35
|
Wang G, Fu Y, Hu F, Lan J, Xu F, Yang X,
Luo X, Wang J and Hu J: Loss of BRG1 induces CRC cell senescence by
regulating p53/p21 pathway. Cell Death Dis. 8:e26072017. View Article : Google Scholar : PubMed/NCBI
|
|
36
|
Shen A, Wu M, Liu L, Chen Y, Chen X,
Zhuang M, Xie Q, Cheng Y, Li J, Shen Z, et al: Targeting NUFIP1
suppresses growth and induces senescence of colorectal cancer
cells. Front Oncol. 11:6814252021. View Article : Google Scholar : PubMed/NCBI
|
|
37
|
Ohtani N, Mann DJ and Hara E: Cellular
senescence: Its role in tumor suppression and aging. Cancer Sci.
100:792–797. 2009. View Article : Google Scholar : PubMed/NCBI
|
|
38
|
Shen Y and White V: p53-dependent
apoptosis pathways. Adv Cancer Res. 82:55–84. 2001. View Article : Google Scholar : PubMed/NCBI
|
|
39
|
Stein GH, Drullinger LF, Soulard A and
Dulić V: Differential roles for cyclin-dependent kinase inhibitors
p21 and p16 in the mechanisms of senescence and differentiation in
human fibroblasts. Mol Cell Biol. 19:2109–2117. 1999. View Article : Google Scholar : PubMed/NCBI
|
|
40
|
Li XL, Zhou J, Chen ZR and Chng WJ: P53
mutations in colorectal cancer-molecular pathogenesis and
pharmacological reactivation. World J Gastroenterol. 21:84–93.
2015. View Article : Google Scholar : PubMed/NCBI
|