Introduction
Nonalcoholic fatty liver disease (NAFLD) is a
spectrum of liver diseases, initially characterized by the hepatic
fat accumulation in those who consume little or no alcohol
(1). Progressive histological
features include simple steatosis, nonalcoholic steatohepatitis
(NASH), cirrhosis, and hepatocellular carcinogenic transformation
(2). NAFLD is becoming
increasingly epidemic, affecting 25-40% of the global population
(3). NAFLD is notably associated
with metabolic disorders such as obesity and metabolic syndrome
(3). The consumption of free
sugar in liquid form is becoming popular, causing an elevated risk
of NAFLD (4,5). Free sugar stimulates food intake by
modulating appetite-regulating neural circuits and hormones,
providing a key carbon source for de novo lipogenesis in the
liver (5,6). Disordered glucose metabolism drives
hepatic lipid accumulation and inflammatory responses, leading to
NAFLD progression to NASH, cirrhosis, and hepatocellular carcinoma
(2).
Non-nutritive sweeteners (NNSs), known as artificial
sweeteners or noncaloric sweeteners, are food additives that can
modify the flavor of food and beverages without contributing
considerable calories or nutrients (7). NNSs have been increasingly
incorporated into diverse applications across the food industry,
pharmaceutical formulations, and consumer goods sectors (8). The United States Food and Drug
Administration has approved aspartame, sucralose, acesulfame-K
(AK), saccharin, neotame and advantame as NNSs (9). The global NNS market ($91.2billion
in 2023) is projected to grow at a compound annual growth rate of
2.51%, reaching $116.8 billion by 2033 (10). For each compound, the acceptable
daily intake (ADI) was established based on the results from
toxicological studies to ensure public safety (7,11). However, emerging evidence
indicates that these compounds are involved in metabolic
dysregulation (11,12). Prolonged exposure to NNSs is
associated with an increased risk of cardiovascular events
(13,14). Moreover, exposure to high doses
of NNSs disrupts T-cell proliferation and differentiation (15). Nevertheless, to the best of the
authors' knowledge, the mechanism by which chronic AK consumption
affects the hepatic lipid metabolism is currently unexplored.
Sweet taste receptors (STRs) are the representative
class C members of the G protein-coupled receptor family (16). Different taste signals are
mediated by distinct receptor combinations (16). Taste 1 receptor member 2 and 3
(TAS1R2 and TAS1R3) form a heterodimer that serves as an STR on
taste bud cells to perceive sweet substances (16,17). Natural monosaccharides,
disaccharides, and synthetic sweeteners can serve as ligands that
activate the sweet receptor protein (18). Importantly, STRs are not limited
to the oral cavity but are also expressed in several other tissues,
including the liver (19). STRs
in the small intestine facilitate glucose absorption and the
secretion of gut endocrine hormones (20). In sweet taste signal
transduction, Phospholipase C beta (PLCβ) serves as a key effector
that catalyzes the hydrolysis of membrane phosphatidylinositol
4,5-bisphosphate (21). This
reaction generates the second messengers, inositol trisphosphate
and diacylglycerol (DAG), triggering Ca2+ release from
intracellular stores and protein kinase C (PKC) activation
(21). However, research on the
presence and activity of STRs in the liver remains to be conducted.
AK exhibits remarkable metabolic stability compared with other
NNSs. It is absorbed as native form from the small intestine
through the portal vein to activate STRs in the liver (8). It is unclear how the metabolic
alterations resulting from STR activation in the liver are
regulated.
Peroxisome proliferator-activated receptor α (PPARα)
is highly expressed in the liver, where it regulates genes involved
in glucolipid metabolism (22,23). Elevated free fatty acids during
fasting activate PPARα, enhancing hepatic β-oxidation to reduce
lipid accumulation and lipotoxicity. Thus, PPARα improves insulin
sensitivity and glucose homeostasis by suppressing gluconeogenesis
(24). PPARα activation also
increases fibroblast growth factor 21 production, enhancing glucose
uptake and insulin sensitivity to regulate glucose metabolism
(25). High glucose and free
fatty acid levels lead to the accumulation of lipid intermediates
and the subsequent activation of PKC (26). While PPARα serves as a key
modulator of glucose metabolism, its regulatory effect on the
metabolic action of NNSs remains unknown.
In the present study, AK was administered in
drinking water to mice on a high-fat diet (HFD) to assess its
effects on NAFLD progression, with a focus on the role of PPARα.
In vivo and in vitro models were used to substantiate
the targets of STR signaling pathways regulated by PPARα.
Materials and methods
Materials and reagents
An HFD (cat. no. D12492) and standard chow diet
(cat. no. XTI01SL-002) were procured from Research Diets, Inc. and
Jiangsu Xietong Pharmaceutical Bio-Engineering Co., Ltd.,
respectively. Detailed nutritional composition of the diets is
provided in Data S1. Serum
lipid profiles, including total cholesterol (TC; cat. no. H202) and
triglycerides (TG; cat. no. H201), were analyzed using commercial
assay kits from Ningbo Meikang Biotechnology Co., Ltd. Hepatic
function biomarkers, alanine aminotransferase (ALT) and aspartate
aminotransferase (AST), were quantified with kits from the same
supplier. Fetal bovine serum was obtained from PAN-Seratech GmbH.
Ready-to-use penicillin-streptomycin and the BCA kit were purchased
from Beyotime Biotechnology. AK (cat. no. A113942) was purchased
from Shanghai Aladdin Biochemical Technology Co., Ltd.
D-(+)-Glucose was purchased from Shanghai HuSHI Co., Ltd. Insulin
was purchased from Shanghai Fosun Pharmaceutical (Group) Co., Ltd.
A sterile BSA-coupled free fatty acid (FFA) mixture solution was
obtained from Shanghai Siduorui Biotechnology Service Co., Ltd. The
PPARα agonist fenofibrate was acquired commercially from
MedChemExpress. The PPARα agonist Wy-14,643 was purchased from
Shanghai Aladdin Biochemical Technology Co., Ltd. The PPARα
antagonist GW6,471 was acquired commercially from MedChemExpress.
Antibodies against β-Tubulin (cat. no. 80713-1-RR), TAS1R2 (cat.
no. 29344-1-AP) and PLCβ (cat. no. 66668-1-Ig) were purchased from
Wuhan Proteintech Group, Inc. Antibodies against G protein subunit
alpha transducin 3 (GNAT3; cat. no. A15982), p-PLCβ (cat. no.
AP0837) and TAS1R3 (cat. no. A10157) were purchased from Wuhan
ABclonal Biotech Co., Ltd. The antibody against diacylglycerol
kinase eta (DGKH; cat. no. AF0611) was purchased from Affinity
Biosciences. Detailed information regarding the product brands,
dilution ratios, and catalog numbers for all antibodies can be
found in Table SI.
Determination of the AK
administration
A concentration of 2 mg/ml AK in drinking water was
used, this was determined by converting the human ADI (15
mg/kg/day) to a mouse equivalent dose (27). Using the formula HED=human dose ×
[Km human/Km mouse] (Km human=37, Km mouse=3), the mouse ADI was
calculated as 185 mg/kg/day. Based on the measured water intake of
the mice on HFD (100-140 ml/kg/day), a concentration range of
1.32-1.85 mg/ml was calculated. Finally, 2 mg/ml was used to ensure
effective exposure while keeping close to human ADI.
Animals and treatments
Wild-type (WT) and PPARα-null (KO) mice (129/Sv
strain) were obtained from Dr Frank J. Gonzalez at the National
Cancer Institute, Bethesda, MD, USA (28), and subsequently bred in-house at
Ningbo University. A total of 88 healthy 6-week male mice were used
for the 3 experiments mentioned below. The mean body weights were
18.0±0.5 g (WT) and 17.8±0.6 g (KO) before the experiment. The mice
were housed in individual ventilated cages under controlled
humidity (60±5%) and temperature (24±1°C) and a 12/12-h dark/light
cycle. The mice were monitored daily for general health (activity,
posture, fur condition, food/water intake) by trained staff. On the
terminal procedure day, monitoring was continuous from carbon
dioxide inhalation until confirmation of death. The animal
procedures were approved by the Animal Ethics and Welfare Committee
of Ningbo University (approval no. AEWC-NBU20230140; Ningbo,
China).
In the first experiment, 10 WT mice were randomly
divided into WT group (n=5) and WT-AK group (n=5). Another 10 KO
mice were divided into the KO group (n=5) and the KO-AK group
(n=5). The sample size design followed previous study and the 3R
framework (29). A randomization
table was utilized to assign experimental groups, with all
procedures executed by an independent technician blinded to the
animal handling. All the mice were fed a 60% HFD, and those in the
WT-AK and KO-AK groups were treated with an additional 2 mg/ml AK
in drinking water. Food and water were replaced every 48-72 h to
keep them fresh. Food and water intake were recorded to track
metabolic changes. After 11 weeks of treatment, oral glucose
tolerance test (OGTT) and insulin tolerance test (ITT) were
performed with a 3-day interval.
In a second experiment, 25 WT and 25 KO mice were
divided into the control (CON) group, F5, F25, F125 and Wy (n=5),
where they were treated with 5, 25 or 125 mg/kg fenofibrate (F5,
F25or F125, respectively) twice a day and with 160 mg/kg Wy-14,643
once a day by oral gavage for 5 days to explore the direct
regulatory effects of PPARα on the STR signaling pathway. All the
drugs were suspended in 1% (w/v) sodium carboxymethylcellulose
solution before administration. The CON groups were administered
the same volume of vehicle during this period.
In a third experiment, 9 WT and 9 KO mice were
allocated to 6 groups: WT, WT-AK, WT-AK-F, KO, KO-AK, and KO-AK-F
(n=3). All the mice were fed a 60% HFD, and those in the WT-AK,
WT-AK-F, KO-AK and KO-AK-F groups were treated with an additional 2
mg/ml AK in drinking water. After 10 weeks of treatment, the
WT-AK-F and KO-AK-F groups were treated with 25 mg/kg fenofibrate
twice daily via oral gavage for 2 weeks to investigate whether
PPARα activation attenuates hepatic steatosis by inhibiting the STR
signaling. The fenofibrate was dissolved in 1% (w/v) sodium
carboxymethylcellulose solution before administration. The
remaining groups were administered the vehicle during this period.
The dosage and regimen of fenofibrate were selected based on a
previously study that could effectively inhibit NAFLD development
(30).
All mice were sacrificed at the scheduled
experimental endpoint. The mice were individually placed in a
transparent induction chamber prefilled with ambient air.
Medical-grade carbon dioxide (CO2) was introduced at a
controlled flow rate (20-30% of the chamber volume per minute),
resulting in a gradual increase in CO2 concentration and
loss of consciousness. While the animal remained unconscious,
terminal blood collection was performed as part of the procedure.
CO2 exposure was then increased to a higher
concentration (~70%) and maintained until complete respiratory
arrest, which was sustained for an additional 5 min. Mortality was
verified by the absence of respiration and cardiac activity and
subsequently confirmed by cervical dislocation. No unscheduled
mortality occurred prior to the endpoint. After cervical
dislocation, liver tissues were collected. The blood samples were
centrifuged at 800 × g for 15 min at 4°C. The serum was
cryopreserved at −20°C for analysis within 3 days. After being
scaled, half of the biggest lobe was fixed in 10% neutral formalin
at room temperature for 24 h, and the remaining tissues were stored
at −80°C.
OGTT
After the 11-weeks of treatment, all the mice (WT,
WT-AK, KO, and KO-AK groups) in experiment 1 were fasted for 12 h
and gavaged with a glucose solution (2.5 g per kg body weight).
Blood glucose levels were measured at 0, 30, 60, 90, and 120 min
using a glucometer (ONETOUCH Verio; LifeScan, Inc.) following
tail-tip blood sampling. Blood (5-10 μl) was collected at
each predefined time point using a sterile lancet. During the
fasting period, the mice were allowed to drink control water to
eliminate potential AK-induced disturbances in insulin and
gastrointestinal hormone secretion (31). The area under the curve (AUC) was
calculated to assess glucose tolerance.
ITT
For ITT, the WT and WT-AK mice in experiment 1 were
fasted for 6 h, followed by intraperitoneal injection of insulin
(0.8 U/kg body weight). After insulin injection, the blood glucose
levels were measured at 0, 15, 30, 45 and 60 min using a
glucometer. Blood sampling and glucose measurement were performed
using the same method and sampling volume as those used in the
OGTT. Blood glucose concentrations over time were plotted as a
glucose-time curve and the AUC was calculated to compare the
insulin sensitivity.
Cellular experiments
Hepa1-6 cells (Suzhou Hysigen Bioscience Co., Ltd.)
and Huh-7 cells (Wuhan Pricella Biotechnology Co., Ltd.) were
cultured in high-glucose DMEM (4.5 g/l; Corning Life Sciences)
supplemented with 10% fetal bovine serum and 1%
penicillin-streptomycin. These two cell lines were treated with 0.2
mM FFA for 48 h to induce lipid accumulation. Simultaneously, AK
(0, 1, 3, 10 and 20 mM) was added to the aforementioned growth
media to explore the effects of AK on lipid accumulation. 50% AK
was added and the incubation continued for 48 h. The TG content of
the cells was measured following the procedures described
below.
Knock-down and inhibition of PPARα
A second-generation lentiviral packaging system was
used in this experiment. Lentiviral particles were packaged in 293T
cells (ATCC) and produced in 293T cells (ATCC) by co-transfection
with 8 μg shRNA plasmid, 6 μg packaging plasmid
(Δ8.2) and 4 μg envelope plasmid (VSV-G). Lentiviral
supernatants were collected at 48 h post-transfection, filtered
through a 0.45-μm filter, and used to infect Hepa1-6 cells
at a multiplicity of infection of 10. Hepa1-6 cells were passaged
into 10-cm dishes 24 h before infection. A total of 10 ml of DMEM
containing lentivirus packaged with short hairpin (sh) NC and
shPparα (Wuhan Miaoling Biotechnology Co., Ltd.) plasmids
was added to DMEM at a 1:1 ratio during the medium change. At 24 h
after infection, the culture medium containing the lentivirus was
discarded and replaced with fresh medium. Finally, the infected
cells were selected using DMEM supplemented with 30 μg/ml
blasticidin (Beyotime Biotech Inc.) for 48 h and maintained in
medium containing 3 μg/ml blasticidin to purify stable
transfectants. Successful gene knockdown was confirmed by reverse
transcription-quantitative (RT-q) PCR and western blot analysis.
Hepa1-6 cells induced by FFA were co-treated with 2 μM
GW6,471 or AK (0, 1, 3, 10 and 20 mM) for 48 h.
The shNC plasmid was obtained from Wuhan Miaoling
Biotechnology Co., Ltd. (cat. no. P47365). The shPparα
sequences were as follows: shPparα-1:
5'-AAGAATTCTTACAAGAAAT-3'; shPparα-2:
5'-GGAAAGTCCCTTATCTGAAT-3'; shPparα-3:
5'-GAACATCGAGTGTCGAATAT-3'.
Measurement of TC and TG
concentrations
The TC and TG concentrations in the plasma and liver
tissues were determined using commercially available TC and TG
assay kits. The liver tissues were weighed and homogenized with 9
volumes of saline. For analysis, 2 μl aliquots of plasma or
liver homogenate samples were combined with 67 μl of reagent
R1. After 5 min of incubation at 37°C, the absorbance was measured
at the appropriate wavelengths (TC; 546 and 660 nm; TG; 546 and 700
nm). After 33 μl of reagent R2 was added, the samples were
incubated for another 5 min. The absorbance was measured at the
aforementioned wavelengths following the manufacturer's
protocol.
Measurement of liver glycogen
concentration
Concentrations of glycogen in liver tissues were
determined using a commercially available glycogen assay kit (cat.
no. A043-1-1; Nanjing Jiancheng Bioengineering Institute). The
weighed liver tissue was boiled in a metal bath at 100°C after
adding 3-fold volumes of the alkaline solution. Glycogen
chromogenic solution and double-distilled water were added. The
mixture was boiled again and then transferred to a 96-well plate
for absorbance measurement at 620 nm.
Measurement of liver DAG
The hepatic DAG levels were quantified using a
commercial ELISA kit (cat. no. KX30762; Shanghai Yaxin
Biotechnology Co. Ltd.). The liver tissues were homogenized in
ice-cold saline at 4°C. The homogenates were centrifuged at 1,200 ×
g for 15 min at 4°C. Following the procedures in the kit, the
homogenate DAG concentrations were measured and normalized.
Histopathological analysis
Fresh liver tissues were fixed in 10% neutral
formalin at room temperature for 24 h. The tissues were then
dehydrated in a serial concentration of ethanol (70, 80, 90 and
100%). After clearing with xylene, the tissues were embedded in
paraffin and serial 4 μm sections were prepared. To detect
polysaccharide content, the liver sections were deparaffinized and
stained at room temperature by oxidation with 0.5% periodic acid
for 8 min, followed by Schiff reagent incubation for 15 min and
H&E counterstaining for 2 min. Representative images were
captured using a light microscope (Olympus BX43; Olympus
Corporation). Pathological analysis was carried out by a certified
pathologist unaware of the study design.
Oil Red O staining
Hepa1-6 and Huh-7 cells were washed twice in PBS and
then fixed in 10% neutral formalin buffer for 30 min at 4°C. The
cells were stained with fresh oil red O working solution for 30
min, soaked in 60% isopropyl alcohol for 10 sec and finally stained
with hematoxylin for 2 min at room temperature. Lipid droplet
formation in cells was visualized via inverted phase-contrast
microscopy (Olympus CKX41; Olympus Corporation).
RT-qPCR analysis
Frozen liver and adipose tissues were lysed in
TRIzol® (Invitrogen; Thermo Fisher Scientific, Inc.) and
homogenized using a MagNA Lyser (Roche Diagnostics). The RNA
concentration was quantified spectrophotometrically, with purity
assessed using the OD260/OD280 absorbance
ratio. Total RNA (1 μg) from the liver sample was subjected
to reverse transcription in a reaction volume of 20 μl
following the manufacturer's protocol of ABScript III RT Master Mix
for qPCR (cat. no. RK20428; ABclonal Biotech Co., Ltd.). The
synthesized cDNA was stored at 20°C until analysis. The primer
sequences are listed in Table
SII. Q-PCR amplification on 96-well plates was performed in a
10-μl incubation containing 1 μl cDNA, 5 μl
UltraSYBR Mixture, 0.4 μl primer, and 3.6 μl purified
water using a LightCycler 480II (Roche Diagnostics). The
thermocycling conditions were set as initial denaturation at 95°C
for 5 min, followed by 40 cycles of 95°C for 10 sec and 60°C for 30
sec. The 2-ΔΔCq method was used to quantify the
expression of target genes (32). The measured mRNA abundance was
normalized to that of GAPDH and expressed as a fold change
equivalent to that of WT control mice. All experiments were
independently repeated at least three times.
Western blot analysis
Frozen liver tissues were homogenized in 9 volumes
of RIPA lysis buffer (Suzhou NCM Biotech Co., Ltd.) containing 1%
PMSF and 1% protein phosphatase inhibitor). The supernatants were
collected by centrifugation at 15,000 × g for 15 min at 4°C.
Protein concentrations were determined using a BCA protein assay
kit (cat. no. B610409; Suzhou NCM Biotech Co., Ltd.). Equal amounts
of protein (30 μg per lane) were mixed with 5X SDS-PAGE
loading buffer (Beyotime Biotech Inc.) and boiled for 8 min. The
10% SDS polyacrylamide gels were separated for 1 h. The proteins
were transferred to 0.45-μM PVDF membranes for 1.5 h in an
ice bath. All membranes were blocked with 5% skimmed milk at room
temperature for 3.5 h. Subsequently, the membranes were incubated
with primary antibodies at 4°C overnight. After three 10-min washes
with TBS-0.1% Tween-20, the membranes were incubated with
HRP-conjugated secondary antibodies for 2 h at room temperature
(primers in Table SI). Finally,
the ECL substrate was added to the blotted PVDF, and images were
recorded using a chemiluminescent imaging system, ChemiScope 6100
Touch (Clinx Science Instruments Co., Ltd.). Densitometric analysis
was performed using ImageJ (version 1.53; National Institutes of
Health).
RNA sequencing (RNA-seq) analysis
The liver samples from 4 groups (WT-CON, WT-Wy,
KO-CON and KO-Wy; n=3/group) in cohort 2 were analyzed. Total RNA
was extracted using Trizol reagent (cat. no. B610409; Sangon
Biotech Co., Ltd.), treated with DNase I, and assessed for
integrity (RIN >8) and purity using a NanoPhotometer
spectrophotometer (Implen GmbH) and a Qubit fluorometer (Thermo
Fisher Scientific, Inc.). The sequencing libraries were prepared
using the VAHTS mRNA-seq V2 Kit (cat. no. NR612-01; Vazyme Biotech
Co., Ltd.) for Illumina, including poly-A mRNA enrichment,
fragmentation (150-200 bp), RT, adapter ligation, and PCR
amplification. Paired-end RNA sequencing (150 bp reads) was
performed on an Illumina NovaSeq platform (Illumina, Inc.). The
final libraries were quantified using a Qubit fluorometer and
Agilent Bioanalyzer and loaded onto the sequencer at a final
concentration of 10 pM. The raw reads were filtered using
Trimmomatic (version 0.39; https://github.com/usadellab/Trimmomatic) with Q≥20,
aligned to the mouse reference genome (GRCm38) using HISAT2
(version 2.2.1; https://daehwankimlab.github.io/hisat2), and
quantified as transcripts per million (TPM) using StringTie
(version 2.1.4; https://ccb.jhu.edu/software/stringtie).
Differentially expressed genes [|FC|≥1.5, False Discovery Rate
(FDR) <0.01; DESeq2], including Acot1, Ehhadh, and
Dgkh, were validated by qPCR (primers in Table SII).
Statistical analysis
All experimental subjects were retained for
statistical evaluation. Parametric distribution assumptions were
confirmed, with results reported as mean ± SEM. Between-group
differences were assessed using two-tailed Student's t tests
following verification of variance homogeneity. Multigroup
comparisons employed one-way ANOVA with Bonferroni adjustment for
homogeneous datasets, whereas heteroscedastic data were analyzed
through Welch's ANOVA followed by Tamhane's T2 post hoc testing.
Statistical significance threshold was set at α=0.05. A post hoc
statistical power analysis was performed for the comparisons of
liver TG content in experiment 3. Based on the experimentally
observed effect sizes, the actual sample size (n=3 per group), and
a two-tailed significance level (α) of 0.05, the statistical power
was calculated for the comparison between WT-AK and WT-AK-F group.
The liver TG content in the WT-AK-F group was significantly lower
than that in the WT-AK group [(Mean difference)=3.504-5.532=-2.028
μg/mg; P<0.05]; two-tailed unpaired t-test. The magnitude
of this difference was quantified as Cohen's d=8.50, 95% CI [3.0,
14.0]. Analytical procedures were executed in GraphPad Prism 9.5.1
(Dotmatics). P<0.05 was considered to indicate a statistically
significant difference.
Results
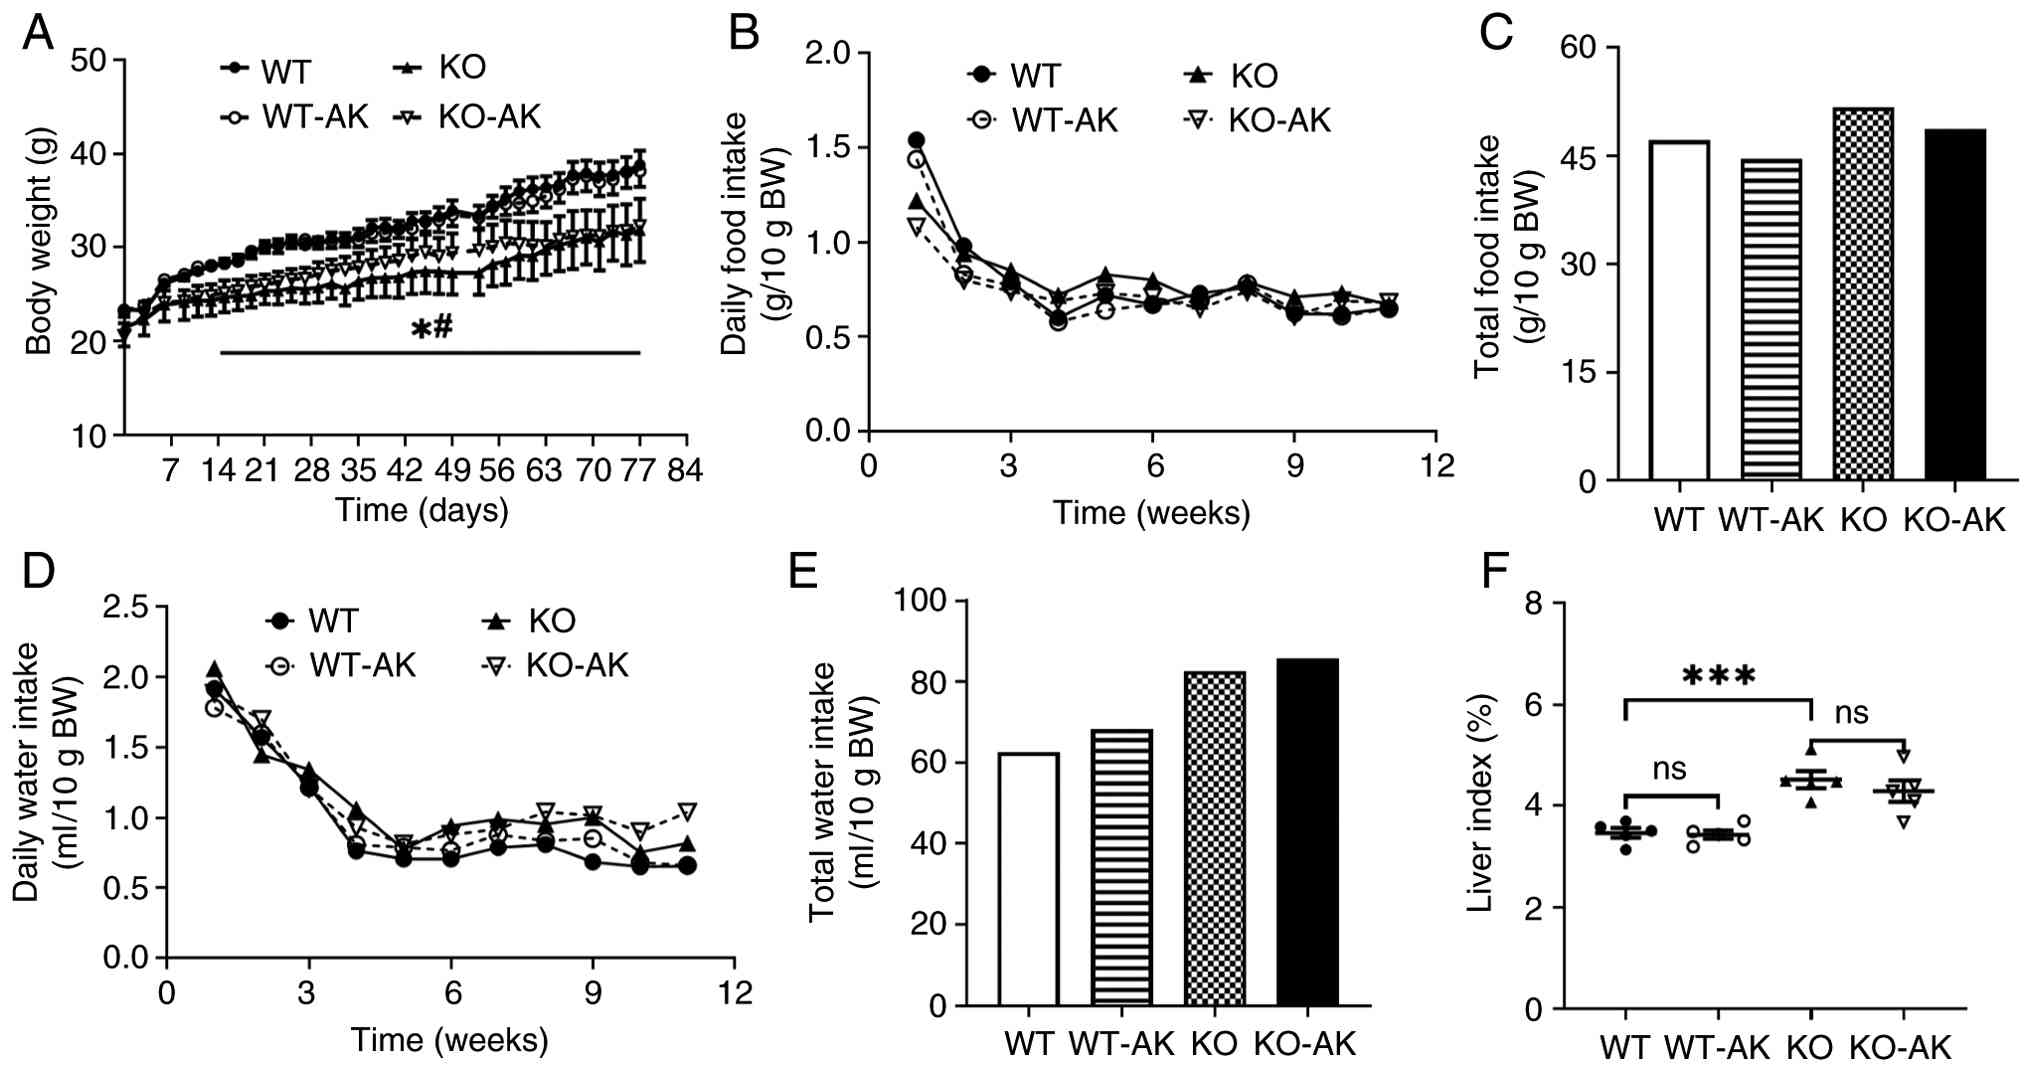
Chronic AK consumption promotes NAFLD
without altering the phenotype
After 12 weeks of HFD treatment, the WT mice
exhibited markedly greater body weight gain compared with the KO
mice (Fig. 1A). AK
supplementation failed to induce significant changes in body weight
gain in either mouse line (Fig.
1A). The WT and the KO mice that consumed AK both presented a
reduction in food intake but an increase in water consumption
(Fig. 1B-E). The liver weight
was markedly higher in the KO mice compared with the WT mice, but
AK supplementation did not cause an increase in liver weight in
either group (Fig. 1F). These
data suggested that AK administration did not affect metabolic
phenotype in either the WT mice or the KO mice.
A 12-week HFD regimen induced differential hepatic
lipid accumulation between two mouse lines, as indicated by
H&E-stained samples in Fig.
S1A-D. AK exacerbated hepatic steatosis in the WT mice but not
in the KO mice (Fig. 2A). The
plasma ALT and AST levels were not altered by AK in either the WT
or KO mice (Fig. S2A and B). No
significant change in mRNA expression levels of inflammatory genes
was visible upon AK treatment in the WT mice, whereas a significant
downregulation was observed in the KO mice (Fig. S2C-F). Moreover, AK
supplementation increased the hepatic TG levels by approximately
10% in the WT mice, whereas no significant change was observed in
the KO mice (Fig. 2B). By
contrast, the hepatic TC levels were significantly higher in the KO
mice than in the WT mice. However, AK supplementation did not
significantly affect hepatic TC levels in either mouse line
(Fig. 2C). No significant
differences were observed in the serum TC or TG concentrations
among the 4 groups (Fig. 2D and
E). Thus, chronic AK consumption promotes NAFLD development in
the WT mice but not in the KO mice.
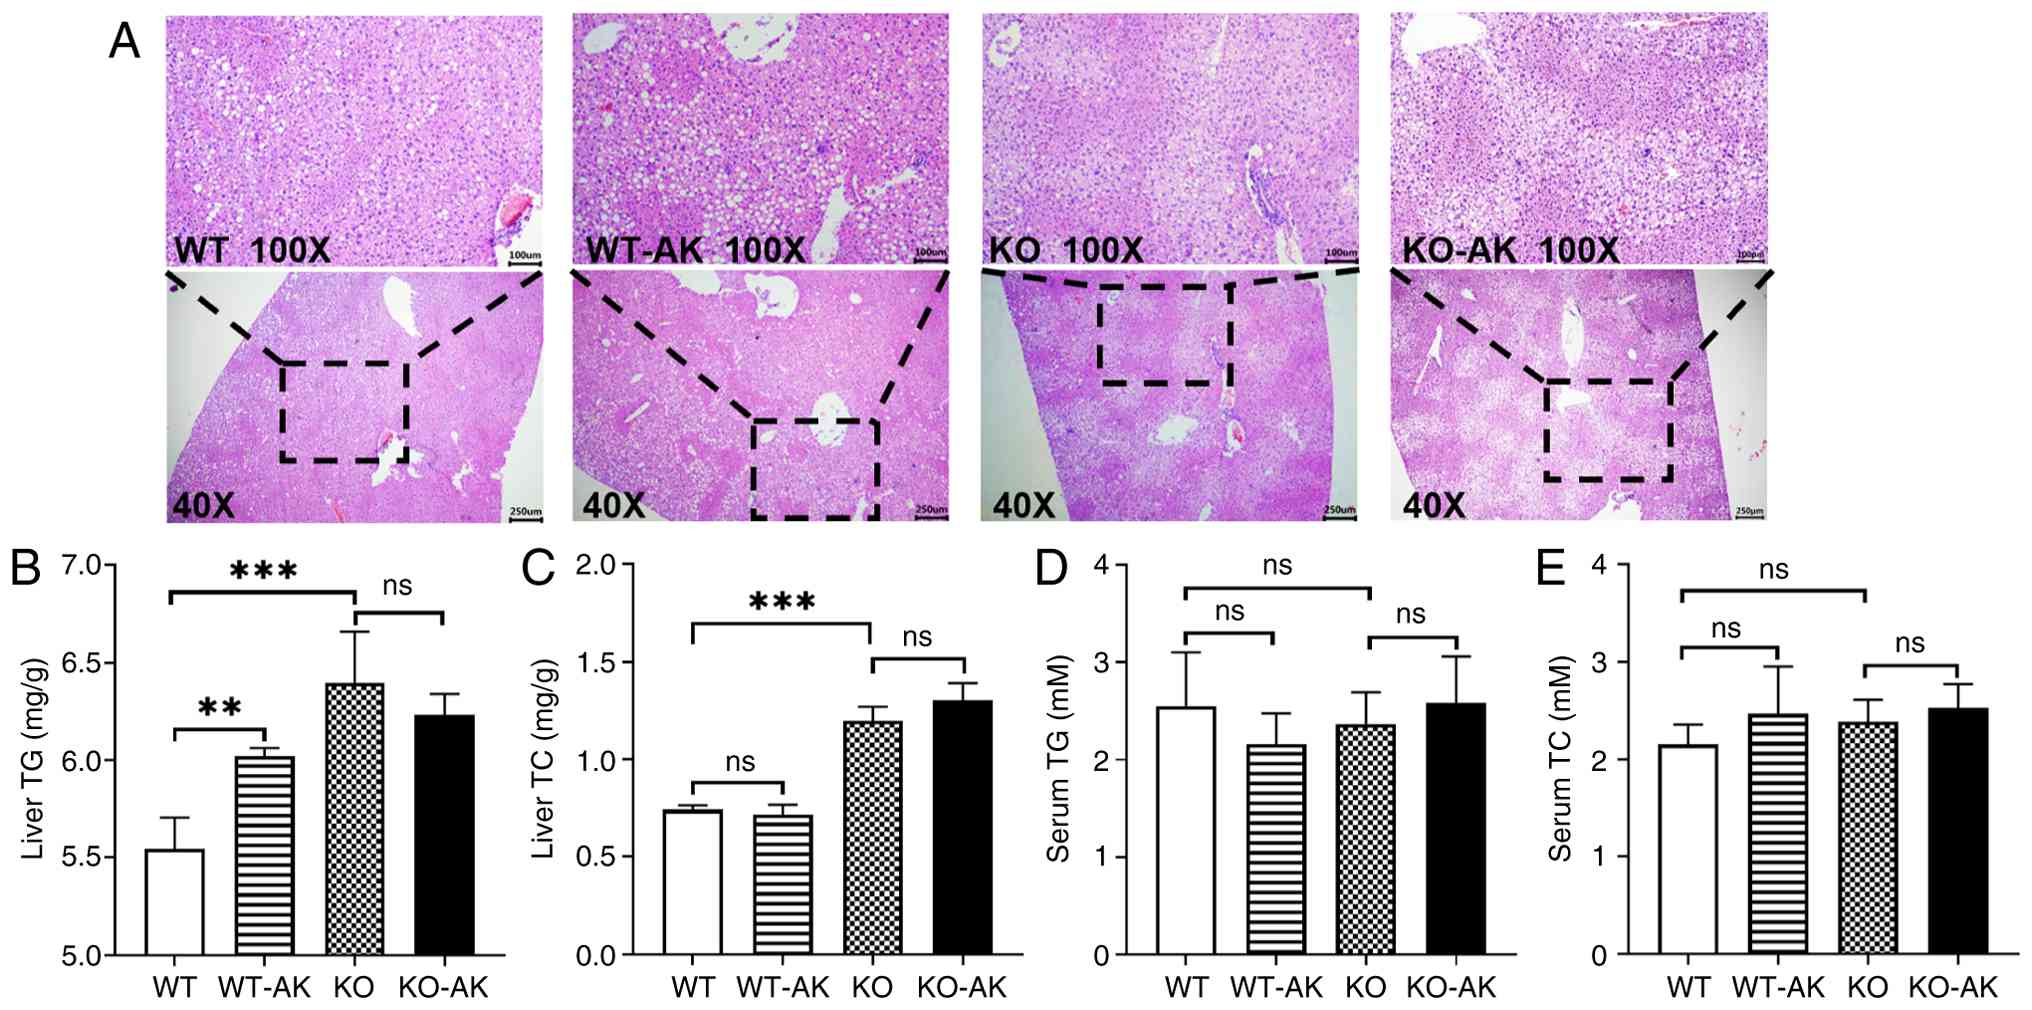 | Figure 2AK promotes NAFLD development in the
WT mice not the KO mice. (A) Hematoxylin and eosin staining of
liver tissues from each group (magnification, ×40 and ×100). (B)
Liver TG and (C) TC concentrations in each group. (D) Serum TG and
(E) TC concentrations in each group. The data were expressed as the
means ± SEM. **P<0.01, ***P<0.0001, ns.
not significant. AK, acesulfame-K; NAFLD, nonalcoholic fatty liver
disease; WT, wild-type; KO, PPARα-null; TC, total cholesterol; TG,
triglycerides; PPARα, peroxisome proliferator-activated receptor
α. |
AK impairs glucose homeostasis via
activation PLCβ in STR signaling
After 11 weeks of HFD consumption, an oral glucose
tolerance test was performed followed by insulin sensitivity
experiments (Fig. 3A). An ~25%
higher mean blood glucose peak level was observed in the WT-AK mice
as compared with the WT mice (Fig.
3B). AK supplementation impaired glucose tolerance in the WT
mice but not in the KO mice (Fig. 3B
and C). After the 6-h fasting period, the fasting blood glucose
levels of the mice in the KO group were ~25% lower compared with
those in the WT group. No significant difference in fasting blood
glucose levels was observed between the WT and WT-AK mice (Fig. 3D). AK supplementation did not
modify the insulin sensitivity in either the WT mice or the KO mice
(Fig. 3E and F). Therefore, AK
supplementation may impair the glucose tolerance without altering
insulin sensitivity in the WT mice.
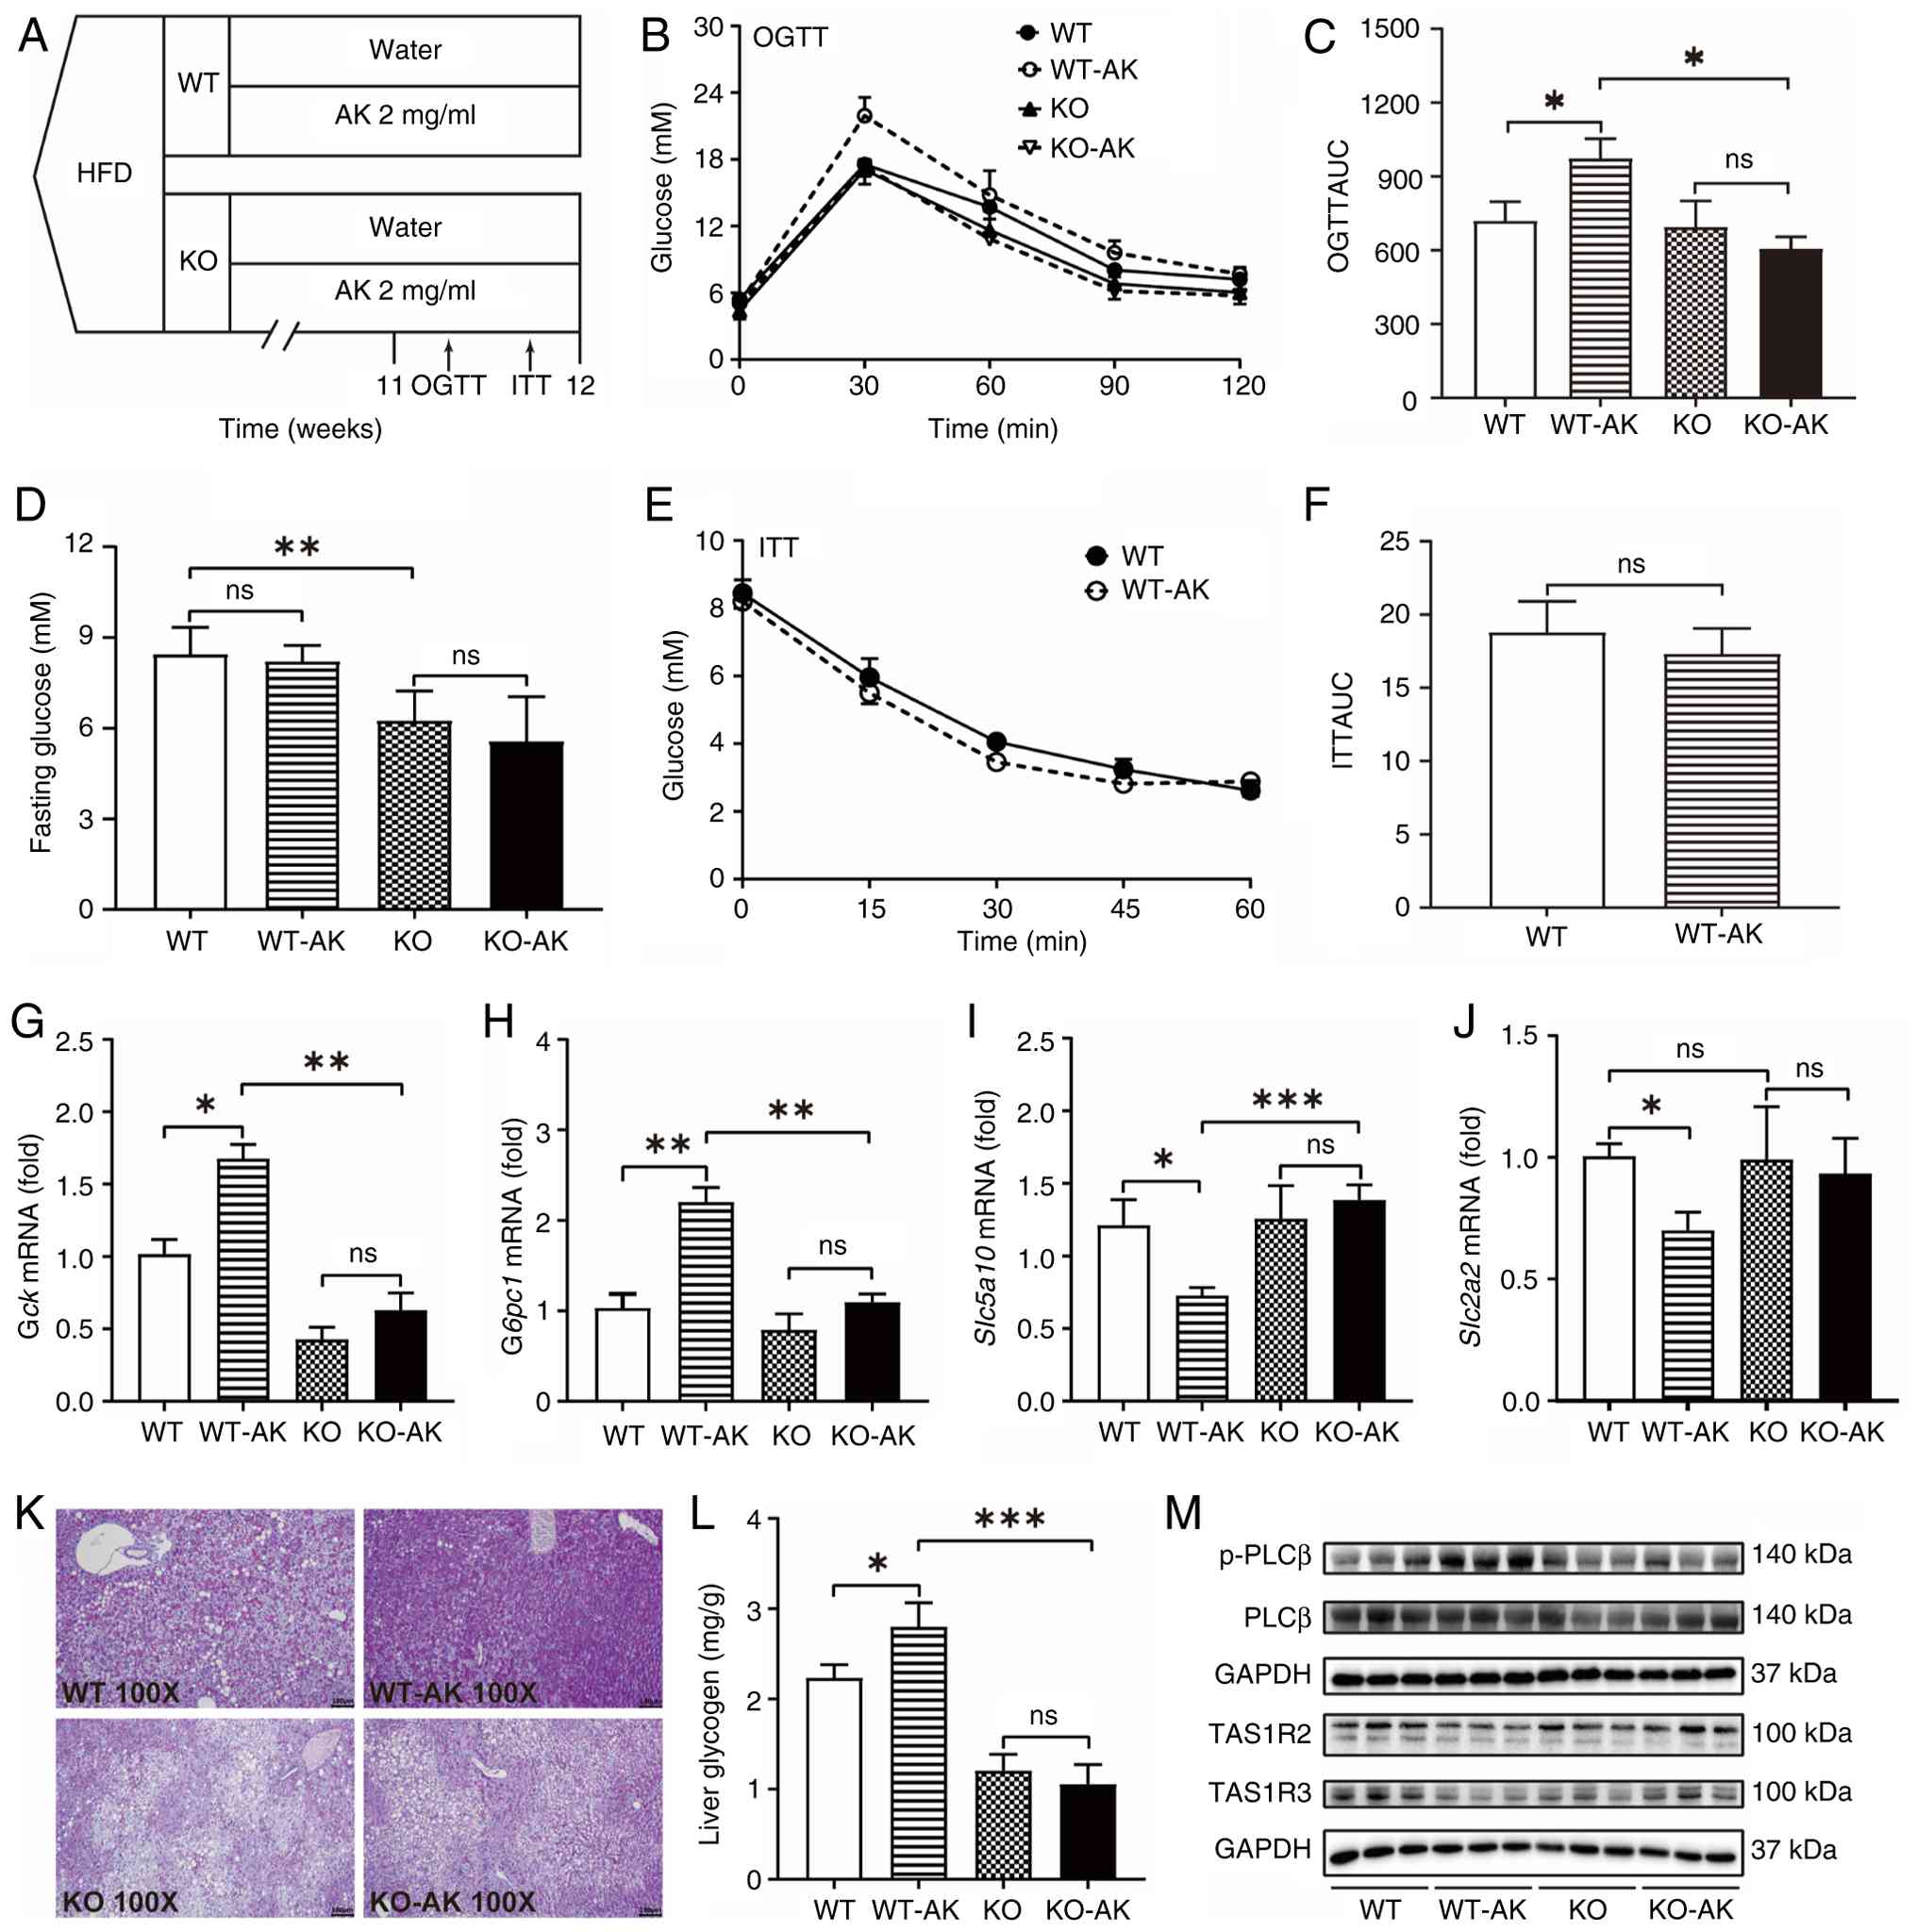 | Figure 3AK impairs glucose homeostasis via
activating hepatic PLCβ in STR signaling. (A) HFD-fed WT and KO
mice receiving normal water or AK supplementation (12-week
intervention, n=5). Metabolic tests (OGTT/ITT) at weeks 11-12. (B)
OGTT and (C) the corresponding AUCs in each group. (D) Fasting
blood glucose levels in the different groups of mice after 6 h of
fasting. (E) ITT and (F) the corresponding AUCs in the WT and WT-AK
mice. The average changes in (G) Gck, (H) G6pc1, (I)
Slc2a2 and (J) Slc5a10 transcription in the 4 groups.
(K) PAS staining of liver tissues from each group (magnification,
×100). (L) Liver glycogen content in each group. (M) Liver protein
expression levels of PLCβ, p-PLCβ, TAS1R2, and TAS1R3 were measured
using western blot analysis. The data were expressed as the means ±
SEM. *P<0.05, **P<0.01,
***P<0.0001, ns. not significant. AK, acesulfame-K;
p-, phosphorylated; PLCβ, phospholipase C beta; STR, sweet taste
receptor; HFD, high-fat diet; WT, wild-type; KO, PPARα-null; OGTT,
oral glucose tolerance test; ITT, insulin tolerance test; AUC, area
under the curve; G6pc1, glucose-6-phosphatase catalytic subunit
1; Gck, glucokinase; Slc2a2, solute carrier family 2,
member 2; Slc5a10, solute carrier family 5, member 10; TAS1R,
taste 1 receptor member. |
Expression of the Gck and G6pc1 genes
was markedly upregulated in the WT-AK mice compared with the WT
mice (Fig. 3G and H). Gck
mRNA expression was increased by ~50%, paralleled by a 1-fold
increase in G6pc1 mRNA expression compared with WT mice
(Fig. 3G and H). Similarly, the
mRNA expression levels of the glucose transport genes Slc2a2
and Slc5a10 were markedly lower in the WT-AK mice compared
with the WT mice (Fig. 3I and
J). The effect on differential gene expression regulation is
lost in mice that are depleted of PPARα. Furthermore, in the WT-AK
mice, mRNA levels of the fatty acid synthesis genes Acaca
and Elovl6 were higher compared with those in the WT mice,
whereas no significant differences were found in the expression of
lipid and glycogen metabolism genes (Fig. S3A-H).
Periodic acid-Schiff staining of liver sections
revealed more pronounced glycogen deposition in the WT-AK mice
compared with in the WT mice (Fig.
3K). The liver glycogen content was elevated by 25% in the
WT-AK mice compared with the WT mice, whereas the effect was lost
in the KO mice (Fig. 3L).
Compared with that in WT-AK mice, the expression of phosphorylated
PLCβ in WT-AK mice was elevated, suggesting the activation of STR
signaling (Fig. 3M). Although
the downregulation of TAS1R2 and TAS1R3 expression was also
observed in the WT-AK group, they were supposed to be adaptive
modifications. However, none of the aforementioned modifications
were observed between the KO and KO-AK mice (Fig. 3M). Therefore, physiologically,
PPARα mediates the disruption of glycolipid metabolism by AK in the
liver by activating STR signaling, especially by increasing the
phosphorylated PLCβ.
AK-increased lipid accumulation via PLCβ
is dependent on PPARα
Oil Red O staining revealed a dose-dependent
increase in lipid accumulation in both Hepa1-6 and Huh-7 cells
treated with increasing AK concentrations (Fig. 4A). Supporting results were
obtained by direct measurement of the TG contents in both cell
lines (Fig. 4B and C). In the
Hepa1-6 cell line, the addition of 10 mM AK led to a
concentration-dependent increase in PLCβ phosphorylation during
treatment (Fig. 4D). A
comparable activation of PLCβ was also observed when the same
concentrations of AK were added to Huh-7 cells (Fig. 4E).
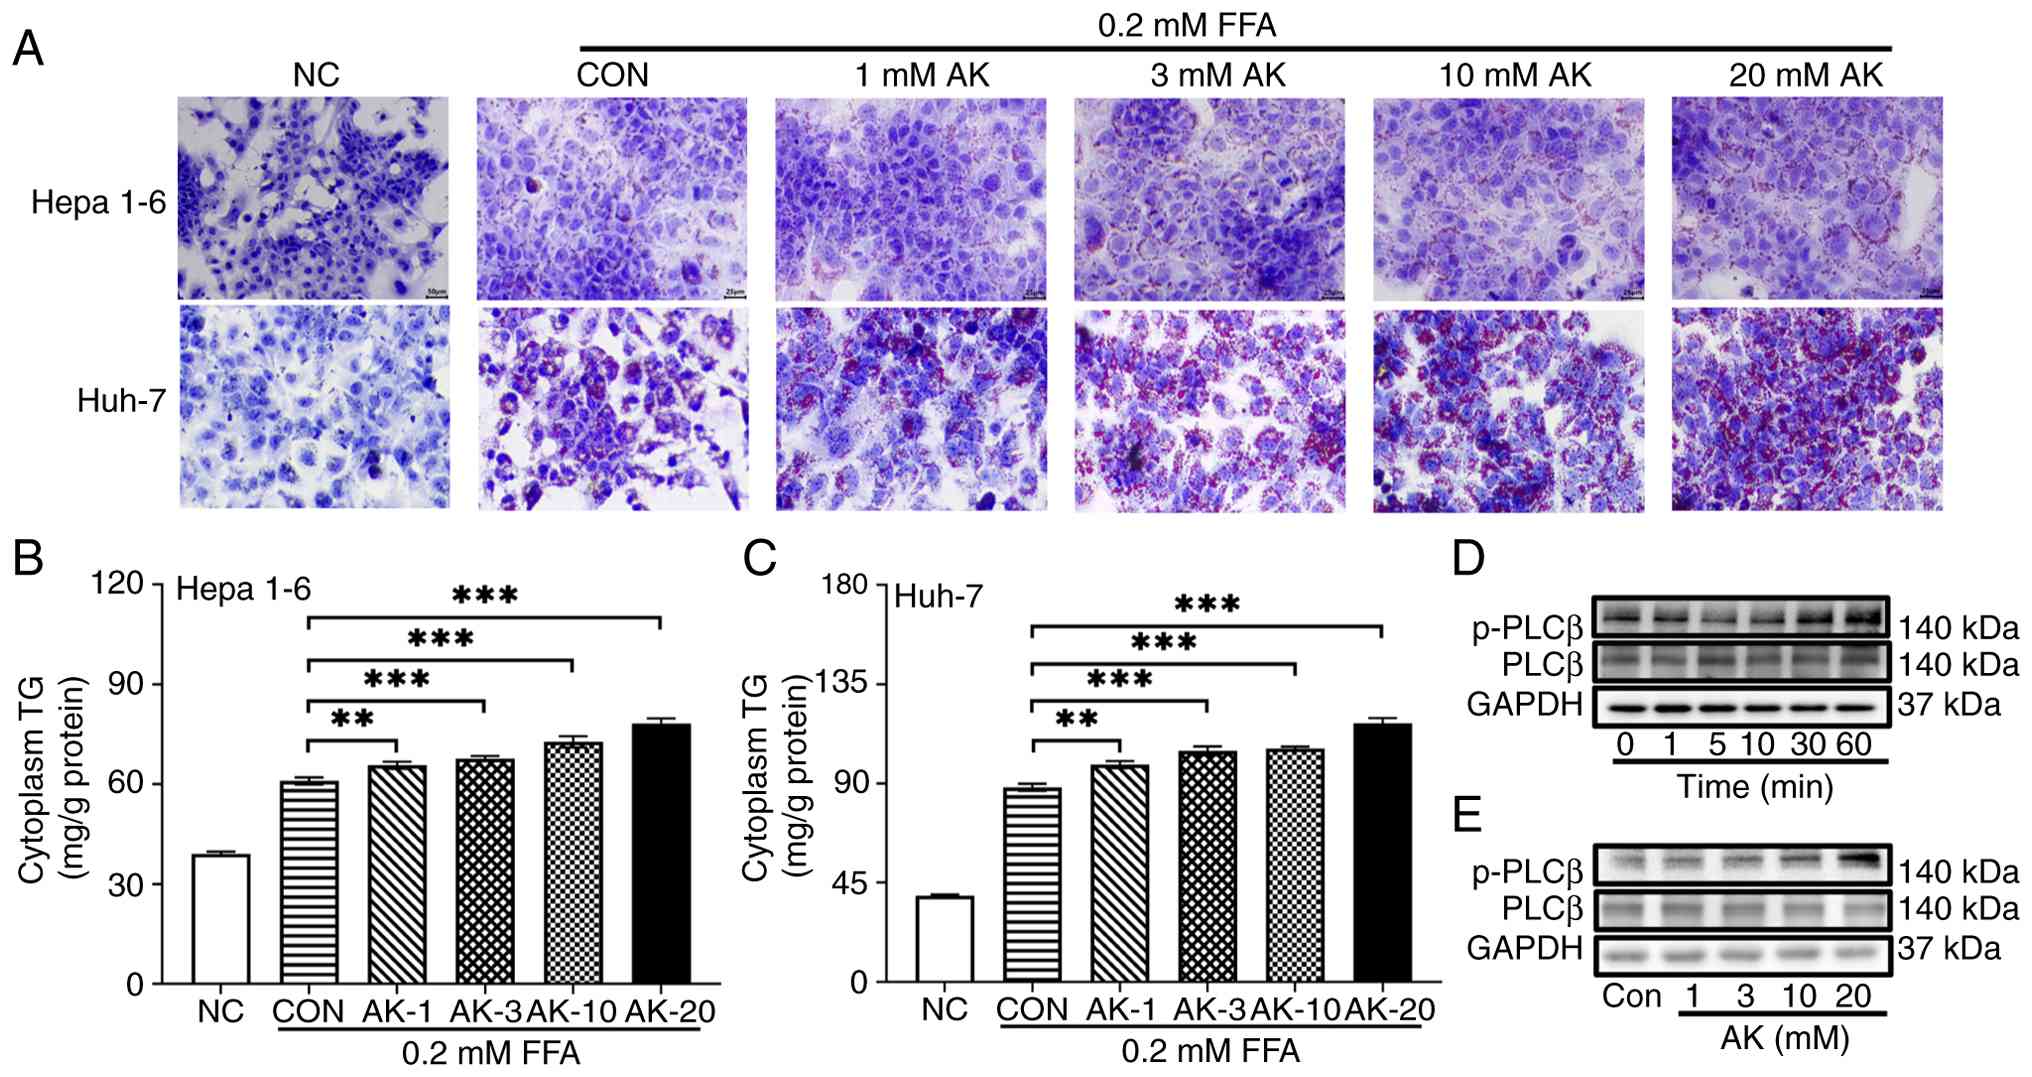 | Figure 4PLCβ is activated in lipid
accumulation increased by AK in Hepa1-6 and Huh-7 cells. (A) Oil
Red O staining of Hepa1-6 and Huh-7 cells after 48 h of treatment
with FFA combined with AK. (B) TG content in the cytoplasm of
Hepa1-6 cells. (C) TG content in the cytoplasm of Huh-7 cells. (D)
PLCβ phosphorylation in Hepa1-6 cells during a time course of AK
treatment. (E) PLCβ phosphorylation in Hepa1-6 cells after 1 h of
AK treatment. The data were expressed as the means ± SEM.
**P<0.01, ***P<0.0001. PLCβ,
phospholipase C beta; AK, acesulfame-K; Hepa1-6, mouse hepatoma
cells; Huh-7, human hepatocellular carcinoma cells; FFA, free fatty
acid; TG, triglycerides; WT, wild-type; NC, control group without
free fatty acid treatment; CON, control group without added
acesulfame-K but with free fatty acids added; KO, PPARα-null; p-,
phosphorylated. |
To functionally prove the involvement of PPARα in
the observed AK effects, Hepa1-6 cells were transfected with three
shPparα plasmids via lentiviral infection (Fig. 5A). PPARα protein expression was
downregulated in shPparα-2-transfected Hepa1-6 cells, as
confirmed by western blot analysis (Fig. 5B). No increase in PLCβ
phosphorylation was observed in shPparα-transfected Hepa1-6
cells despite exposure to increased AK concentrations (Fig. 5C). Oil Red O staining and
intracellular TG analysis revealed that lipid accumulation in
shPparα-2-transfected cells was not increased by serially
increased concentrations of AK (Fig.
5D and E). Similarly to the knock-down experiment, both the
PLCβ activation and the lipid accumulation in AK treatment were
also abolished by GW6,471, a selective PPARα antagonist (Fig. 5F and G). Accordingly, lipid
accumulation in hepatocytes and the activation of STR signaling
component PLCβ is dependent on PPARα.
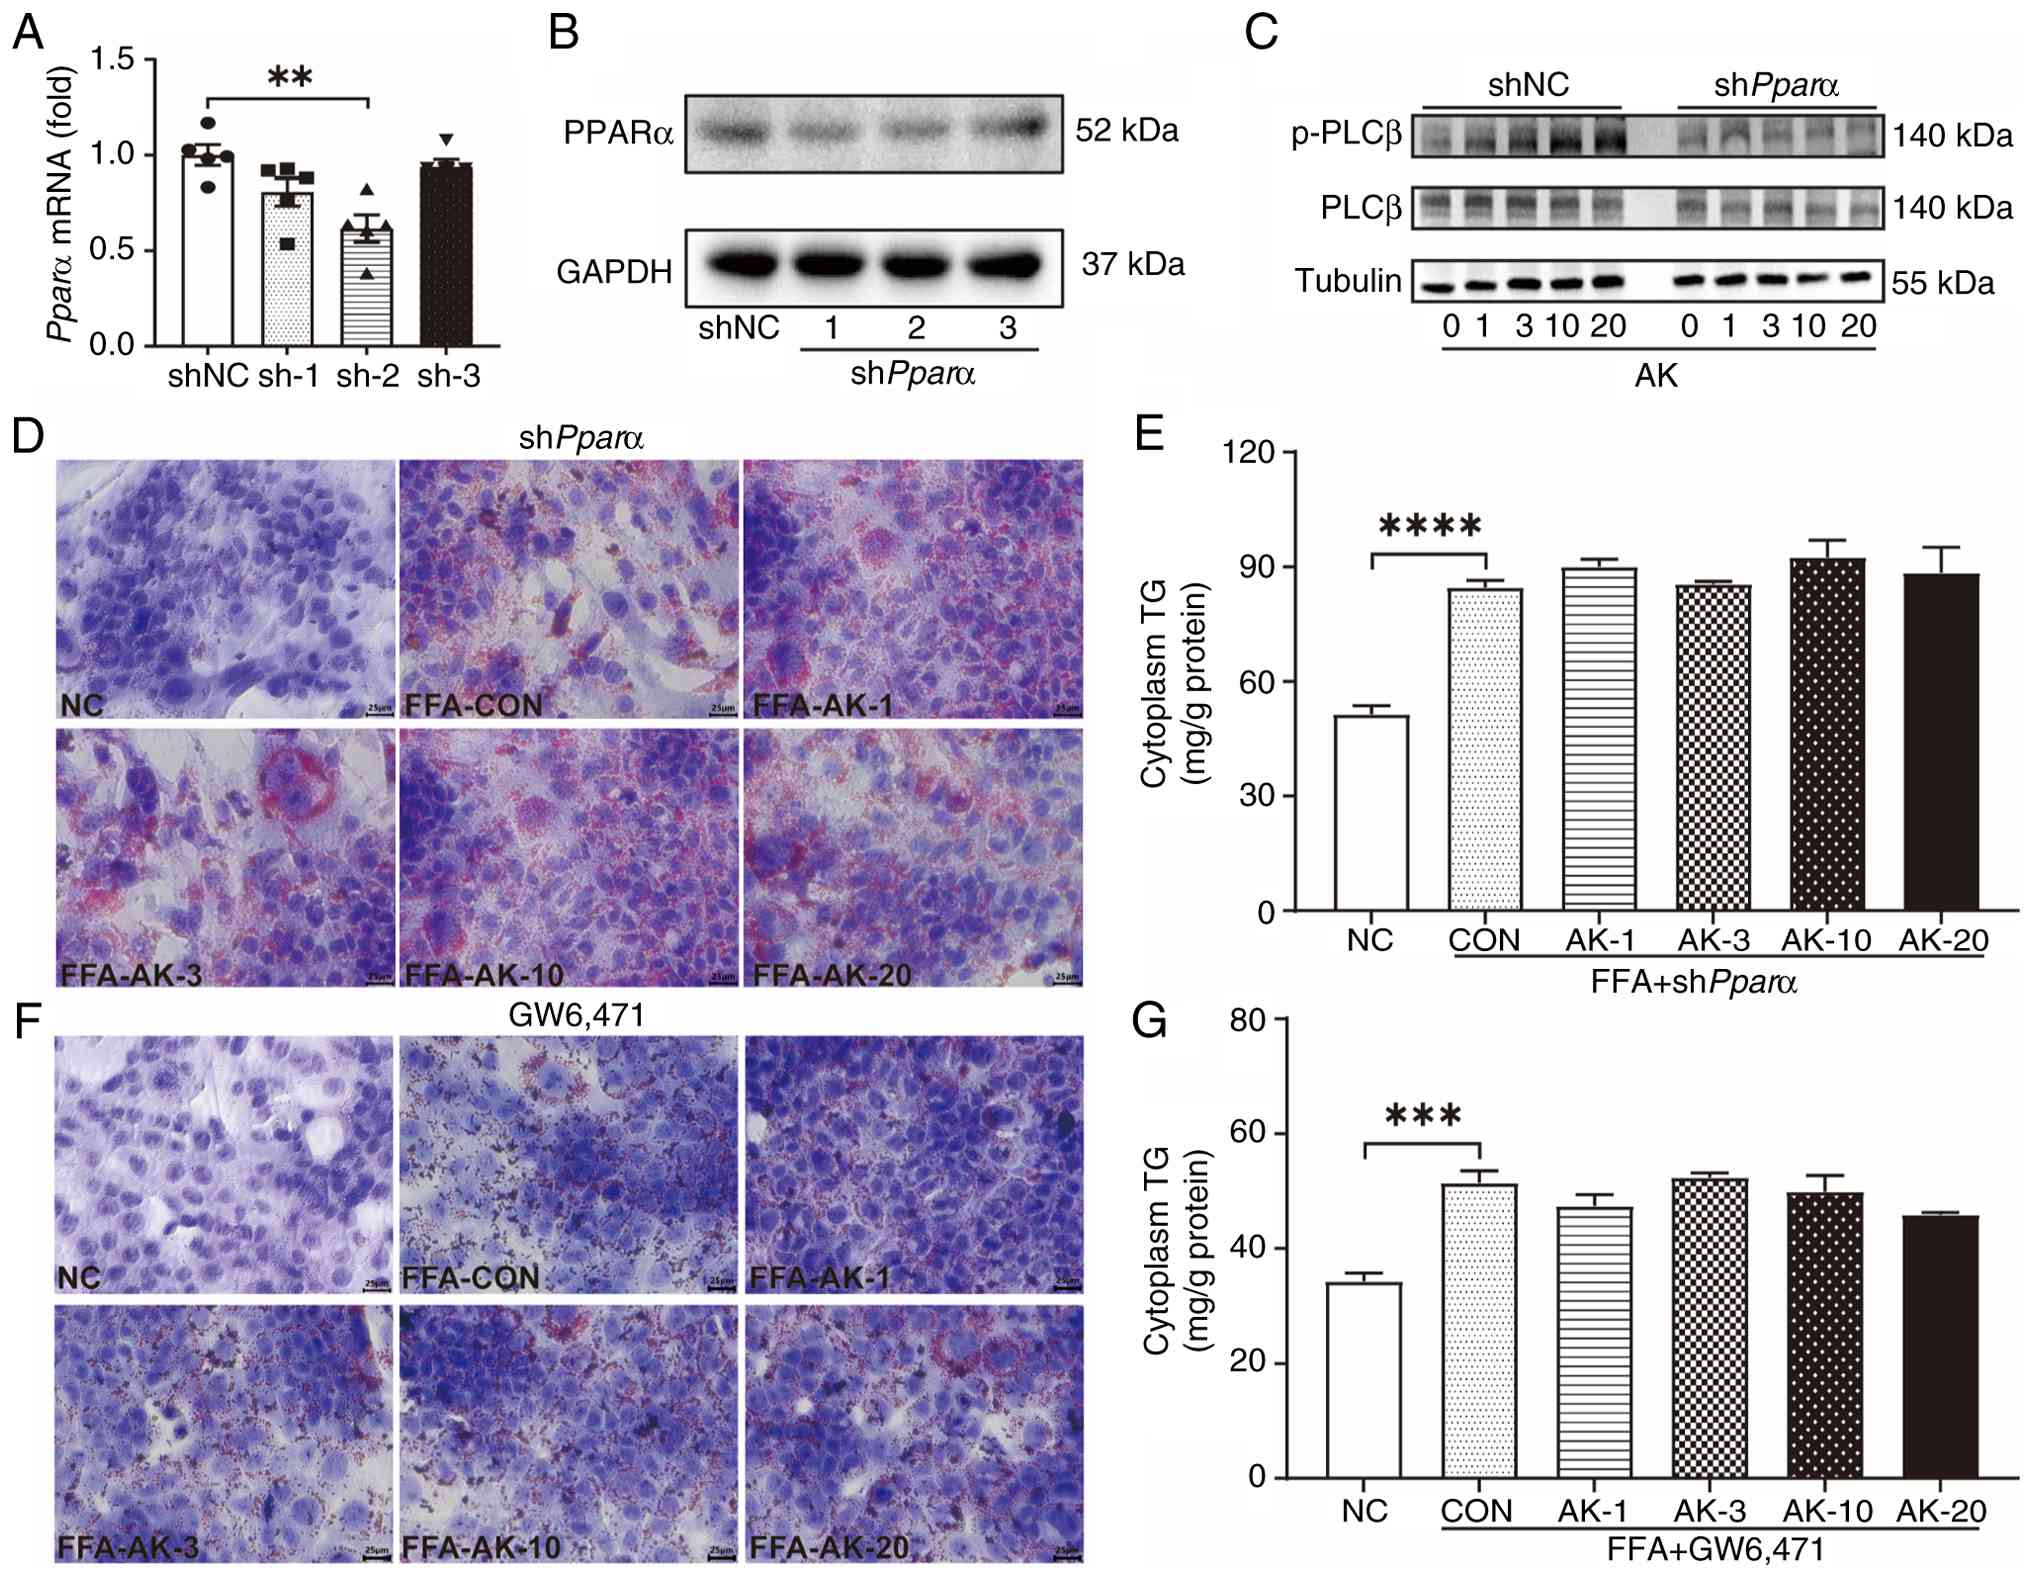 | Figure 5PLCβ activation and lipid
accumulation induced by AK are deleted by PPARα downregulation. (A)
Pparα mRNA levels in Hepa1-6 cells transfected with a vector
plasmid and three shPparα plasmids. (B) PPARα protein levels
in Hepa1-6 cells transfected with a vector plasmid and three
shPparα plasmids. (C) PLCβ phosphorylation in Hepa1-6 cells
transfected with shPparα-2 after 1 h of AK treatment. (D)
Oil Red O staining of Hepa1-6 cells after transfection with the
shPparα-2 plasmid. (E) TG content in the cytoplasm of
Hepa1-6 cells transfected with the shPparα-2 plasmid. (F)
Oil Red O staining of Hepa1-6 cells treated with GW6,471. (G) TG
concentration in Hepa1-6 cells treated with GW6,471. The data were
expressed as the means ± SEM. **P<0.01,
***P<0.001, ****P<0.0001. AK, acesulfame-K; PLCβ,
phospholipase C beta; PPARα, peroxisome proliferator-activated
receptor α; sh, short hairpin; Hepa1-6, mouse hepatoma cells; TG,
triglycerides; CON, control group without added acesulfame-K but
with free fatty acids added; FFA, free fatty acid; GW6,471, a
peroxisome proliferator-activated receptor α inhibitor; KO,
PPARα-null; NC, control group without free fatty acid treatment;
p-, phosphorylated; shNC, short hairpin RNA negative control; TC,
total cholesterol; WT, wild-type. |
Multiple targets of the hepatic STRs
including PLCβ are regulated by PPARα
Next, the effects of PPARα on the STR signaling
pathway were explored in mice treated with increasing doses of
fenofibrate and Wy-14,643, a more selective PPARα agonist. The mRNA
expression levels of the PPARα target genes Acot1 and
Ehhadh increased progressively with increasing doses of the
PPARα agonist in the WT mice. Such a dose-dependent effect was not
detected in the KO mice (Fig. 6A and
C). The two mouse lines presented distinct responses to PPARα
activation, where the TAS1R2 level increased and the TAS1R3 level
progressively decreased (Fig.
6B). GNAT3, the α subunit of the taste receptor G protein
involved in intracellular taste signaling, was progressively
downregulated upon PPARα activation (Fig. 6B). The activation of GNAT3
facilitated PLCβ-mediated hydrolysis of phosphatidylinositol
4,5-bisphosphate, while PLCβ expression was downregulated upon
PPARα activation (Fig. 6B).
However, the mRNA transcriptions of the aforementioned components
were not modified (Fig. S4A and
B). In contrast to the results from the WT mice, the
aforementioned modifications of the STR signaling components were
absent in the KO mice (Fig.
6D).
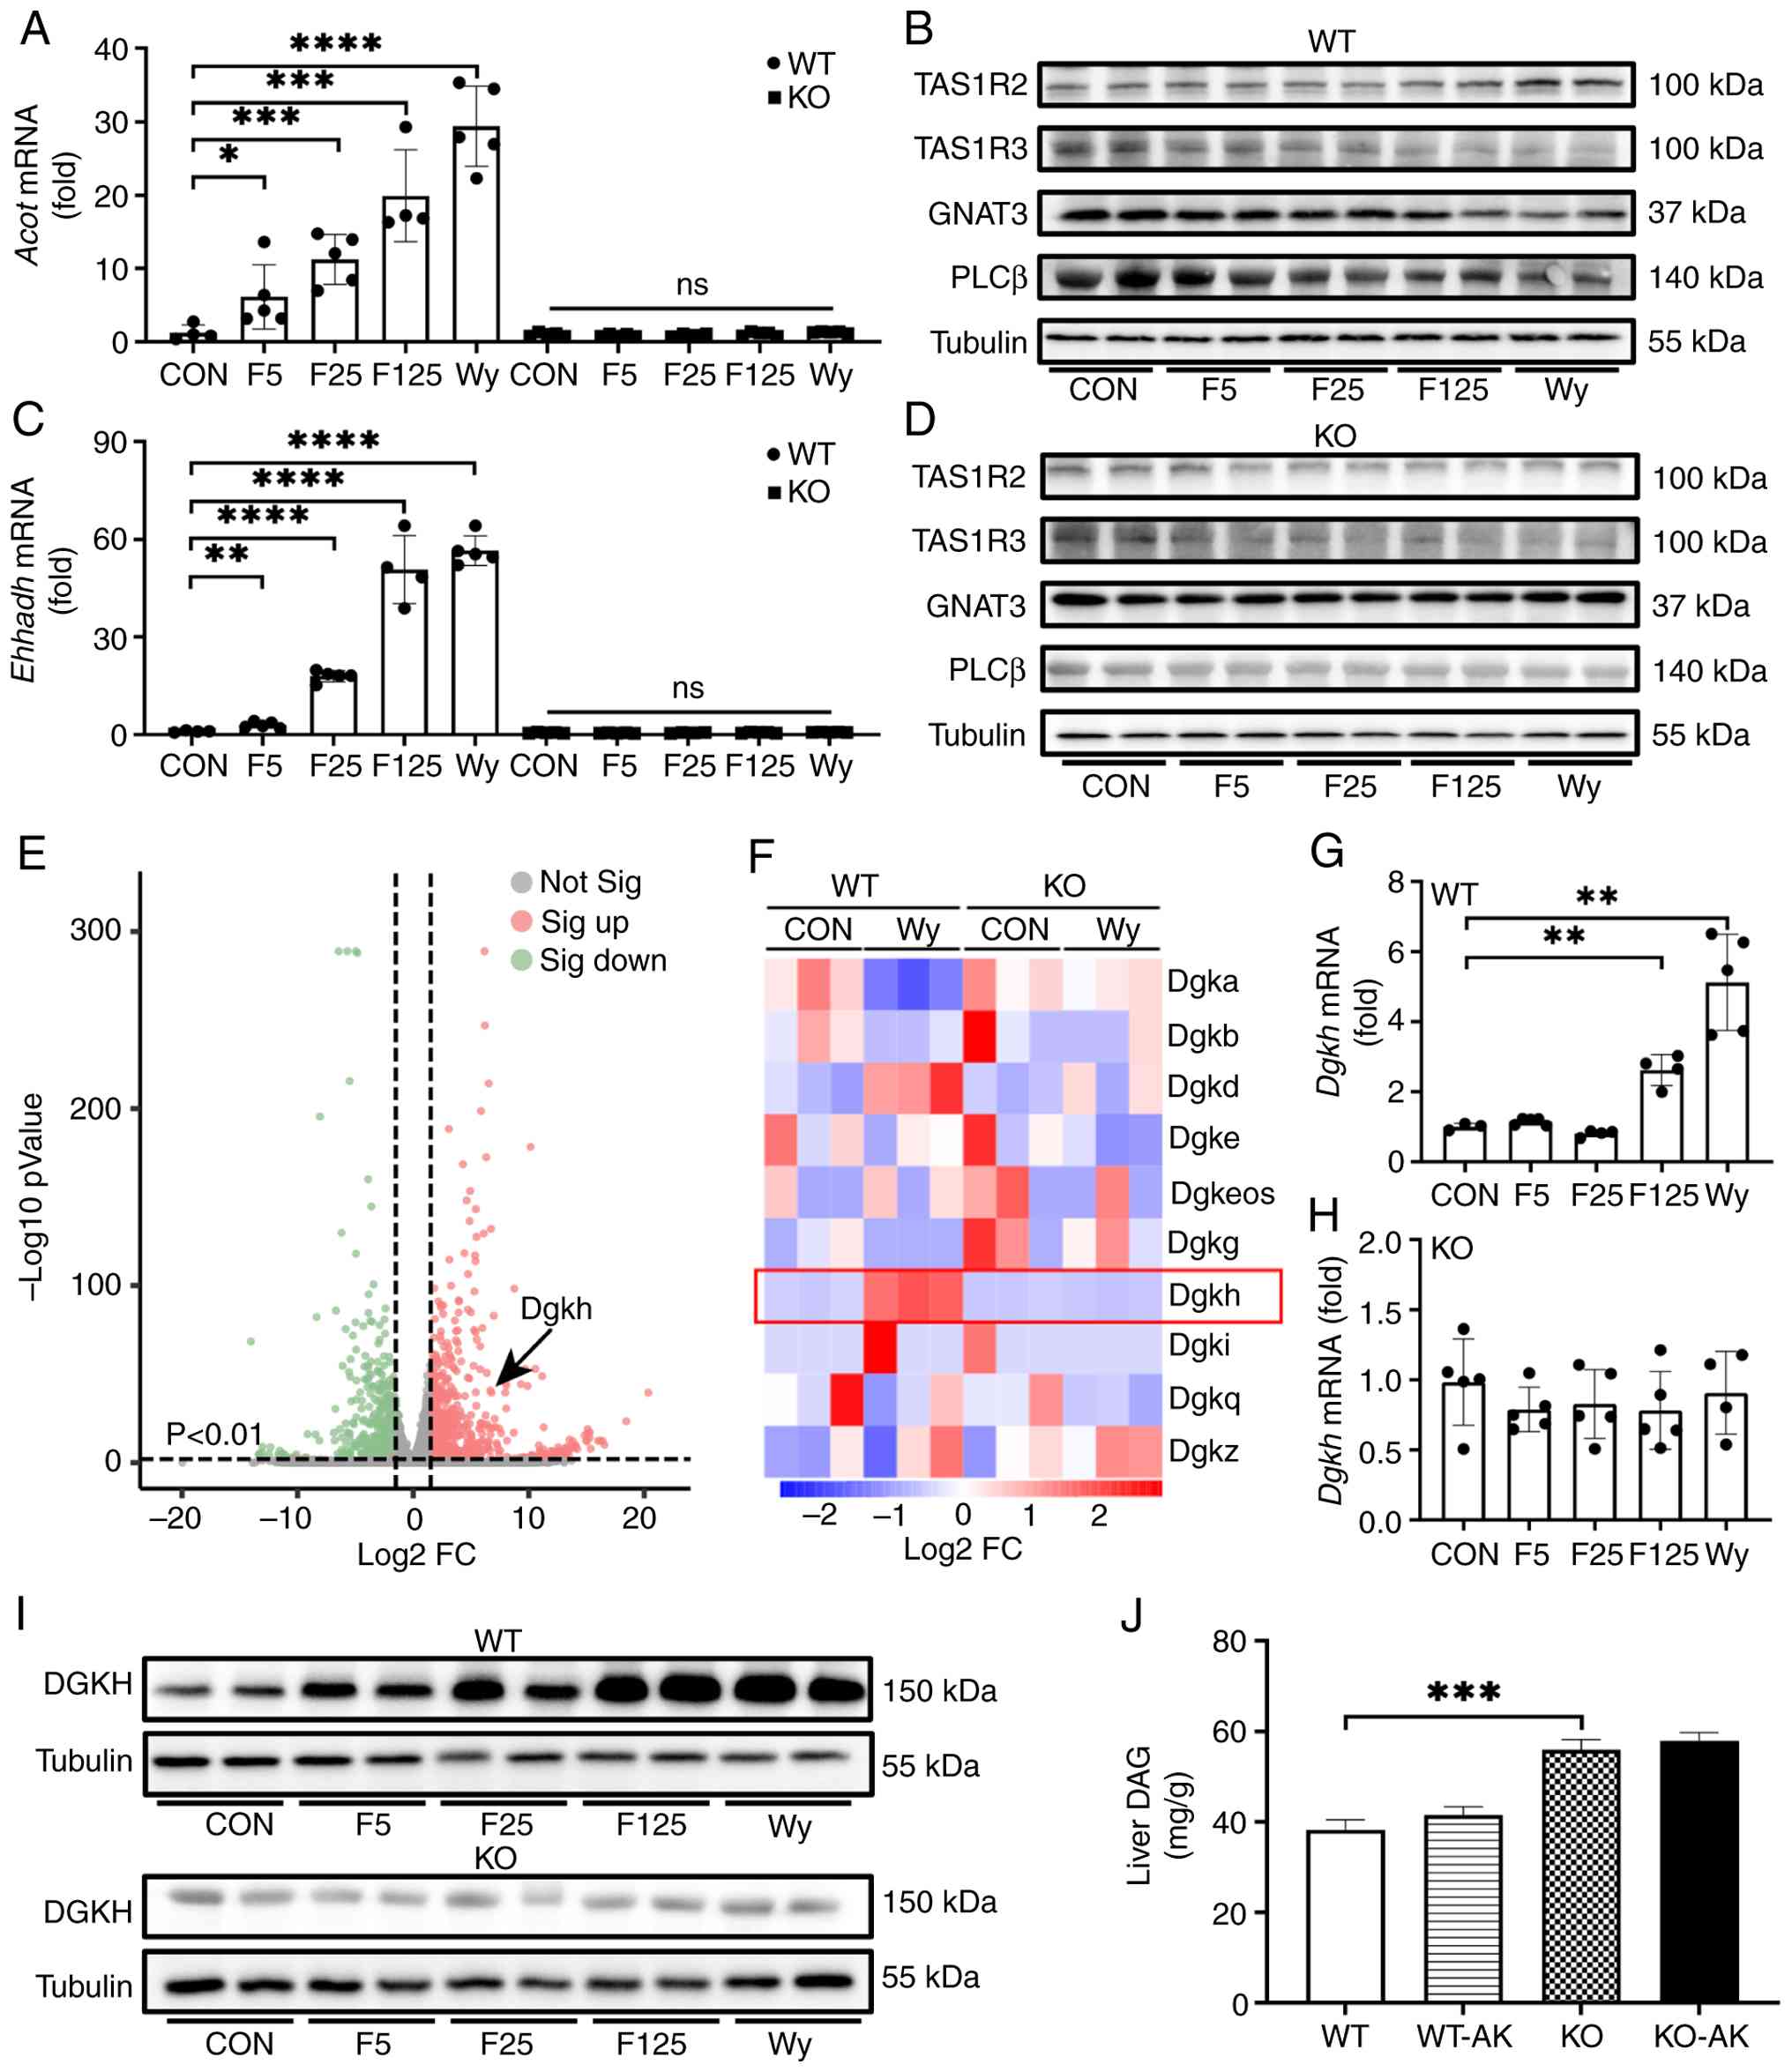 | Figure 6Multiple targets including PLCβ in
STR signaling are regulated by PPARα. Upregulation of PPARα target
genes (A) Acot1 and (C) Ehhadh by the agonists
fenofibrate and Wy-14,643. (B and D) Pharmacological regulation of
TAS1R2, TAS1R3, GNAT3, and PLCβ induced by fenofibrate and
Wy-14,643. (E) Volcano plot depicting hepatic transcriptomic
profiles of Wy14,643-treated mice vs. vehicle controls. (F) Heatmap
of diacylglycerol kinase family genes revealed Dgkh as a
potential PPARα target gene. (G) DAG levels in the liver of the WT,
WT-AK mice were lower than those in the KO and KO-AK mice. (H)
Dgkh transcription regulated by fenofibrate and Wy-14,643
detected using quantitative PCR. (I) Validation of DGKH expression
regulated by PPARα agonists fenofibrate and Wy-14,643. (J) Hepatic
DAG content in experimental groups. The data were expressed as the
means ± SEM. *P<0.05, **P<0.01,
***P<0.001, and ****P<0.0001. PLCβ,
phospholipase C beta; STR, sweet taste receptor; PPARα, peroxisome
proliferator-activated receptor PPARα, peroxisome proliferator-act;
Acot, acyl-CoA thioesterase; Ehhadh, enoyl-CoA
hydratase/3-hydroxyacyl-CoA dehydrogenase; TAS1R, taste 1
receptor member; GNAT3, G protein subunit alpha transducin 3; Wy,
Wy-14,643, a peroxisome proliferator-activated receptor alpha
agonist; Dgkh, diacylglycerol kinase eta; KO, PPARα-null;
DGKH, diacylglycerol kinase η; DAG, diacylglycerol; WT, wild-type;
CON, control group; FC, fold change; PLCβ, phospholipase C
beta. |
Dgkh, a key regulator of DAG catabolism, was
identified as the only upregulated gene among the 10 DAG kinase
family members analyzed, within the subset of 1,731 genes markedly
upregulated by PPARα agonist treatment (Fig. 6E and F). The mRNA expression
level of Dgkh exhibited a dose-dependent increase in the WT
mice following treatment with Wy14,643 (Fig. 6G). Similarly, the DGKH level was
upregulated by the activation of PPARα, which did not occur in KO
mice (Fig. 6H and I). A markedly
increased expression level of hepatic DAG was observed in the KO
mice compared with the WT mice (Fig.
6J). Therefore, PPARα regulates more targets of the STR
signaling besides the PLCβ, including TAS1R2, TAS1R3, and DGKH.
Activated PPARα meliorates AK-induced
NAFLD by inhibiting hepatic PLCβ
The therapeutic action of pharmacologically
activated PPARα in AK-induced NAFLD was designed as shown in the
flow chart (Fig. 7A). Consistent
with the aforementioned observations, hepatic steatosis was
markedly exacerbated in the WT-AK mice compared with the control
mice. AK-induced lipid accumulation was effectively rescued in the
WT-AK-F mice through pharmacological challenge with fenofibrate
(Fig. 7B). In the KO mice,
neither the pro-steatotic effect of AK nor the therapeutic response
to fenofibrate was observed, suggesting both a physiological and
pharmacological role of PPARα (Fig.
7B). Hepatic TG content was elevated by 10% in the WT-AK mice
compared with the control group. Fenofibrate challenge led to a
sharp reduction in this lipid marker compared with that in WT-AK
and this was only observed in the WT mice (Fig. 7C). In the KO mice, no increase in
TG by AK or decrease in TG by fenofibrate was observed (Fig. 7C).
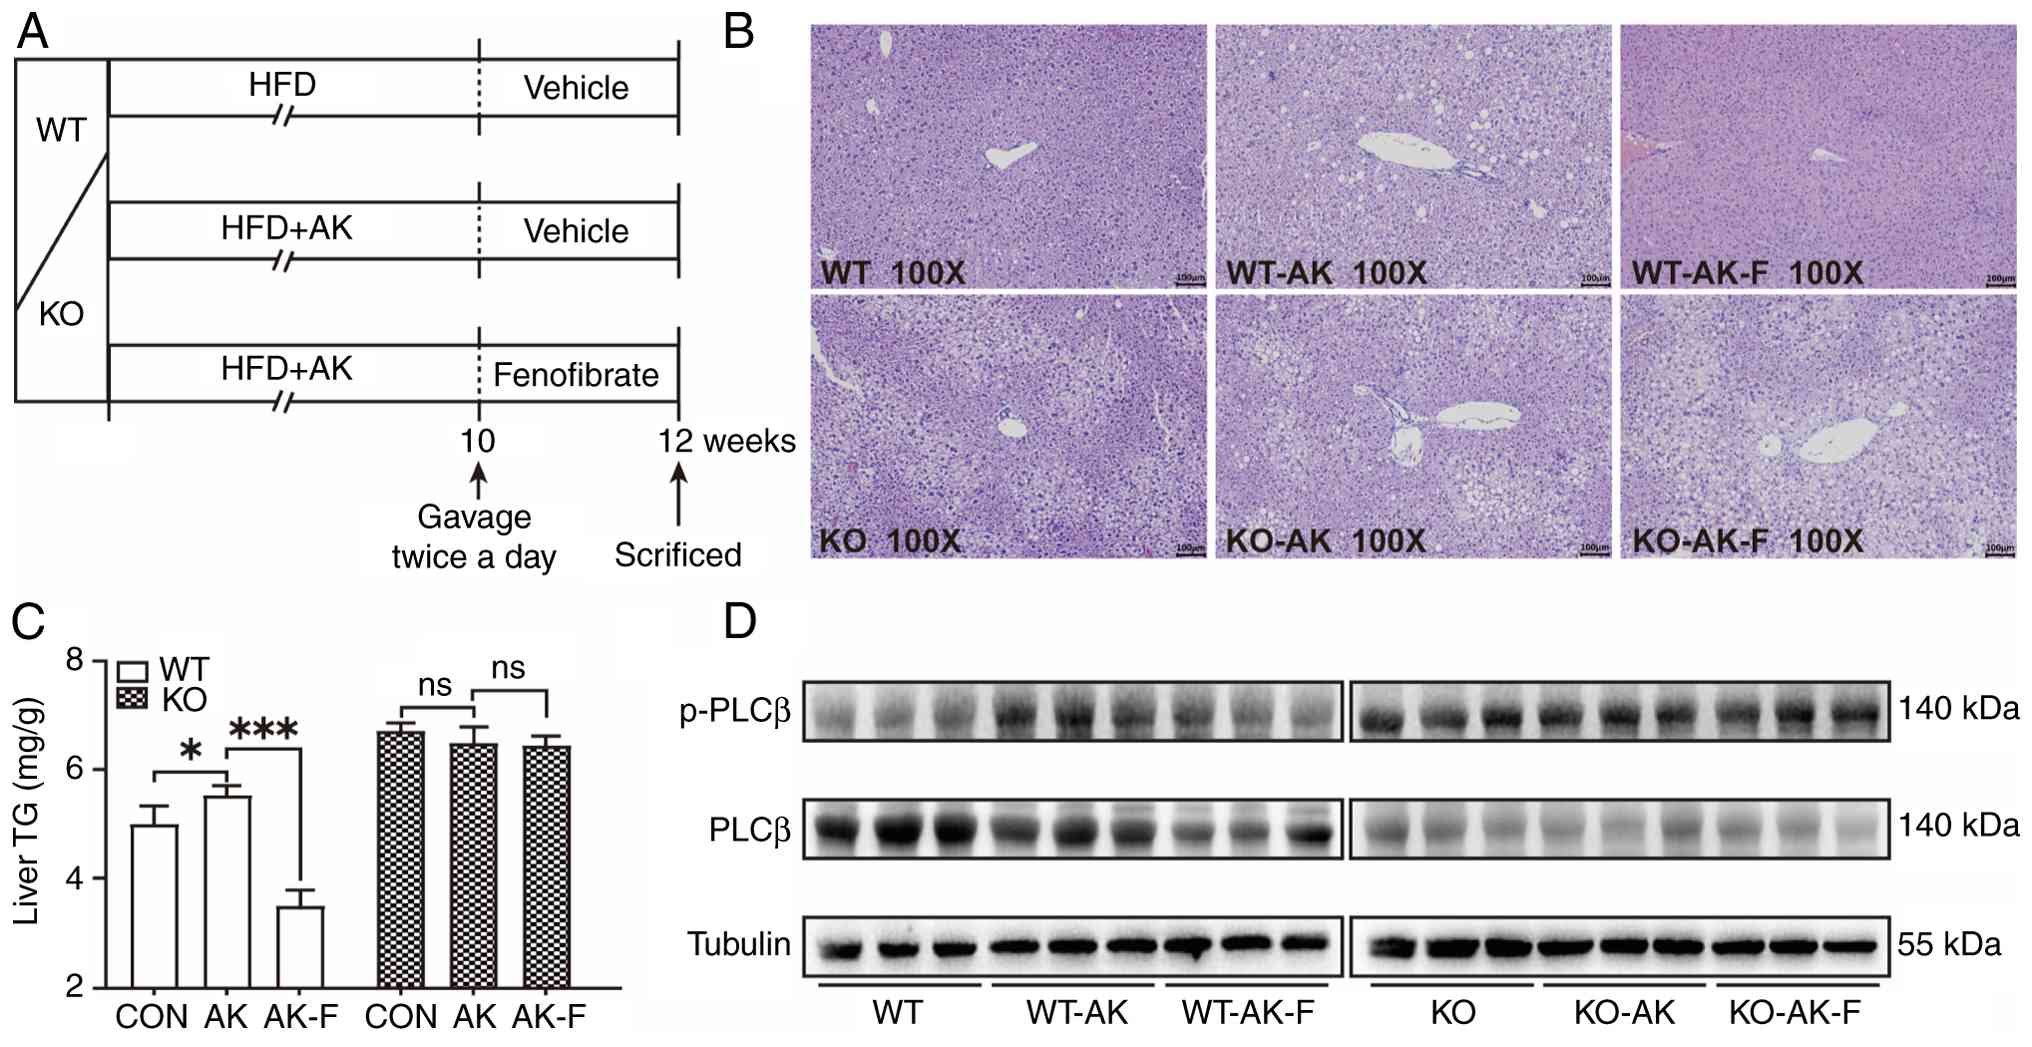 | Figure 7PLCβ is inhibited in steatosis
attenuated by pharmacologically-activated PPARα. (A) HFD-fed WT and
KO mice receiving normal water or AK supplementation (12-week
intervention, n=3). During weeks 16-18, control solvent or F (25
mg/kg) was administered twice daily via oral gavage. (B)
Hematoxylin and eosin staining of liver tissues from each group
(magnification, ×100). (C) Liver TG concentrations in each group.
(D) The PLCβ protein expression and phosphorylation status were
quantified in each group. Data were expressed as the means ± SEM.
*P<0.05, ***P<0.0001, ns. not
significant. PLCβ, phospholipase C beta; PPARα, peroxisome
proliferator-activated receptor α; HFD, high-fat diet; WT,
wild-type; KO, PPARα-null; AK, acesulfame-K; TG, triglycerides; F,
fenofibrate; p-, phosphorylated. |
In western blot analysis, a significant elevation of
phosphorylated PLCβ expression was observed in the WT-AK mice
compared with the control group (Fig. 7D). In the WT-AK-F group, both the
total PLCβ and the phosphorylated PLCβ were markedly reduced
(Fig. 7D). Notably, neither
expression levels of phosphorylated nor total PLCβ was modified in
the KO mice (Fig. 7D). These
data suggested the steatotic effect of PLCβ activation mediated by
physiological PPARα was inhibited by pharmacologically activated
PPARα.
Discussion
NNSs are conditionally endorsed by major health
authorities as short-term sugar substitutes for weight management.
NNS substitution for dietary sugars promotes weight reduction in
overweight populations with ad libitum feeding patterns (33). In the present study, the mice
ingested an average daily dose of 12 mg/kg AK (converted by the
body surface area formula). No changes in body weight gain or
biochemical markers were induced by AK treatment. However, marked
lipid vacuolization was induced with elevated hepatic triglyceride
deposition. Therefore, hepatic metabolic dysregulation was latently
induced by chronic AK intake. Based on these data, the potential
hepatometabolic risks of chronic NNS consumption should be fully
addressed to ensure the health of the public.
Mechanistically, NNSs modulate pancreatic β-cell
function through STR-mediated potentiation of insulin secretion
(31). Chronic NNS exposure
disturbs hepatic insulin signaling through chronic
hyperinsulinemia, thereby accelerating glycogen deposition while
promoting hepatic lipid storage (34). AK enhances intestinal glucose
uptake by activating STRs in the small intestine (35,36). Consequently, the pathogenesis of
AK-induced glucose intolerance likely stems from enhanced
intestinal absorption of dietary carbohydrates. Glycogen saturation
redirects excess glucose into lipogenesis, driving hepatic
steatosis independent of systemic insulin sensitivity. Fat
components, not carbohydrates, served as the primary energy
substrate in the present study. Thus, the AK-induced hepatic lipid
dysregulation in the present study may have arisen from STR
activation, not carbohydrate uptake.
PPARα, a key nuclear transcription factor, regulates
fatty acid oxidation and ketone body production in liver
mitochondria and peroxisomes during fasting (37). PPARα and cyclic AMP responsive
element binding protein synergistically regulate gluconeogenic gene
expression during fasting (38,39). As previously reported, brief
fasting caused a significant decrease of blood glucose level in the
KO mice in the present study (39). Considering the risk of shock and
adverse responses, the insulin tolerance test was not conducted in
the KO mice. Chronic exposure to AK modulated HFD-induced
transcriptional adaptation in gluconeogenic pathways, which is
strictly dependent on PPARα. The emergence of novel pan-PPAR
agonists positions them as a highly promising drug class for NAFLD
treatment (40). The present
study provided theoretical validation for their clinical
application in alleviating diet-induced NAFLD.
In STR signaling, downstream PLCβ activation
generates DAG, a second messenger that subsequently activates the
PKC family to regulate cellular processes (41,42). In the present study, TAS1R2 and
TAS1R3 downregulation after AK challenge was observed. PLCβ
phosphorylation was observed in hepatocytes following AK treatment
in both in vivo and in vitro models, indicating
AK-induced activation of STR signaling. These events were abolished
in the KO mice. Based on these findings, PPARα is supposed to be
physiologically involved in activating PLCβ in STR signaling
triggered by AK, contributing to metabolic reprogramming in the
liver.
Communication between different organelles is
facilitated by signaling pathways and membrane contact sites
(43). The role of lipids in the
morphological and functional regulation of different organelles was
highlighted (44). Lipids such
as DAG serve as key mediators in coordinating organelle morphology
and function (45). DAG
activates PKC by binding to the C1 domain, triggering PKC
translocation from the cytoplasm to the plasma membrane (46). Moreover, PPARα, a master
regulator of lipid metabolism, keeps DAG homeostasis through the
transcriptional regulation of lipid-metabolizing enzymes (47,48). In the present study,
pharmacologically activated PPARα upregulated both Dgkh mRNA
expression and DGKH protein expression levels in the WT mice. The
lower hepatic DAG levels in the WT mice compared with those in the
KO mice likely stemmed from the DGKH regulation by PPARα.
Considering the therapeutic role of PPARα agonists in NAFLD
treatment, DGKH upregulation by PPARα was hypothesized as a
pharmacological pathway balancing hepatic glucolipid metabolism.
However, the molecular mechanisms underlying PPARα-DGKH regulation
remain to be investigated.
PKCβ acts as a terminal effector of the STR
signaling pathway, driving hepatic metabolic reprogramming through
lipid partitioning and modulation of glycogen synthesis.
Dysregulated PKC signaling in the liver is associated with insulin
resistance, impaired glycogen synthesis, and pathological lipid
accumulation (49,50). In the present study,
pharmacological activation of PPARα markedly downregulated PLCβ and
GNAT3 expression levels. The GNAT3/PLCβ/PKC signaling axis emerged
as a putative mechanistic pathway through which PPARα activation
alleviated NAFLD. While the limited sample size in the present
study is acknowledged, the exceptionally large effect sizes
observed for primary outcomes lend support to its conclusions.
Since the transcription of TAS1R2, TAS1R3, PLCβ, and GNAT3 was not
modified by activated PPARα, the mechanisms of the aforementioned
regulations remain to be investigated.
Conclusively, chronic AK intake reprograms the
hepatic lipid and glucose homeostasis by activating STR signaling.
Physiologically, PPARα mediates AK-induced NAFLD by activating the
STR signaling component PLCβ. Pharmacologically, activated PPARα
suppresses STR signaling via multiple targets, especially PLCβ
(Fig. 8). Therefore, dual
actions of PPARα in AK induced NAFLD risk may occur via
bidirectional regulation of the hepatic PLCβ.
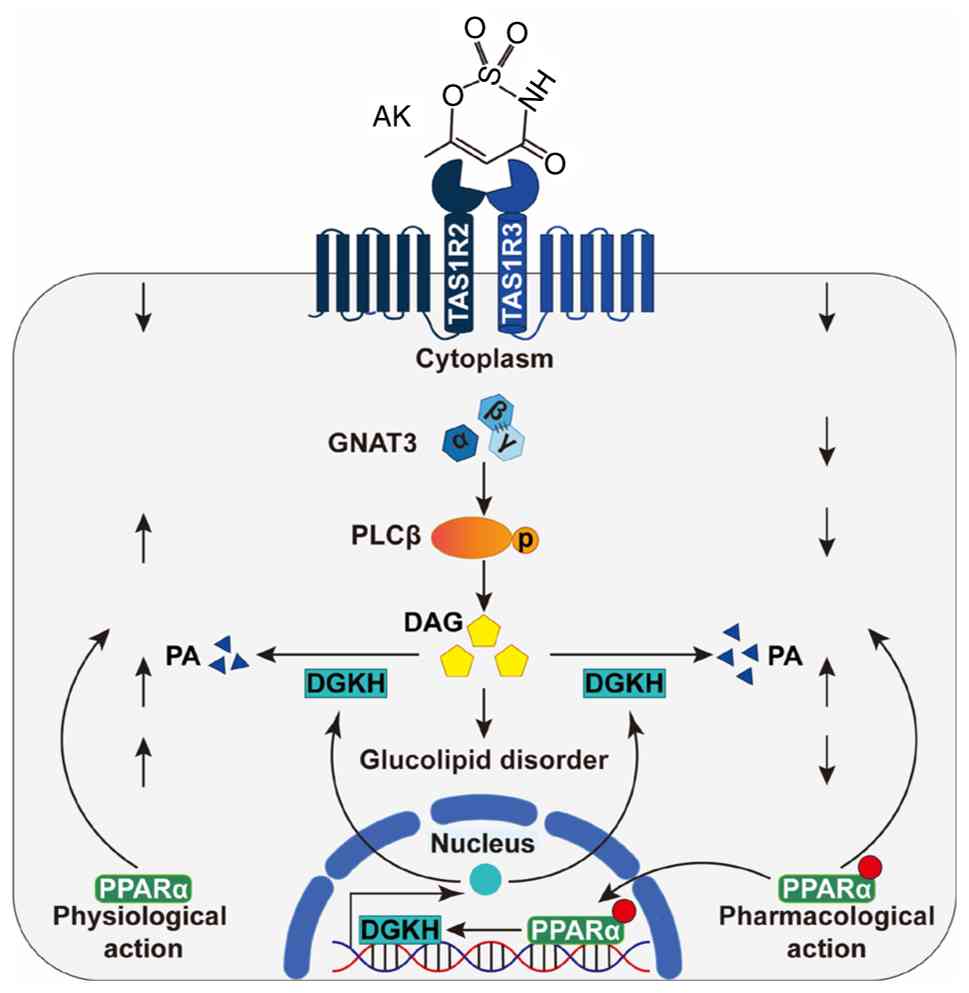 | Figure 8Proposed schematic mechanism by which
AK promotes the development of NAFLD dependent on PPARα. The
physiological actions of PPARα involve adaptive regulation of STRs,
activation of PLCβ, and transcription of DGKH, which mediates DAG
catabolism. Pharmacological actions of PPARα downregulate STR
signaling via modulation of GNAT3 and PLCβ expression. AK,
acesulfame-K; NAFLD, nonalcoholic fatty liver disease; PPARα,
peroxisome proliferator-activated receptor α; STR, sweet taste
receptor; PLCβ, phospholipase C beta; DGKH, diacylglycerol kinase
eta; DAG, diacylglycerol; GNAT3, G protein subunit alpha transducin
3; TAS1R, taste 1 receptor member; PA, phosphatidic acid. |
Supplementary Data
Availability of data and materials
The data generated in the present study may be
requested from the corresponding author. Data generated in the
present study may be found in the NCBI BioProject database under
accession number PRJNA1397340 or at the following URL: http://www.ncbi.nlm.nih.gov/bioproject/1397340.
Authors' contributions
PYL performed the animal experiments, liver
histology, data analysis and drafted the manuscript. JRX conducted
biochemical data validation, performed statistical analysis and
contributed to funding acquisition. TCQ was responsible for data
management. SSW maintained the animal models, monitored metabolic
parameters and collected tissue samples. SYY contributed to data
analysis and funding acquisition. WBS performed serum biochemical
analyses. YW assisted with data visualization, literature review
and manuscript formatting. LZC contributed to experimental protocol
optimization and provided technical support. QJZ performed
histopathological imaging and liver steatosis scoring. YYZ
conducted in vitro hepatocyte culture and preliminary
experiments. HG assisted with sample management and funding
acquisition. RF provided technical support for lentiviral
transfection experiments. ZXX performed pathological analysis. AML
and LX conceived and designed the study, supervised data analysis
and quality control, revised the manuscript and contributed to
funding acquisition. PYL, AML and LX confirmed the authenticity of
all the raw data. All authors read and approved the final
manuscript.
Ethics approval and consent to
participate
The animal procedures were approved by the Animal
Ethics and Welfare Committee of Ningbo University (approval no.
AEWC-NBU20230140; Ningbo, China).
Patient consent for publication
Not applicable.
Competing interests
The authors declare that they have no competing
interests.
Abbreviations:
|
ADI
|
acceptable daily intake
|
|
AK
|
acesulfame-K
|
|
ALT
|
alanine aminotransferase
|
|
AST
|
aspartate aminotransferase
|
|
AUC
|
area under the curve
|
|
DGKH
|
diacylglycerol kinase eta
|
|
DAG
|
diacylglycerol
|
|
FFA
|
free fatty acid
|
|
GNAT3
|
G protein subunit alpha transducin
3
|
|
HFD
|
high-fat diet
|
|
ITT
|
insulin tolerance test
|
|
KO
|
PPARα-null
|
|
NAFLD
|
nonalcoholic fatty liver disease
|
|
NASH
|
nonalcoholic steatohepatitis
|
|
NNS
|
non-nutritive sweetener
|
|
OGTT
|
oral glucose tolerance test
|
|
PKC
|
protein kinase C
|
|
PLCβ
|
phospholipase C beta
|
|
PPARα
|
peroxisome proliferator-activated
receptor α
|
|
RNA-seq
|
RNA sequencing
|
|
RT-qPCR
|
reverse transcription-quantitative
PCR
|
|
STR
|
sweet taste receptor
|
|
TAS1R2
|
taste 1 receptor member 2
|
|
TAS1R3
|
taste 1 receptor member 3
|
|
TC
|
total cholesterol
|
|
TG
|
triglycerides
|
|
WT
|
wild-type
|
Acknowledgements
The authors thank Dr Chao Dong, technician at the
Laboratory Animal Center of Ningbo University, for his technical
assistance with animal handling and experimental procedures.
Funding
The present study was supported by the Natural Science
Foundation of China (grant nos. 82270602 and 82300654), Natural
Science Foundation of Ningbo Municipality (grant nos. 2024J387,
2023J072, 2024J038 and 2022J205), Zhejiang Public Welfare
Technology Research Program (grant nos. Y24H030001 and
LTGD23H030002), International Sci-tech Cooperation Project (grant
no. 2024H001) and the K.C. Wong Magna Fund in Ningbo
University.
References
|
1
|
Feng G, Valenti L, Wong VWS, Fouad YM,
Yilmaz Y, Kim W, Sebastiani G, Younossi ZM, Hernandez-Gea V and
Zheng MH: Recompensation in cirrhosis: Unravelling the evolving
natural history of nonalcoholic fatty liver disease. Nat Rev
Gastroenterol Hepatol. 21:46–56. 2024. View Article : Google Scholar
|
|
2
|
Loomba R, Friedman SL and Shulman GI:
Mechanisms and disease consequences of nonalcoholic fatty liver
disease. Cell. 184:2537–2564. 2021. View Article : Google Scholar : PubMed/NCBI
|
|
3
|
Miao L, Targher G, Byrne CD, Cao YY and
Zheng MH: Current status and future trends of the global burden of
MASLD. Trends Endocrinol Metab. 35:697–707. 2024. View Article : Google Scholar : PubMed/NCBI
|
|
4
|
Zhao L, Zhang X, Coday M, Garcia DO, Li X,
Mossavar-Rahmani Y, Naughton MJ, Lopez-Pentecost M, Saquib N,
Shadyab AH, et al: Sugar-sweetened and artificially sweetened
beverages and risk of liver cancer and chronic liver disease
mortality. JAMA. 330:537–546. 2023. View Article : Google Scholar : PubMed/NCBI
|
|
5
|
Yki-Järvinen H, Luukkonen PK, Hodson L and
Moore JB: Dietary carbohydrates and fats in nonalcoholic fatty
liver disease. Nat Rev Gastroenterol Hepatol. 18:770–786. 2021.
View Article : Google Scholar : PubMed/NCBI
|
|
6
|
Jung S, Bae H, Song WS and Jang C: Dietary
fructose and fructose-induced pathologies. Annu Rev Nutr. 42:45–66.
2022. View Article : Google Scholar : PubMed/NCBI
|
|
7
|
Ruiz-Ojeda FJ, Plaza-Díaz J, Sáez-Lara MJ
and Gil A: Effects of sweeteners on the gut microbiota: A review of
experimental studies and clinical trials. Adv Nutr. 10(Suppl 1):
S31–S48. 2019. View Article : Google Scholar : PubMed/NCBI
|
|
8
|
Magnuson BA, Carakostas MC, Moore NH,
Poulos SP and Renwick AG: Biological fate of low-calorie
sweeteners. Nutr Rev. 74:670–689. 2016. View Article : Google Scholar : PubMed/NCBI
|
|
9
|
U.S. Food & Drug Administration (FDA):
Aspartame and other sweeteners in food. FDA; Silver Spring, MD:
2024
|
|
10
|
Spherical Insights: Global Food Sweetener
Market Insights Forecasts to 2033. Spherical Insights LLP.; Mason,
OH: 2025, https://www.sphericalinsights.com/reports/food-sweetener-market.
|
|
11
|
Suez J, Cohen Y, Valdés-Mas R, Mor U,
Dori-Bachash M, Federici S, Zmora N, Leshem A, Heinemann M,
Linevsky R, et al: Personalized microbiome-driven effects of
non-nutritive sweeteners on human glucose tolerance. Cell.
185:3307–3328.e19. 2022. View Article : Google Scholar : PubMed/NCBI
|
|
12
|
Chowdhury CR and Havlik J: Beyond
sweetness: A review of the health and safety of acesulfame-K. Food
Chem. 499:1472902026. View Article : Google Scholar
|
|
13
|
Witkowski M, Nemet I, Alamri H, Wilcox J,
Gupta N, Nimer N, Haghikia A, Li XS, Wu Y, Saha PP, et al: The
artificial sweetener erythritol and cardiovascular event risk. Nat
Med. 29:710–718. 2023. View Article : Google Scholar : PubMed/NCBI
|
|
14
|
Wu W, Sui W, Chen S, Guo Z, Jing X, Wang
X, Wang Q, Yu X, Xiong W, Ji J, et al: Sweetener aspartame
aggravates atherosclerosis through insulin-triggered inflammation.
Cell Metab. 37:1075–1088.e7. 2025. View Article : Google Scholar : PubMed/NCBI
|
|
15
|
Zani F, Blagih J, Gruber T, Buck MD, Jones
N, Hennequart M, Newell CL, Pilley SE, Soro-Barrio P, Kelly G, et
al: The dietary sweetener sucralose is a negative modulator of T
cell-mediated responses. Nature. 615:705–711. 2023. View Article : Google Scholar : PubMed/NCBI
|
|
16
|
Ahmad R and Dalziel JE: G protein-coupled
receptors in taste physiology and pharmacology. Front Pharmacol.
11:5876642020. View Article : Google Scholar
|
|
17
|
Nelson G, Hoon MA, Chandrashekar J, Zhang
Y, Ryba NJ and Zuker CS: Mammalian sweet taste receptors. Cell.
106:381–390. 2001. View Article : Google Scholar : PubMed/NCBI
|
|
18
|
Behrens M: Pharmacology of TAS1R2/TAS1R3
receptors and sweet taste. The Pharmacology of Taste. Handbook of
Experimental Pharmacology. 155–175. 2022.
|
|
19
|
Neiers F, Canivenc-Lavier MC and Briand L:
What does diabetes 'taste' like? Curr Diab Rep. 16:492016.
View Article : Google Scholar
|
|
20
|
Ercin M, Gezginci-Oktayoglu S and Bolkent
S: Exendin-4 inhibits small intestinal glucose sensing and
absorption through repression of T1R2/T1R3 sweet taste receptor
signalling in streptozotocin diabetic mice. Transl Res. 246:87–101.
2022. View Article : Google Scholar : PubMed/NCBI
|
|
21
|
Ubeysinghe S, Wijayaratna D, Kankanamge D
and Karunarathne A: Molecular regulation of PLCβ signaling.
Integrated Methods in Protein Biochemistry: Part C. Methods in
Enzymology. 17–52. 2023.
|
|
22
|
Pawlak M, Lefebvre P and Staels B:
Molecular mechanism of PPARα action and its impact on lipid
metabolism, inflammation and fibrosis in non-alcoholic fatty liver
disease. J Hepatol. 62:720–733. 2015. View Article : Google Scholar
|
|
23
|
Gross B, Pawlak M, Lefebvre P and Staels
B: PPARs in obesity-induced T2DM, dyslipidaemia and NAFLD. Nat Rev
Endocrinol. 13:36–49. 2017. View Article : Google Scholar
|
|
24
|
Chang E, Zhu Y, Wei W, Huai J, Lv T, Lou Y
and Zhou X: Chiglitazar, a PPAR pan-agonist: Impacts on type 2
diabetes mellitus and multi-system metabolic regulation-a review.
Biomed Pharmacother. 193:1188502025. View Article : Google Scholar
|
|
25
|
Palacios Girón KM, Hernandez Nazara ZH,
Maldonado-González M, Martínez-López E, Sánchez Muñoz MP, Bautista
López CA, Aguiñaga MSA, Dominguez-Rosales JA, Vargas-Guerrero B and
Ruíz-Madrigal B: Role of ChREBP-PPARα-FGF21 axis in metabolic
dysfunction of MASLD. Int J Mol Sci. 26:114252025. View Article : Google Scholar
|
|
26
|
Sheetz MJ and King GL: Molecular
understanding of hyperglycemia's adverse effects for diabetic
complications. JAMA. 288:2579–2588. 2002. View Article : Google Scholar : PubMed/NCBI
|
|
27
|
Reagan-Shaw S, Nihal M and Ahmad N: Dose
translation from animal to human studies revisited. FASEB J.
22:659–661. 2008. View Article : Google Scholar
|
|
28
|
Hua H, Dai M, Luo Y, Lin H, Xu G, Hu X, Xu
L, Zhang H, Tang Z, Chang L, et al: Basal PPARα inhibits bile acid
metabolism adaptation in chronic cholestatic model induced by
α-naphthylisothiocyanate. Toxicol Lett. 300:31–39. 2019. View Article : Google Scholar
|
|
29
|
Luo J, Yan Z, Dai M, Xu L, Zhang H, Xi Y,
Yang J and Liu A: Down-regulation of hepatic CLOCK by PPARα is
involved in inhibition of NAFLD. J Mol Med (Berl). 101:139–149.
2023. View Article : Google Scholar
|
|
30
|
Wang X, Luo J, Lu Z, Fang S, Sun M, Luo W,
Shen J, Liu A and Ye H: Therapeutic effect of fenofibrate for
non-alcoholic steatohepatitis in mouse models is dependent on
regime design. Front Pharmacol. 14:11904582023. View Article : Google Scholar : PubMed/NCBI
|
|
31
|
Kojima I and Nakagawa Y: The role of the
sweet taste receptor in enteroendocrine cells and pancreatic
β-cells. Diabetes Metab J. 35:451–457. 2011. View Article : Google Scholar : PubMed/NCBI
|
|
32
|
Livak KJ and Schmittgen TD: Analysis of
relative gene expression data using real-time quantitative PCR and
the 2(-Delta Delta C(T)) method. Methods. 25:402–408. 2001.
View Article : Google Scholar
|
|
33
|
Laviada-Molina H, Molina-Segui F,
Pérez-Gaxiola G, Cuello-García C, Arjona-Villicaña R,
Espinosa-Marrón A and Martinez-Portilla RJ: Effects of nonnutritive
sweeteners on body weight and BMI in diverse clinical contexts:
Systematic review and meta-analysis. Obes Rev. 21:e130202020.
View Article : Google Scholar : PubMed/NCBI
|
|
34
|
Allende DS, Gawrieh S, Cummings OW, Belt
P, Wilson L, Van Natta M, Behling CA, Carpenter D, Gill RM, Kleiner
DE, et al: Glycogenosis is common in nonalcoholic fatty liver
disease and is independently associated with ballooning, but lower
steatosis and lower fibrosis. Liver Int. 41:996–1011. 2021.
View Article : Google Scholar :
|
|
35
|
Hindmarsh JT, Kilby D and Wiseman G:
Effect of amino acids on sugar absorption. J Physiol. 186:166–174.
1966. View Article : Google Scholar : PubMed/NCBI
|
|
36
|
Mace OJ, Affleck J, Patel N and Kellett
GL: Sweet taste receptors in rat small intestine stimulate glucose
absorption through apical GLUT2. J Physiol. 582:379–392. 2007.
View Article : Google Scholar : PubMed/NCBI
|
|
37
|
Korenfeld N, Charni-Natan M, Bruse J,
Goldberg D, Marciano-Anaki D, Rotaro D, Gorbonos T,
Radushkevitz-Frishman T, Polizzi A, Nasereddin A, et al: Repeated
fasting events sensitize enhancers, transcription factor activity
and gene expression to support augmented ketogenesis. Nucleic Acids
Res. 53:gkae11612025. View Article : Google Scholar :
|
|
38
|
Kim H, Zheng Z, Walker PD, Kapatos G and
Zhang K: CREBH maintains circadian glucose homeostasis by
regulating hepatic glycogenolysis and gluconeogenesis. Mol Cell
Biol. 37:e00048–17. 2017. View Article : Google Scholar : PubMed/NCBI
|
|
39
|
Kersten S, Seydoux J, Peters JM, Gonzalez
FJ, Desvergne B and Wahli W: Peroxisome proliferator-activated
receptor alpha mediates the adaptive response to fasting. J Clin
Invest. 103:1489–1498. 1999. View Article : Google Scholar : PubMed/NCBI
|
|
40
|
Lee B, Ghumman U, Pedicone LD, Aldana AG
and Lawitz E: Prospects of late-stage development agents in the
treatment of metabolic dysfunction-associated steatohepatitis. Clin
Mol Hepatol. 31:1167–1196. 2025. View Article : Google Scholar : PubMed/NCBI
|
|
41
|
Tan Y and Pang X: Olfactory-gustatory
cross-modal integration: Mechanisms of aroma-induced sweetness
enhancement, sensory evaluation methodologies, neuroimaging
evidence and advances in influencing factors. J Adv Res.
S2090-1232(25)00745-32025.Epub ahead of print. PubMed/NCBI
|
|
42
|
Kawano T, Inokuchi J, Eto M, Murata M and
Kang JH: Activators and inhibitors of protein kinase C (PKC): Their
applications in clinical trials. Pharmaceutics. 13:17482021.
View Article : Google Scholar : PubMed/NCBI
|
|
43
|
Domingues N, Pires J, Milosevic I and
Raimundo N: Role of lipids in interorganelle communication. Trends
Cell Biol. 35:46–58. 2025. View Article : Google Scholar
|
|
44
|
Sarmento MJ, Llorente A, Petan T, Khnykin
D, Popa I, Nikolac Perkovic M, Konjevod M and Jaganjac M: The
expanding organelle lipidomes: Current knowledge and challenges.
Cell Mol Life Sci. 80:2372023. View Article : Google Scholar : PubMed/NCBI
|
|
45
|
Ulch BA, Clews AC, Reisiger CA, Zhu LH,
Mullen RT, Kimber MS and Xu Y: Properties and biochemistry of
phosphatidylcholine: Diacylglycerol cholinephosphotransferase. Prog
Lipid Res. 101:1013612025.Epub ahead of print. View Article : Google Scholar : PubMed/NCBI
|
|
46
|
Katan M and Cockcroft S: Phospholipase C
families: Common themes and versatility in physiology and
pathology. Prog Lipid Res. 80:1010652020. View Article : Google Scholar : PubMed/NCBI
|
|
47
|
Finck BN, Lehman JJ, Leone TC, Welch MJ,
Bennett MJ, Kovacs A, Han X, Gross RW, Kozak R, Lopaschuk GD and
Kelly DP: The cardiac phenotype induced by PPARalpha overexpression
mimics that caused by diabetes mellitus. J Clin Invest.
109:121–130. 2002. View Article : Google Scholar : PubMed/NCBI
|
|
48
|
Montaigne D, Butruille L and Staels B:
PPAR control of metabolism and cardiovascular functions. Nat Rev
Cardiol. 18:809–823. 2021. View Article : Google Scholar : PubMed/NCBI
|
|
49
|
Shu Y, Hassan F, Ostrowski MC and Mehta
KD: Role of hepatic PKCβ in nutritional regulation of hepatic
glycogen synthesis. JCI Insight. 6:e1490232021. View Article : Google Scholar
|
|
50
|
Zheng ZG, Xu YY, Liu WP, Zhang Y, Zhang C,
Liu HL, Zhang XY, Liu RZ, Zhang YP, Shi MY, et al: Discovery of a
potent allosteric activator of DGKQ that ameliorates
obesity-induced insulin resistance via the sn-1,2-DAG-PKCε
signaling axis. Cell Metab. 35:101–117.e11. 2023. View Article : Google Scholar
|