Introduction
Colorectal cancer (CRC) is the third most commonly
diagnosed malignancy worldwide and ranks as the second leading
cause of cancer-related death, posing a significant global health
burden (1). The incidence of CRC
continues to rise, particularly in countries undergoing rapid
industrialization and lifestyle changes (1). Despite advancements in screening
programs and therapeutic strategies, the 5-year survival rate for
patients with advanced or metastatic CRC remains ~16% (2,3).
Current treatment modalities include surgical resection,
chemotherapy (such as 5-fluorouracil-based regimens), radiotherapy
and targeted therapies (such as anti-vascular endothelial growth
factor and anti-epidermal growth factor receptor agents) (4). In recent years, immunotherapies,
particularly immune checkpoint inhibitors targeting programmed cell
death protein 1 and programmed death-ligand 1, have emerged as a
promising option, especially for patients with high microsatellite
instability or deficient mismatch repair tumors (4,5).
However, these approaches are not universally effective; their
efficacy is often limited by acquired resistance, genetic
heterogeneity of the tumor and adverse side effects. Moreover,
mutations in oncogenes and tumor suppressors such as KRAS, TP53 and
APC, as well as aberrant activation of signaling pathways including
Wnt/β-catenin, PI3K/AKT/mTOR and MAPK, are frequently implicated in
disease progression and treatment resistance (6-8).
These complexities underscore the urgent need for complementary
strategies targeting alternative molecular mechanisms to enhance
therapeutic efficacy and reduce tumor recurrence.
In recent years, increasing attention has been
directed toward the use of natural products and herbal medicines in
cancer therapy. Owing to their multi-targeted mechanisms, lower
toxicity profiles and historical usage in traditional medicine
systems, natural compounds offer promising candidates for both
chemoprevention and adjuvant therapy (9,10). Among these, Antrodia
cinnamomea (commonly known as Niu-chang-chih), a medicinal
fungus endemic to Taiwan, has gained significant scientific
interest due to its wide spectrum of pharmacological activities,
including anti-inflammatory, antioxidant, hepatoprotective,
immunomodulatory and notably, anticancer effects (11). To date, research on A.
cinnamomea has predominantly focused on its crude extracts,
which have demonstrated inhibitory effects against various cancer
types via multiple mechanisms, such as CHOP/tribbles pseudokinase 3
(TRB3)/AKT/mTOR pathway activation, suppression of NF-κB and c-Myc
signaling and modulation of epithelial-mesenchymal transition (EMT)
and tumor stemness (12-15). Despite these findings, research
on the bioactivity of purified, structurally-defined compounds from
A. cinnamomea remains limited, especially in the context of
CRC. Among the active constituents, triterpenoids (particularly
antcins) have shown anticancer potential across multiple
malignancies, including oral, breast, pancreatic, prostate,
ovarian, cervical and osteosarcoma models (16-18), and a few recent studies have
begun to examine their effects in CRC. For example, antrodin C was
reported to induce G1-phase arrest and apoptosis in HCT116 cells
through reactive oxygen species (ROS)/AKT/ERK/p38 signaling and to
suppress tumor growth in xenograft models (19). However, these studies remain
largely descriptive, focusing on phenotypic outcomes such as
apoptosis or cell-cycle arrest without elucidating the broader
signaling networks or direct molecular targets involved.
The present study evaluated the anticancer potential
of 4-acetylantrocamol LT3 (LT4), a purified triterpenoid derivative
isolated from the mycelium of A. cinnamomea. Using human CRC
HCT116 cells as a model, functional assays were performed in
combination with transcriptomic profiling, protein expression
analysis and molecular docking to elucidate the underlying
mechanisms of LT4 action. The findings revealed novel insights into
the signaling networks affected by LT4 and suggest that this
compound may serve as a promising candidate for further development
in CRC therapy.
Materials and methods
Preparation and purification of A.
cinnamomea-derived compounds
In total, 4 compounds were isolated from A.
cinnamomea, including dehydroeburicoic acid (DeEA) and
dehydrosulphurenic acid (DSA) from the fruiting body and
4-acetylantroquinonol B (4AAQB) and LT4 from the mycelium. For DeEA
and DSA, ethanolic extracts of the fruiting body were sequentially
partitioned into hexane, ethyl acetate, dichloromethane and aqueous
layers. Each layer was analyzed by reverse-phase high-performance
liquid chromatography (HPLC) using aa Hitachi L-7100 instrument
(Hitachi, Ltd.) equipped with a photodiode array detector (L-2400),
a pump (L-2130) and an autosampler (L-2200). Separation was
performed on a C18 column (Lichro CART® RP-18e; 4.0×250
mm i.d.; 5 μm; Merck KGaA) with the column temperature
maintained at 25°C. The mobile phase consisted of solvent A (0.1%
formic acid in water) and solvent B (acetonitrile). The elution
program was as follows: 0-3 min (A:B, 70:30 to 60:40), 3-15 min
(A:B, 60:40 to 42:58), 15-21 min (A:B, 42:58), 21-26 min (A:B,
42:58 to 35:65), 26-35 min (A:B 35:65 to 0:100) and 35-50 min
(0:100). The flow rate was 0.8 ml/min, the injection volume (sample
quantity) was 10 μl and detection was performed at 254 nm.
No internal standard was used. Based on the retention times, DSA
and DeEA were identified at ~29 min and 45 min, respectively
(Fig. S1A).
To isolate 4AAQB and LT4, the mycelial extract was
subjected to reverse-phase HPLC using a Lichro CART®
RP-18e column (4.0×250 mm, 5 μm; Merck KGaA) on a Hitachi
L-7100 system equipped with a UV detector (L-7455). The column
temperature was maintained at 25°C. The mobile phase was a gradient
of water-methanol: 40:60 for 15 min, 20:80 for 15 min and 0:100 for
10 min. The flow rate was 1.0 ml/min, the injection volume was 10
μl and the detection wavelength was 254 nm. No internal
standard was used. The retention times were 14.92-15.35 min for
4AAQB, 17.93-17.97 min for antrocamol LT3 and 18.53-18.64 min for
LT4, as confirmed by comparison with authentic standards (Fig. S1B-E).
Cell culture and authentication
Human CRC cell lines, HCT116 (KRAS mutant), HT-29
and Caco-2, were purchased from the American Type Culture
Collection (ATCC; HCT116, CCL-247; HT-29, HTB-38; Caco-2, HTB-37).
Cells were cultured in Dulbecco's Modified Eagle Medium (Gibco;
Thermo Fisher Scientific, Inc.) supplemented with 10% fetal bovine
serum (Gibco; Thermo Fisher Scientific, Inc.) and 1%
penicillin-streptomycin and maintained in a humidified incubator at
37°C with 5% CO2. For routine experiments, cells were
seeded at a density of 3×10⁵ to 6×10⁵ cells
per 10-cm culture dish, unless otherwise specified. According to
Cellosaurus, the HT-29 cell line (CVCL_0320) was originally derived
from a rectosigmoid adenocarcinoma and should therefore be
classified as a CRC cell line.
The cell lines were not independently authenticated
in our laboratory but were obtained directly from ATCC and used
within 6 months after resuscitation. Mycoplasma contamination was
routinely monitored using PCR-based assays and found to be negative
throughout the study.
Cell viability assay
HCT116, HT29 and Caco2 cells were seeded into
96-well plates at a density of 5×10³ cells/well and
allowed to adhere overnight. The next day, the cells were treated
with varying concentrations (0.1, 1, 3 or 10 μM) of DeEA,
DSA, 4AAQB or LT4 for 24, 48 and 72 h. Cell viability was assessed
using the Cell Counting Kit-8 (CCK-8; Dojindo Laboratories, Inc.).
After treatment, CCK-8 solution was added to each well and the
plates were incubated at 37°C in a humidified atmosphere containing
5% CO2 for 30 min. Absorbance was measured at 450/650 nm
using a microplate reader (SpectraMax 190; Molecular Devices, LLC).
Experiments were performed in triplicate.
Colony formation assay
HCT116 cells were seeded into 6-well plates at a
density of 300 cells/well and allowed to adhere overnight at 37°C
in a humidified incubator with 5% CO2. The following
day, the cells were treated with LT4 at concentrations of 0, 0.1,
1, 3 or 10 μM and cultured for 10 days under the same
conditions (37°C, 5% CO2). Colonies were fixed with 95%
ethanol for 30 min at room temperature and stained with 1% crystal
violet for another 30 min at room temperature. Excess dye was
washed off with phosphate-buffered saline (PBS) and the plates were
air-dried for 2-3 days. The colonies were imaged and quantification
was performed by manual counting. A colony was defined as a cluster
containing ≥50 cells.
Wound healing assay
HCT116 cells were seeded at 3×10⁵
cells/well into 6-well plates and cultured to near confluence. A
uniform scratch was created using a 200 μl pipette tip and
the cells were gently washed with PBS to remove debris. LT4 was
added at final concentrations of 0, 0.1, 1, 3 or 10 μM in
fresh serum-free medium. Images were captured using an inverted
light microscope (phase-contrast) and the same microscopic fields
were imaged at 0, 24, 48 and 72 h to monitor wound closure and cell
migration. Wound closure was quantified using ImageJ (National
Institutes of Health; v2.14.0/1.54f) by measuring the wound width
at 0 h and at each indicated time point. For each image, the wound
width was measured at multiple evenly spaced positions across the
scratch and averaged to obtain a single value per well. The healing
rate was calculated as (W0-Wt)/W0,
where W0 is the wound width at 0 h and Wt is
the wound width at the indicated time.
RNA extraction
HCT116 cells were cultured in six 10 cm dishes until
reaching confluence. Cells were divided into two groups: Three
dishes for the control group and three dishes for the LT4-treated
group (10 μM). The control group received an equal volume of
DMSO [final concentration, 0.1% (v/v)] corresponding to the LT4
solvent. After 24 h of treatment, cells were washed 1-2 times with
PBS to remove residual medium and avoid interference with the
NucleoZOL reagent (Macherey-Nagel GmbH & Co. KG). Subsequently,
at least 1 ml of NucleoZOL was added to each dish and the cells
were scraped using a cell scraper. The lysates were transferred to
centrifuge tubes, sealed with Parafilm to prevent leakage and
stored at −20°C or −80°C.
For RNA purification, 400 μl of DEPC-treated
water (NZYtech) was added per 1 ml of NucleoZOL lysate, followed by
vigorous shaking for 15 sec and incubation at room temperature
(18-25°C) for 5-15 min. Samples were centrifuged at 12,000 × g for
15 min at 4°C to separate the RNA-containing supernatant from the
DNA/protein pellet. The supernatant was transferred to a new tube
and 5 μl of 4-bromoanisole was added per 1 ml of supernatant
for phase separation. After mixing for 15 sec and incubating at
room temperature for 35 min, samples were centrifuged at 12,000 × g
for 10 min at 4°C. The RNA-containing supernatant was then mixed
with an equal volume of isopropanol to precipitate RNA, incubated
at room temperature for 10 min and centrifuged at 12,000 × g for 10
min. The RNA pellet was washed twice with 75% ethanol, centrifuged
at 4,000-8,000 × g for 1-3 min at 4°C and air-dried briefly.
Finally, RNA was dissolved in DEPC-treated water to achieve a
concentration of 1-2 μg/μl and incubated at room
temperature for 2-5 min to ensure complete dissolution.
RNA sequencing (RNA-seq) and
bioinformatic analysis
RNA-seq was performed by Genomics, BioSci & Tech
Co., Ltd. (New Taipei City, Taiwan). Library preparation followed
the TruSeq Stranded mRNA Library Prep Kit protocol (Illumina,
Inc.). Briefly, 1 μg of total RNA was used to isolate mRNA
using oligo(dT) magnetic beads, followed by fragmentation and
synthesis of first and second-strand cDNA. After end repair, 3'
adenylation and adaptor ligation, libraries were amplified by PCR
and purified using AMPure XP beads (Beckman Coulter, Inc.). Library
quality was assessed using the Agilent 2100 BioAnalyzer, and
quantification was performed using quantitative PCR. Sequencing was
conducted on the Illumina NovaSeq X Plus platform using a NovaSeq X
Series 10B Reagent Kit (300-cycle; Illumina, Inc.) to generate
150-bp paired-end reads. The final pooled library was diluted and
loaded at an average concentration of 110 pM according to the
manufacturer's recommendations. RNA-seq data have been deposited in
the NCBI Gene Expression Omnibus under accession no. GSE299648.
Raw sequencing data were converted to FASTQ format
using bcl2fastq (v2.20.0; Illumina, Inc.). Sequencing reads were
processed using fastp (v0.20.0) to remove low-quality reads and
adapters (20). Ribosomal RNA
filtering is an optional step and was not performed in this study
(that is, no SortMeRNA filtering). Trimmed sequences were aligned
to the human reference genome GRCh38 (RefSeq assembly:
GCF_000001405.40; https://www.ncbi.nlm.nih.gov/datasets/genome/GCF_000001405.40/)
using HISAT2 (v2.1.0; Johns Hopkins University; https://daehwankimlab.github.io/hisat2/). The
resulting SAM files were converted to BAM format using SAMtools
(v1.9; SAMtools project; https://www.htslib.org/). Gene-level read counts were
calculated using featureCounts (Subread v2.0.1; Subread package;
http://subread.sourceforge.net/) and
normalized to transcripts per million. Differentially expressed
genes (DEGs) were identified using DESeq2 (v1.48.2) with thresholds
set at |log2 fold change|≥1 and adjusted P<0.05
(21). Gene Ontology (GO) and
Kyoto Encyclopedia of Genes and Genomes (KEGG) enrichment analyses
were performed using clusterProfiler (v4.12.6) (22).
Western blotting
Proteins were extracted using RIPA buffer prepared
in-house (150 mM NaCl, 1% NP-40, 0.1% SDS, 50 mM Tris-HCl pH 7.6,
10 mM EDTA pH 8.0 and 0.5% sodium deoxycholate), supplemented with
1 M PMSF (Sigma-Aldrich; Merck KGaA) and phosphatase inhibitors (1
mM Na3VO4, 10 mM NaF and 10 mM
β-glycerophosphate). Protein concentrations were determined using
the BCA assay (Pierce; Thermo Fisher Scientific, Inc.). Equal
amounts of protein (30 μg) were separated by 10% SDS-PAGE
and transferred onto PVDF membranes (MilliporeSigma). After
blocking with 5% non-fat milk for 30 min at 25°C, membranes were
incubated overnight at 4°C with the indicated primary antibodies.
Most primary antibodies, including those against phosphorylated
(p-)AKT (Ser473) (cat. no. 4060), AKT (cat. no. 9272), p-mTOR
(Ser2448) (cat. no. 5536), mTOR (cat. no. 2983), p-PI3K p85
(Tyr458) (cat. no. 4228), PI3K p85 (cat. no. 4257), p-ERK1/2
(Thr202/Tyr204) (cat. no. 4370), ERK1/2 (cat. no. 4695), p-p38
(Thr180/Tyr182) (cat. no. 4511), p38 (cat. no. 9212), GSK3β (cat.
no. 12456), p-GSK3β (Ser9) (cat. no. 5558), FOXO3a (cat. no. 2497),
FOXO1 (cat. no. 2880), p-FOXO1 (Ser256) (cat. no. 9461),
p27kip1 (cat. no. 3686), p21Cip1/Waf1 (cat.
no. 2947), cyclooxygenase-2 (COX-2; cat. no. 12282), Bcl-2 (cat.
no. 4223), Bcl-XL (cat. no. 2764), Bax (cat. no. 2772), cytochrome
c oxidase subunit IV (COX IV; cat. no. 4850), β-actin (cat. no.
4970), N-cadherin (cat. no. 13116) and E-cadherin (cat. no. 3195)
were purchased from Cell Signaling Technology, Inc. [rabbit host;
diluted 1:1,000 in 5% BSA (Sigma-Aldrich; Merck KGaA)/PBST (PBS
containing 0.1% Tween-20) with 1% NaN3]. The
anti-Vimentin antibody (cat. no. ARG66199) was obtained from Arigo
Biolaboratories Corp. and used under the same dilution and buffer
conditions as aforementioned. After incubation with HRP-conjugated
goat anti-rabbit secondary antibody (Abcam; cat. no. ab6721;
1:10,000 in 5% milk), membranes were washed and developed using
enhanced chemiluminescence (Thermo Fisher Scientific, Inc.). Band
intensities were semi-quantified using ImageJ (v1.50a) and all
experiments were performed in triplicate.
Protein-protein interaction (PPI) network
analysis
DEGs were analyzed using the STRING database
(https://string-db.org/) to construct PPI
networks, with a confidence score ≥0.4. The resulting networks were
visualized using Cytoscape (v3.10.2; Cytoscape Consortium;
https://cytoscape.org/), and key hub genes were
identified using the CytoHubba plugin, which applies 11 topological
analysis methods, including Degree, maximal clique centrality (MCC)
and maximum neighborhood component (MNC). Additionally, the MCODE
plugin was used to detect densely connected regions within the
network, with parameters set as follows: Degree cut-off=2, node
score cut-off=0.2 and K-Core=2.
Molecular docking
Molecular docking studies were conducted using
BIOVIA Discovery Studio 2024 Client (BIOVIA; v24.1.0.23298;
Dassault Systèmes S.E.). The crystal structure of PI3Kγ (PDB ID:
1E7U) was retrieved from the RCSB Protein Data Bank (https://www.rcsb.org/structure/1E7U) and was
originally reported by Walker et al (23). Protein preparation involved
removal of water molecules and the addition of hydrogen atoms.
Ligand structures for antroquinonol and wortmannin were obtained
from PubChem (https://pubchem.ncbi.nlm.nih.gov/compound/24875259 and
https://pubchem.ncbi.nlm.nih.gov/compound/312145,
respectively). The 2D structure of LT4 was drawn using ChemDraw
Prime (v23; Revvity Signals Software). Energy minimization was
performed. Docking simulations were carried out using the CDOCKER
algorithm, focusing on the ATP-binding site of PI3Kγ. Binding
energies and interaction modes were analyzed and docking poses were
visualized using PyMOL (v3.1; Schrödinger, LLC; https://pymol.org/) and BIOVIA Discovery Studio
Client.
Statistical analysis
Data are expressed as mean ± SD, except for the
molecular binding energy results, which are presented as mean ±
SEM. Group differences in docking energies were assessed using
unpaired t-tests. Other experimental data were analyzed by one-way
ANOVA followed by Bonferroni post hoc tests. P<0.05 was
considered to indicate a statistically significant difference. All
statistical analyses were performed using SPSS Statistics (v22.0;
IBM Corp.). Graphs and quantifications were generated using
GraphPad Prism (v5.0; Dotmatics) and ImageJ. All experiments were
performed in at least triplicate (n≥3).
Results
Lt4 selectively inhibits the viability of
KRAS-mutant HCT116 CRC cells
To evaluate the anticancer potential of four
compounds derived from A. cinnamomea, including DeEA and DSA
from the fruiting body and 4AAQB and LT4 from the mycelium, cell
viability assays with three human CRC cell lines, HCT116 (KRAS
mutant) and HT29 and Caco2 (both KRAS wild-type), were conducted.
Cells were treated with increasing concentrations of each compound
(0.1, 1, 3 and 10 μM) and cell viability was assessed at 24,
48 and 72 h using the CCK-8 assay (Fig. 1A-C).
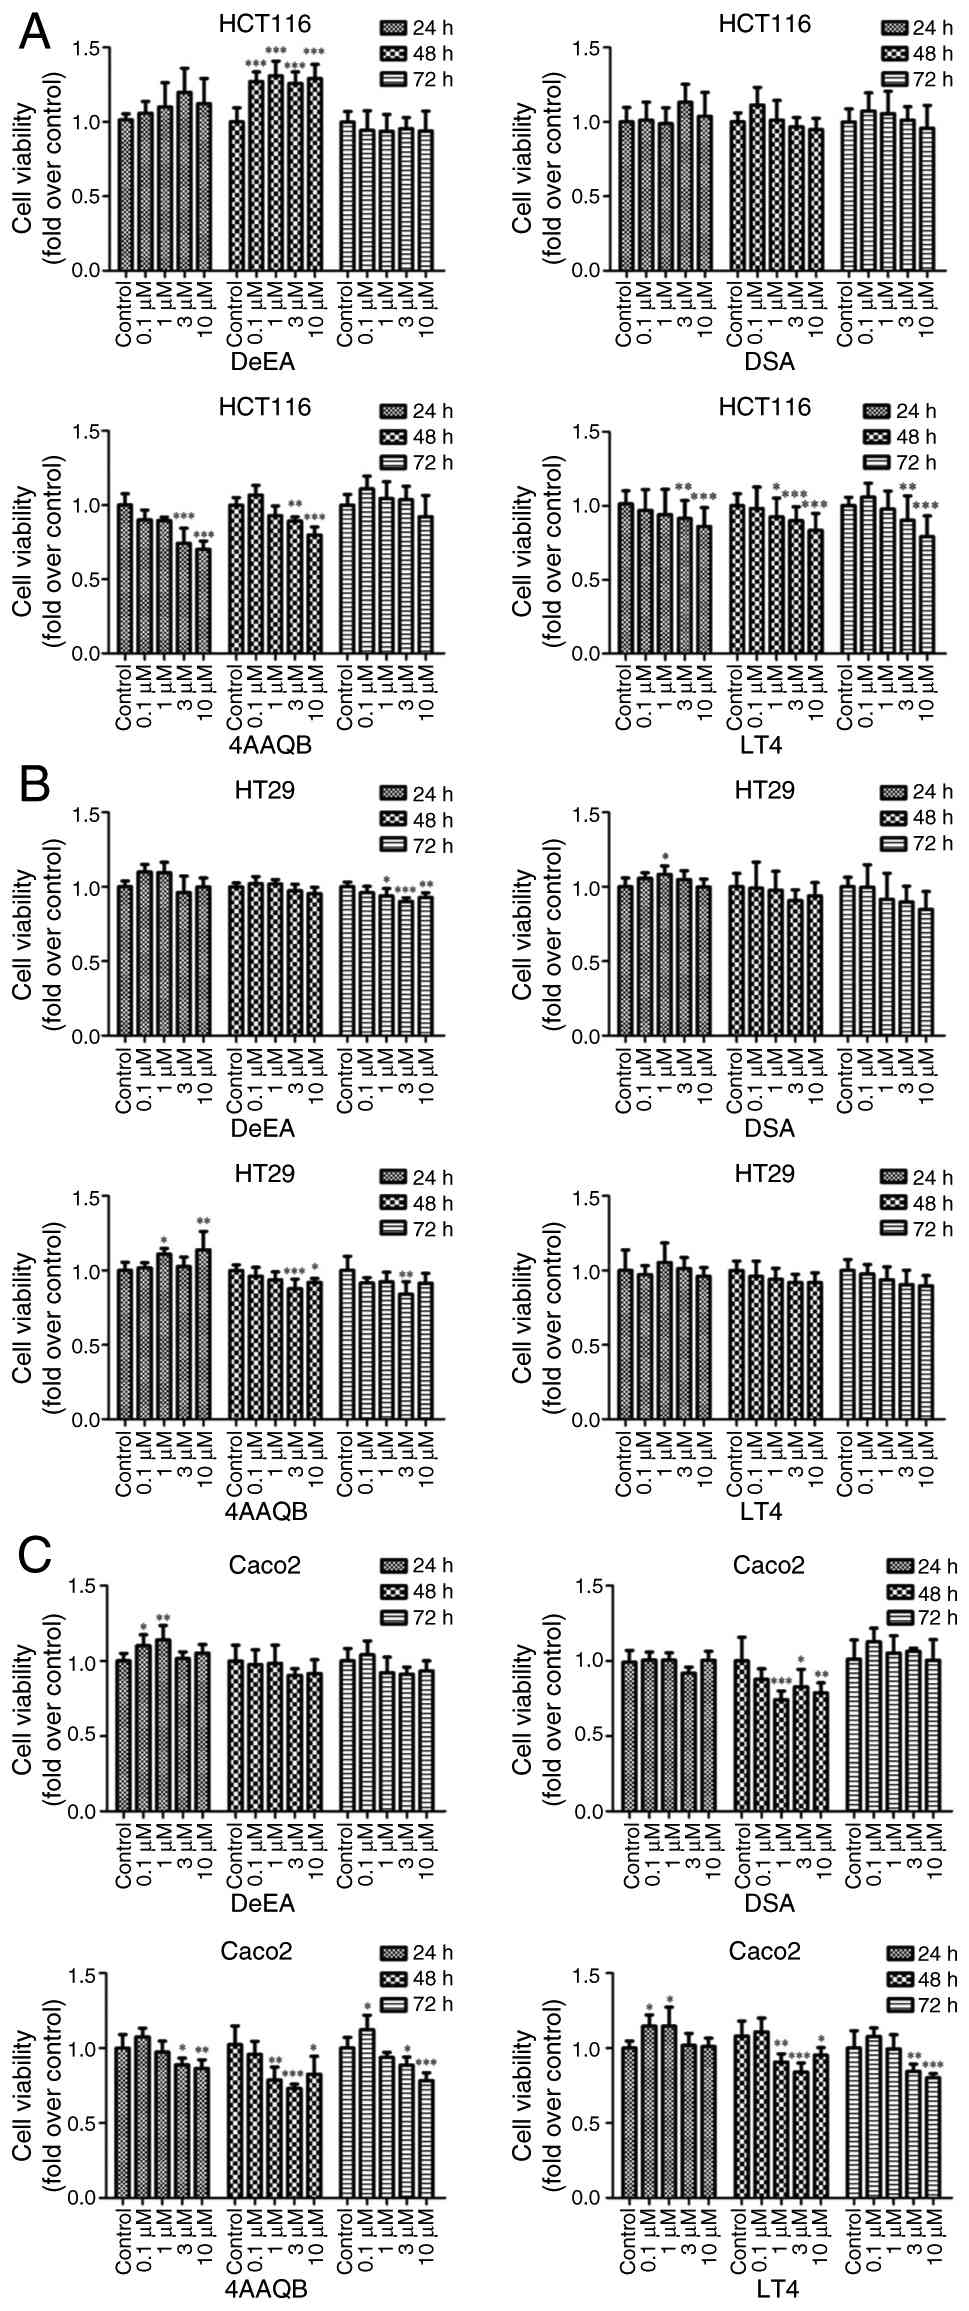 | Figure 1Effects of four Antrodia
cinnamomea-derived triterpenoid compounds on CRC cell
viability. Cell viability was assessed by Cell Counting Kit-8 assay
in three human CRC cell lines: (A) HCT116 (KRAS mutant), (B) HT29
(KRAS wild-type) and (C) Caco-2 (KRAS wild-type) after treatment
with increasing concentrations (0.1, 1, 3 and 10 μM) of
DeEA, DSA, 4AAQB and LT4 for 24, 48 and 72 h. Absorbance was
recorded at 450/650 nm and normalized to vehicle-treated controls
(0.1% DMSO). Data are presented as the mean ± SD from at least
three independent experiments (n≥3). *P<0.05,
**P<0.01, ***P<0.001 vs.
vehicle-treated control. CRC, colorectal cancer; DeEA,
dehydroeburicoic acid; DSA, dehydrosulphurenic acid; 4AAQB,
4-acetylantroquinonol B; LT4, 4-acetylantrocamol LT3. |
Among the four compounds tested, LT4 and 4AAQB
showed the most evident inhibitory effects on HCT116 cell
viability, whereas DeEA and DSA produced minimal changes under the
same conditions (Fig. 1A).
Notably, LT4 exhibited a clearer dose- and time-associated
decrease, reaching statistical significance at concentrations ≥1
μM at later time points (Fig.
1A, bottom right panel). Although 4AAQB also caused significant
reductions in viability in HCT116 cells, the overall pattern was
less consistent across time points compared with LT4 (Fig. 1A, bottom left panel). In HT29 and
Caco2 cells, the viability responses to LT4 and 4AAQB were cell
line-dependent, showing generally milder inhibition than that
observed in HCT116 cells (Fig. 1B
and C). Notably, Caco2 cells exhibited a comparable reduction
in viability in response to 4AAQB and LT4 (Fig. 1C). Given the clearer overall
inhibitory trend of LT4 in KRAS-mutant HCT116 cells, LT4 was
selected for downstream mechanistic investigations.
LT4 inhibits colony formation, cell
migration and EMT in HCT116 cells
To further assess the anti-proliferative effects of
LT4 on CRC cells, a colony formation assay with HCT116 cells
treated with LT4 (0.1-10 μM) for 14 days was performed. As
shown in Fig. 2A, LT4
significantly suppressed the clonogenic potential of HCT116 cells
in a dose-dependent manner, particularly at concentrations of ≥1
μM.
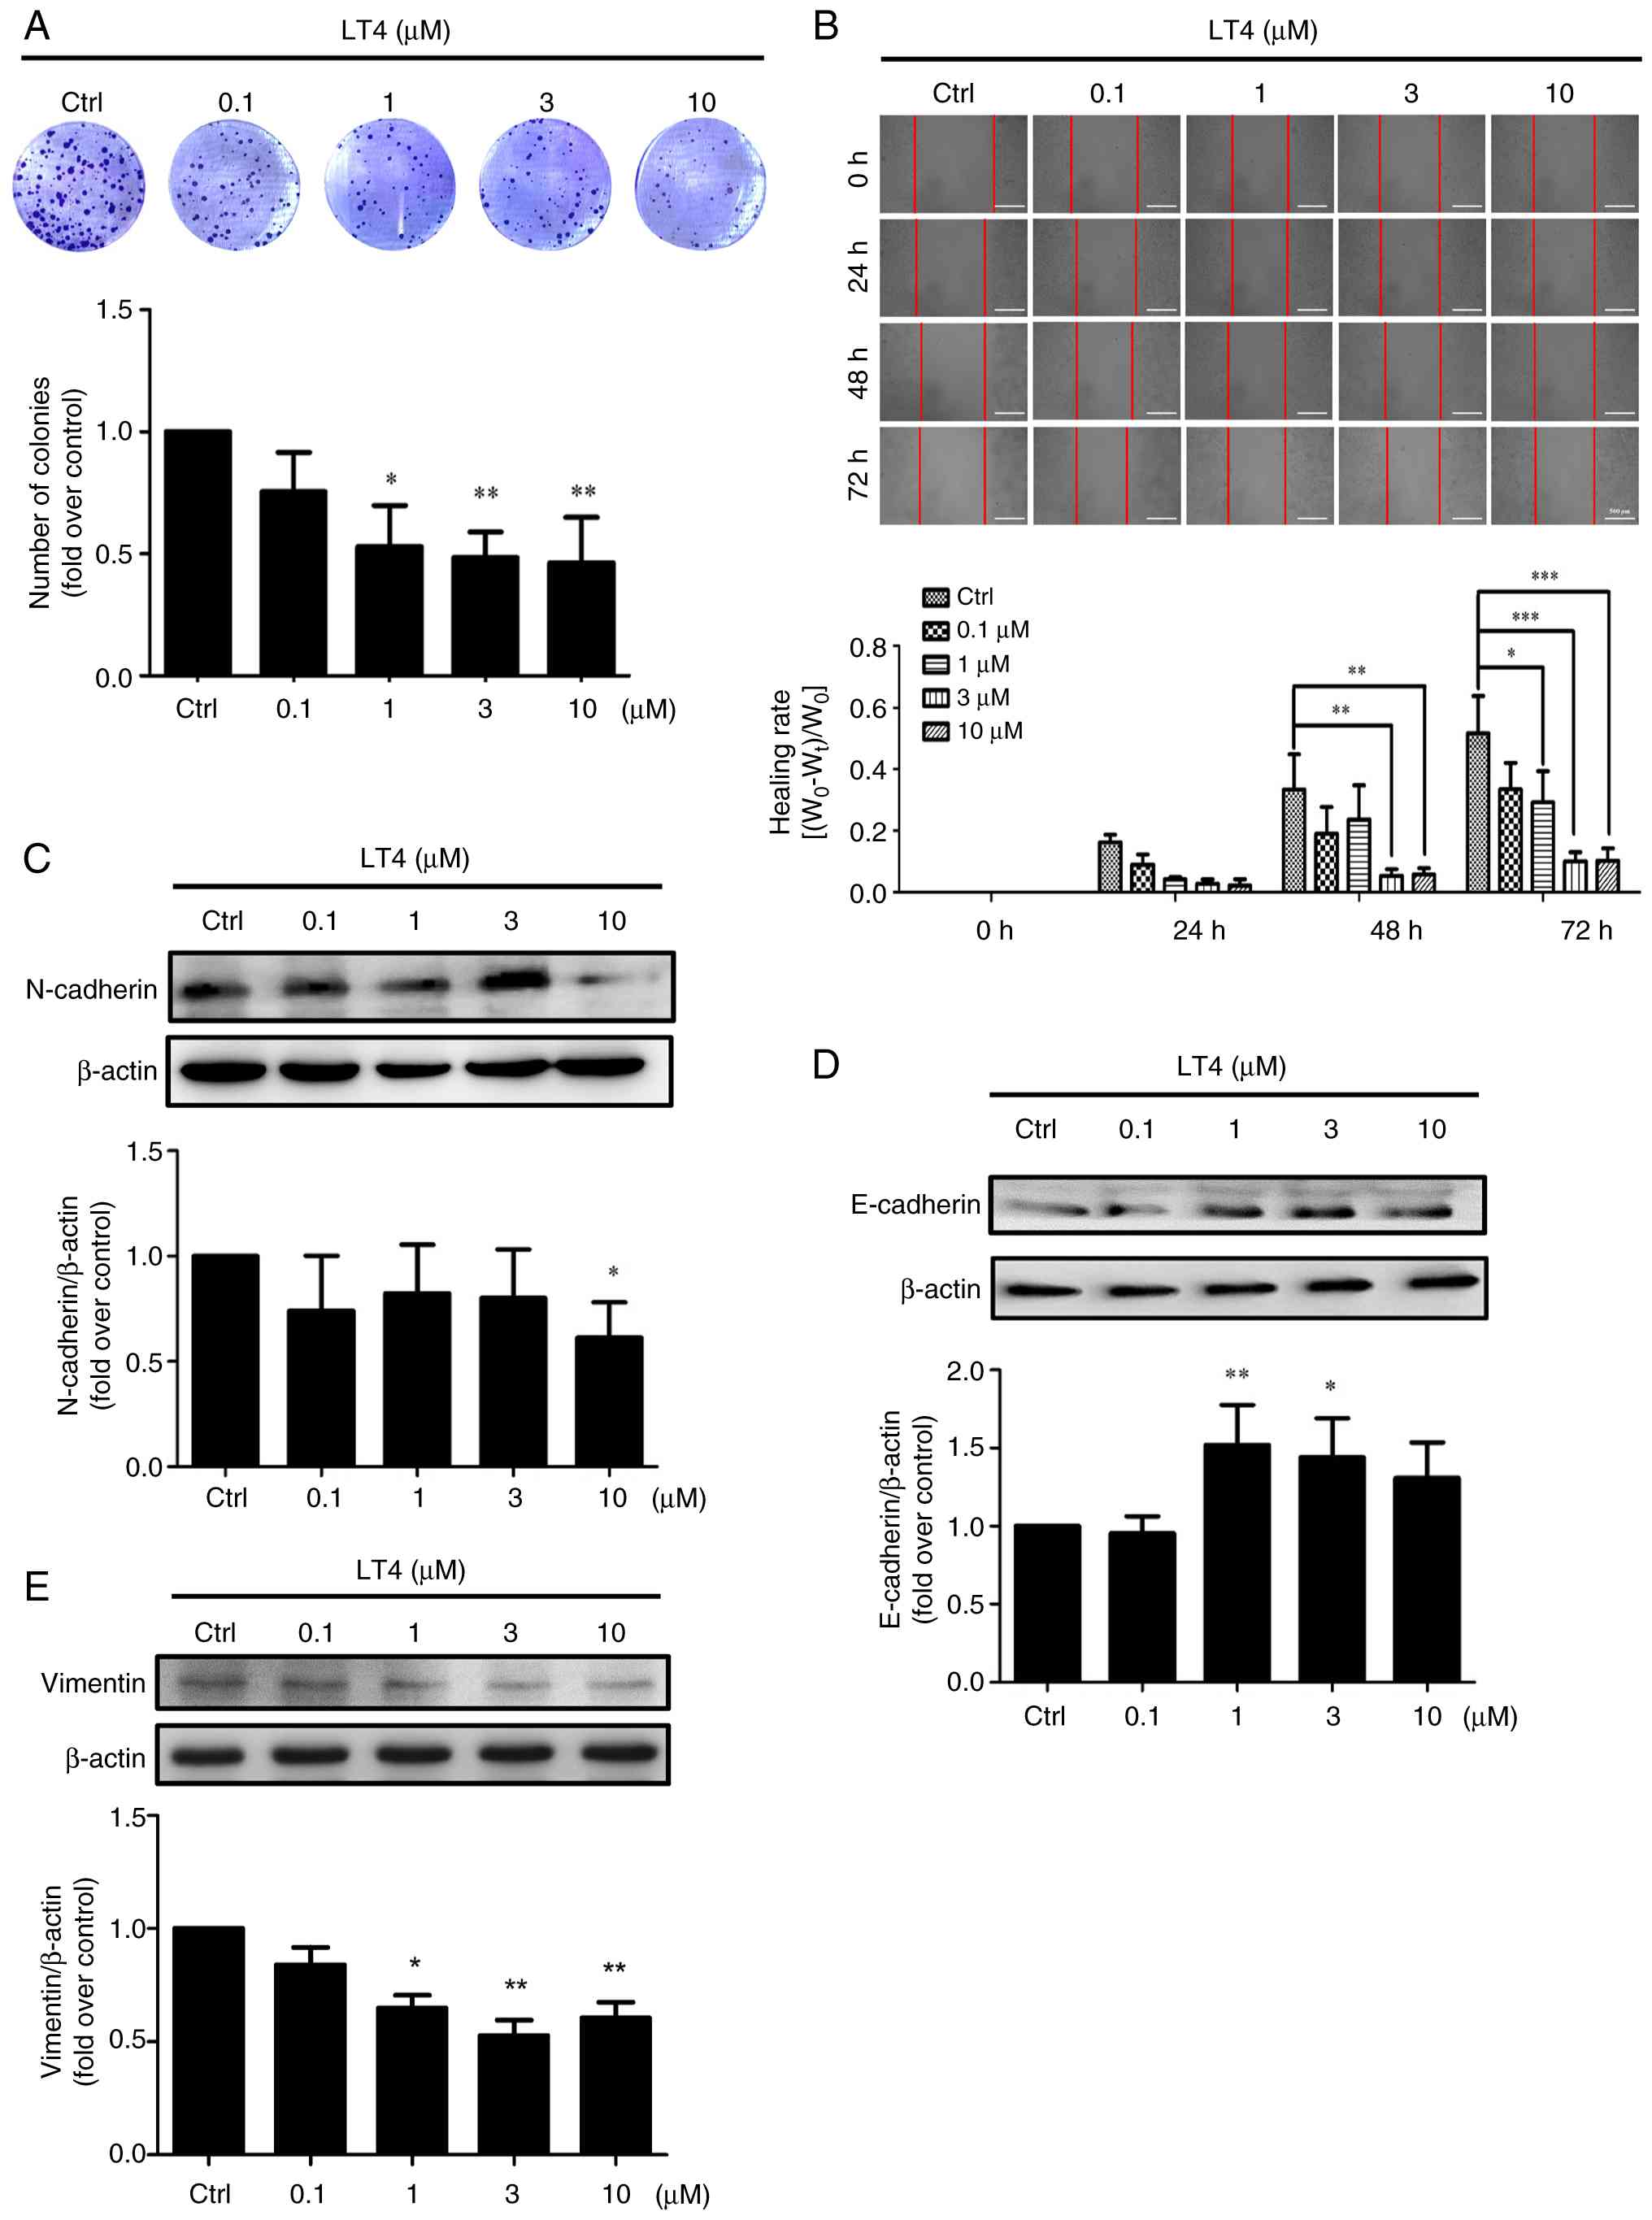 | Figure 2LT4 suppresses colony formation, cell
migration and EMT in HCT116 cells. (A) Colony formation assay was
performed after treating HCT116 cells with various concentrations
of LT4 (0.1, 1, 3 and 10 μM) for 14 days. Colonies were
stained with crystal violet and quantification of colony growth was
calculated relative to the vehicle-treated Ctrl. (B) Wound healing
assay showing inhibition of cell migration by LT4 (0.1, 1, 3 and 10
μM) at 24, 48 and 72 h post-scratch. Representative images
and quantified healing rates are shown. Western blot analysis of
EMT-related proteins (C) N-cadherin (140 kDa), (D) E-cadherin (130
kDa) and (E) Vimentin (54 kDa) in HCT116 cells after 24-h LT4
treatment (0.1, 1, 3 and 10 μM). β-actin (45 kDa) served as
the loading control. The corresponding bar graphs show
semi-quantification of N-cadherin/β-actin, E-cadherin/β-actin and
vimentin/β-actin expressed as fold change relative to the
vehicle-treated Ctrl. Data are presented as the mean ± SD from
three independent experiments (n=3). *P<0.05,
**P<0.01, ***P<0.001 vs.
vehicle-treated Ctrl. LT4, 4-acetylantrocamol LT3; EMT,
epithelial-mesenchymal transition; Ctrl, control. |
To investigate the effect of LT4 on cell migration,
a wound healing assay was next conducted. Compared with the control
group, LT4 treatment markedly inhibited cell migration in a time-
and dose-dependent manner (Fig.
2B). Quantification of the healing rates revealed that 3 and 10
μM LT4 significantly delayed wound closure at both 48 and 72
h.
Given that EMT plays a pivotal role in cancer
invasion and metastasis (24),
the expression levels of EMT markers in LT4-treated HCT116 cells
were examined. Densitometric analysis of three independent western
blot experiments showed that LT4 reduced the levels of the
mesenchymal marker N-cadherin, reaching statistical significance at
10 μM (Fig. 2C), while
significantly upregulating the epithelial marker E-cadherin at 1-3
μM (Fig. 2D). To
strengthen the EMT assessment, Vimentin was also measured, a
canonical mesenchymal marker widely used in CRC EMT studies
(25-28). Densitometric analysis of western
blots showed that LT4 significantly reduced Vimentin protein
expression at 1-10 μM, with the lowest level observed at 3
μM (Fig. 2E). Together,
these results suggest that LT4 not only impaired proliferation and
migration but also suppressed EMT phenotypes in HCT116 CRC cells by
downregulating mesenchymal markers and restoring epithelial
features.
LT4 treatment alters gene expression
profiles and enriches the PI3K/AKT and MAPK pathways in HCT116
cells
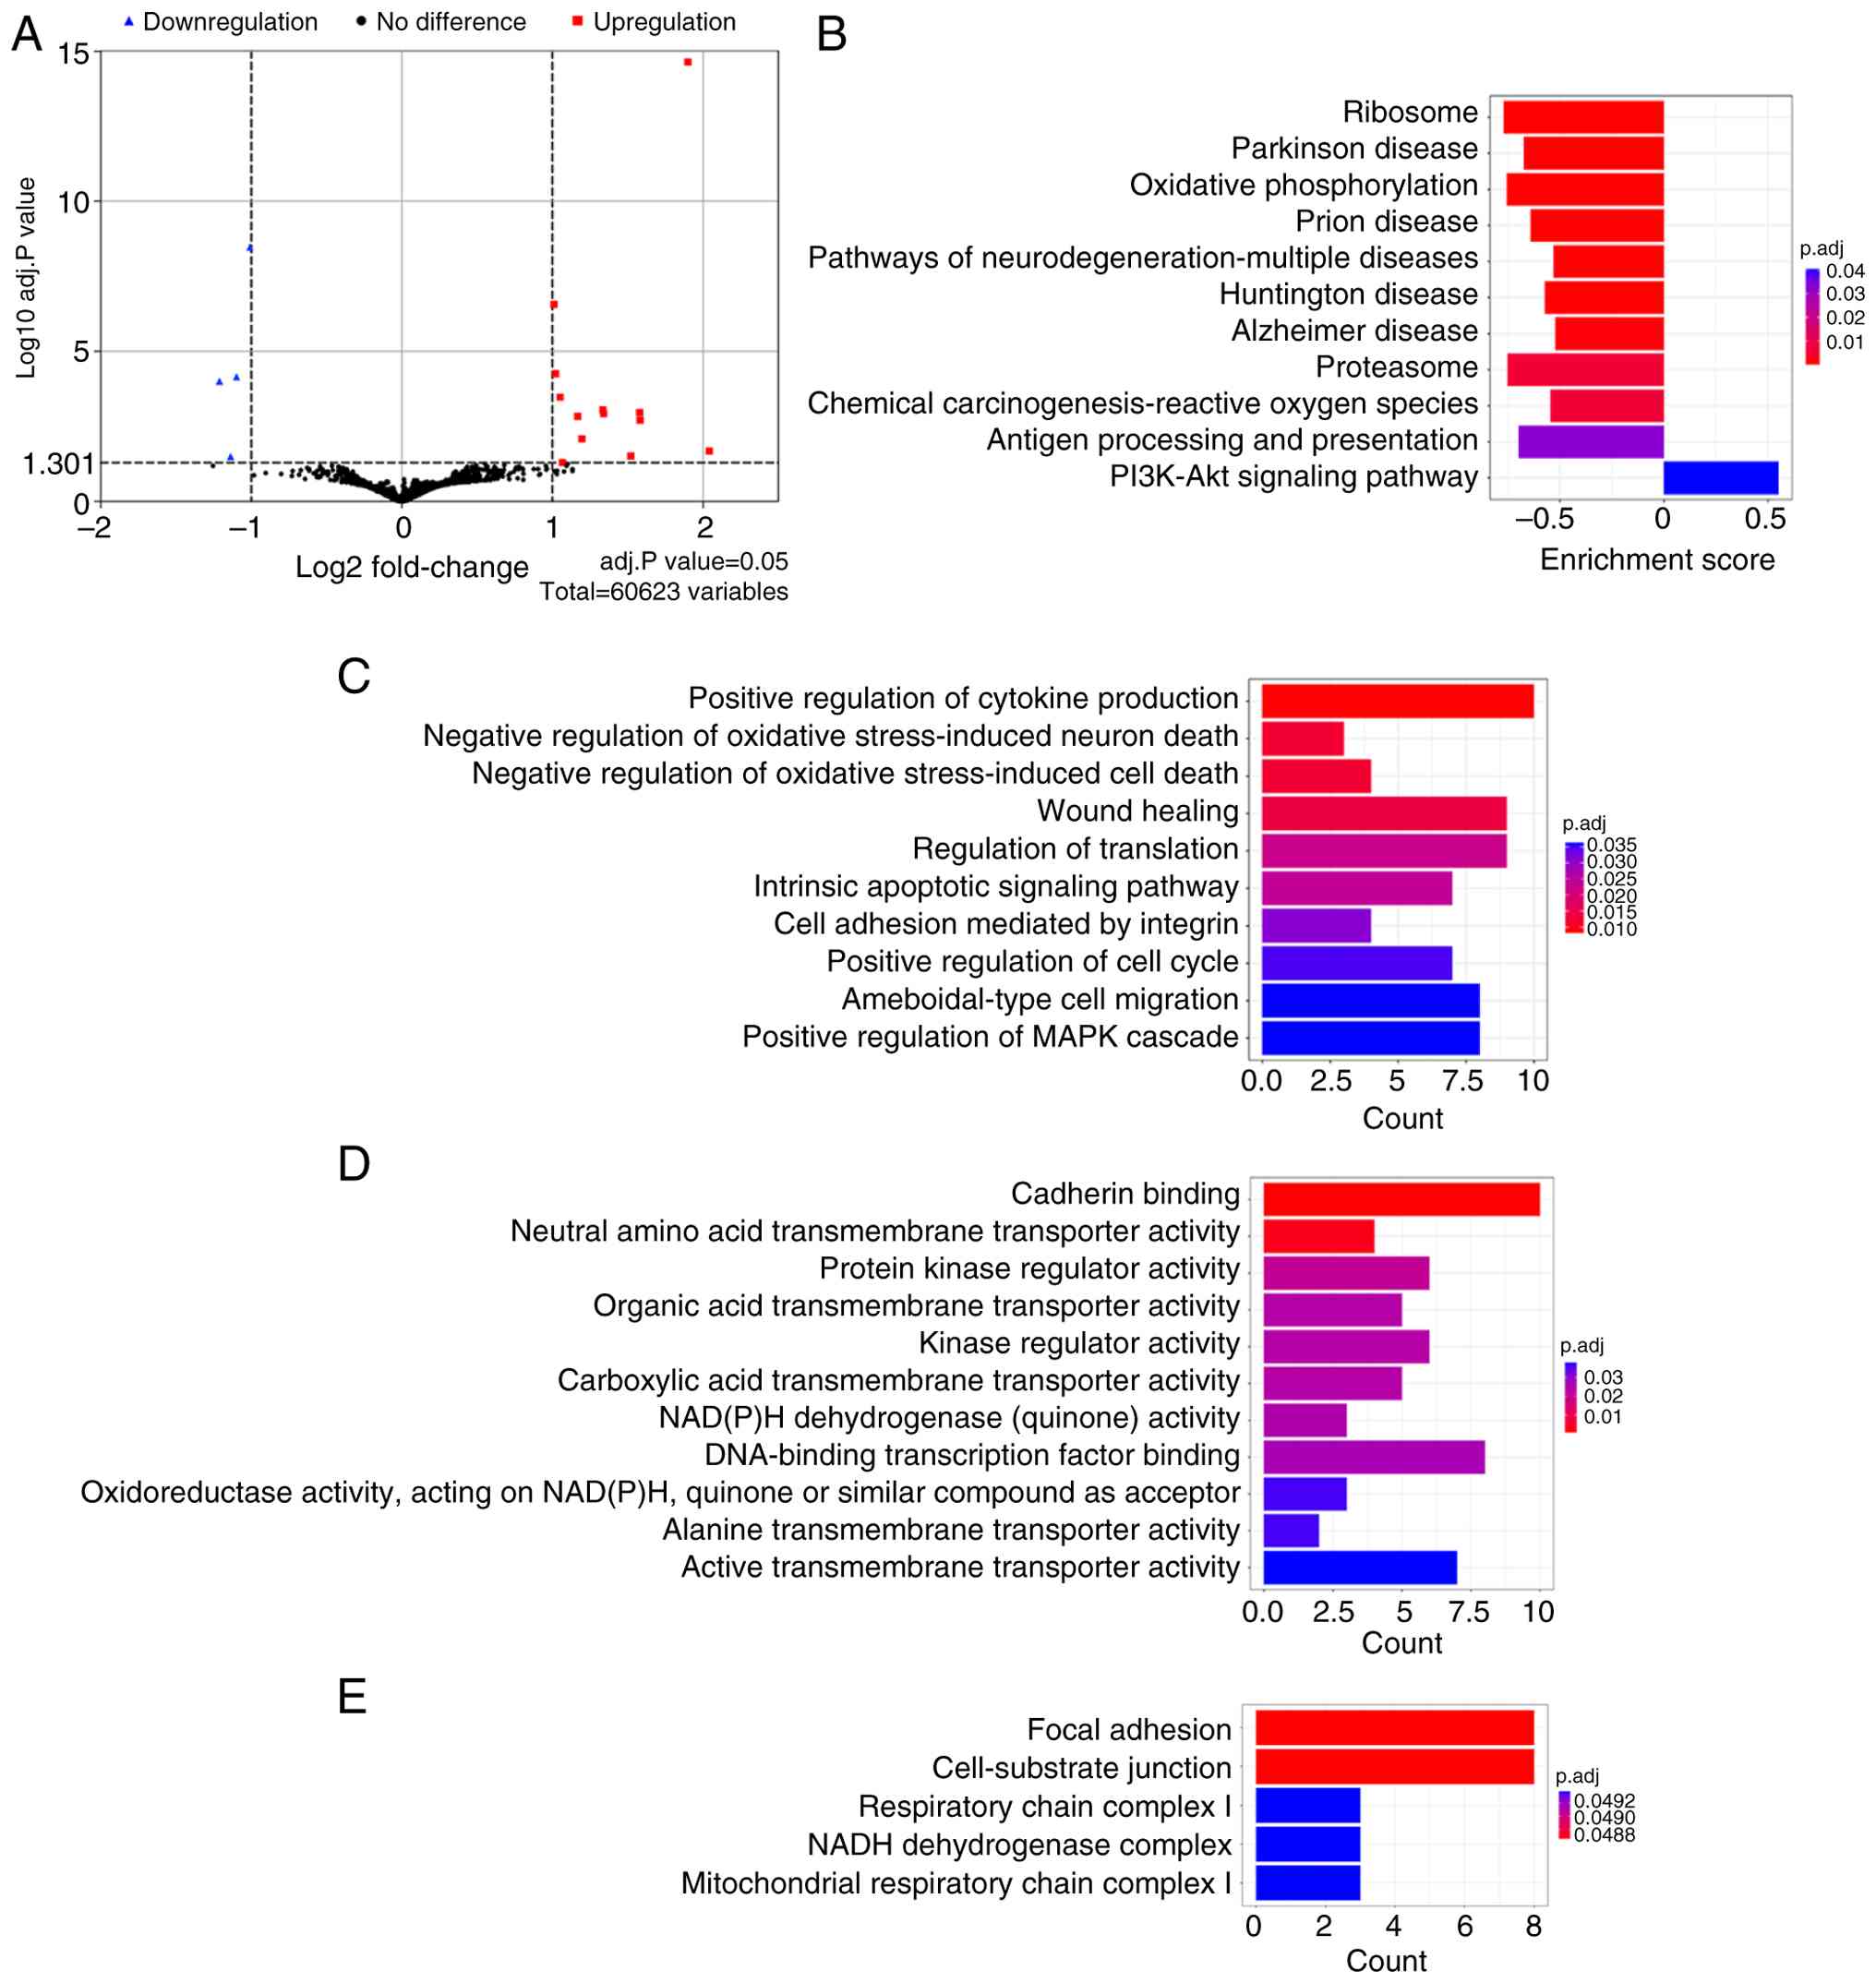
To investigate the transcriptional changes induced
by LT4 in CRC cells, RNA-seq was performed on HCT116 cells treated
with 10 μM LT4 for 24 h. The complete RNA-seq output for all
transcripts detected in LT4-treated and control HCT116 cells is
provided in Table SI. DEGs were
identified using a cut-off of |log2(fold change)|≥1 and
adjusted P<0.05 (corresponding to -log10(P-adjust)
≥1.3), yielding a total of 17 DEGs (13 upregulated and 4
downregulated) in LT4-treated HCT116 cells, as visualized by
volcano plot (Fig. 3A). Among
the upregulated genes were ZNF460, CHAC1, KIF21A, FBXO30, KLHL11,
SLC7A11, CLIC4, NT5E, CPA4, BCAN-AS2, AHNAK, UPP1 and AKAP12, while
ND6, PLEKHO1, KRT13 and CRABP2 were significantly downregulated.
Detailed information on the DEGs is provided in Table SII.
To elucidate the functional relevance of these DEGs,
KEGG and GO enrichment analyses were performed. KEGG pathway
analysis revealed significant enrichment in 'PI3K-Akt signaling
pathway', 'Antigen processing and presentation' and 'Chemical
carcinogenesis-reactive oxygen species' (Fig. 3B). GO enrichment in the
Biological Process category highlighted terms such as 'Positive
regulation of cytokine production', 'Wound healing',
'Ameboidal-type cell migration', 'Positive regulation of MAPK
cascade' and 'Intrinsic apoptotic signaling pathway' (Fig. 3C). In the Molecular Function
category, enriched annotations included 'Cadherin binding',
'DNA-binding transcription factor binding', 'Protein kinase
regulator activity' and 'Active transmembrane transporter activity'
(Fig. 3D). GO analysis of
Cellular Components further revealed enrichment in 'Focal adhesion'
and 'Cell-substrate junction', structures essential for cell
adhesion and signaling (Fig.
3E). These results suggest that LT4 modulates key gene
expression programs associated with tumor survival, migration,
stress adaptation and oncogenic signaling in CRC cells.
Construction of a PPI network and
identification of hub genes
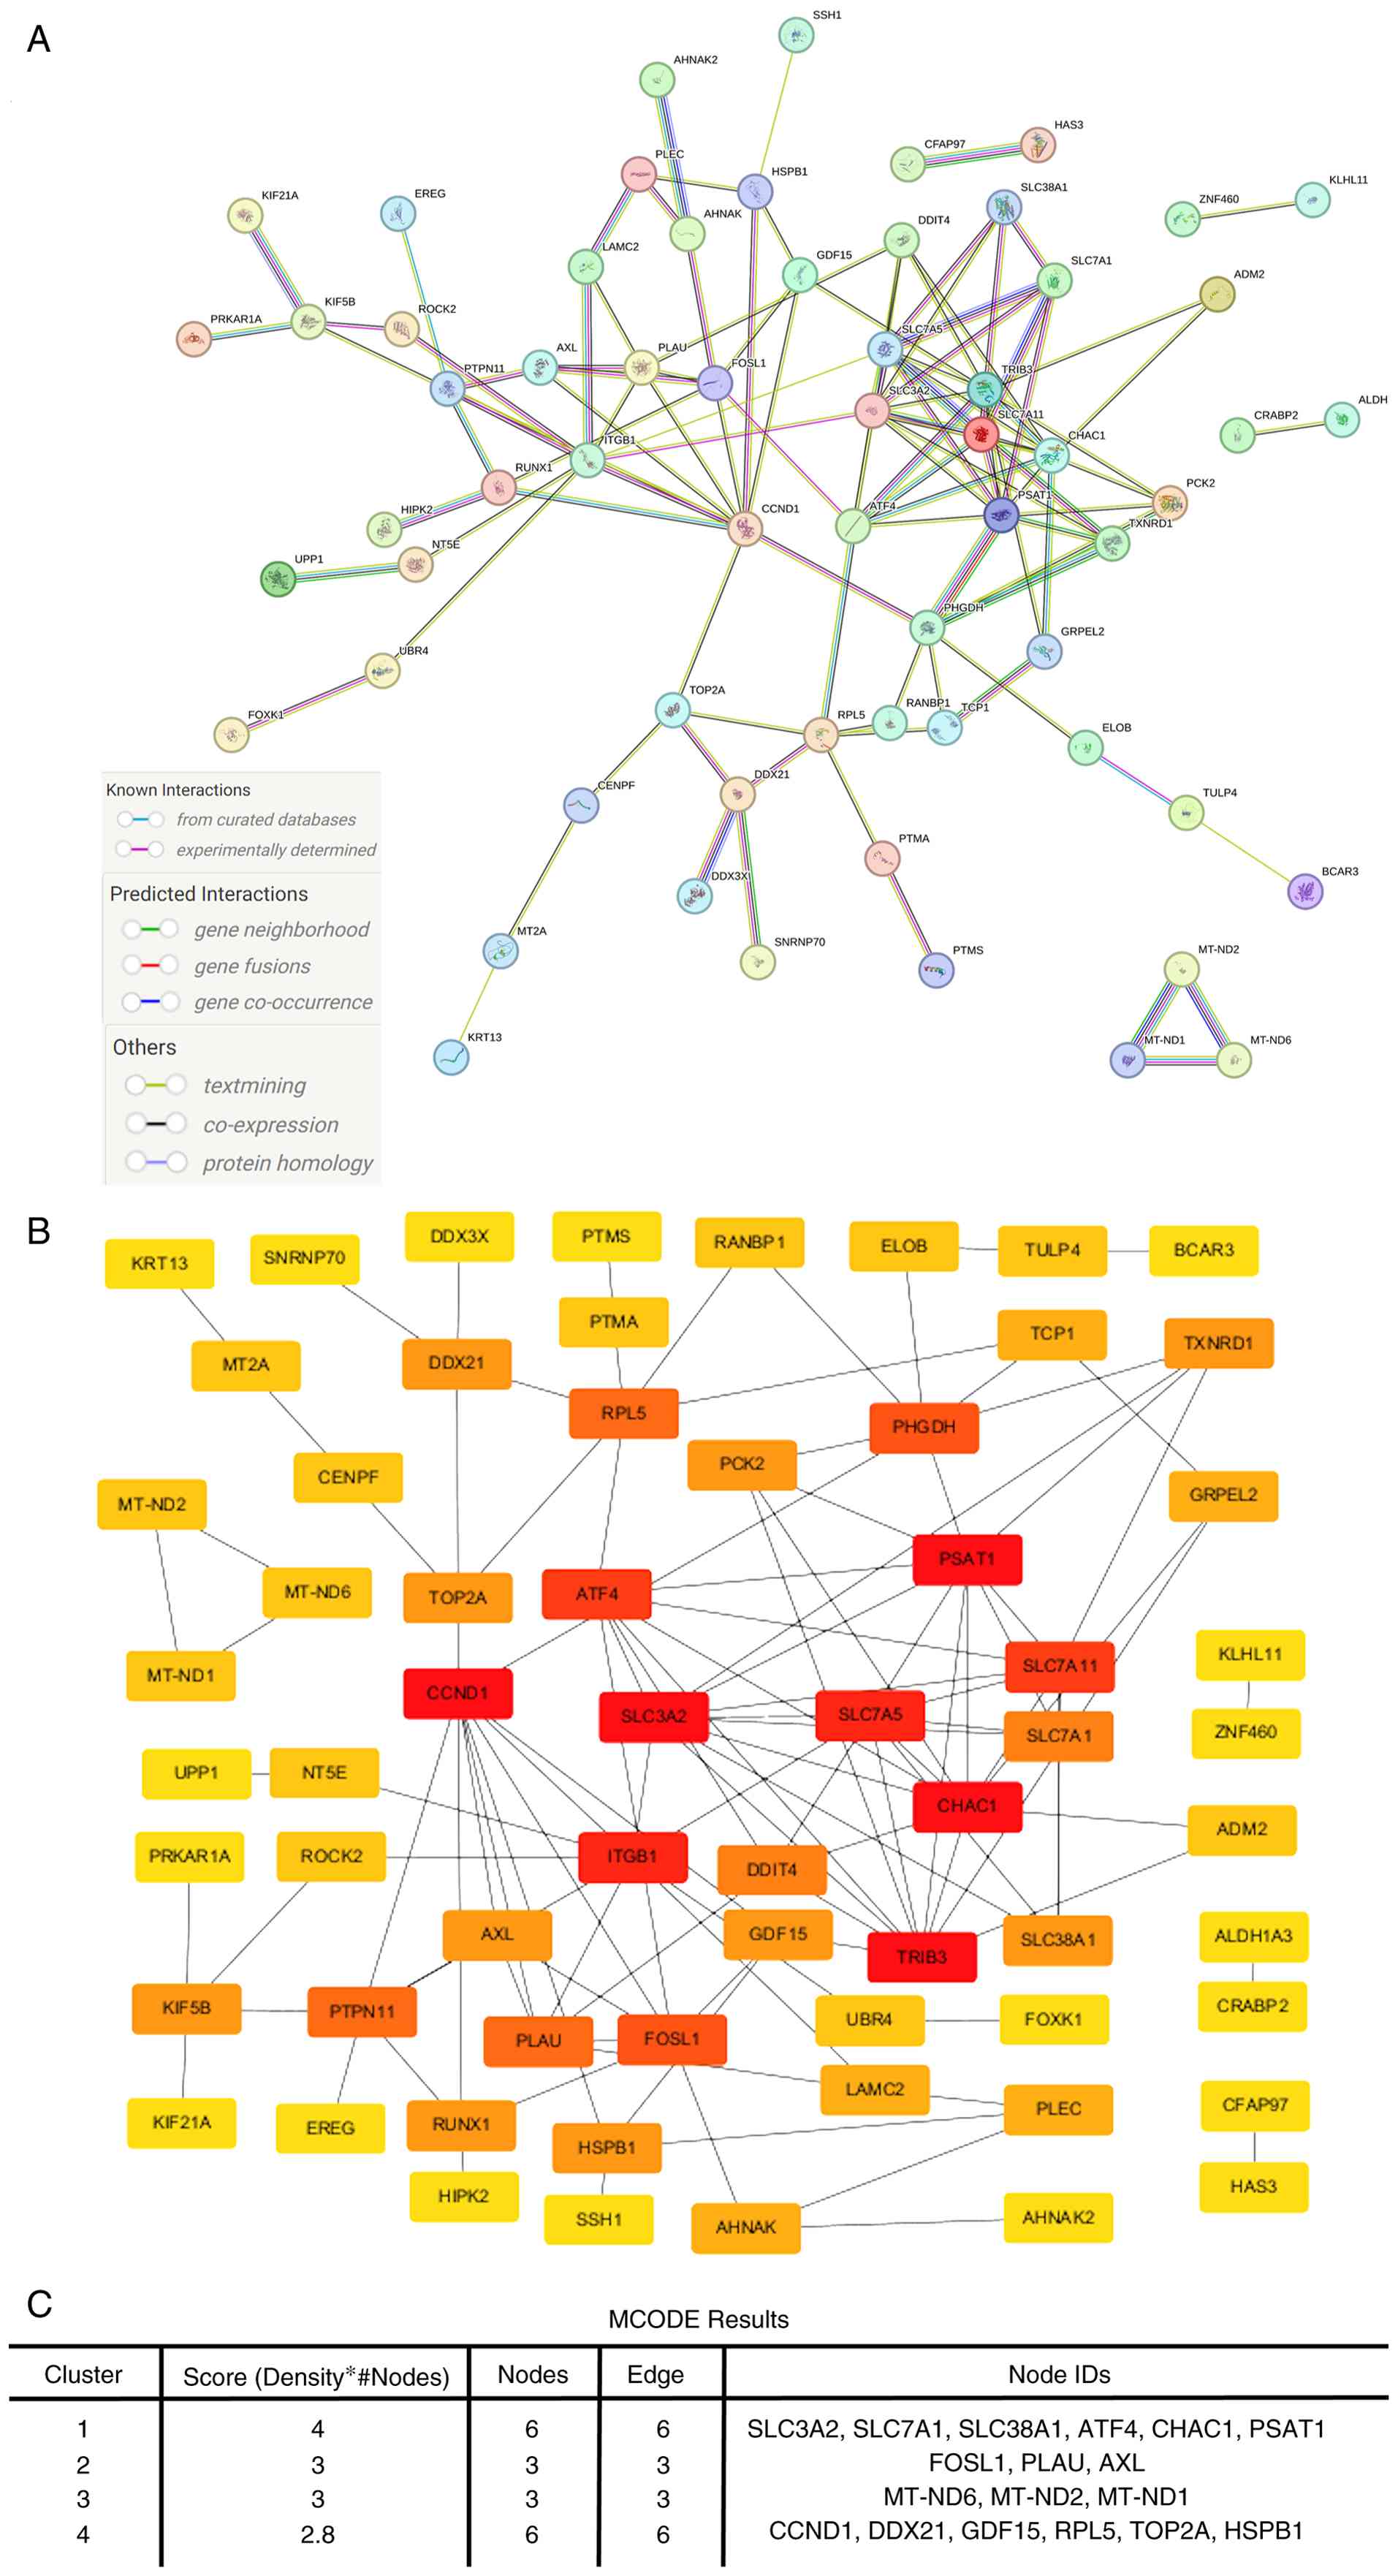
To elucidate the interaction landscape of
LT4-responsive genes, a PPI network was constructed using the
STRING database. A total of 83 significantly regulated genes
(adjusted P<0.05 without applying the |log2FC|≥1 threshold) were
submitted to STRING to avoid an overly sparse network and to retain
sufficient nodes for module/hub analysis, and 63 genes with
non-zero node degree were retained for network visualization and
further analysis (Fig. 4A;
Table SIII for the full STRING
node list). The network comprised 113 interactions, filtered with a
confidence score threshold >0.4.
To prioritize key regulatory genes within this
network, topological analysis was performed using the CytoHubba
plugin in Cytoscape. Based on integrated centrality scores across
11 parameters, including Degree, MCC, MNC, DMNC, Closeness,
Betweenness and others (Fig.
S2; Table SIV for detailed
CytoHubba centrality rankings), several high-ranking hub genes were
identified, such as solute carrier family 3 member 2 (SLC3A2),
Cyclin D1 (CCND1), phosphoserine aminotransferase 1 (PSAT1), ChaC
glutathione-specific γ-glutamylcyclotransferase 1 (CHAC1), TRIB3
and ITGB1, which appeared in the top-10 lists across multiple
ranking methods (Fig. 4B).
Further clustering analysis was performed using the
MCODE plugin to identify densely connected modules within the PPI
network. In total, 4 distinct clusters were identified and are
summarized in Fig. 4C. Cluster 1
had the highest score (4.0), consisting of 6 tightly interconnected
nodes: SLC3A2, SLC7A11, SLC38A1, ATF4, CHAC1 and PSAT1. These genes
are associated with amino acid transport, oxidative stress response
and cellular metabolism (29-33). Other clusters encompassed
mitochondrial respiratory components and ribosome-related genes,
indicating LT4-induced modulation of metabolic and proliferative
signaling hubs. These clustering results closely aligned with the
CytoHubba analysis, reinforcing the biological relevance of these
modules.
Taken together, these findings highlight a
functional hub centered around SLC3A2 and CCND1, linking nutrient
sensing, redox regulation and cell cycle progression, potentially
mediating the anticancer effects of LT4 in CRC cells.
LT4 suppresses PI3K/AKT/mTOR and
PI3K/AKT/GSK3β/FOXO signaling pathways in HCT116 cells
Network analysis identified SLC3A2 and CCND1 as 2
key hub genes in LT4-treated CRC cells. Both genes have been
implicated in cancer progression. For instance, SLC3A2 (also known
as CD98hc) is a transmembrane amino acid transporter that has been
reported to be upregulated in various cancer types, including
osteosarcoma, lung, breast and biliary tract cancer, where it
contributes to tumor proliferation and invasion, primarily through
the PI3K/AKT signaling pathway (34-39), and in certain contexts via
ERBB2/ERBB3-mediated MAPK activation (40). In CRC, SLC3A2 depletion has been
shown to suppress cell proliferation and metastasis through the
AKT/GSK-3β pathway and induction of ferroptosis (41). CCND1, a key regulator of the G1/S
cell cycle transition, is frequently upregulated in colon, breast
and gastric cancer (42-44); it serves as a downstream effector
of multiple oncogenic cascades, including PI3K/AKT/mTOR and
AKT/GSK3β, promoting cell cycle progression and tumor growth
(45-47).
To further elucidate whether LT4 targets these
signaling cascades, western blotting was performed to assess the
PI3K/AKT/mTOR and PI3K/AKT/GSK3β/FOXO axes. In LT4-treated HCT116
cells, the phosphorylation levels of PI3K (p85), AKT (Ser473) and
mTOR were significantly reduced in a dose-dependent manner, while
total PI3K, AKT and mTOR levels remained unchanged (Fig. 5A-D). These results demonstrated
that LT4 inhibited the PI3K/AKT/mTOR signaling pathway, a key
regulator of cell growth and protein synthesis.
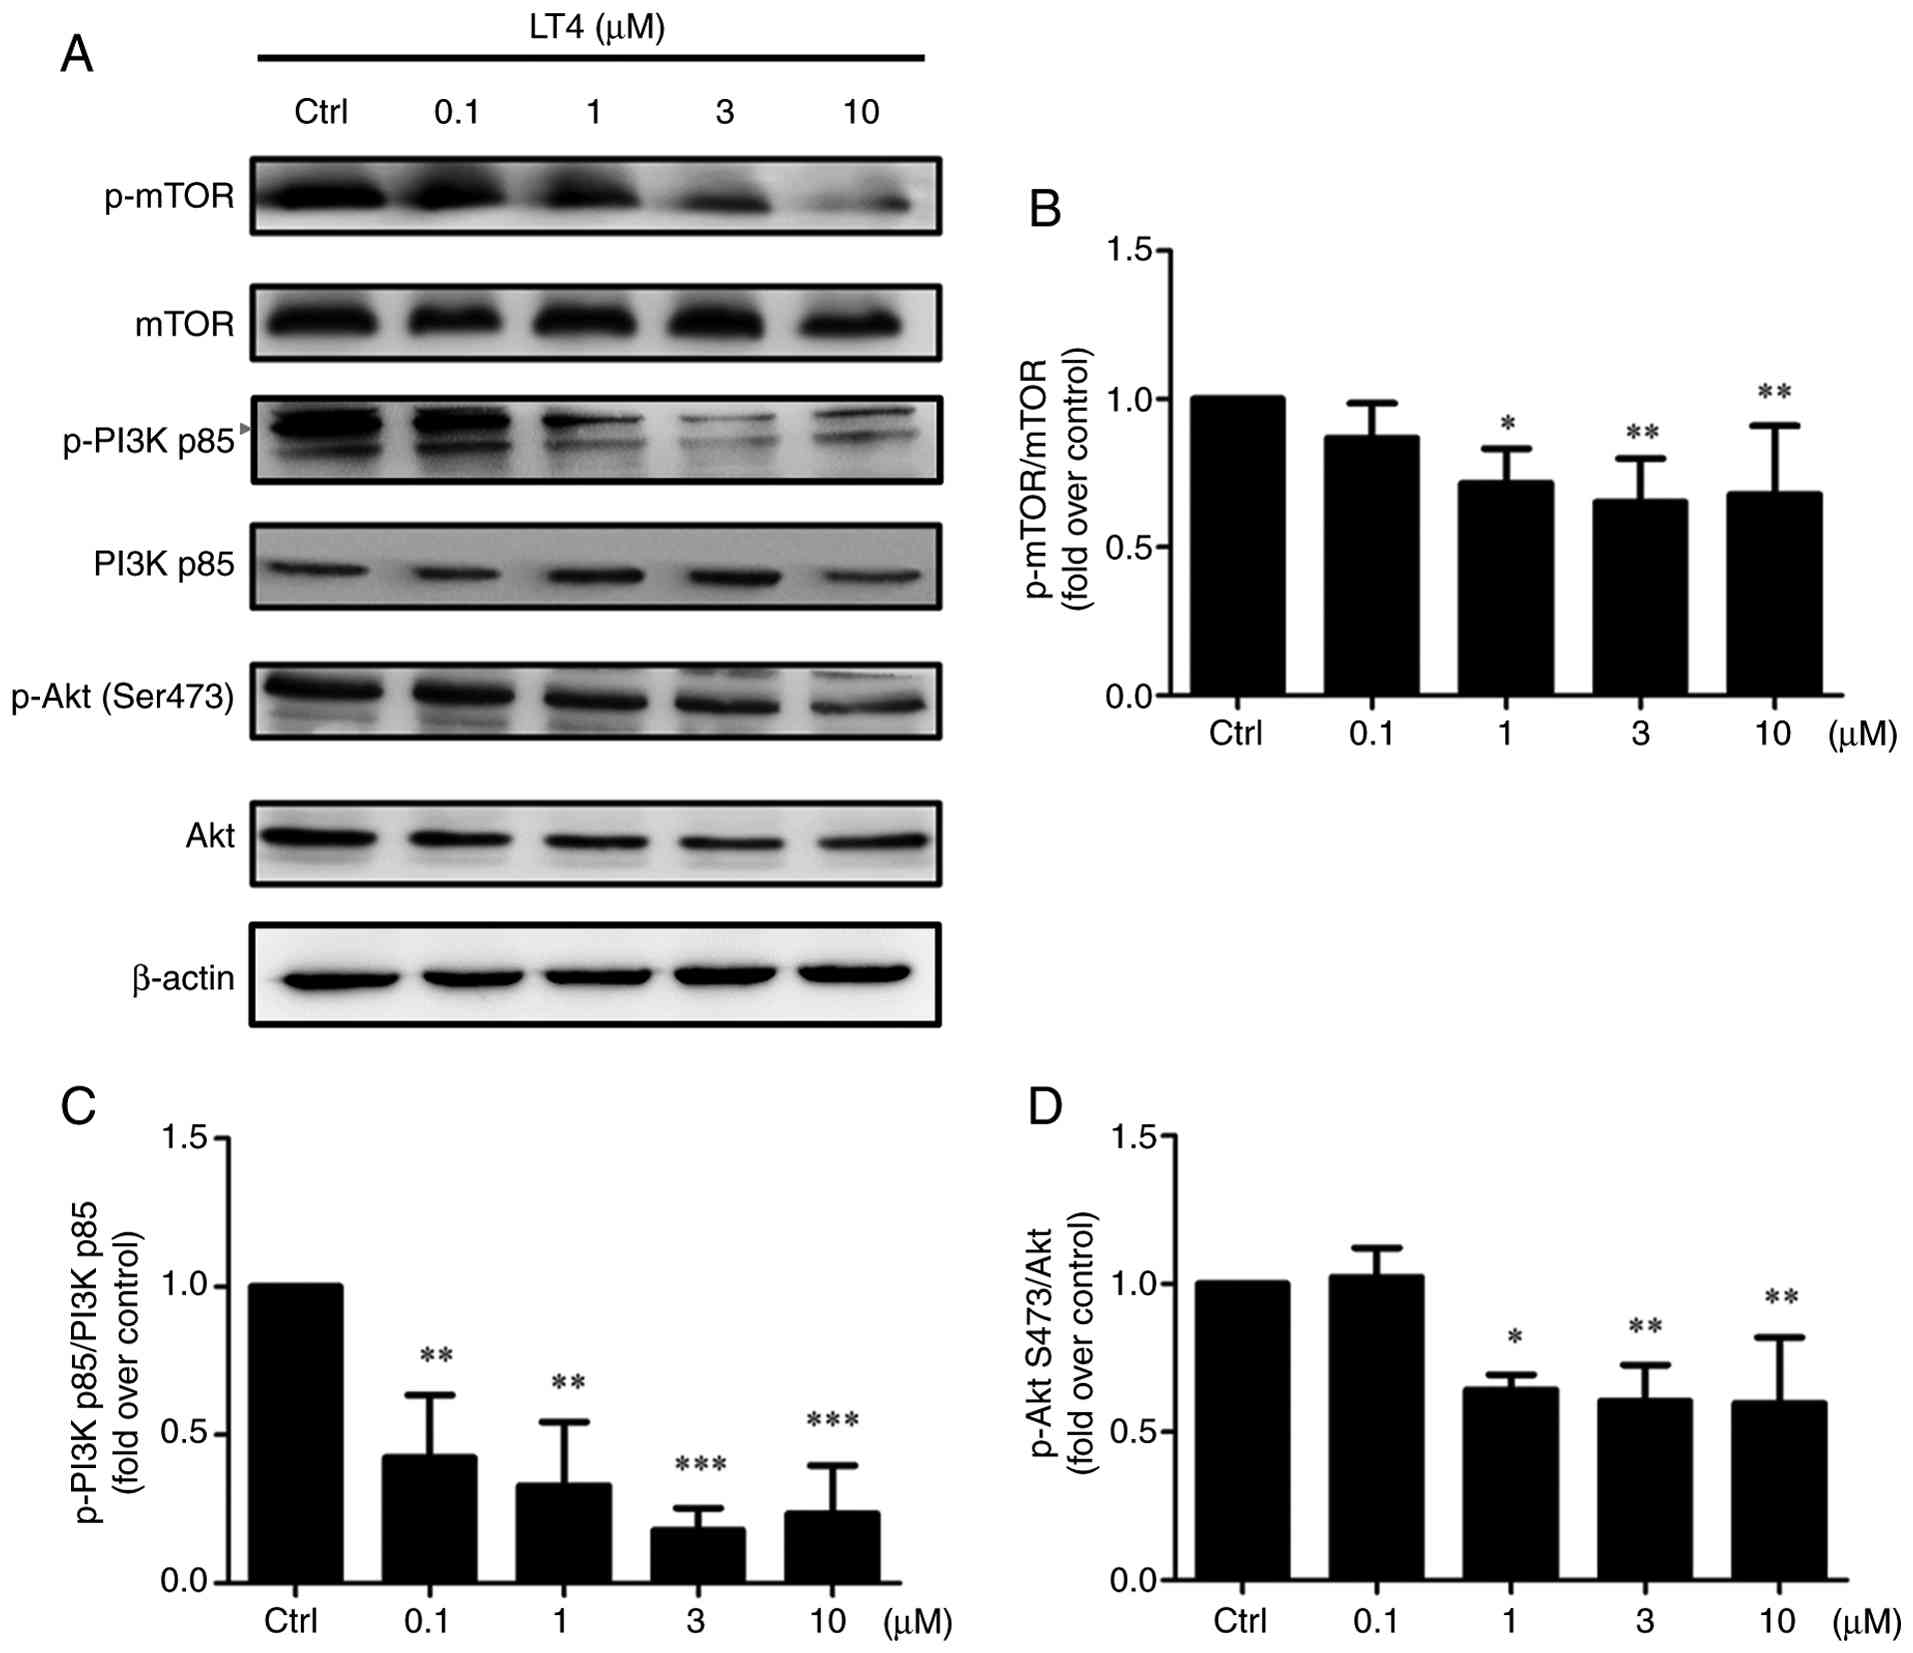 | Figure 5LT4 inhibits PI3K/AKT/mTOR signaling
in HCT116 cells. (A) Western blot analysis of p-PI3K (p85, 85 kDa),
total PI3K, p-AKT (Ser473, 60 kDa), total AKT, p-mTOR (289 kDa) and
total mTOR in cells treated with LT4 (0.1, 1, 3 and 10 μM)
for 24 h. β-actin (45 kDa) served as the loading control.
Semi-quantification of (B) p-mTOR/mTOR, (C) p-PI3K p85/PI3K p85 and
(D) p-AKT (Ser473)/AKT. Data are presented as the mean ± SD from
three independent experiments. Representative blots are shown; bar
graphs represent densitometric quantification from three
independent experiments (n=3), normalized to the indicated total
protein, and expressed as fold change relative to the
vehicle-treated Ctrl. *P<0.05,
**P<0.01, ***P<0.001 vs.
vehicle-treated Ctrl. LT4, 4-acetylantrocamol LT3; p-,
phosphorylated; Ctrl, control. |
The downstream targets of AKT were next evaluated.
Densitometric quantification of three independent western blot
experiments showed that LT4 increased FOXO3a protein levels,
reaching statistical significance at 3-10 μM (Fig. 6A and B), and increased
p27kip1 levels at 1 and 10 μM (Fig. 6A and C), both of which have been
implicated in tumor suppression (48,49). In parallel, the p-FOXO1/FOXO1
ratio was reduced at 10 μM (Fig. 6D and E). Moreover, LT4 increased
the p-GSK3β/GSK3β ratio, with a significant peak at 1 μM
(Fig. 6D and F). Collectively,
these findings indicated that LT4 modulated the PI3K/AKT/GSK3β/FOXO
pathway, leading to cell cycle inhibition and enhanced apoptotic
potential in CRC cells.
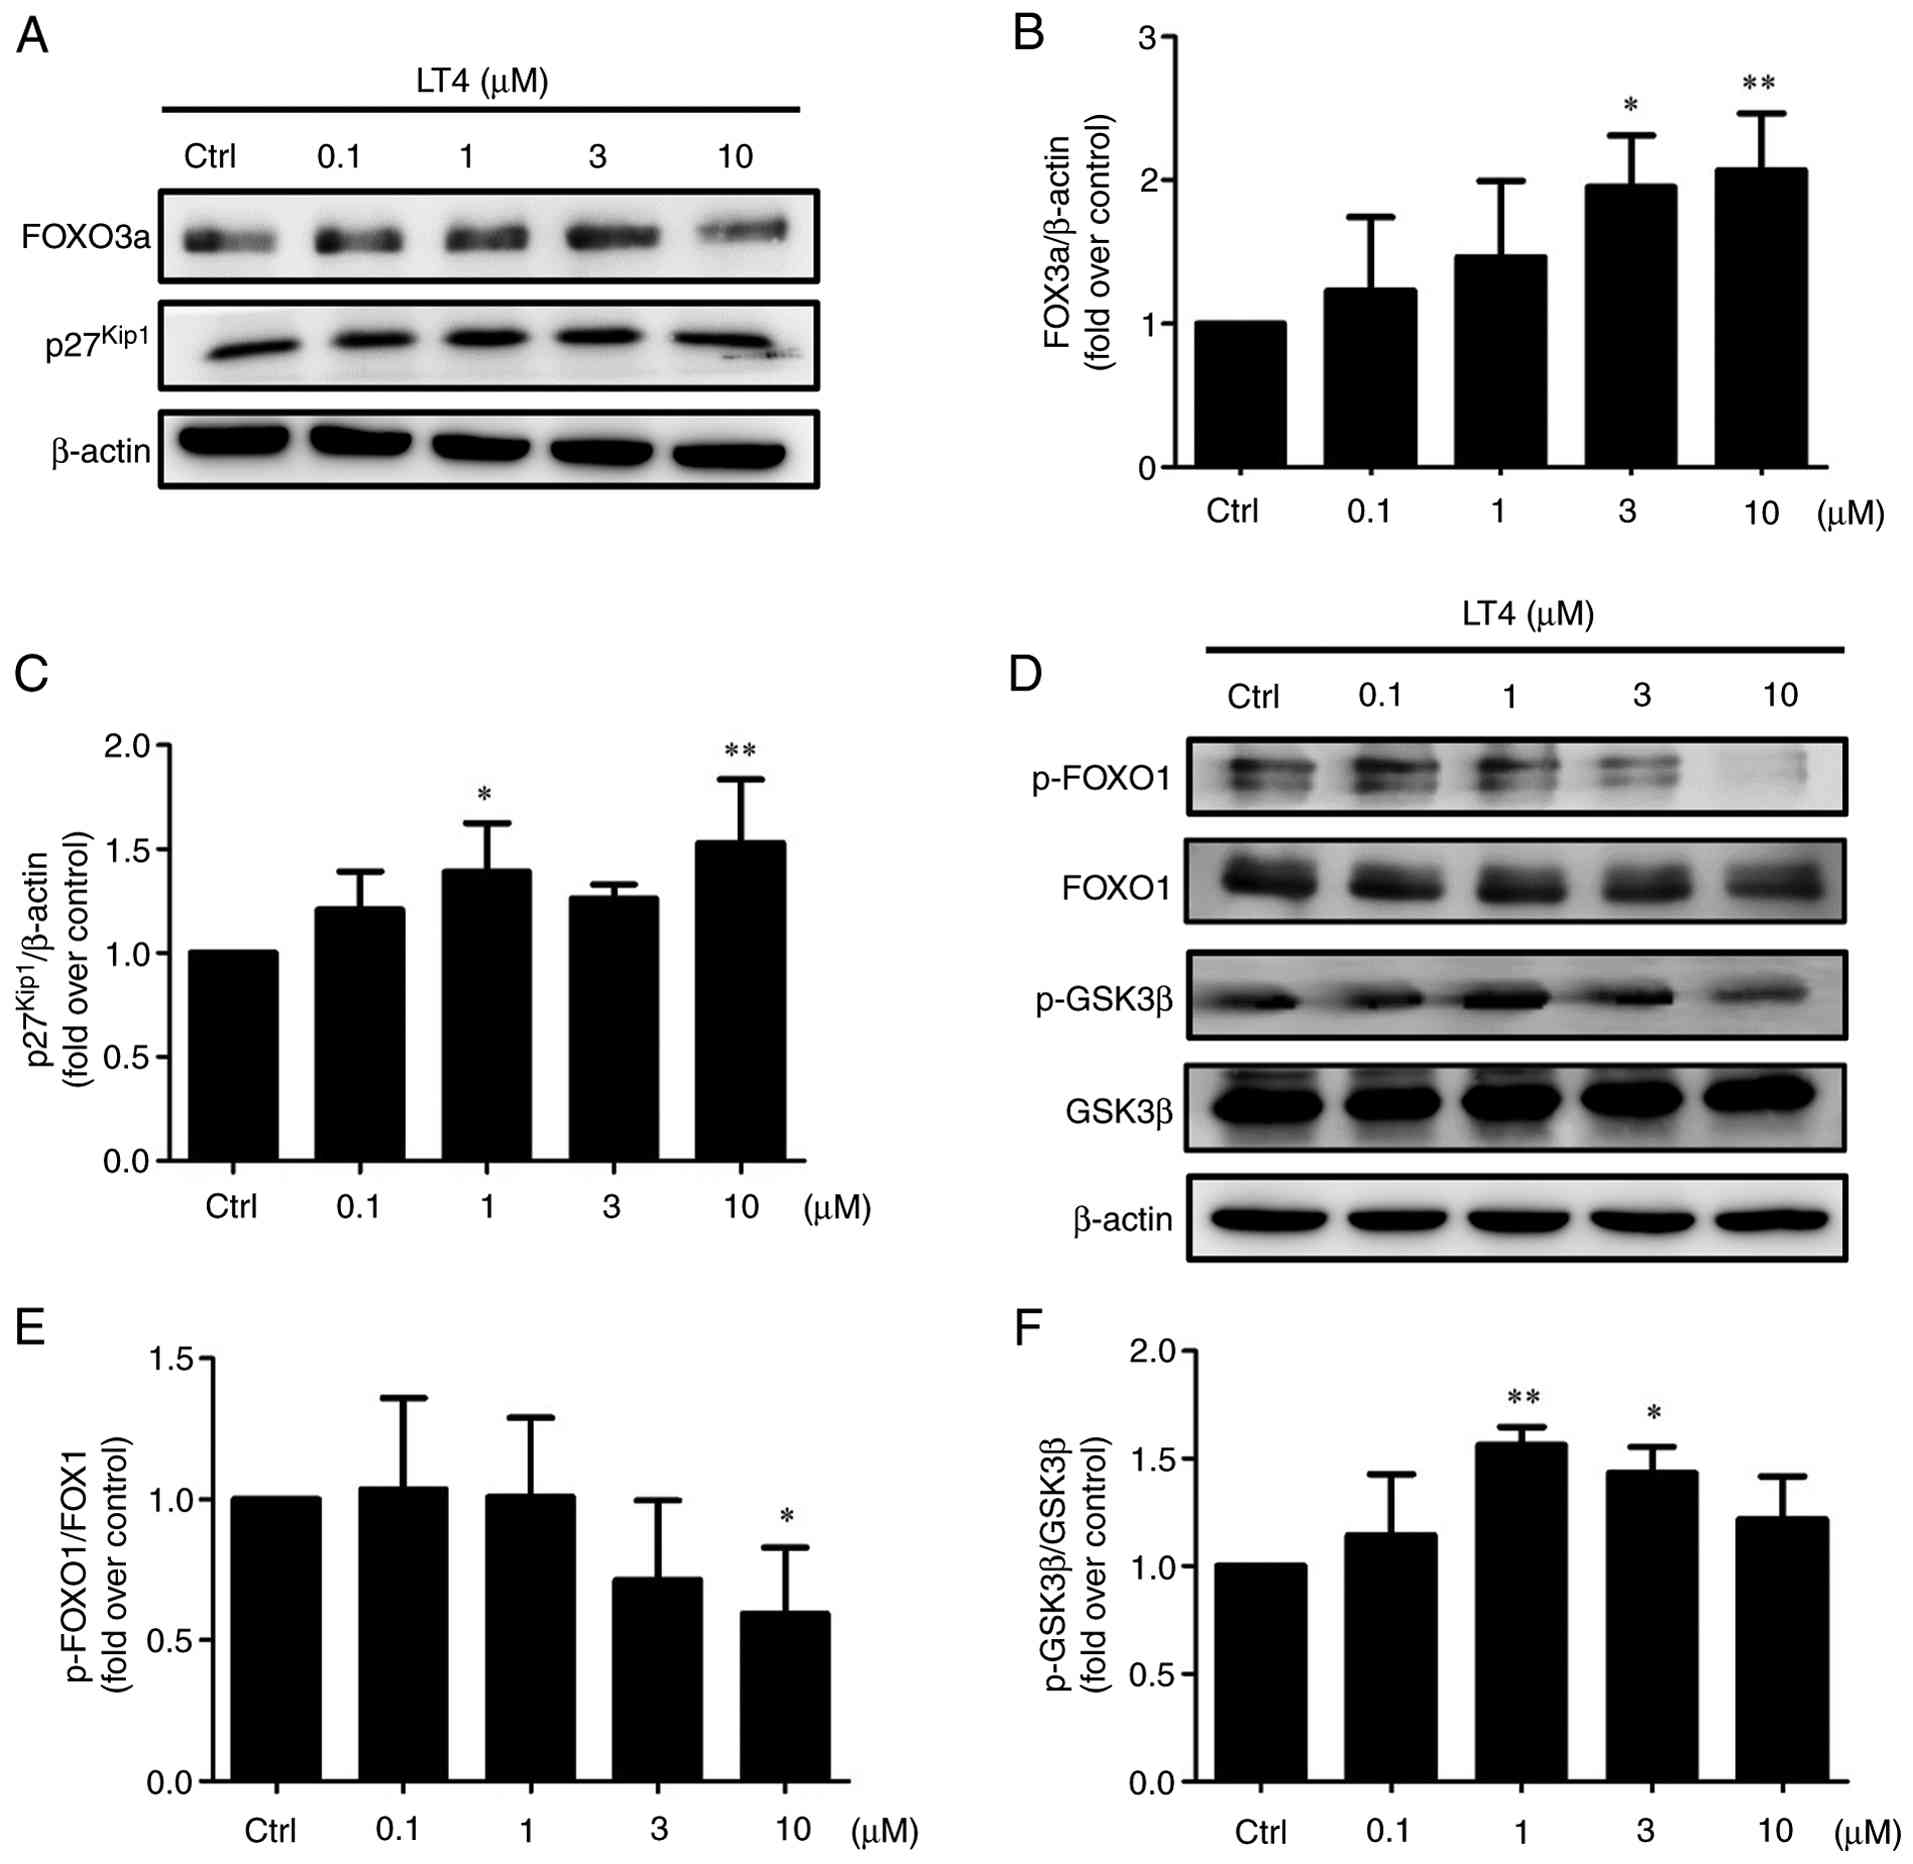 | Figure 6LT4 modulates downstream PI3K/AKT
signaling via FOXO3a, p27kip1, FOXO1 and GSK3β in HCT116
cells. HCT116 cells were treated with LT4 (0.1, 1, 3 and 10
μM) for 24 h, followed by western blotting and densitometric
analysis. (A) Representative western blots of FOXO3a (82-97 kDa)
and p27kip1 (27 kDa), with β-actin (45 kDa) as the
loading control. (B) Densitometric quantification of
FOXO3a/β-actin. (C) Densitometric quantification of
p27kip1/β-actin. (D) Representative western blots of
p-FOXO1 (Ser256), total FOXO1 (78-82 kDa), p-GSK3β (Ser9) and total
GSK3β (46 kDa). β-actin (45 kDa) served as the loading control. (E)
Densitometric quantification of p-FOXO1/FOXO1. (F) Densitometric
quantification of p-GSK3β/GSK3β. Data are presented as the mean ±
SD from three independent experiments. Bar graphs represent
densitometric quantification from three independent experiments
(n=3), normalized to the indicated total protein or β-actin, and
expressed as fold change relative to the vehicle-treated Ctrl.
*P<0.05, **P<0.01 vs. vehicle-treated
Ctrl. LT4, 4-acetylantrocamol LT3; p-, phosphorylated; Ctrl,
control. |
LT4 suppresses the ERK branch of the MAPK
pathway while activating the p38-p21 axis and reducing COX-2
expression
Given that LT4 inhibits the PI3K/AKT/mTOR and
GSK3β/FOXO axes, both crucial for cell cycle regulation, it was
next investigated whether MAPK signaling, another central pathway
regulating proliferation and stress response, is also modulated by
LT4.
As shown in Fig.
7A, LT4 treatment markedly decreased p-ERK levels in a
dose-dependent manner, while total ERK remained unchanged.
Semi-quantification confirmed significant suppression of ERK
activation at all tested concentrations (Fig. 7B), indicating that LT4 inhibited
the ERK arm of MAPK signaling, potentially reducing proliferative
signaling. Notably, the level of p-p38 MAPK, another branch of the
MAPK pathway often associated with cellular stress responses, was
significantly upregulated at 3 μM LT4 (Fig. 7D). This shift may reflect a
compensatory response or cell cycle regulatory mechanism.
Consistent with this, the expression of p21, a cyclin-dependent
kinase inhibitor and downstream target of both ERK and p38
(50-52), was markedly elevated in a
dose-dependent manner, with the highest expression at 10 μM
(Fig. 7A and C). Collectively,
these findings indicate that LT4 activated the p38-p21 axis,
thereby promoting p21-mediated cell cycle arrest (51,53), while simultaneously dampening
ERK-mediated proliferative signaling.
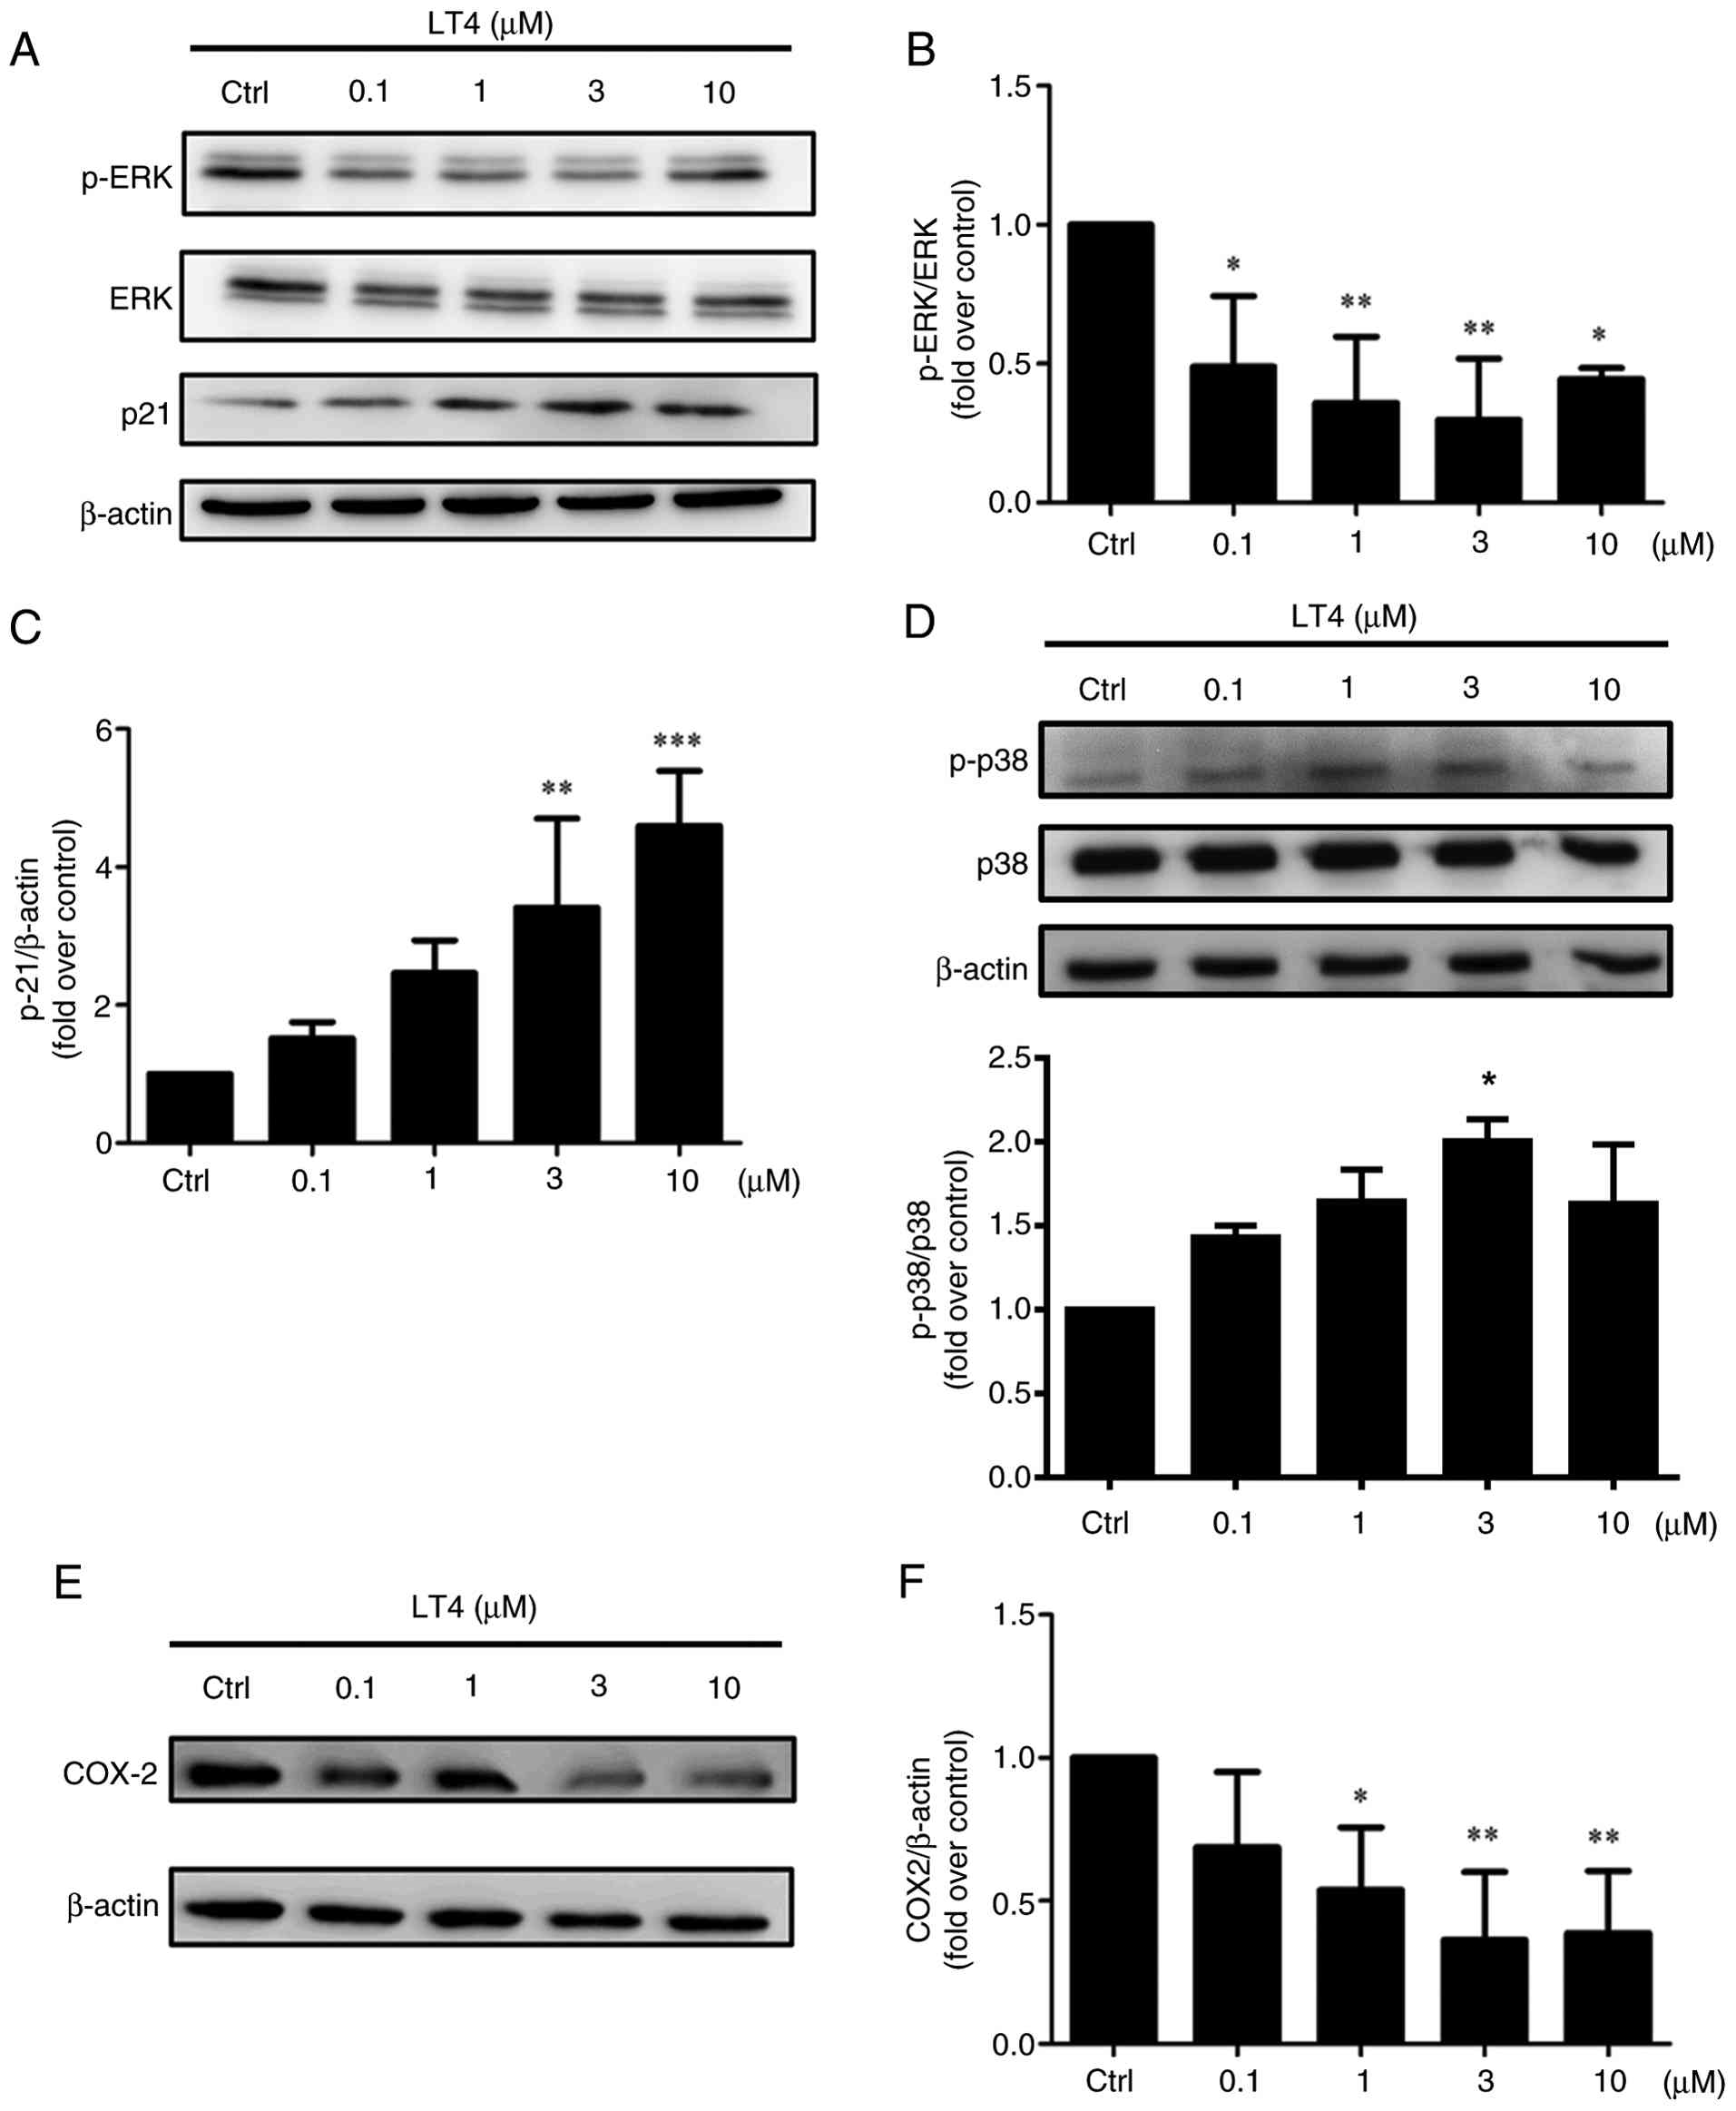 | Figure 7LT4 modulates the MAPK signaling
pathway and suppresses COX-2 protein expression in HCT116 cells.
HCT116 cells were treated with LT4 (0.1, 1, 3 and 10 μM) for
24 h. (A) Representative western blots of p-ERK1/2 (42/44 kDa),
total ERK1/2 and p21 (21 kDa), with β-actin (45 kDa) as the loading
control. (B) Densitometric quantification of p-ERK/ERK. (C)
Densitometric quantification of p21/β-actin. (D) Representative
western blots of p-p38 (43 kDa) and total p38 (40 kDa), with
β-actin as the loading control, and corresponding densitometric
quantification of p-p38/p38. (E) Representative western blot of
COX-2 (74 kDa) with β-actin as the loading control. (F)
Densitometric quantification of COX-2/β-actin. Data are presented
as the mean ± SD from three independent experiments (n=3).
Representative blots are shown; bar graphs represent densitometric
quantification from three independent experiments (n=3), normalized
to the indicated total protein or β-actin, and expressed as fold
change relative to the vehicle-treated Ctrl. *P<0.05,
**P<0.01, ***P<0.001 vs.
vehicle-treated Ctrl. LT4, 4-acetylantrocamol LT3; p-,
phosphorylated; Ctrl, control; COX-2, cyclooxygenase-2. |
To further clarify the anti-proliferative and
pro-apoptotic mechanisms of LT4, its effect on COX-2, a known
downstream effector of both the PI3K/AKT and MAPK pathways and a
pro-tumorigenic factor in CRC, was examined (54-56). Western blot analysis demonstrated
a consistent, dose-dependent decrease in COX-2 protein levels
following LT4 treatment (Fig. 7E and
F), suggesting that LT4 may suppress inflammatory and survival
pathways downstream of ERK and PI3K.
Together, these results support a model in which LT4
modulates multiple MAPK signaling branches to reduce proliferation
(via ERK inhibition and COX-2 suppression) and induce cell cycle
arrest (via p38-mediated p21 upregulation), complementing its
effects on PI3K/AKT signaling.
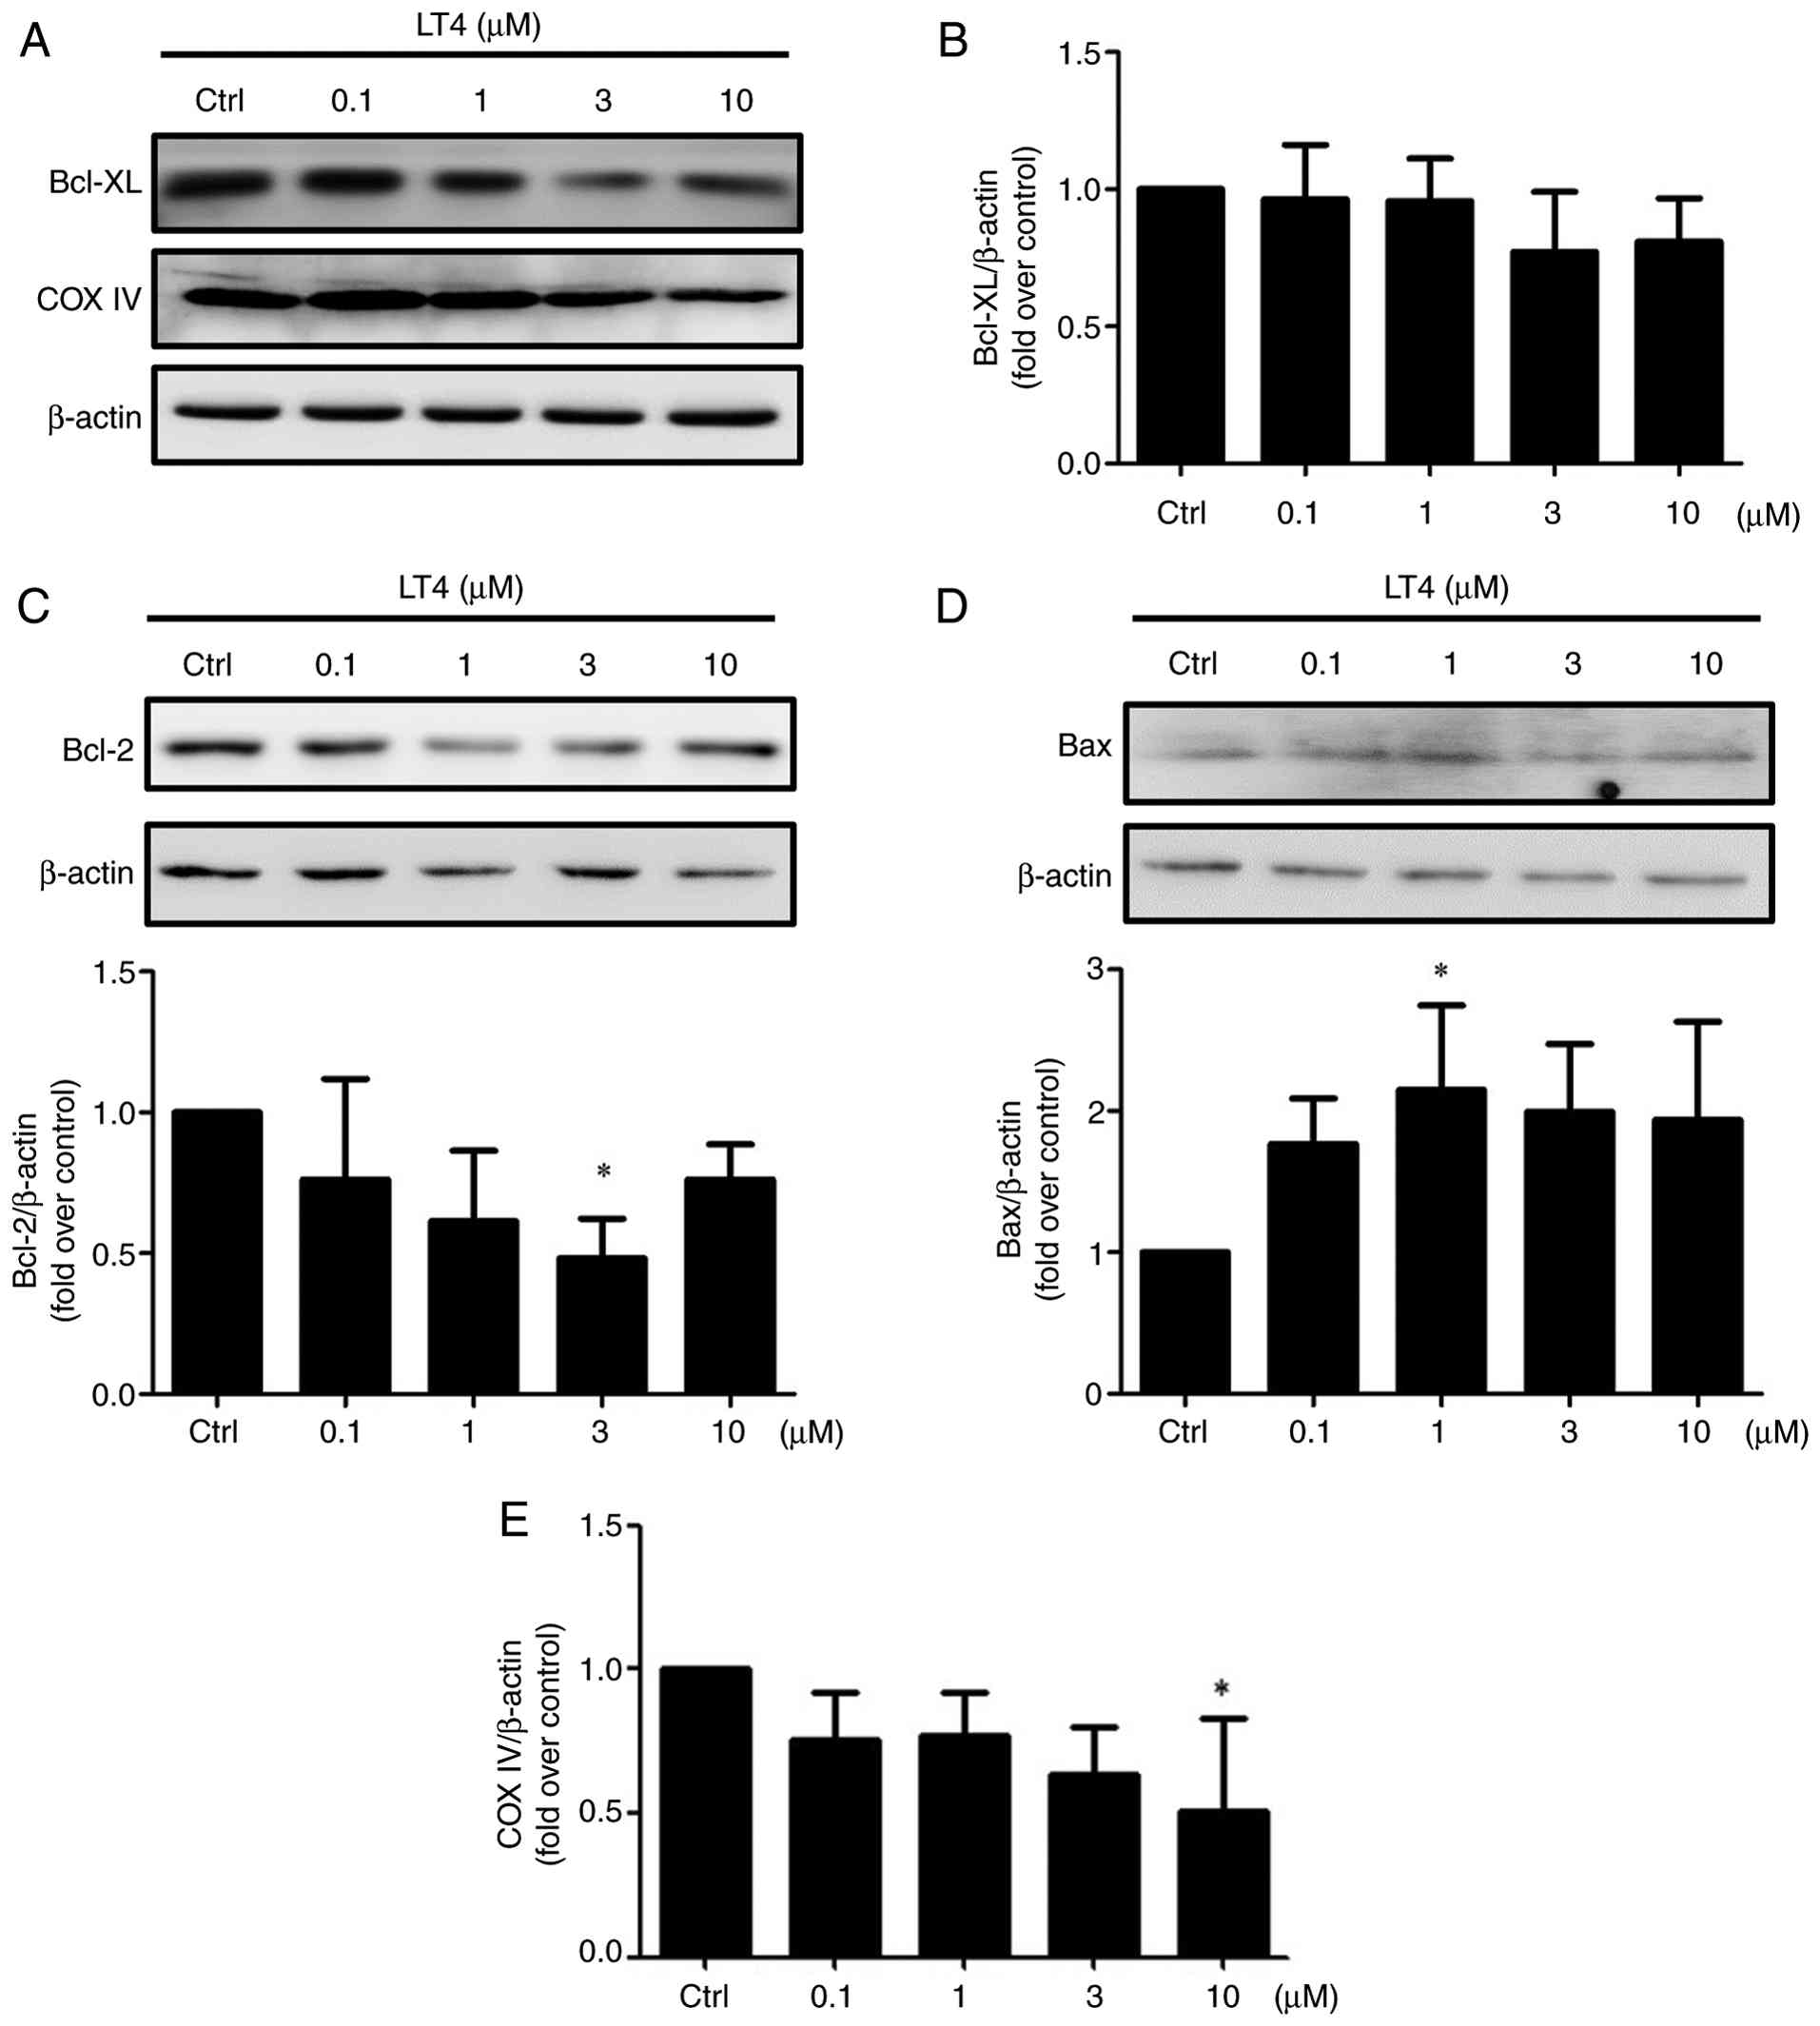
LT4 modulates the levels of Bcl-2 family
proteins and the mitochondrial marker COX IV in HCT116 cells
Since both p38 MAPK and the PI3K/AKT/GSK3β/FOXO axis
are known to regulate apoptotic signaling (57-64), it was next investigated whether
LT4 treatment modulated Bcl-2 family protein expression in HCT116
cells. As shown in Fig. 8A and
B, Bcl-XL levels showed no significant changes across the
tested concentrations. By contrast, Bcl-2 was significantly reduced
at 3 μM LT4 (Fig. 8C).
Conversely, the expression of the pro-apoptotic protein Bax was
significantly increased at 1 μM (Fig. 8D), consistent with a shift toward
a pro-apoptotic Bcl-2/Bax balance following LT4 exposure. To
further investigate whether LT4 also affects
mitochondrial-associated protein expression, the expression of COX
IV, a mitochondrial inner membrane protein commonly used as a
mitochondrial marker (65), was
assessed. COX IV expression was slightly but significantly reduced
at 10 μM (Fig. 8A and E),
suggesting that high-dose LT4 may alter mitochondrial-associated
protein levels. Together, these data indicate that LT4 shifts Bcl-2
family protein expression toward a pro-apoptotic profile and is
accompanied by a reduction in the mitochondrial marker COX IV at
higher concentrations, suggesting possible involvement of
mitochondrial-associated apoptotic signaling.
Molecular docking suggests LT4 stably
binds to the ATP-binding pocket of PI3Kγ
Among the numerous signaling components modulated by
LT4, PI3K appeared as a central regulatory node. Western blot
analysis showed consistent and robust inhibition of phosphorylated
PI3K (p85 subunits), while transcriptomic KEGG enrichment further
supported the PI3K/AKT pathway as one of the most significantly
affected signaling cascades. GO terms related to kinase regulation,
focal adhesion and cell cycle regulation likewise pointed toward
upstream PI3K involvement. To validate whether PI3K could serve as
a direct target of LT4, a molecular docking study was conducted
using PI3Kγ (PDB ID: 1E7U) as the receptor template. The 1E7U
structure represents a co-crystallized complex of PI3Kγ with
wortmannin (KWT), a classical covalent inhibitor of PI3K, enabling
precise definition of the ATP-binding pocket (23). Antroquinonol, a structural
analogue of LT4 derived from A. cinnamomea and previously
shown to exhibit anti-CRC activity, was included as a natural
compound comparator (66,67).
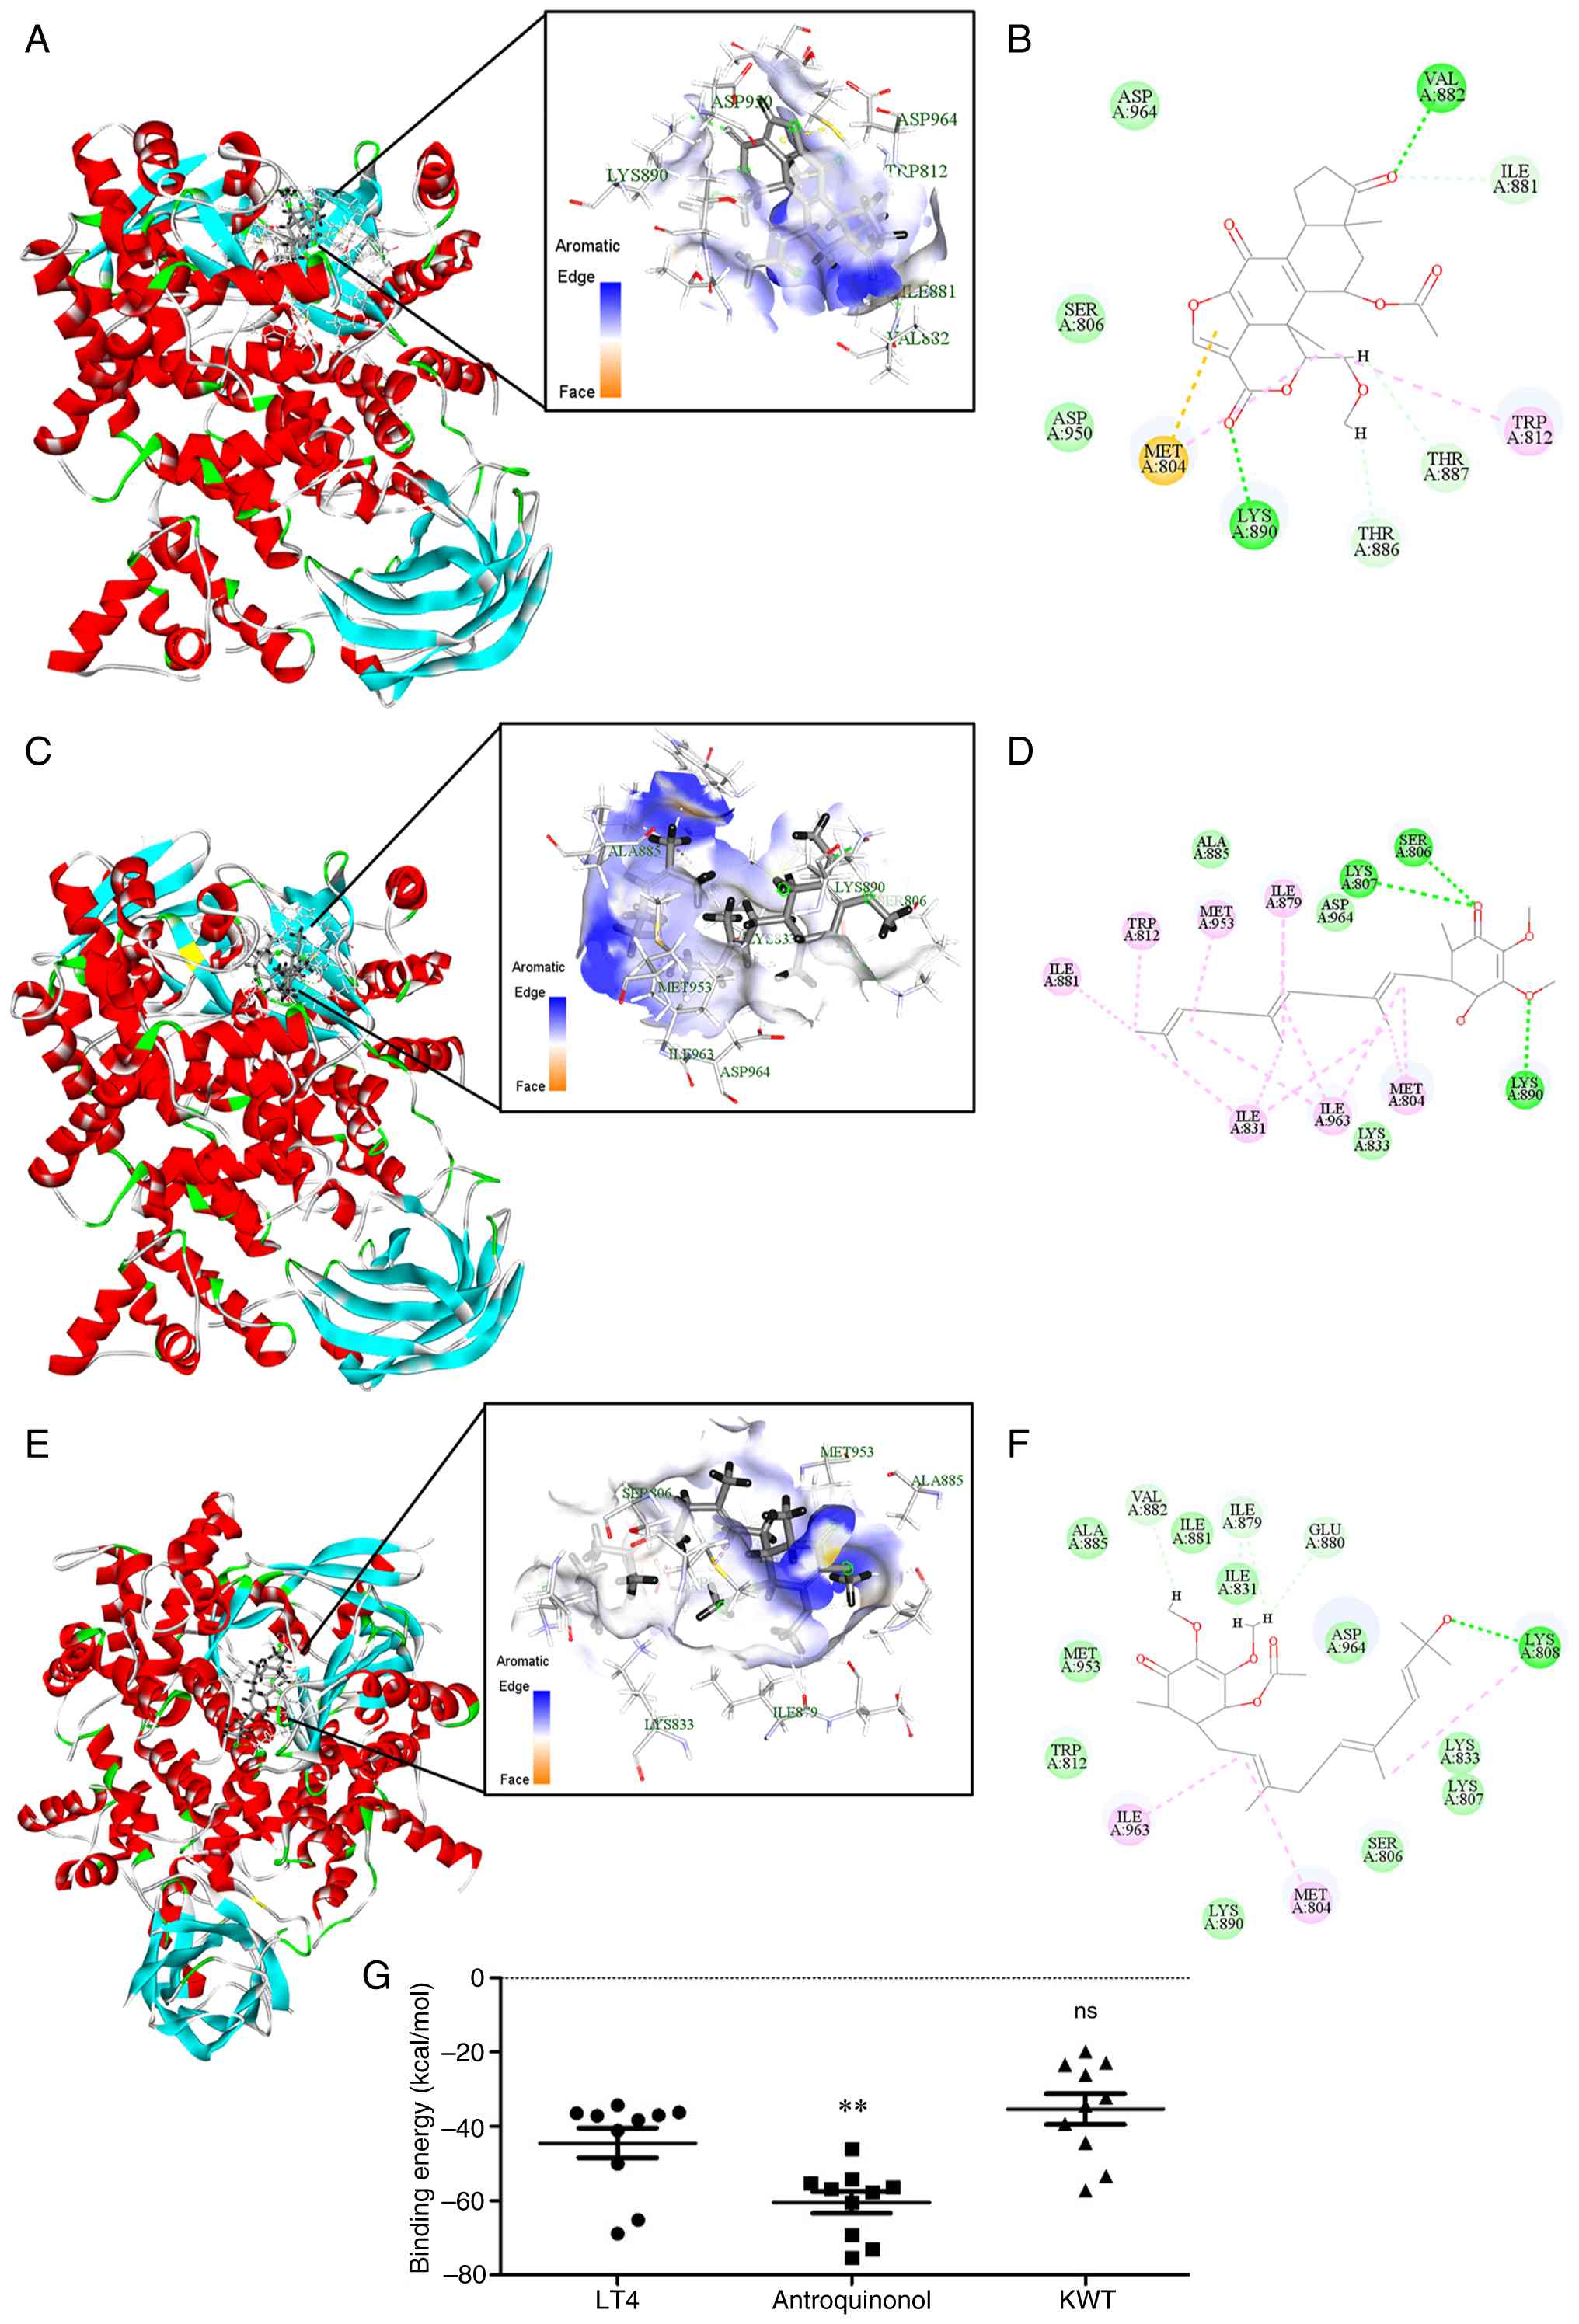
Since the receptor structure (PDB ID: 1E7U) contains
a co-crystallized KWT complex, KWT was first removed and re-docked
as a positive control to validate the docking settings and pocket
definition. Using the same grid and parameters, antroquinonol and
LT4 were then docked into the PI3Kγ ATP-binding pocket to enable a
head-to-head comparison of predicted binding modes and binding
energies under identical conditions. The original PI3Kγ-wortmannin
co-crystal structure was reported by Walker et al (23). Docking simulations revealed that
KWT bound deeply within the ATP-binding cleft of PI3Kγ, forming key
interactions with residues such as Val-882 and Lys-890 (Fig. 9A and B). Antroquinonol displayed
stable binding by forming a hydrogen bond with Lys-890 and
positioning its long side chain within a hydrophobic pocket
bordered by residues such as Ser806, Lys833, Ala885, Ile963 and
Asp964 (Fig. 9C and D). LT4
adopted a binding position similar to antroquinonol, forming van
der Waals contacts with Lys-833, a carbon-hydrogen bond with
Val-882 and sharing interaction sites with residues Ile-963 and
Asp-964 (Fig. 9E and F). These
results suggested that LT4 may occupy the ATP pocket of PI3Kγ in a
biologically relevant orientation.
Binding energy calculations showed that
antroquinonol had the strongest predicted binding energy
(-60.49±2.90 kcal/mol), significantly lower than that of LT4
(-44.50±4.01 kcal/mol; P=0.0047), whereas LT4 and KWT (-35.37±4.13
kcal/mol) were not significantly different (Fig. 9G). While LT4 did not exhibit the
most favorable predicted binding energy among the tested compounds,
its consistent docking position and stable interaction profile
within the PI3K active site support its potential to engage PI3K
and contribute to downstream signaling inhibition, as observed in
both transcriptomic and biochemical analyses.
Discussion
The present study comprehensively investigated the
therapeutic potential and underlying mechanisms of LT4, a
triterpenoid derivative from A. cinnamomea mycelium, in
human CRC HCT116 cells. The data demonstrated that LT4
significantly suppressed cell viability, colony formation and cell
migration, while inducing apoptosis-related signaling and
decreasing the mitochondrial marker COX IV.
Studies have shown that A. cinnamomea
extracts exert anti-CRC effects primarily through autophagy and
apoptosis induction. For instance, a study demonstrated that A.
cinnamomea activates the CHOP/TRB3/AKT/mTOR pathway to induce
autophagic cell death in CRC cells (12), while another identified Antrodin
C, a compound isolated from A. cinnamomea, as an apoptosis
inducer via ROS/AKT/ERK/P38 signaling and histone acetylation of
the TNFα promoter (19).
However, mechanistic elucidation at the level of signaling network
modulation and direct molecular targeting has been limited.
Compared with prior findings, the present study is the first to
integrate RNA-seq, KEGG/GO enrichment, PPI network mapping, western
blot validation and molecular docking to elucidate the multi-target
anti-CRC potential of LT4.
In the present study, transcriptomic profiling
revealed enrichment of the PI3K/AKT signaling pathway, consistent
with the western blot data, where LT4 significantly downregulated
p-PI3K, p-AKT and p-mTOR. These effects were accompanied by
modulation of downstream effectors in the GSK3β-FOXO axis,
including upregulation of tumor suppressors p21, FOXO3a and
p27kip1. In parallel, ERK suppression and p38/p21
upregulation within the MAPK cascade were identified, supporting a
dual mechanism involving both proliferative inhibition and
stress-induced cell cycle arrest. Notably, molecular docking
validated PI3K as a potential direct target of LT4. LT4 occupied
the same ATP-binding pocket as KWT, the classical PI3K inhibitor
(PDB: 1E7U) (23), and
demonstrated a stable binding profile similar to that of
antroquinonol, another A. cinnamomea-derived compound.
Although its binding energy was not as strong as antroquinonol, LT4
showed a more favorable docking energy than KWT, supporting its
moderate but functionally relevant PI3K-targeting capacity.
In the present study, among the identified hub
genes, SLC3A2 and CCND1 emerged as central nodes in the PPI
network, both previously linked to CRC progression via nutrient
signaling and cell cycle regulation (41,43). In line with this, LT4 was shown
to inhibit EMT-associated markers, reversed cadherin switching and
downregulate COX-2, an inflammatory effector downstream of PI3K and
MAPK, reinforcing the pleiotropic nature of LT4-mediated
inhibition.
Based on the full STRING-derived interaction
network, combined with CytoHubba centrality scoring and MCODE
clustering, PSAT1 and CHAC1 emerged as consistently high-ranking
genes across multiple topological metrics in the present study,
underscoring their potential functional importance in the
LT4-regulated network. PSAT1 is a key enzyme in the serine
biosynthesis pathway and its upregulation has been shown to promote
CRC cell proliferation and metastasis through activation of the
Hippo-YAP/TAZ-ID1 axis, independent of its metabolic activity
(68). PSAT1 has also been
implicated in chemoresistance and is associated with poor prognosis
in CRC (68-70). CHAC1 contributes to redox
regulation by degrading glutathione and modulating oxidative
stress. Elevated CHAC1 expression has been associated with
ferroptosis induction and poor survival outcomes in several cancer
types, including CRC (32,71).
The results of the present study also support the
effect of LT4 on cell cycle regulation. Transcriptomic enrichment
pointed to KEGG and GO terms related to cell cycle checkpoints and
proliferation, while hub gene analysis identified CCND1 and PSAT1
as central regulators. These findings were functionally consistent
with the observed induction of p21 and p27kip1, both
inhibitors of cyclin-dependent kinases, and suppression of CCND1
signaling. Taken together, these findings support a role for LT4 in
cell-cycle regulatory perturbation, thereby restricting CRC cell
proliferation in concert with the modulation of upstream PI3K/AKT
and MAPK cascades, including the induction of FOXO3a and reduction
of p-FOXO1 levels.
To further distill the mechanistic landscape of the
effects of LT4, a summary schematic (Fig. 10) that integrates key signaling
pathways and transcriptionally regulated nodes was constructed.
This model highlights the ability of LT4 to interfere with
PI3K/AKT/mTOR, GSK3β/FOXO, MAPK/p38 and apoptosis-related signaling
cascades. The inclusion of PSAT1 and CHAC1 in this framework
underscores their potential as novel downstream mediators of LT4's
antitumor activity.
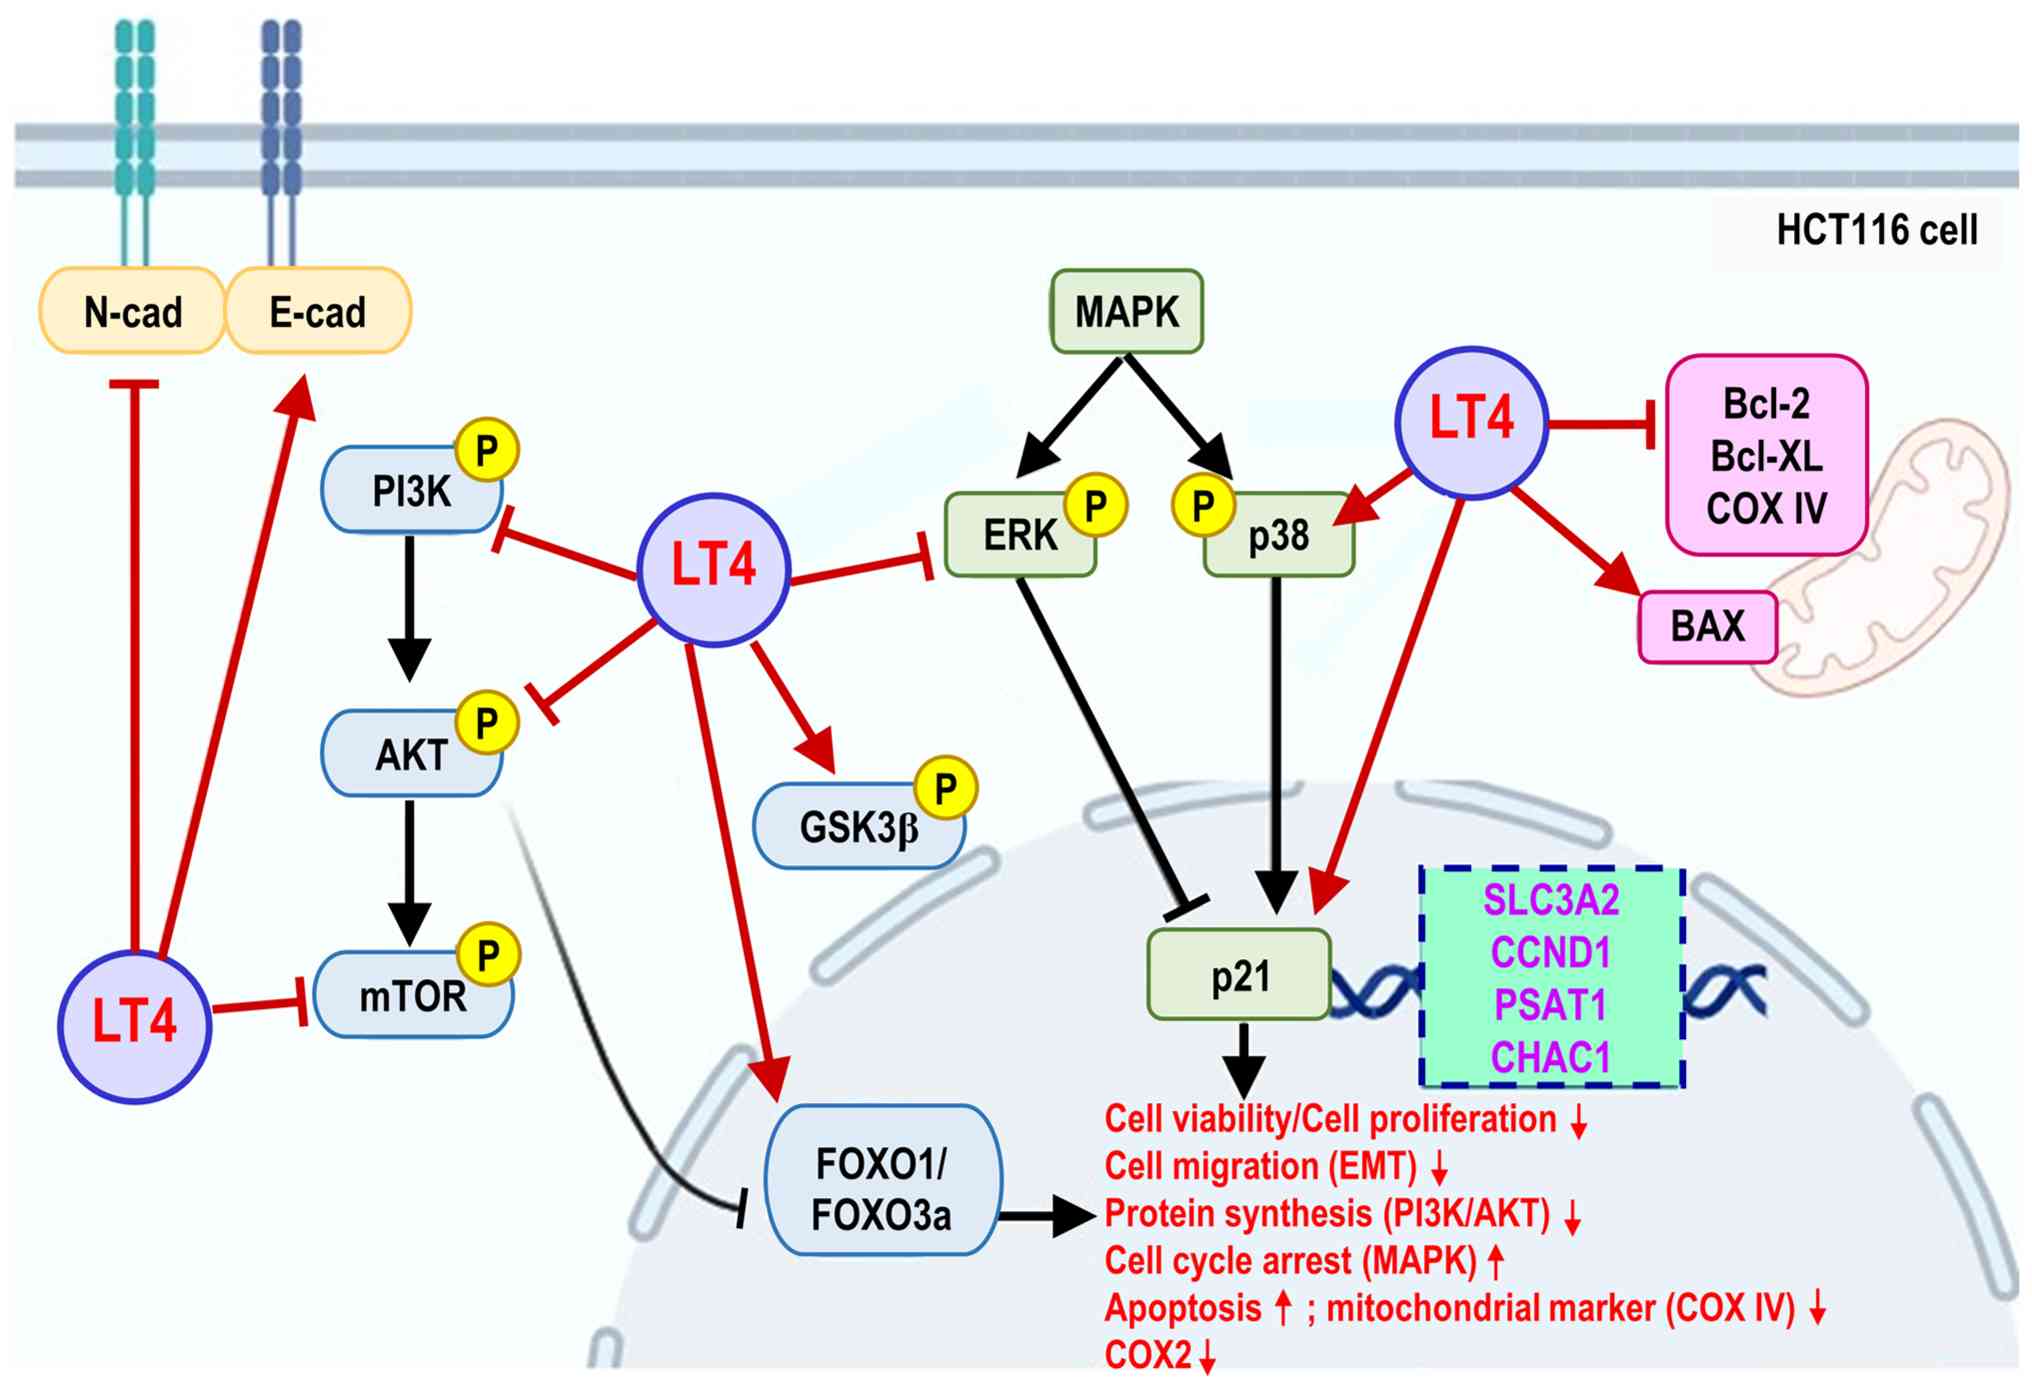 | Figure 10Proposed schematic model of
LT4-mediated anticancer signaling regulation in HCT116 colorectal
cancer cells. This schematic summarizes the proposed major pathways
and regulatory nodes modulated by LT4, based on transcriptomic,
western blotting and molecular docking analyses. LT4 inhibits the
PI3K/AKT/mTOR signaling cascade, as reflected by reduced
phosphorylation signaling and the annotated functional outcomes
(cell viability/cell proliferation and protein synthesis). In
addition, LT4 shifts EMT marker expression toward an epithelial
phenotype (increased E-cadherin and decreased N-cadherin). In
parallel, LT4 modulates the GSK3β-FOXO1/FOXO3a node and
differentially regulates MAPK signaling by suppressing ERK
phosphorylation while enhancing p38 activation, accompanied by p21
upregulation, consistent with cell-cycle arrest and stress-response
phenotypes. LT4 also modulates apoptosis by decreasing the levels
of anti-apoptotic proteins (Bcl-2 and Bcl-XL) and increasing Bax
expression, alongside mitochondrial destabilization (COX IV) and
COX-2 suppression. Key hub genes identified through protein-protein
interaction network analysis, SLC3A2, CCND1, PSAT1 and CHAC1, are
highlighted as potential mediators linking transcriptomic
regulation to these functional outcomes. Black arrows indicate
canonical interactions supported by previous studies; red arrows
indicate regulatory effects supported by the experimental data in
the present study; dashed lines indicate docking-predicted
interactions. Arrows indicate activation, whereas blunt-ended lines
indicate inhibition. LT4, 4-acetylantrocamol LT3; PI3K,
phosphoinositide 3-kinase; AKT, protein kinase B; mTOR, mechanistic
target of rapamycin; MAPK, mitogen-activated protein kinase; ERK,
extracellular signal-regulated kinase; GSK3β, glycogen synthase
kinase 3 β; FOXO, forkhead box O; BAX, COX IV, cytochrome c oxidase
subunit IV; COX-2, cyclooxygenase-2; N-cad, N-cadherin; E-cad,
E-cadherin; EMT, epithelial-mesenchymal transition; P,
phosphorylation; SLC3A2, solute carrier family 3 member 2; CCND1,
cyclin D1; PSAT1, phosphoserine aminotransferase 1; CHAC1, ChaC
glutathione-specific γ-glutamylcyclotransferase 1. |
Limitations of the present study should be
acknowledged. First, all functional assays were performed in
vitro, and no in vivo xenograft models were included.
Although the data consistently demonstrated that LT4 modulates
PI3K/AKT/mTOR and MAPK signaling pathways in CRC cells, the lack of
animal studies limits the extrapolation of these findings to
complex tumor microenvironments. Future studies employing xenograft
or patient-derived models will be required to validate the
therapeutic relevance and pharmacokinetic properties of LT4 in
vivo. Second, most mechanistic experiments were conducted in
the HCT116 cell line, which harbors a KRAS mutation and served as a
responsive model in the present study. While this approach provided
consistent insights into the antitumor mechanisms of LT4, it did
not capture the full spectrum of genetic heterogeneity in CRC.
Validation in additional KRAS-mutant cell lines, or other
genetically diverse CRC models, will be essential to strengthen the
generalizability of these findings. Third, although network
topology analysis consistently highlighted hub genes such as
SLC3A2, PSAT1 and CHAC1, the present study did not include direct
functional assays to establish their causal involvement in
mediating the anticancer effects of LT4. These genes were
identified bioinformatically as central regulators within the
LT4-responsive network, but experimental knockdown or
overexpression studies will be required to validate their
mechanistic roles. Finally, although LT4 was shown to consistently
suppress the phosphorylation of PI3K (p85 subunits) in HCT116 cells
and molecular docking analysis supported PI3Kγ as a potential
direct target of LT4, no functional confirmation was performed in
the present study. Biochemical kinase and genetic approaches, such
as PI3K overexpression or the expression of constitutively active
mutants, would be required to verify direct PI3K engagement and to
determine whether the inhibitory effects of LT4 are specifically
mediated through PI3K.
In conclusion, to the best of our knowledge, the
present study provides the first integrative evidence that LT4, a
compound from A. cinnamomea mycelium, exerts anti-CRC
activity by modulating multiple key signaling pathways, including
PI3K/AKT/mTOR, GSK3β/FOXO, MAPK, apoptosis and COX-2. Through
transcriptomic, biochemical and molecular docking validation, it
was demonstrated that LT4 not only regulated signaling cascades at
the transcriptional and protein levels but may also directly engage
PI3K as a potential target. These findings establish LT4 as a
promising candidate for further preclinical development in CRC
therapy, particularly for tumors with KRAS mutations, where
treatment options remain limited. Future studies are warranted to
evaluate in vivo efficacy and to explore the combinatory
potential of LT4 with conventional chemotherapies.
Supplementary Data
Availability of data and materials
The RNA sequencing data generated in the present
study may be found in the NCBI Gene Expression Omnibus database
under the accession number GSE299648 or at the following URL:
https://www.ncbi.nlm.nih.gov/geo/query/acc.cgi?acc=GSE299648.
All other data generated in the present study may be requested from
the corresponding author.
Authors' contributions
KTL conceived and designed the study, acquired the
data, performed the analyses, interpreted the results, drafted the
manuscript and approved the final version of the manuscript. YCH
acquired the data, performed the analyses, interpreted the results
and critically revised the manuscript. PKC and CWL acquired the
data, performed the analyses and interpreted the results. SYL
performed the analyses and interpreted the results. ICY interpreted
the results, critically revised the manuscript and supervised the
study. KTL and ICY confirm the authenticity of all the raw data.
All authors read and approved the final version of the
manuscript.
Ethics approval and consent to
participate
Not applicable.
Patient consent for publication
Not applicable.
Competing interests
The authors declare that they have no competing
interests.
Acknowledgements
No applicable.
Funding
This work was supported by Grants from the Ministry of Science
and Technology (grant no. MOST112-2320-B-016-005) and the Ministry
of National Defense-Medical Affairs Bureau (grant nos.
MND-MAB-109-051, MND-MAB-110-006, MND-MAB-D-112080,
MND-MAB-D-113118 and MND-MAB-C01-114002).
References
|
1
|
Zhang T, Guo Y, Qiu B, Dai X, Wang Y and
Cao X: Global, regional, and national trends in colorectal cancer
burden from 1990 to 2021 and projections to 2040. Front Oncol.
14:14661592025. View Article : Google Scholar : PubMed/NCBI
|
|
2
|
Teixeira N, Baião A, Dias S and Sarmento
B: The progress and challenges in modeling colorectal cancer and
the impact on novel drug discovery. Expert Opin Drug Discov.
20:565–574. 2025. View Article : Google Scholar
|
|
3
|
National Cancer Institute (NCI): Cancer
stat facts: Colorectal cancer. Surveillance, Epidemiology, and End
Results (SEER) Program. NCI; Bethesda, MD: 2025
|
|
4
|
Leowattana W, Leowattana P and Leowattana
T: Systemic treatment for metastatic colorectal cancer. World J
Gastroenterol. 29:1569–1588. 2023. View Article : Google Scholar : PubMed/NCBI
|
|
5
|
Al Zein M, Boukhdoud M, Shammaa H, Mouslem
H, El Ayoubi LM, Iratni R, Issa K, Khachab M, Assi HI, Sahebkar A
and Eid AH: Immunotherapy and immunoevasion of colorectal cancer.
Drug Discov Today. 28:1036692023. View Article : Google Scholar : PubMed/NCBI
|
|
6
|
Siena S, Sartore-Bianchi A, Di
Nicolantonio F, Balfour J and Bardelli A: Biomarkers predicting
clinical outcome of epidermal growth factor receptor-targeted
therapy in metastatic colorectal cancer. J Natl Cancer Inst.
101:1308–1324. 2009. View Article : Google Scholar : PubMed/NCBI
|
|
7
|
Liebl MC and Hofmann TG: The role of p53
signaling in colorectal cancer. Cancers (Basel). 13:21252021.
View Article : Google Scholar : PubMed/NCBI
|
|
8
|
Tang YL, Li DD, Duan JY, Sheng LM and Wang
X: Resistance to targeted therapy in metastatic colorectal cancer:
Current status and new developments. World J Gastroenterol.
29:926–948. 2023. View Article : Google Scholar : PubMed/NCBI
|
|
9
|
Wang CZ, Calway T and Yuan CS: Herbal
medicines as adjuvants for cancer therapeutics. Am J Chin Med.
40:657–669. 2012. View Article : Google Scholar : PubMed/NCBI
|
|
10
|
Jenča A, Mills DK, Ghasemi H, Saberian E,
Jenča A, Karimi Forood AM, Petrášová A, Jenčová J, Jabbari Velisdeh
Z, Zare-Zardini H and Ebrahimifar M: Herbal therapies for cancer
treatment: A review of phytotherapeutic efficacy. Biologics.
18:229–255. 2024.
|
|
11
|
Lu MC, El-Shazly M, Wu TY, Du YC, Chang
TT, Chen CF, Hsu YM, Lai KH, Chiu CP, Chang FR and Wu YC: Recent
research and development of Antrodia cinnamomea. Pharmacol Ther.
139:124–156. 2013. View Article : Google Scholar : PubMed/NCBI
|
|
12
|
Tsai DH, Chung CH and Lee KT: Antrodia
cinnamomea induces autophagic cell death via the CHOP/TRB3/Akt/mTOR
pathway in colorectal cancer cells. Sci Rep. 8:174242018.
View Article : Google Scholar : PubMed/NCBI
|
|
13
|
Huang YJ, Yadav VK, Srivastava P, Wu AT,
Huynh TT, Wei PL, Huang CF and Huang TH: Antrodia cinnamomea
Enhances chemo-sensitivity of 5-FU and suppresses colon
tumorigenesis and cancer stemness via up-regulation of tumor
suppressor miR-142-3p. Biomolecules. 9:3062019. View Article : Google Scholar : PubMed/NCBI
|
|
14
|
Lin IY, Pan MH, Lai CS, Lin TT, Chen CT,
Chung TS, Chen CL, Lin CH, Chuang WC, Lee MC, et al: CCM111, the
water extract of Antrodia cinnamomea, regulates immune-related
activity through STAT3 and NF-κB pathways. Sci Rep. 7:48622017.
View Article : Google Scholar
|
|
15
|
Liu YM, Liu YK, Huang PI, Tsai TH and Chen
YJ: Antrodia cinnamomea mycelial fermentation broth inhibits the
epithelial-mesenchymal transition of human esophageal
adenocarcinoma cancer cells. Food Chem Toxicol. 119:380–386. 2018.
View Article : Google Scholar : PubMed/NCBI
|
|
16
|
Li HX, Wang JJ, Lu CL, Gao YJ, Gao L and
Yang ZQ: Review of bioactivity, isolation, and identification of
active compounds from Antrodia cinnamomea. Bioengineering (Basel).
9:4942022. View Article : Google Scholar : PubMed/NCBI
|
|
17
|
Senthil Kumar KJ, Gokila Vani M, Chen CY,
Hsiao WW, Li J, Lin ZX, Chu FH, Yen GC and Wang SY: A mechanistic
and empirical review of antcins, a new class of phytosterols of
formosan fungi origin. J Food Drug Anal. 28:38–59. 2020. View Article : Google Scholar
|
|
18
|
Lee YP, Tsai WC, Ko CJ, Rao YK, Yang CR,
Chen DR, Yang MH, Yang CC and Tzeng YM: Anticancer effects of
eleven triterpenoids derived from Antrodia camphorata. Anticancer
Res. 32:2727–2734. 2012.PubMed/NCBI
|
|
19
|
Hsieh YY, Lee KC, Cheng KC, Lee KF, Yang
YL, Chu HT, Lin TW, Chen CC, Hsieh MC, Huang CY, et al: Antrodin C
isolated from Antrodia cinnamomea induced apoptosis through
ROS/AKT/ERK/P38 signaling pathway and epigenetic histone
acetylation of TNFα in colorectal cancer cells. Antioxidants
(Basel). 12:7642023. View Article : Google Scholar
|
|
20
|
Chen S, Zhou Y, Chen Y and Gu J: fastp: An
ultra-fast all-in-one FASTQ preprocessor. Bioinformatics.
34:i884–i890. 2018. View Article : Google Scholar : PubMed/NCBI
|
|
21
|
Love MI, Huber W and Anders S: Moderated
estimation of fold change and dispersion for RNA-seq data with
DESeq2. Genome Biol. 15:5502014. View Article : Google Scholar : PubMed/NCBI
|
|
22
|
Yu G, Wang LG, Han Y and He QY:
clusterProfiler: An R package for comparing biological themes among
gene clusters. OMICS. 16:284–287. 2012. View Article : Google Scholar : PubMed/NCBI
|
|
23
|
Walker EH, Pacold ME, Perisic O, Stephens
L, Hawkins PT, Wymann MP and Williams RL: Structural determinants
of phosphoinositide 3-kinase inhibition by wortmannin, LY294002,
quercetin, myricetin, and staurosporine. Mol Cell. 6:909–919. 2000.
View Article : Google Scholar : PubMed/NCBI
|
|
24
|
Loh CY, Chai JY, Tang TF, Wong WF, Sethi
G, Shanmugam MK, Chong PP and Looi CY: The E-cadherin and
N-cadherin switch in epithelial-to-mesenchymal transition:
Signaling, therapeutic implications, and challenges. Cells.
8:11182019. View Article : Google Scholar : PubMed/NCBI
|
|
25
|
Du L, Li J, Lei L, He H, Chen E, Dong J
and Yang J: High vimentin expression predicts a poor prognosis and
progression in colorectal cancer: A study with meta-analysis and
TCGA database. Biomed Res Int. 2018:63878102018. View Article : Google Scholar : PubMed/NCBI
|
|
26
|
Kim TW, Lee YS, Yun NH, Shin CH, Hong HK,
Kim HH and Cho YB: MicroRNA-17-5p regulates EMT by targeting
vimentin in colorectal cancer. Br J Cancer. 123:1123–1130. 2020.
View Article : Google Scholar : PubMed/NCBI
|
|
27
|
Niknami Z, Muhammadnejad A, Ebrahimi A,
Harsani Z and Shirkoohi R: Significance of E-cadherin and vimentin
as epithelial-mesenchymal transition markers in colorectal
carcinoma prognosis. EXCLI J. 19:917–926. 2020.PubMed/NCBI
|
|
28
|
Emile MH, Emile SH, El-Karef AA, Ebrahim
MA, Mohammed IE and Ibrahim DA: Association between the expression
of epithelial-mesenchymal transition (EMT)-related markers and
oncologic outcomes of colorectal cancer. Updates Surg.
76:2181–2191. 2024. View Article : Google Scholar : PubMed/NCBI
|
|
29
|
Kahya U, Köseer AS and Dubrovska A: Amino
acid transporters on the guard of cell genome and epigenome.
Cancers (Basel). 13:1252021. View Article : Google Scholar : PubMed/NCBI
|
|
30
|
Bröer A, Rahimi F and Bröer S: Deletion of
amino acid transporter ASCT2 (SLC1A5) reveals an essential role for
transporters SNAT1 (SLC38A1) and SNAT2 (SLC38A2) to sustain
glutaminolysis in cancer cells. J Biol Chem. 291:13194–13205. 2016.
View Article : Google Scholar : PubMed/NCBI
|
|
31
|
Wu D and Liang J: Activating transcription
factor 4: A regulator of stress response in human cancers. Front
Cell Dev Biol. 12:13700122024. View Article : Google Scholar : PubMed/NCBI
|
|
32
|
Sun J, Ren H, Wang J, Xiao X, Zhu L, Wang
Y and Yang L: CHAC1: A master regulator of oxidative stress and
ferroptosis in human diseases and cancers. Front Cell Dev Biol.
12:14587162024. View Article : Google Scholar : PubMed/NCBI
|
|
33
|
Gao S, Ge A, Xu S, You Z, Ning S, Zhao Y
and Pang D: PSAT1 is regulated by ATF4 and enhances cell
proliferation via the GSK3β/β-catenin/cyclin D1 signaling pathway
in ER-negative breast cancer. J Exp Clin Cancer Res. 36:1792017.
View Article : Google Scholar
|
|
34
|
Martens-de Kemp SR, Brink A, Stigter-van
Walsum M, Damen JM, Rustenburg F, Wu T, van Wieringen WN,
Schuurhuis GJ, Braakhuis BJ, Slijper M and Brakenhoff RH: CD98
marks a subpopulation of head and neck squamous cell carcinoma
cells with stem cell properties. Stem Cell Res. 10:477–488. 2013.
View Article : Google Scholar : PubMed/NCBI
|
|
35
|
Fei F, Li X, Xu L, Li D, Zhang Z, Guo X,
Yang H, Chen Z and Xing J: CD147-CD98hc complex contributes to poor
prognosis of non-small cell lung cancer patients through promoting
cell proliferation via the PI3K/Akt signaling pathway. Ann Surg
Oncol. 21:4359–4368. 2014. View Article : Google Scholar : PubMed/NCBI
|
|
36
|
Kaira K, Sunose Y, Oriuchi N, Kanai Y and
Takeyoshi I: CD98 is a promising prognostic biomarker in biliary
tract cancer. Hepatobiliary Pancreat Dis Int. 13:654–657. 2014.
View Article : Google Scholar : PubMed/NCBI
|
|
37
|
Furuya M, Horiguchi J, Nakajima H, Kanai Y
and Oyama T: Correlation of L-type amino acid transporter 1 and
CD98 expression with triple negative breast cancer prognosis.
Cancer Sci. 103:382–389. 2012. View Article : Google Scholar
|
|
38
|
Zhu B, Cheng D, Hou L, Zhou S, Ying T and
Yang Q: SLC3A2 is upregulated in human osteosarcoma and promotes
tumor growth through the PI3K/Akt signaling pathway. Oncol Rep.
37:2575–2582. 2017. View Article : Google Scholar : PubMed/NCBI
|
|
39
|
Xia P and Dubrovska A: CD98 heavy chain as
a prognostic biomarker and target for cancer treatment. Front
Oncol. 13:12511002023. View Article : Google Scholar : PubMed/NCBI
|
|
40
|
Shin DH, Jo JY and Han JY: Dual targeting
of ERBB2/ERBB3 for the treatment of SLC3A2-NRG1-mediated lung
cancer. Mol Cancer Ther. 17:2024–2033. 2018. View Article : Google Scholar : PubMed/NCBI
|
|
41
|
Huang G, Ma L, Shen L, Lei Y, Guo L, Deng
Y and Ding Y: MIF/SCL3A2 depletion inhibits the proliferation and
metastasis of colorectal cancer cells via the AKT/GSK-3β pathway
and cell iron death. J Cell Mol Med. 26:3410–3422. 2022. View Article : Google Scholar : PubMed/NCBI
|
|
42
|
Ortiz AB, Garcia D, Vicente Y, Palka M,
Bellas C and Martin P: Prognostic significance of cyclin D1 protein
expression and gene amplification in invasive breast carcinoma.
PLoS One. 12:e01880682017. View Article : Google Scholar : PubMed/NCBI
|
|
43
|
Jun SY, Kim J, Yoon N, Maeng LS and Byun
JH: Prognostic potential of cyclin D1 expression in colorectal
cancer. J Clin Med. 12:5722023. View Article : Google Scholar : PubMed/NCBI
|
|
44
|
Shan YS, Hsu HP, Lai MD, Hung YH, Wang CY,
Yen MC and Chen YL: Cyclin D1 overexpression correlates with poor
tumor differentiation and prognosis in gastric cancer. Oncol Lett.
14:4517–4526. 2017. View Article : Google Scholar : PubMed/NCBI
|
|
45
|
Guo Z, Liang E, Li W, Jiang L and Zhi F:
Essential meiotic structure-specific endonuclease1 (EME1) promotes
malignant features in gastric cancer cells via the Akt/GSK3B/CCND1
pathway. Bioengineered. 12:9869–9884. 2021. View Article : Google Scholar : PubMed/NCBI
|
|
46
|
Maharati A and Moghbeli M: PI3K/AKT
signaling pathway as a critical regulator of epithelial-mesenchymal
transition in colorectal tumor cells. Cell Commun Signal.
21:2012023. View Article : Google Scholar : PubMed/NCBI
|
|
47
|
Almaimani RA, Aslam A, Ahmad J, El-Readi
MZ, El-Boshy ME, Abdelghany AH, Idris S, Alhadrami M, Althubiti M,
Almasmoum HA, et al: In vivo and in vitro enhanced tumoricidal
effects of metformin, active vitamin D3, and
5-fluorouracil triple therapy against colon cancer by modulating
the PI3K/Akt/PTEN/mTOR network. Cancers (Basel). 14:15382022.
View Article : Google Scholar
|
|
48
|
Currier AW, Kolb EA, Gorlick RG, Roth ME,
Gopalakrishnan V and Sampson VB: p27/Kip1 functions as a tumor
suppressor and oncoprotein in osteosarcoma. Sci Rep. 9:61612019.
View Article : Google Scholar : PubMed/NCBI
|
|
49
|
Liu Y, Ao X, Ding W, Ponnusamy M, Wu W,
Hao X, Yu W, Wang Y, Li P and Wang J: Critical role of FOXO3a in
carcinogenesis. Mol Cancer. 17:1042018. View Article : Google Scholar : PubMed/NCBI
|
|
50
|
Kim GY, Mercer SE, Ewton DZ, Yan Z, Jin K
and Friedman E: The stress-activated protein kinases p38 alpha and
JNK1 stabilize p21(Cip1) by phosphorylation. J Biol Chem.
277:29792–29802. 2002. View Article : Google Scholar : PubMed/NCBI
|
|
51
|
Lafarga V, Cuadrado A, Lopez de Silanes I,
Bengoechea R, Fernandez-Capetillo O and Nebreda AR: p38
Mitogen-activated protein kinase- and HuR-dependent stabilization
of p21(Cip1) mRNA mediates the G(1)/S checkpoint. Mol Cell Biol.
29:4341–4351. 2009. View Article : Google Scholar : PubMed/NCBI
|
|
52
|
Hwang CY, Lee C and Kwon KS: Extracellular
signal-regulated kinase 2-dependent phosphorylation induces
cytoplasmic localization and degradation of p21Cip1. Mol Cell Biol.
29:3379–3389. 2009. View Article : Google Scholar : PubMed/NCBI
|
|
53
|
Kumari G, Ulrich T and Gaubatz S: A role
for p38 in transcriptional elongation of p21 (CIP1) in response to
Aurora B inhibition. Cell Cycle. 12:2051–2060. 2013. View Article : Google Scholar : PubMed/NCBI
|
|
54
|
Chang J, Tang N, Fang Q, Zhu K, Liu L,
Xiong X, Zhu Z, Zhang B, Zhang M and Tao J: Inhibition of COX-2 and
5-LOX regulates the progression of colorectal cancer by promoting
PTEN and suppressing PI3K/AKT pathway. Biochem Biophys Res Commun.
517:1–7. 2019. View Article : Google Scholar
|
|
55
|
Yoshitake R, Saeki K, Eto S, Shinada M,
Nakano R, Sugiya H, Endo Y, Fujita N, Nishimura R and Nakagawa T:
Aberrant expression of the COX2/PGE2 axis is induced by activation
of the RAF/MEK/ERK pathway in BRAFV595E canine
urothelial carcinoma. Sci Rep. 10:78262020. View Article : Google Scholar
|
|
56
|
Sheng J, Sun H, Yu FB, Li B, Zhang Y and
Zhu YT: The role of cyclooxygenase-2 in colorectal cancer. Int J
Med Sci. 17:1095–1101. 2020. View Article : Google Scholar : PubMed/NCBI
|
|
57
|
Cai B, Chang SH, Becker EB, Bonni A and
Xia Z: p38 MAP kinase mediates apoptosis through phosphorylation of
BimEL at Ser-65. J Biol Chem. 281:25215–25222. 2006. View Article : Google Scholar : PubMed/NCBI
|
|
58
|
Wakeman D, Guo J, Santos JA, Wandu WS,
Schneider JE, McMellen ME, Leinicke JA, Erwin CR and Warner BW: p38
MAPK regulates Bax activity and apoptosis in enterocytes at
baseline and after intestinal resection. Am J Physiol Gastrointest
Liver Physiol. 302:G997–G1005. 2012. View Article : Google Scholar : PubMed/NCBI
|
|
59
|
Bodur C, Kutuk O, Karsli-Uzunbas G,
Isimjan TT, Harrison P and Basaga H: Pramanicin analog induces
apoptosis in human colon cancer cells: Critical roles for Bcl-2,
Bim, and p38 MAPK signaling. PLoS One. 8:e563692013. View Article : Google Scholar : PubMed/NCBI
|
|
60
|
Zhang X, Tang N, Hadden TJ and Rishi AK:
Akt, FoxO and regulation of apoptosis. Biochim Biophys Acta.
1813:1978–1986. 2011. View Article : Google Scholar : PubMed/NCBI
|
|
61
|
Das TP, Suman S, Alatassi H, Ankem MK and
Damodaran C: Inhibition of AKT promotes FOXO3a-dependent apoptosis
in prostate cancer. Cell Death Dis. 7:e21112016. View Article : Google Scholar : PubMed/NCBI
|
|
62
|
Yun SI, Yoon HY and Chung YS: Glycogen
synthase kinase-3beta regulates etoposide-induced apoptosis via
Bcl-2 mediated caspase-3 activation in C3H10T1/2 cells. Apoptosis.
14:771–777. 2009. View Article : Google Scholar : PubMed/NCBI
|
|
63
|
Lin J, Song T, Li C and Mao W: GSK-3β in
DNA repair, apoptosis, and resistance of chemotherapy, radiotherapy
of cancer. Biochim Biophys Acta Mol Cell Res. 1867:1186592020.
View Article : Google Scholar
|
|
64
|
Yang K, Chen Z, Gao J, Shi W, Li L, Jiang
S, Hu H, Liu Z, Xu D and Wu L: The key roles of GSK-3β in
regulating mitochondrial activity. Cell Physiol Biochem.
44:1445–1459. 2017. View Article : Google Scholar
|
|
65
|
Li Y, Park JS, Deng JH and Bai Y:
Cytochrome c oxidase subunit IV is essential for assembly and
respiratory function of the enzyme complex. J Bioenerg Biomembr.
38:283–291. 2006. View Article : Google Scholar : PubMed/NCBI
|
|
66
|
Lin HC, Lin MH, Liao JH, Wu TH, Lee TH, Mi
FL, Wu CH, Chen KC, Cheng CH and Lin CW: Antroquinonol, a
ubiquinone derivative from the mushroom antrodia camphorata,
inhibits colon cancer stem cell-like properties: Insights into the
molecular mechanism and inhibitory targets. J Agric Food Chem.
65:51–59. 2017. View Article : Google Scholar
|
|
67
|
Angamuthu V, Shanmugavadivu M, Nagarajan G
and Velmurugan BK: Pharmacological activities of antroquinonol-mini
review. Chem Biol Interact. 297:8–15. 2019. View Article : Google Scholar
|
|
68
|
Tang M, Song K, Xie D, Yuan X, Wang Y, Li
Z, Lu X, Guo L, Zhu X, Xiong L, et al: PSAT1 promotes the
progression of colorectal cancer by regulating Hippo-YAP/TAZ-ID1
axis via AMOT. Mol Cell Biochem. 480:3647–3668. 2025. View Article : Google Scholar : PubMed/NCBI
|
|
69
|
Vié N, Copois V, Bascoul-Mollevi C, Denis
V, Bec N, Robert B, Fraslon C, Conseiller E, Molina F, Larroque C,
et al: Overexpression of phosphoserine aminotransferase PSAT1
stimulates cell growth and increases chemoresistance of colon
cancer cells. Mol Cancer. 7:142008. View Article : Google Scholar : PubMed/NCBI
|
|
70
|
Wang M, Zhang H, Lu Z, Su W, Tan Y, Wang J
and Jia X: PSAT1 mediated EMT of colorectal cancer cells by
regulating Pl3K/AKT signaling pathway. J Cancer. 15:3183–3198.
2024. View Article : Google Scholar : PubMed/NCBI
|
|
71
|
Zhao X and Chen F: Propofol induces the
ferroptosis of colorectal cancer cells by downregulating STAT3
expression. Oncol Lett. 22:7672021. View Article : Google Scholar : PubMed/NCBI
|