Introduction
Bone fractures represent a significant global health
burden, with an epidemiological study reporting >170 million new
cases annually worldwide (1).
While most fractures achieve successful healing, 5-10% result in
delayed union or nonunion, creating substantial clinical and
economic challenges (2). The
healing process is particularly compromised in anatomically
vulnerable sites such as the tibia, where limited soft tissue
coverage and poor vascularity frequently impede proper bone
regeneration (3,4). The biological complexity of
fracture repair is exemplified by the delicate balance between
multiple cellular processes and molecular signaling pathways that
must be precisely coordinated across temporal and spatial
dimensions (5).
Fracture healing occurs via two primary mechanisms:
Intramembranous ossification at the fracture margins and
endochondral ossification in the central callus region (6,7).
The latter process, which involves the formation of a cartilaginous
template that is subsequently replaced by bone, is crucial for
healing unsfig fractures and defects with limited stability
(5,8). The traditional understanding was
that hypertrophic chondrocytes (HTCs) in cartilaginous callus
undergo apoptosis before bone formation (9-12). However, emerging evidence from
lineage-tracing studies has fundamentally challenged this paradigm,
demonstrating that a substantial proportion of HTCs can directly
trans-differentiate into osteoblasts without undergoing programmed
cell death (13-15). This newly recognized pathway
contributes to bone regeneration, with a study indicating that
30-40% of osteocytes in the callus are derived from chondrocytes
(CHs), reaching 80% at the chondroos-seous junction (15).
The fracture microenvironment is characterized by
dynamic physicochemical gradients, with oxygen tension representing
a key regulatory signal (16,17). The initial hypoxic conditions
within the avascular cartilaginous callus gradually transition to
normoxic conditions through angiogenesis, creating a spatially and
temporally heterogeneous oxygen landscape (18,19). While the hypoxia-inducible
factor-1α (HIF-1α) pathway has been well-established as a mediator
of cellular adaptation to low oxygen, promoting CH survival and
angiogenesis (16,20,21), evidence suggests that more direct
oxygen-sensing mechanisms operate at the epigenetic level to guide
cell fate decisions (22,23).
Histone modifications, particularly the methylation of histone H3
lysine 27 (H3K27), have emerged as critical epigenetic determinants
of cellular differentiation (24,25). Trimethylation of H3K27
(H3K27me3), catalyzed by polycomb repressive complex 2, serves as a
repressive mark that silences developmental genes (26), whereas demethylation by specific
enzymes activates transcriptional programs (27).
Oxygen-sensitive histone demethylase lysine
demethylase 6A (KDM6A) represents a compelling molecular link
between microenvironmental cues and epigenetic regulation (22). Unlike HIF-1α, which primarily
mediates adaptive metabolic responses, KDM6A directly senses oxygen
levels through its Jumonji C (JmjC) domain and translates this
information into epigenetic instructions by removing repressive
H3K27 methylation marks (22,23). This unique property positions
KDM6A as a potential key regulator of cell fate transitions in
oxygen-gradient environments, such as fracture calluses. Supporting
this notion, KDM6A has been shown to be essential for embryonic
development (28,29) and serves critical roles in
various differentiation processes, including the osteogenic
differentiation of mesenchymal stem cells (30,31).
The Wnt/β-catenin signaling pathway has been
established as a master regulator of osteoblastogenesis and
fracture healing (32-35). Multiple studies have demonstrated
that Wnt pathway activation enhances bone repair through various
mechanisms, including the promotion of osteoblast differentiation
and activity (36,37). Pharmacological approaches
targeting negative regulators of this pathway, such as antibodies
against sclerostin and Dickkopf-1, have shown promising results in
accelerating bone regeneration in animal models (38-40). Wnt/β-catenin signaling has been
specifically implicated in CH-to-osteoblast transdifferentiation,
with a study showing that β-catenin stabilization in HTCs enhances
their conversion into osteoblasts (41).
The convergence of oxygen sensing, epigenetic
regulation and canonical signaling pathways presents a compelling
framework for understanding the coordination of CH fate during bone
repair. A study has established connections between KDM6A and Wnt
signaling, with RNA sequencing analyses revealing effects on Wnt
gene expression in KDM6A-deficient contexts (42). In bone marrow stromal cells,
KDM6A directly removes H3K27me3 modifications from the promoter
regions of osteogenic genes, including RUNX family transcription
factor 2 (RUNX2), thereby initiating differentiation programs
(30,31). However, to the best of our
knowledge, the functional significance of this epigenetic regulator
in fracture healing, particularly its role in integrating oxygen
signals to modulate CH transdifferentiation via the Wnt/β-catenin
pathway, remains unexplored.
Investigation of these mechanisms across different
fracture types has revealed intriguing patterns of interaction. In
tibial shaft fractures, where endochondral ossification
predominates (43), the
oxygen-KDM6A-Wnt axis may serve a particularly critical role
because of the prolonged hypoxic conditions characteristic of these
injuries (30,31,42). Conversely, in well-vascularized
fracture sites or rigidly fixed fractures where intramembranous
ossification predominates, the relative importance of this pathway
may differ (22,23). Understanding these
context-dependent variations is essential for the development of
targeted therapeutic approaches.
Based on these considerations, we hypothesized that
KDM6A serves as a critical molecular nexus, linking oxygen sensing
to CH fate determination during fracture repair. Specifically, we
hypothesized that, in the transitioning oxygen environment of the
healing callus, KDM6A activation promotes CH-to-osteoblast
transdifferentiation by removing repressive H3K27 methylation marks
from Wnt pathway genes, thereby activating the Wnt/β-catenin/RUNX2
signaling axis. To test this hypothesis, an integrated approach
combining single-cell RNA sequencing (scRNA-seq) of fractured
calli, lineage tracing and cartilage-specific inducible
Kdm6a-knockout was employed. This methodological framework was
designed to uncover the mechanisms underlying the oxygen-dependent
modulation of bone regeneration across different fracture
environments and to assess its potential as a therapeutic target
for challenging clinical scenarios, such as nonunions and
osteoporotic fractures.
Materials and methods
Mice
All animal protocols were approved by the Animal
Care and Use Committee of Wuxi Affiliated Hospital of Nanjing
University of Chinese Medicine (approval no. GZR2023032801; Wuxi,
China). Mice were housed in groups of ≤5 animals in a room using
microisolator technology, and kept at 22-24°C with a 12-h
light/dark schedule, with ad libitum access to food and
water.
Kdm6a-Flox (a conditional knockout strain where
essential exons of the Kdm6a gene are flanked by loxP sites),
collagen type II α1 chain (Col2a1)-2A-tamoxifen (Tam)-inducible Cre
recombinase (CreERT2) (expressing CreERT2 specifically in CHs,
driven by the Col2a1 promoter) and R26-CAG-LSL-tdTomato (a
Cre-dependent reporter strain in which a loxP-flanked
transcriptional stop cassette prevents the expression of the
tdTomato fluorescent protein; upon Cre-mediated recombination,
tdTomato is expressed, permanently labeling Cre-active cells and
their progeny) mice were purchased from Shanghai Model Organisms
Center, Inc. All mutant mice had a C57/B6J background.
Col2a1-2A-CreERT2 mice were bred with R26-CAG-LSL-tdTomato mice to
generate inducible cartilage-specific labeled mice that carried a
Tam-inducible CreERT2 transgene under the control of the Col2a1
gene promoter for CH-specific expression, and the
Cre/loxP-inducible Rosa-CAG-LSL-tdTomato reporter to mark the cells
after CreER activity was induced by Tam injections. To generate
inducible cartilage-specific Kdm6a-knockout mice,
Kdm6aflox/flox mice were bred with
Col2a1-2A-CreERT2&R26-CAG-LSL-tdTomato mice to generate
Kdm6aflox/+&Col2a1-2A-CreERT2&R26-CAG-LSL-tdTomato
(fx/wt) mice, and these mice were intercrossed or bred with
Kdm6aflox/flox mice again to generate
Kdm6aflox/flox&
Col2a1-2A-CreERT2&R26-CAG-LSL-tdTomato (fx/fx) mice and fx/wt
mice (44). Fx/wt mice were used
as controls. DNA was obtained from tail biopsy samples and
genotyping was performed using PCR (2X Taq Plus Master Mix; P212;
Vazyme Biotech Co., Ltd.). The conditions for amplification
reactions were as follows: 94°C for 3 min, followed by 34 cycles of
94°C for 30 sec, 56°C (Kdm6a-Flox and Col2a1-CreERT2)/58°C
(R26-CAG-LSL-tdTomato) for 30 sec and 72°C for 30 sec. The primer
sequences are shown in Table
SI. The PCR products were separated on a 3% agarose gel,
stained with GelStain fluorescent nucleic acid dye (TransGen
Biotech Co., Ltd.) and visualized using a fully automatic digital
gel imaging analysis system (Tanon Science and Technology Co.,
Ltd.). As described in Data S1,
an example of mouse tail clipping PCR genotype identification
results is shown in Fig. S1. A
total of 120 male mice were used in the present study. At the start
of the experiment, the mice were 6 months old, with body weights
ranging between 25 and 30 g. According to their genotype, the mice
were divided into two groups: The inducible cartilage-specific
Kdm6a-knockout group (fx/fx; n=60) and the control group (fx/wt;
n=60). Mice from each group were then randomly allocated to
different experimental endpoints as follows: scRNA-seq (n=6 per
genotype), histological staining (n=15 per genotype), radiological
examination (n=6 per genotype) and cytological experiments (n=33
per genotype). After the primary CHs were extracted from the mouse
cartilage callus, KDM6A protein expression in the cells of the two
groups was detected by western blotting to verify successful gene
knockout (Fig. S2). Live-cell
imaging was performed during the in vitro induction of CH
transdifferentiation into osteoblasts in the cartilage callus.
Imaging was performed directly after transferring the cells into
osteogenic induction culture medium. A fluorescence microscope
(Carl Zeiss AG) equipped with an environmental control chamber was
used to maintain the cells at 37°C with 5% CO2 during
observation. Imaging was performed for 48 h, capturing an image
every 30 min. Fluorescence imaging showed that the CHs specifically
expressed a clear red labeling signal, and the
Col2a1-CreERT2/RosatdTomato model was successfully established
(Fig. S3).
Tibial fracture model
Fx/fx and fx/wt mice were intraperitoneally injected
with 75 mg/kg Tam (Sigma-Aldrich; Merck KGaA) once daily for 5
days. The fracture model was established on the second day after
induction. Mice were weighed and anesthetized by intraperitoneal
injection of 0.4% pentobarbital sodium at a dose of 40 mg/kg. After
the mice were completely anesthetized, the skin was prepared in
front of the left tibia, and hair was removed as cleanly and
thoroughly as possible. Mice were placed in the left lateral
position. The surgical site on the left lower limb was disinfected
three times with iodine, followed by draping with sterile
fenestrated drapes. Using high-temperature and high-pressure
sterilized instruments, a small incision of ~1 cm was made along
the longitudinal axis of the left tibia, from the knee joint to the
middle section of the tibia. Hemostatic forceps were used to expose
the anterior edge of the tibia to obtain the skin, muscles and
fascia. Surgical blade 11 was positioned at the highest point of
the anterolateral protrusion of the tibia. A transverse fracture
was created by striking the base of the blade vertically with a
small hammer and a slight lateral movement was performed to confirm
the fracture. A sterile 1-ml syringe needle was inserted into the
medulla for fixation, and the exposed needle was removed (45). After disinfection with Aner
iodine, the incision was sutured layer-by-layer using a 5-0 medical
suture needle and thread. After the operation, 40,000 U penicillin
was injected intramuscularly for 3 consecutive days to prevent
infection. The mice were raised without any activity restrictions.
The incision conditions and activity of the mice were monitored
daily. Fractured callus tissues were harvested on days 10 and 21
post-fracture for single-cell sequencing. The samples at each time
point were obtained from 6 different mice. Samples of the left
tibiae from 12, 12 and 18 different mice were collected on days 10,
21 and 28 post-fracture for radiological and histological
analyses.
scRNA-seq
Bone callus samples were dissociated into
single-cell suspensions. The cell concentration and viability were
determined using a Countstar Rigel S2 automated cell fluorescence
analyzer (Shanghai Ruiyu Biotech Co., Ltd.) with AO/PI staining
(RE010212; Shanghai Ruiyu Biotech Co., Ltd.) and Countstar counting
slides (CO010101; Shanghai Ruiyu Biotech Co., Ltd.). The
concentration was adjusted to 700-1,200 cells/μl.
Single-cell capture, barcoding and library preparation were
performed using the Chromium Next GEM Single Cell 3' Reagent Kits
v3.1 (cat. no. 1000268; 10x Genomics). Cell suspensions were
combined with barcoded gel beads and master mix, and encapsulated
into gel beads-in-emulsion (GEMs) using a microfluidic system.
Within the GEMs, poly (dT) primers bound to mRNA poly-A tails to
initiate reverse transcription (RT). Full-length barcoded cDNA was
generated by RT using the integrated RT reagents: RT Reagent B
(cat. no. 2000165; buffer), RT Enzyme C (M-MLV Reverse
Transcriptase; cat. no. 2000085/2000102), Template Switch Oligo
(cat. no. 3000228) and Reducing Agent B (cat. no. 2000087) from the
Chromium Next GEM Single Cell 3' Reagent Kit v3.1 (10x Genomics).
The RT reaction was performed at 53°C for 45 min, followed by
enzyme inactivation at 85°C for 5 min. The GEMs were then broken,
and the pooled cDNA was amplified by PCR using a high-fidelity DNA
polymerase from the Amp Mix (cat. no. 2000047/2000103; 10x
Genomics) with the following primers: Forward,
5'-CTACACGACGCTCTTCCGATCT-3' and reverse,
5'-AAGCAGTGGTATCAACGCAGAG-3'. The thermocycling conditions were as
follows: 98°C for 3 min; cycling (12-13 cycles, optimized for cell
recovery) at 98°C for 15 sec, 63°C for 20 sec and 72°C for 1 min;
and 72°C for 1 min. The quality and size distribution of the
amplified cDNA were verified using an Agilent 2100 Bioanalyzer
(Agilent Technologies, Inc.), showing a main peak of 1,000-2,000
bp. The cDNA was fragmented (~400 bp on average) and sequencing
adapters were added. A final sample indexing PCR was conducted
using the same Amp Mix and the Dual Index Kit TT Set A primers
(cat. no. 1000215; 10x Genomics) containing unique i5 and i7 index
sequences. The sequences were: P5 primer (with i5 index),
5'-AATGATACGGCGACCACCGAGATCTACAC-N10-ACACTCTTTCCCTACACGACGCTC-3';
P7 primer (with i7 index),
5'-CAAGCAGAAGACGGCATACGAGAT-N10-GTGACTGGAGTTCAGACGTGT-3' (where N10
represents the unique 10-bp index sequence for each sample). The
indexing PCR conditions were: 98°C for 45 sec; cycling (8-16
cycles, optimized for cDNA input) at 98°C for 20 sec, 54°C for 30
sec and 72°C for 20 sec; and 72°C for 1 min. The concentration of
the final sequencing library was determined by quantitative PCR
(qPCR) to ensure accurate loading for sequencing. The
quantification was performed using the VAHTS Library Quantification
Kit for Illumina® (cat. no. NQ101; Vazyme Biotech Co.,
Ltd.) according to the manufacturer's protocol. The fluorescent dye
premix solution and the primers (forward,
5'-AATGATACGGCGACCACCGA-3'; reverse, 5'-CAAGCAGAAGACGGCATACGA-3')
were all included in this kit. This method provides absolute
quantification of the library. Briefly, a dilution series of the
library was prepared and used as template alongside the DNA
standards (cat. no. NQ105; Vazyme Biotech Co., Ltd.) to generate a
standard curve. Each qPCR reaction was set up in triplicate using
the provided premix. Amplification was carried out on a qPCR
instrument with a standard cycling protocol appropriate for the kit
(95°C for 5 min, followed by 35 cycles of 95°C for 30 sec and 60°C
for 45 sec). The library concentration was calculated according to
the kit's protocol. A standard curve was generated using the
provided DNA standards of known concentrations. The Ct values of
the library samples were interpolated from this standard curve to
obtain a preliminary concentration. This value was then corrected
for the average library length using the following formula:
Corrected concentration (pM)=[452 bp/mean library length (bp)] ×
preliminary concentration (pM). The final, accurate concentration
of the original library (nM) was derived by multiplying the
corrected concentration by the dilution factor. Following
quantification, the pooled libraries were diluted to a final
concentration of 200 pM and loaded onto an Illumina NovaSeq 6000
flow cell (Illumina, Inc.) for cluster generation and sequencing.
Paired-end 150-bp sequencing was performed on an Illumina NovaSeq
6000 platform (Illumina, Inc.) using the Illumina NovaSeq 6000 S4
Reagent Kit (cat. no. 20028312; Illumina, Inc.). Raw sequencing
data were processed using CellRanger (v8.0.1; 10x Genomics).
Downstream analysis was performed in R (v4.1.2; https://www.r-project.org/) utilizing the Seurat
package (v4.1.1; https://satijalab.org/seurat/).
The raw sequencing data were processed using
CellRanger for genome alignment, background cell filtering and
unique molecular identifier (UMI) counting of cellular transcripts.
Data integration across multiple samples was performed using the
anchor-based canonical correlation analysis method as previously
described (46). For the cell
gene expression matrix generated by CellRanger, Seurat software was
used to filter dead or stressed cells by removing cells with
abnormal gene or UMI counts, high mitochondrial gene content and
potential doublets. The filtering criteria were set as follows:
Number of genes per cell, 500-infinity; total UMIs per cell, <
infinity; and proportion of mitochondrial gene expression per cell,
<25%; and doublets were removed using the DoubletFinder package
(version 2.0.4; https://github.com/chris-mcginnis-ucsf/DoubletFinder).
The distribution of basic information of each sample cell after
cell filtering is shown in Figs.
S4 and S5.
After quality control, only the high-quality cells
suitable for downstream analyses were retained (Data S1; Tables SII and SIII). During data
preprocessing, regression analysis was performed to eliminate the
effects of total UMI counts and mitochondrial gene proportion, and
expression data were normalized using a scale factor of
1x10⁴. Highly variable genes were selected using the
FindVariableGenes algorithm in the Seurat package (parameters:
x.low.cutoff, 0.0125; y.cutoff, 0.5), and principal component
analysis (PCA) was performed based on these genes. The top 100
significant principal components were selected, and cell
sub-clusters were identified using the FindClusters function
(derived from Seurat v4.1.1; dims, 1:30; resolution, 0.5). Finally,
uniform manifold approximation and projection (UMAP) was employed
for dimensionality reduction and visualization of the gene
expression data.
Following cell clustering and annotation, the
expression patterns of key marker genes across subpopulations were
visualized. UMAP plots depicting the expression of individual genes
were generated using the FeaturePlotfunction in Seurat, where color
intensity corresponds to the expression level of the feature gene
in each cell. Violin plots were used to display the distribution of
expression for these marker genes across the annotated cell
clusters. Additionally, a dot plot was created to summarize the
expression of characteristic marker genes across the main
CH-osteoblast lineage subpopulations. In this plot, the size of the
dot represents the percentage of cells within a cluster expressing
the gene, and the color gradient indicates the mean expression
level.
Based on marker genes and referencing the
CellMarker2.0 database (http://117.50.127.228/CellMarker/), cell type
annotation was performed. For enrichment analysis, genes with
specific high expression in each cell subcluster (top 10) were
subjected to Gene Ontology (GO) and Kyoto Encyclopedia of Genes and
Genomes (KEGG) pathway enrichment analysis using the
clusterProfiler R package (v4.2.2; https://bioconductor.org/packages/clusterProfiler) to
interpret potential biological functions. The enrichment results
were visualized using the ggplot2 package (v3.4.0; https://cran.r-project.org/web/packages/ggplot2/index.html),
with bubble plots and bar charts displaying significantly enriched
pathways. Gene set enrichment analysis (GSEA) was conducted using
GSEA software (v4.4.0; https://www.broadinstitute.org/gsea/), and the results
were visualized using the GseaVis R package (v0.1.1; https://github.com/junjunlab/GseaVis).
Pseudotime trajectory analysis of
CH-to-osteoblast trans-differentiation
Pseudotime trajectories were constructed by
integrating highly variable genes from cell subpopulations using
Monocle3 (v1.3.4; http://cole-trapnell-lab.github.io/monocle3/).
Trajectory visualization was achieved in combination with UMAP. The
learn-graph algorithm was employed to define CHs as the root of the
trajectory, and dynamic changes in gene expression along pseudotime
were analyzed using the plot-genes-in-pseudotime function.
CellChat-based cell-cell communication
analysis
The dataset was analyzed using the CellChat package
(version 2.1.2; https://github.com/sqjin/CellChat) in R (version
4.4.1; https://www.r-project.org/). CellChat
models the intercellular communication probability by applying the
law of mass action and integrating gene expression data with prior
knowledge of the interactions among signaling ligands, receptors
and their cofactors. Based on cell type annotation and
identification of upregulated genes, the computeCommunProb function
was used to infer ligand-receptor interaction probabilities, the
computeCommunProbPathway function was used to quantify
pathway-level communication strength and key interactions were
visualized as chord diagrams using the netVisual-chord-gene
function.
H&E and safranin O-Fast Green
staining
After fixation in 4% paraformaldehyde at room
temperature for 24 h, the samples were decalcified in an EDTA
decalcification solution at room temperature. The decalcification
solution was changed every 2-3 days. During each solution change,
the progress of decalcification was assessed by testing the tissue
firmness. Decalcification was considered complete when a 1-ml
syringe needle could be inserted into the tibial cortex without
resistance. Once decalcification was complete, tibial specimens
were rinsed under running water for 4 h, dehydrated, cleared,
embedded in paraffin and sectioned. The thickness of sections was 3
μm. The sections were stained with H&E (Beijing Solarbio
Science & Technology Co., Ltd.) using hematoxylin solution for
5 min and eosin solution for 1 min, and safranin O-Fast Green
(Wuhan Servicebio Technology Co., Ltd.) using Fast Green for 5 min
followed by Safranin O for 2 min according to the manufacturer's
instructions at room temperature. Images were acquired using a
panoramic digital slide scanner (3DHISTECH, Ltd.), which is a
high-resolution whole-slide imaging system based on bright-field
light microscopy.
Immunofluorescence staining
The sample fixation and decalcification steps were
the same as those for H&E and safranin O-Fast Green staining.
The thickness of paraffin sections was 3 μm. The paraffin
sections were placed one by one into xylene I and xylene II for
dewaxing for 10 min each, then soaked in absolute ethanol I and
absolute ethanol II for 5 min each, rehydrated in 95, 85 and 75%
ethanol for 3 min each, and finally rinsed in distilled water for 2
min. Subsequently, the paraffin sections were immersed in a 1X
antigen retrieval solution and heated at 100°C for 20 min. After
cooling to room temperature, the sections were washed with PBS.
Permeabilization was performed by incubating the tissues with
Triton X-100 (ready-to-use working solution; cat. no. P0096;
Beyotime Biotechnology) for 30 min, followed by incubation with 3%
BSA (Beijing Biosynthesis Biotechnology Co., Ltd.) at room
temperature for 30 min to block nonspecific binding. The sections
were then incubated overnight at 4°C with diluted primary antibody
[anti-osteocalcin (OCN); 1:400; cat. no. ER1919-20; Hangzhou HuaAn
Biotechnology Co., Ltd.] After washing with PBS, the sections were
incubated with a fluorescent secondary antibody [anti-rabbit IgG
(H+L), F(ab')2 Fragment; Alexa Fluor® 488 Conjugate;
1:1,000; cat. no. 4412; Cell Signaling Technology, Inc.] in the
dark at room temperature for 50 min. After washing with PBS, the
nuclei were counterstained with DAPI at room temperature for 10
min. Fluorescence images were acquired using a panoramic digital
slide scanner, and analyzed using ImageJ software (1.54p; National
Institutes of Health).
CH isolation from the fracture
callus
On day 10 after modelling, CHs were isolated from
the fracture calli of the mice. The mice were euthanized by
cervical dislocation, and the left lower limb was removed and
placed in a pre-chilled culture dish containing PBS supplemented
with penicillin-streptomycin at a 1:9 ratio. Using sterilized
instruments, the skin was incised at the knee joint, and the
surrounding hair, muscle, fascia and vascular tissues were
carefully separated to expose the fracture site. The cartilaginous
callus was isolated from the surrounding fibrous tissue, and
translucent cartilage was scraped off using a blade, taking care to
remove cortical bone and other bony tissues. A randomly selected
piece of the removed cartilage tissue was subjected to Alcian blue
and Alizarin red combined staining (data not shown) to ensure that
the cartilage tissue collected did not contain bone tissue.
Briefly, the tissue fragment was fixed in 4% paraformaldehyde at
4°C for 24 h, embedded in paraffin and sectioned at 4 μm
thickness. Sections were stained with Alcian Blue (pH 2.5) for 30
min and Alizarin Red S solutions for 5 min at room temperature
according to standard protocols, and observed under a light
microscope (Olympus BX53; Olympus Corporation).
The collected cartilage was placed in a pre-chilled
culture dish containing PBS with penicillin-streptomycin (1:9
ratio) and kept on ice. The cartilage was cut into small fragments
of ~1 mm using fine scissors, and the cartilage fragments were
transferred into a 15-ml centrifuge tube.
Subsequently, 4 ml of 0.25% trypsin-EDTA solution
was added and the sample was incubated at 37°C for 15 min to remove
any attached fibroblasts or osteoblasts. During digestion, the tube
was manually shaken for 15 sec every 5 min to ensure complete
digestion. The digestion was terminated by adding 4 ml complete CH
medium [10% FBS (Sigma-Aldrich; Merck KGaA), 1%
penicillin-streptomycin and 89% DMEM/F12 (1:1) (HyClone; Cytiva)],
and the sample was centrifuged at 200 × g at 4°C for 5 min. The
supernatant was discarded and the tissue was washed twice with
PBS.
A mixture of 1 ml hyaluronidase (1 mg/ml; ~400 U), 1
ml collagenase IA (2 mg/ml; >250 U) and 1 ml DNase II (0.25
mg/ml; >250 U) was prepared, and 3 ml of this enzyme mixture was
added to the tissue. The samples were digested at 37°C for 30 min
in an incubator. Digestion was terminated by adding 3 ml complete
CH medium, and the sample was centrifuged at 200 × g at 4°C for 5
min. The supernatant from the first 30-min digestion was discarded
to remove remaining fibroblasts and osteoblasts.
A new aliquot (3 ml) of the enzyme mixture was then
added, and the tissue was digested for an additional 30 min at
37°C. After adding 3 ml complete medium to terminate digestion and
allowing the cartilage to settle, the supernatant was collected and
filtered through a 70-μm cell strainer, followed by
centrifugation at 200 × g at 4°C for 5 min. The supernatant was
removed and the cell pellet was gently resuspended in 1 ml complete
CH medium.
This process of enzymatic digestion, centrifugation
and cell collection was repeated with a freshly prepared enzyme
mixture until all CHs were released, as indicated by the absence or
minimal presence of cell pellets in the centrifuge tube after
spinning the supernatant from the digestion. This protocol can
yield highly purified cartilage cell preparations characterized by
strong expression of cartilage formation markers and a strong
tendency for cells to synthesize a cartilage matrix rich in
proteoglycans (47).
Hypoxic culture and osteogenic
induction
After CHs isolated from the fracture callus in both
groups of mice had established stable growth to the appropriate
size and density under hypoxic conditions (6% O2), the
cells were randomly divided into four groups: fx/wt hypoxia group
(continued culture in 6% O2), fx/wt normoxia group
(cultured in 21% O2), fx/fx hypoxia group (continued
culture in 6% O2) and fx/fx normoxia group (cultured in
21% O2). The oxygen concentrations of 6 and 21% were
selected based on the established oxygen-sensing property of KDM6A.
A seminal study demonstrated that the enzymatic activity of its
JmjC domain was inhibited below ~5% O2 (22). Therefore, 6% O2
represents a point where activity potentially begins to recover,
while 21% O2 (atmospheric level) reflects its fully
active state. This range allows interrogation of the functional
continuum of KDM6A from inhibition to full activation, thereby
enabling a clear analysis of the axis linking oxygen levels,
KDM6A-mediated epigenetic regulation and cell fate.
The original CH culture medium [10% fetal bovine
serum, 1% penicillin-streptomycin and 89% DMEM/F12 (1:1)] was
replaced with osteogenic induction medium [α-Minimum Essential
Medium (HyClone; Cytiva) supplemented with 10% fetal bovine serum,
1% L-glutamine, 1% penicillin-streptomycin, 10 mM
β-glycerophosphate, 0.2 mM ascorbate-2-phosphate and 100 ng/ml bone
morphogenetic protein 2 (BMP-2)] to induce the transdifferentiation
of CHs into osteoblasts at 37°C for 7 days. The culture medium was
replaced every 2-3 days.
Alcian blue, alizarin red and alkaline
phosphatase (ALP) staining
After 7 days of osteogenic induction, the cells
seeded in 24-well plates (2.5x10⁴/cm2) were
removed from the incubator. The culture medium was discarded and
the cells were washed with PBS and fixed with 4% cell fixative
(P1110; Beijing Solarbio Science & Technology Co., Ltd.) at
room temperature for 15 min. According to the manufacturer's
protocols, staining was performed as follows: Alcian blue (E670107;
Sangon Biotech Co., Ltd.) staining for 30 min at room temperature,
ALP (G1481; Beijing Solarbio Science & Technology Co., Ltd.)
staining for 2 h at 37°C and Alizarin red (G1038; Wuhan Servicebio
Technology Co., Ltd.) staining for 30 min at room temperature.
Images were observed under a light microscope and analyzed using
ImageJ software (1.54p; National Institutes of Health).
RT-qPCR
Total mRNA was extracted from each cell sample using
TRNzol reagent (Tiangen Biotech Co., Ltd.), and cDNA was obtained
by RT using the PrimeScript™ FAST RT reagent Kit with gDNA Eraser
(Takara Bio, Inc.) according to the manufacturer's instructions.
Reverse-transcribed cDNA was used as the template, and primers and
TB Green Premix Ex Taq II (Tli RNaseH Plus) (Takara Bio, Inc.) were
added to perform qPCR. The amplification reaction conditions were
as follows: 95°C for 30 sec, followed by 40 cycles of 95°C for 5
sec and 60°C for 34 sec. Finally, β-actin was used as an internal
reference, and the relative expression levels of the target genes
were calculated using the 2−ΔΔCq method (48). The mRNA levels of Col2a1,
collagen type X α1 chain (Col10a1), aggrecan (Acan), collagen type
I α1 chain (Col1a1), secreted phosphoprotein 1 (Spp1), secreted
protein acidic and cysteine rich (Sparc) and β-actin were analyzed
using the primer sequences listed in Table I.
 | Table INucleotide sequences of primers used
for reverse transcription-quantitative PCR. |
Table I
Nucleotide sequences of primers used
for reverse transcription-quantitative PCR.
| Target gene | Forward primer
(5'-3') | Reverse primer
(5'-3') |
|---|
| Col2a1 |
AGAGGGGACTGAAGGGACACC |
GCCAGGGATTCCATTAGAGCC |
| Col10a1 |
GCTGCCTCAAATACCCTTTCTGC |
GGAATGCCTTGTTCTCCTCTTACTG |
| Acan |
TAGAACCCTCGGGCAGAAGAAAG C |
TGTAGCCTGTGCTTGTAGGTGTTG |
| Col1a1 |
GGCAACAGTCGCTTCACCTACAG |
GAGGTCTTGGTGGTTTTGTATTCG |
| Spp1 |
CTGATGAACAGTATCCTGATGCCAC |
GGGACTCCTTAGACTCACCGCT |
| Sparc |
TTGGCGAGTTTGAGAAGGTATGC |
AGGTGACCAGGACATTTTTGAGC |
| Wnt3a |
GGAGTTTGCCGATGCCAGGGAG |
ACCACCAGCAGGTCTTCACTTCACAG |
| β-catenin |
TCGTGCTGGTGACAGGGAAGAC |
GCAGTCCATAATGAAGGCGAACG |
| RUNX2 |
GGAATGATGAGAACTACTCCGCCG |
GAAACTCTTGCCTCGTCCGCTC |
| β-actin |
AGGTCATCACTATTGGCAACGAG |
TTGGCATAGAGGTCTTTACGGAT |
Western blotting
The protein extraction buffer was prepared with a
ratio of RIPA lysis buffer (Jiangsu Kangwei Century Biotechnology
Co., Ltd.) to proteinase inhibitor mixture (Jiangsu Kangwei Century
Biotechnology Co., Ltd.) of 100:1. Cells were lysed in the protein
extraction buffer on ice for 20 min to extract protein samples.
When analyzing dimethylation of H3K27 (H3K27me2) and H3K27me3,
nuclear lysates were prepared using the Nuclear and Cytoplasmic
Protein Extraction Kit (P0028; Beyotime Biotechnology), with
histone H3 serving as the nuclear reference. The protein
concentration was determined using the BCA method. Equal amounts
(20 μg/lane) of protein were loaded onto a sodium dodecyl
sulfate-polyacrylamide gel (4-12%) for electrophoresis. After
electrophoresis, the proteins were transferred to a PVDF membrane,
and the membrane was blocked with a protein-free rapid blocking
solution (Boster Biological Technology) at room temperature for 10
min. Primary antibodies, including anti-KDM6A antibody (1:1,000;
cat. no. 33510; Cell Signaling Technology, Inc.), anti-Wnt3a
antibody (1:1,000; cat. no. 2391; Cell Signaling Technology, Inc.),
anti-β-catenin antibody (1:1,000; cat. no. 37447; Cell Signaling
Technology, Inc.), anti-RUNX2 antibody (1:1,000; cat. no. ab236639;
Abcam), anti-GAPDH antibody (1:2,000; cat. no. ab8245; Abcam),
anti-histone H3 (di methyl K27) antibody (1:1,000; cat. no. 9728;
Cell Signaling Technology, Inc.), anti-histone H3 (tri methyl K27)
antibody (1:1,000; cat. no. 9733; Cell Signaling Technology, Inc.)
and anti-histone H3 antibody (1:2,000; cat. no. 4499; Cell
Signaling Technology, Inc.), diluted in antibody diluent according
to the manufacturer's instructions, were then added for incubation
overnight at 4°C with gentle shaking. The membranes were washed
with TBS with 0.1% Tween-20 and incubated with the appropriate
horseradish peroxidase-conjugated secondary antibodies (1:4,000;
cat. no. S0001 or S0002; Affinity Biosciences, Ltd.) at room
temperature for 1 h. The proteins were then exposed and stained
with ECL reagent. On the same membrane, different primary
antibodies were incubated successively. Before changing the primary
antibody, the previous round of primary/secondary antibodies was
eluted with Stripping buffer (Beyotime Biotechnology). The target
bands were analyzed using ImageJ software (1.54p; National
Institutes of Health) for gray-value calculations.
Chromatin immunoprecipitation-PCR
(ChIP-PCR)
ChIP-PCR was used to observe the changes in H3K27me2
and H3K27me3 in the promoter region of Wnt3a, β-catenin and RUNX2
in the fx/wt normoxia group and the fx/fx normoxia group after 3
days of osteogenic induction. The ChIP assay was performed using
the ChIP Assay Kit (cat. no. P2078; Beyotime Biotechnology)
according to the manufacturer's instructions. The cells were
treated with 1% formaldehyde to form covalent cross-links between
intracellular DNA-bound proteins and DNA and the cross-linking
reaction was quenched with 125 mM glycine. Cells were lysed with 1
mM PMSF in SDS Lysis Buffer (included in the ChIP Assay Kit) (200
μl/106 cells), and the genomic DNA was
subsequently fragmented by sonication (20 kHz; 4 sec pulse; 8 sec
interval; at a rate of 5 times per min for a total of 5 min in an
ice-water bath) to obtain random fragments typically ranging
between 200 and 1,000 bp. Specific antibodies against the target
proteins were used, including anti-histone H3 (di methyl K27)
(1:50; cat. no. 9728; Cell Signaling Technology, Inc.),
anti-histone H3 (tri methyl K27) (1:50; cat. no. 9733; Cell
Signaling Technology, Inc.) and IgG (cat. no. 2729; Cell Signaling
Technology, Inc.). These antibody-chromatin complexes were
subsequently captured with 60 μl Protein A+G Agarose beads
(included in the ChIP Assay Kit) to enrich the DNA fragments bound
by the target proteins. Subsequently, the instructions in the kit
(cat. no. P2078; Beyotime Biotechnology) were followed to wash the
precipitate. The wash procedure was performed sequentially with Low
Salt Immune Complex Wash Buffer, High Salt Immune Complex Wash
Buffer, LiCl Immune Complex Wash Buffer and TE Buffer. The
cross-linking of proteins and DNA was relieved by centrifugation
(1,000 × g; 1 min; 4°C) and heating, and proteins were degraded
using proteinase K. The enriched DNA fragments were purified using
a DNA purification kit (cat. no. D0033; Beyotime Biotechnology).
Purified DNA was used as a template for PCR amplification using
PrimeSTAR® HS DNA Polymerase (Takara Bio, Inc.). The
primer sequences are listed in Table II. The amplification reaction
conditions were as follows: 30 cycles of 98°C for 10 sec, 60°C for
15 sec and 72°C for 50 sec. The PCR products were separated by 1.5%
agarose gel electrophoresis, stained with GelStain fluorescent
nucleic acid dye (TransGen Biotech Co., Ltd.) and visualized using
a fully automatic digital gel imaging analysis system (Tanon
Science and Technology Co., Ltd.).
| Table IINucleotide sequences of primers used
for chromatin immunoprecipitation-PCR amplification. |
Table II
Nucleotide sequences of primers used
for chromatin immunoprecipitation-PCR amplification.
| Target gene | Primer sequence
(5'-3') | Size, bp |
|---|
| Wnt3a | | 473 |
| Forward |
AGGGTCTTTTCTCTGGGCTACAA | |
| Reverse |
ATCTCAACCTATGGGGGTCACAG | |
| β-catenin | | 657 |
| Forward |
TTGACAAGTGCCAATCGTGAAGG | |
| Reverse |
AAAGTAGTCCCCGCCAGTCCG | |
| RUNX2 | | 890 |
| Forward |
ACTGTCCACGCTGATGAAAGAAT | |
| Reverse |
TGTCTCTTTACTTATGGGTGTTCCT | |
Micro-CT analysis
Micro-CT was used to assess the bone structure and
fracture healing (49). At 28
days post-fracture, the mice underwent in vivo micro-CT
scanning and three-dimensional reconstruction to observe
morphological changes at the fracture site. The mice were initially
anesthetized in an induction chamber with 4% isoflurane delivered
in air at a flow rate of 1 l/min via a gas anesthesia machine. Once
anesthetized, the mouse was transferred to a nose cone for
maintenance on 1.8% isoflurane in air at a flow rate of 0.8 l/min
throughout the scanning procedure. The positions of the mouse and
scanning chamber were carefully fixed, an appropriate scanning bed
was selected, and imaging was performed, followed by
three-dimensional reconstruction to obtain images for subsequent
analysis.
For ex vivo scanning, the bone samples were
placed in a small sample holder for scanning and three-dimensional
reconstruction to collect data for subsequent analyses. On day 28
post-fracture, tibial specimens were collected and then fixed in 4%
paraformaldehyde at 4°C for 48 h. After fixation, the samples were
wrapped in gauze and placed in a small ex vivo chamber for
standard micro-CT scanning and three-dimensional reconstruction
(parameters: tube voltage, 70 kV; tube current, 150 μA;
reconstruction algorithm, Feldkamp-Davis-Kress; resolution, 1k ×
1k). After reconstruction, the images were segmented and bone
analysis was performed using Avatar3 software [2.0.12.0; PINGSENG
Healthcare (Kunshan) Inc.]. The region of interest was defined as
an area 1 mm above and below the fracture line. Quantitative
analyses were performed to determine the trabecular bone volume
fraction (BV/TV), trabecular bone surface area fraction (BS/TV),
trabecular number (Tb.N) and trabecular thickness (Tb.Th).
Statistical analysis
Cluster-specific marker genes were identified using
the Wilcoxon rank-sum test implemented in the FindAllMarkers
function of the Seurat package, with an adjusted P-value <0.05
and |avglog2 fold change (FC)|>0.25 as thresholds.
Differentially expressed genes between groups were explored using
the FindMarkers function with the built-in Wilcoxon rank-sum test,
with an adjusted P-value <0.05 and
|avglog2FC|>0.15. The experimental data were obtained
from at least three independent replicates. Statistical analyses of
all data were performed using GraphPad Prism (version 8.0.2;
Dotmatics). Data were normally distributed. Comparisons between two
groups were analyzed using a two-tailed, unpaired Student's t-test.
For comparisons among multiple groups, one-way ANOVA was performed,
followed by Tukey's post hoc test. Data are presented as the mean ±
SD. P<0.05 was considered to indicate a statistically
significant difference.
Results
Transcriptional landscape of callus
tissue during mouse fracture healing
First, six fx/wt (WT) mouse fracture callus samples
were analyzed, including three samples collected at 10 days
post-fracture (WT1_10, WT2_10 and WT3_10) and three samples
collected at 21 days post-fracture (WT1_21, WT2_21 and WT3_21).
Following quality control and data filtering, 56,189 high-quality
deeply sequenced cells were obtained and 25 distinct clusters were
identified. Each cluster was defined by comparing its expression
profile with that of known lineage markers or canonical gene
signatures.
During cell annotation, dimensionality reduction and
unbiased clustering were performed based on gene expression
profiles and classical markers of the cells, resulting in the
identification of 19 clusters (Fig.
1A). There were distinct differences in the UMAP plots between
callus samples collected 10 and 21 days after fracture, indicating
different cellular compositions at these stages (Fig. 1B). The present study focused
particularly on six CH subpopulations: i) Proliferative CHs,
characterized by high expression levels of Ucma, C1qtnf3, Cnmd,
Itm2a and Scrg1; ii) pre-HTCs, marked by elevated levels of Cdkn1c,
Hapln1, Ppa1, Pth1r and Snorc; iii) HTCs, expressing Col10a1, Cst3,
Spp1, Ihh and Ddit4l; iv) CH-derived osteoprogenitors (CDOPs),
distinguished by high expression levels of Mmp13, Spp1,
osteomodulin (Omd), matrix Gla protein (Mgp) and MAF bZIP
transcription factor B (Mafb); v) osteoblasts, identified by the
expression of Bglap, Bglap2, Ifitm5, Ibsp and Col1a1; and vi)
osteoclasts, which specifically expressed Acp5, Ctsk, Ckb, S100a4
and Mmp9 (Fig. 1C).
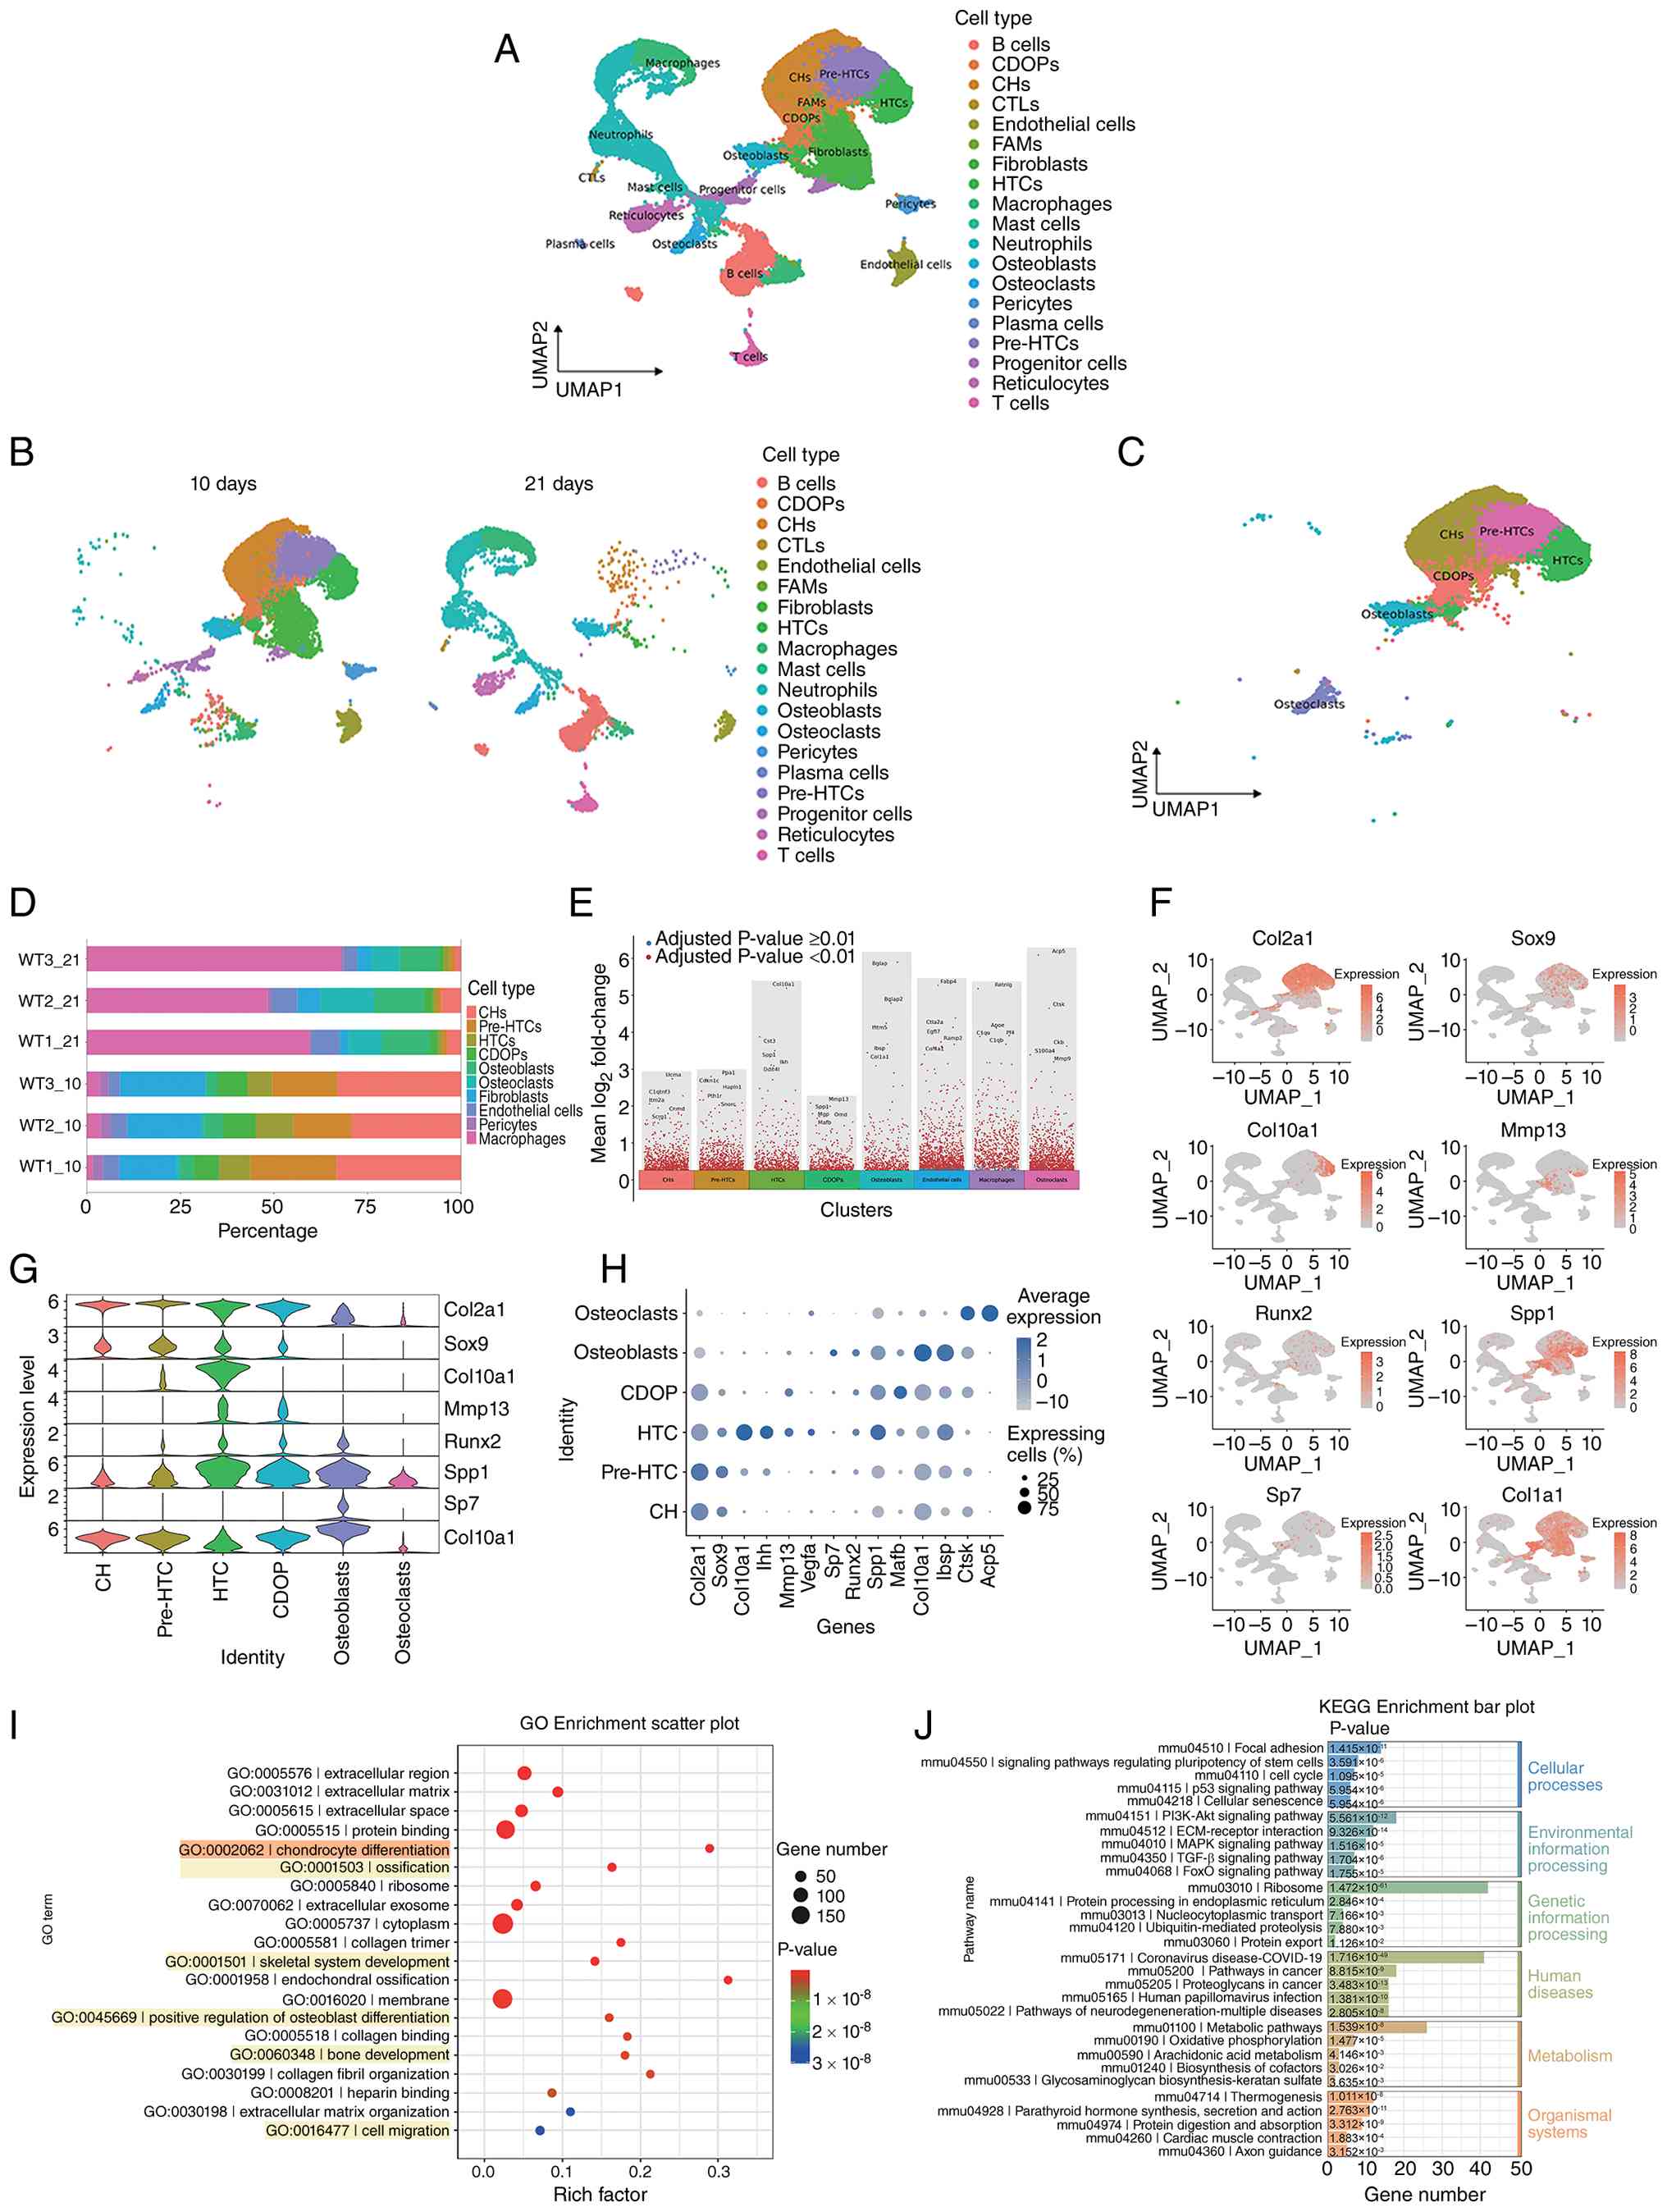 | Figure 1Transcriptional landscape of callus
tissue during mouse fracture healing. (A) UMAP plot displaying 19
major cell types identified in the callus tissue. (B) UMAP plots of
tissue samples collected from WT mice at 10 and 21 days
post-fracture. (C) UMAP plots showing six subpopulations of
CH-osteoblast lineage cells. (D) Proportion plots of the cell types
of interest for each tissue sample. (E) Volcano plots of
differentially expressed genes for the subpopulations of interest.
(F) UMAP plots of characteristic marker genes for CH-osteoblast
subpopulations. Deeper colors indicate higher expression levels of
the feature gene in specific cell populations. (G) Expression
profiles of the key representative genes in each subpopulation
during CH transdifferentiation. (H) Dot plot showing the expression
of 14 characteristic marker genes across the six subpopulations.
Dot size represents the proportion of cells expressing a particular
marker, whereas the color gradient indicates the average expression
level of the marker. (I) Bubble plot of GO functional enrichment
analysis of genes in cluster 5 (CDOP). (J) Bar plot of KEGG pathway
enrichment analysis of genes in cluster 5 (CDOP). For each
timepoint, callus tissues were harvested from three independent
mice (n=3 biologically independent animals per timepoint). CDOP,
chondrocyte-derived osteoprogenitor; CH, chondrocyte; CTL,
cytotoxic T lymphocyte; FAM, fibroblastic reticular cell-associated
macrophage; GO, Gene Ontology; HTC, hypertrophic chondrocyte; KEGG,
Kyoto Encyclopedia of Genes and Genomes; UMAP, uniform manifold
approximation and projection; WT, wild-type. |
Proportion plots were generated for each cell type
(Fig. 1D). At 10 days
post-fracture, CHs in the tissue were in a rapid proliferative
phase, with pre-HTCs, HTCs and CDOPs constituting a larger
proportion. Osteoblasts were already present but at relatively low
levels. By day 21, the proportion of CHs had markedly decreased,
indicating that hypertrophy and transdifferentiation were near
completion, whereas the numbers of endothelial cells and
osteoclasts had increased, accelerating vascular invasion and
cartilage matrix degradation.
The volcano plot demonstrated that a special CDOP
subset was distinguished by the co-expression of a specific set of
marker genes, including Mmp13, Spp1, Mgp, Omd and Mafb (Fig. 1E). The expression profiles of key
representative genes during CH transdifferentiation, including
Col2a1, Sox9, Col10a1, Mmp13, RUNX2, Spp1, Sp7 (Osx) and Col1a1,
were examined and visualized using UMAP and violin plots (Fig. 1F and G). Dot plot analysis
revealed that CDOPs co-expressed Col2a1 and Col1a1, and lacked HTC
marker Col10a1, suggesting active matrix mineralization, remodeling
and proliferation (Fig. 1H)
(35).
Systematic functional analysis of endochondral
ossification-related differentially expressed gene clusters in
CDOPs revealed that the core differential genes, according to GO
functional annotation, were significantly enriched in key
biological processes such as 'protein binding' (molecular
function), 'chondrocyte differentiation' (biological process) and
'skeletal system development' (cellular component). Notably, these
genes were highly associated with 'ossification' and 'bone
development' (Fig. 1I). KEGG
pathway enrichment analysis further demonstrated that the
differential genes were primarily involved in the 'FoxO signaling
pathway', 'TGF-β signaling pathway', 'MAPK signaling pathway',
'ECM-receptor interaction' and 'PI3K-Akt signaling pathway'
(Fig. 1J). These pathways
collectively mediate the establishment of the osteogenic
microenvironment through the coordinated regulation of cell cycle
progression, proliferative and differentiation dynamics, migratory
and adhesive behaviors, and matrix remodeling capacity. The
significant enrichment of 'signaling pathways regulating
pluripotency of stem cells' (Fig.
1J) suggested that CDOPs may possess the potential for
mesenchymal stem cell differentiation toward the osteogenic
lineage.
Differentiation of CDOPs into osteoblasts
during endochondral ossification is regulated by the oxygen
environment
Based on trajectory inference analysis of
single-cell transcriptomic data, the present study utilized the
Monocle3 algorithm to perform pseudo-time modeling of six relevant
cell subpopulations involved in the transdifferentiation process of
CHs. UMAP nonlinear dimensionality reduction (Fig. 2A) was used to construct a
continuum of cellular states, followed by integration with RNA
velocity to resolve the topological structure of the cell
differentiation trajectories. Using CHs as the starting point of
the trajectory (pseudotime t=0), the results revealed a pronounced
bifurcation in cell fate with notable bidirectional heterogeneity:
The primary branch (branch 1) culminated in osteoblasts as the
terminally differentiated state, while the secondary branch (branch
2) terminated in HTCs. Notably, osteoblasts were strictly localized
to the terminal region of branch 1 along the pseudotime axis, with
no significant temporal overlap in transcriptomic features with
intermediate cell states, such as the CDOP subpopulation,
suggesting that this subpopulation may undergo a rapid terminal
differentiation program. By contrast, HTCs and CDOPs exhibited
partially overlapping segments along the pseudo-time axis,
indicating that they may share transitional regulatory networks.
Further analysis examined the temporal changes in the expression of
characteristic genes at various time points and across different
cell subpopulations (Fig. 2B and
C). Pseudotime analysis showed that 1700025G04Rik was highly
expressed during the early stages of CH transdifferentiation,
suggesting its potential role in driving the differentiation
process. Collagen type III α1 chain (Col3a1) is primarily
distributed in blood vessels, marking vascular ingrowth during
differentiation, and together with Col1a1, helps maintain tissue
tensile strength (50). Collagen
type V α2 chain (Col5a2) serves a regulatory role in the assembly
of Col1a1, thereby influencing collagen fiber diameter and
organization of the extracellular matrix (51). Serpin family E member 2
(Serpine2) inhibits plasmin and thrombin, thereby regulating ECM
remodeling, axon guidance and synaptic plasticity (52). Myosin IB (Myo1b), an
unconventional myosin, modulates the interplay between the cell
membrane and the cytoskeleton through its association with actin.
Myo1b participates in vesicle trafficking and cell migration, and
serves a crucial role in the regulation of diverse cellular
functions, including cell proliferation and apoptosis (53). During the transdifferentiation
process, Col5a2, Myo1b and Serpine2 expression progressively
increased, peaking at the terminal stage, whereas Col3a1 expression
remained stable during the CH phase and was gradually downregulated
upon osteoblast commitment. Taken together, these findings
suggested that CDOPs are the precursor subpopulations of
osteoblasts, whereas conventional HTCs maintain paracrine
regulatory roles during endochondral ossification.
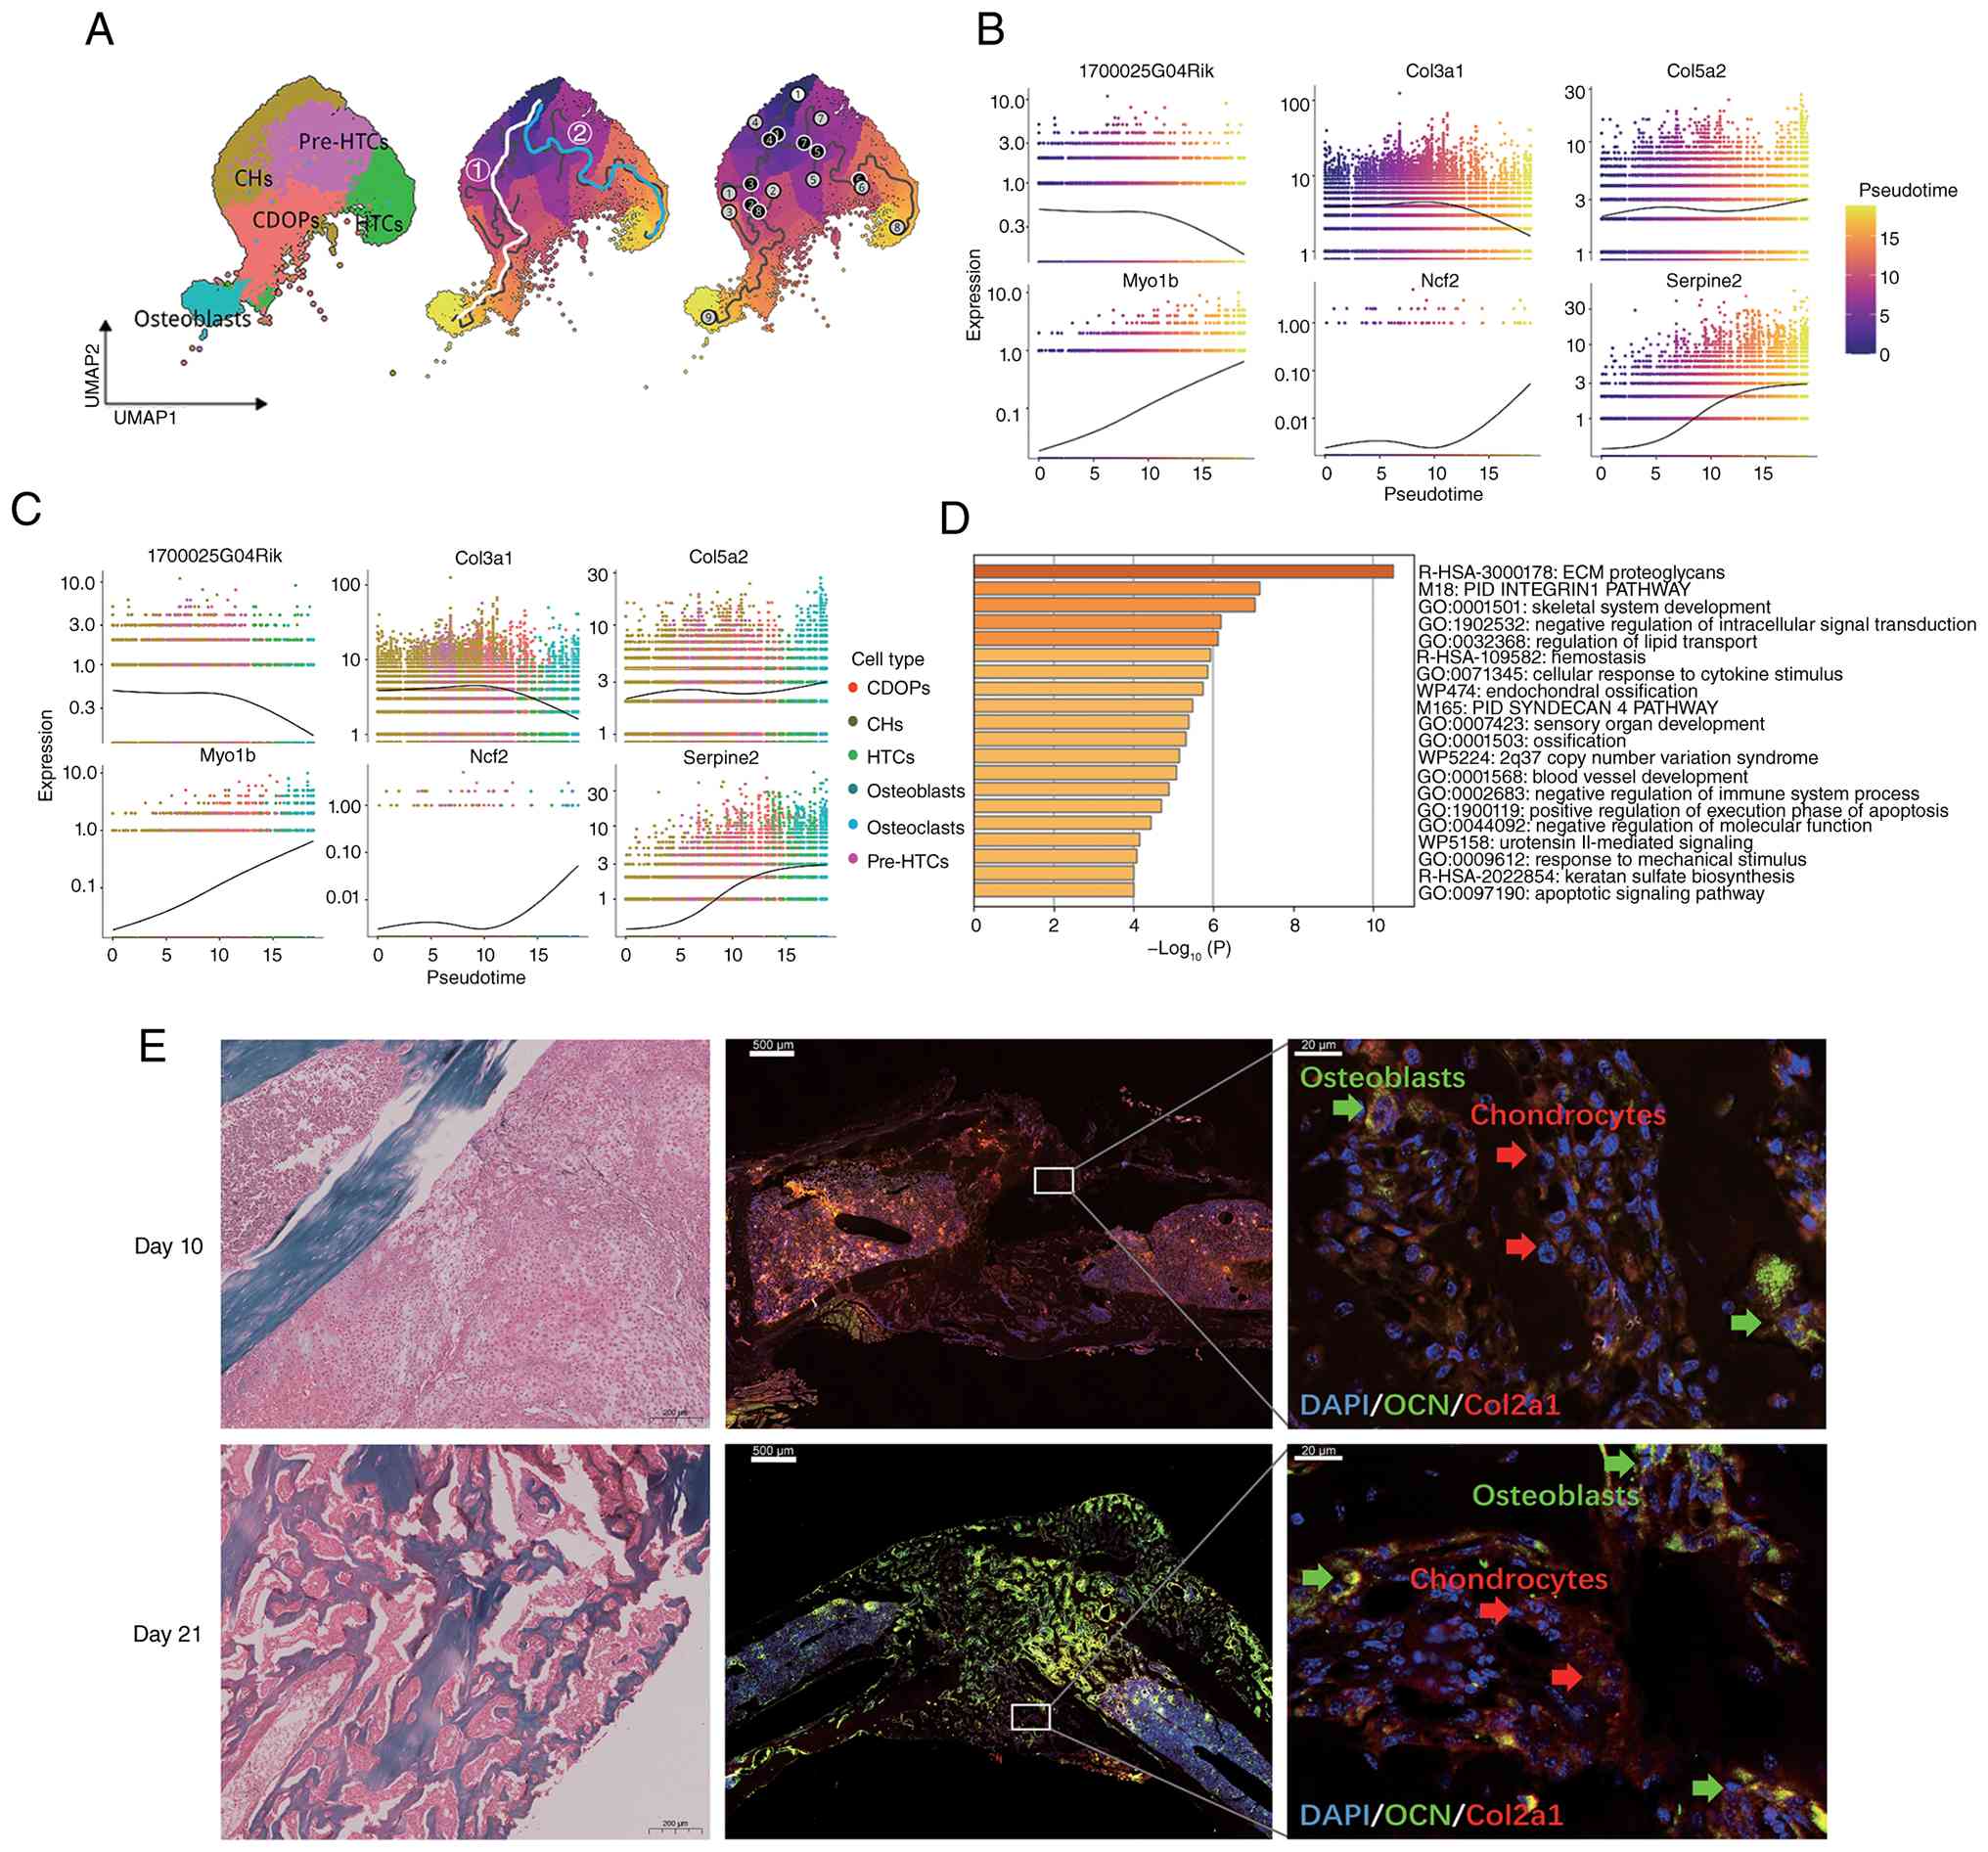 | Figure 2Differentiation of CDOPs into
osteoblasts during endochondral ossification is regulated by the
oxygen environment. (A) UMAP plot showing the distribution of cell
subpopulations, with a pseudo-time trajectory from CHs to
osteoblasts/HTCs that included both fates 1 and 2. The trajectory
plot shows the underlying graph structure as black lines. The white
line indicates fate 1, representing the transdifferentiation path
from CHs through the transitional CDOP state to osteoblasts. The
blue line indicates fate 2, depicting the differentiation path from
CHs through pre-HTCs to HTCs. White circles represent roots, gray
circles indicate terminal fates (leaves) and black circles denote
the branch points from which cells can diverge toward multiple
fates. (B) Pseudotime expres- sion plots for the top six genes,
illustrating their dynamic changes along the differentiation
trajectory. (C) Expression profiles of the top six genes across the
different cell subpopulations. (D) Bar plot of GO functional
enrichment for the top 100 genes, colored by P-value. (E)
Representative Safranin O/Fast Green staining images of mouse
tibial fracture callus at 10 and 21 days post-fracture (scale bar,
200 µm), and immunofluorescence staining images showing
OCN+ and Col2a1-tdTomato+ cells (scale bars,
500 and 20 µm). For each timepoint, callus tissues were harvested
from three independent mice (n=3 biologically independent animals
per timepoint). OCN, osteocalcin; CDOP, chondrocyte-derived
osteoprogenitor; CH, chondrocyte; Col2a1, collagen type II α1
chain; Col3a1, collagen type III α1 chain; Col5a2, collagen type V
α2 chain; ECM, extracellular matrix; GO, Gene Ontology; HTC,
hypertrophic chondrocyte; Myo1b, myosin IB; Ncf2, neutrophil
cytosolic factor 2; PID, Pathway Interaction Database; Serpine2,
serpin family E member 2; UMAP, uniform manifold approximation and
projection. |
GO functional enrichment analysis of the top 100
differentially expressed genes (Fig.
2D) revealed the following: First, the core biological themes
were skeletal development and remodeling, as evidenced by terms
such as 'endochondral ossification', 'skeletal system development'
and 'ossification'. There were also implicit connections, such as
strong enrichment of 'ECM proteoglycans' and the 'PID INTEGRIN1
PATHWAY', indicating that dynamic remodeling of the extracellular
matrix was a driving force in bone formation. Second, crosstalk
between signaling pathways was apparent: The enrichment of the 'PID
INTEGRIN1 PATHWAY' along with the 'response to mechanical stimulus'
suggested that integrins may regulate CH differentiation by sensing
mechanical signals (such as the piezoelectric effect in bones). The
'PID SYNDECAN 4 PATHWAY' and its association with ECM proteoglycans
may mediate cell matrix adhesion and coordinate with growth factors
(such as cell adhesion molecule and BMP). Third, enrichment of 'ECM
proteoglycans' and 'keratan sulfate biosynthesis' underscored the
critical role of glycosaminoglycan modifications in establishing
and maintaining a CH-to-osteoblast transition microenvironment. The
term 'negative regulation of molecular function' likely reflected
the precise control of matrix degradation by protease inhibitors,
such as Serpine2. Fourth, microenvironmental homeostasis mechanisms
were highlighted by terms such as 'hemostasis' and 'blood vessel
development', indicating the coupled roles of angiogenesis,
coagulation factors and the oxygen microenvironment in bone repair
processes. Enrichment of the 'apoptotic signaling pathway' and
'positive regulation of execution phase of apoptosis' likely
reflected the contribution of programmed death of HTCs to the
progression of ossification.
Safranin O/Fast Green staining of callus tissues
harvested from the fracture sites at 10 and 21 days post-fracture
was performed (Fig. 2E). On day
10, the robust formation of cartilaginous calluses was observed in
all groups. The extracellular matrix of HTCs, rich in
proteoglycans, was intensely stained red by Safranin O, indicating
that the cartilage tissue constituted the majority of the callus at
this stage, with only a small proportion of gray-blue-stained
osteogenic areas present. A marked increase in the number and
proportion of tdTomato+/OCN+ double-positive
cells indicative of CH-derived osteoblasts was evident from the
immunofluorescence images comparing fracture calli at day 10 and
day 21 post-fracture (Fig.
2E).
Oxygen availability facilitates the
osteogenic differentiation of CHs via KDM6A
Given that KDM6A acts as an oxygen sensor to
regulate cellular differentiation (22), the present study investigated how
CH-to-osteoblast differentiation during endochondral ossification
is altered under different oxygen levels. CHs derived from fx/wt
and fx/fx mice were subjected to transdifferentiation induction.
After 7 days of induction, Alcian blue staining (Fig. 3A and B) revealed that the
fx/wt-normoxic group exhibited a significantly lower amount of
acidic mucopolysaccharides than the fx/wt-hypoxic group
(P<0.05), while the fx/fx-normoxic group showed a significant
increase in acidic mucopolysaccharides compared with the
fx/wt-normoxic group (P<0.01). ALP staining (Fig. 3C and D) demonstrated that the
number of ALP-positive cells was markedly higher in the
fx/wt-normoxic group than in the fx/wt-hypoxic group (P<0.001),
whereas the number of ALP-positive cells in the fx/fx-normoxic
group was significantly lower than that in the fx/wt-normoxic group
(P<0.001). Alizarin red staining (Fig. 3E and F) indicated an increased
number of mineralized nodules in the fx/wt-normoxic group compared
with the fx/wt-hypoxic group (P<0.05), whereas the
fx/fx-normoxic group had fewer mineralized nodules than the
fx/wt-normoxic group (P<0.05).
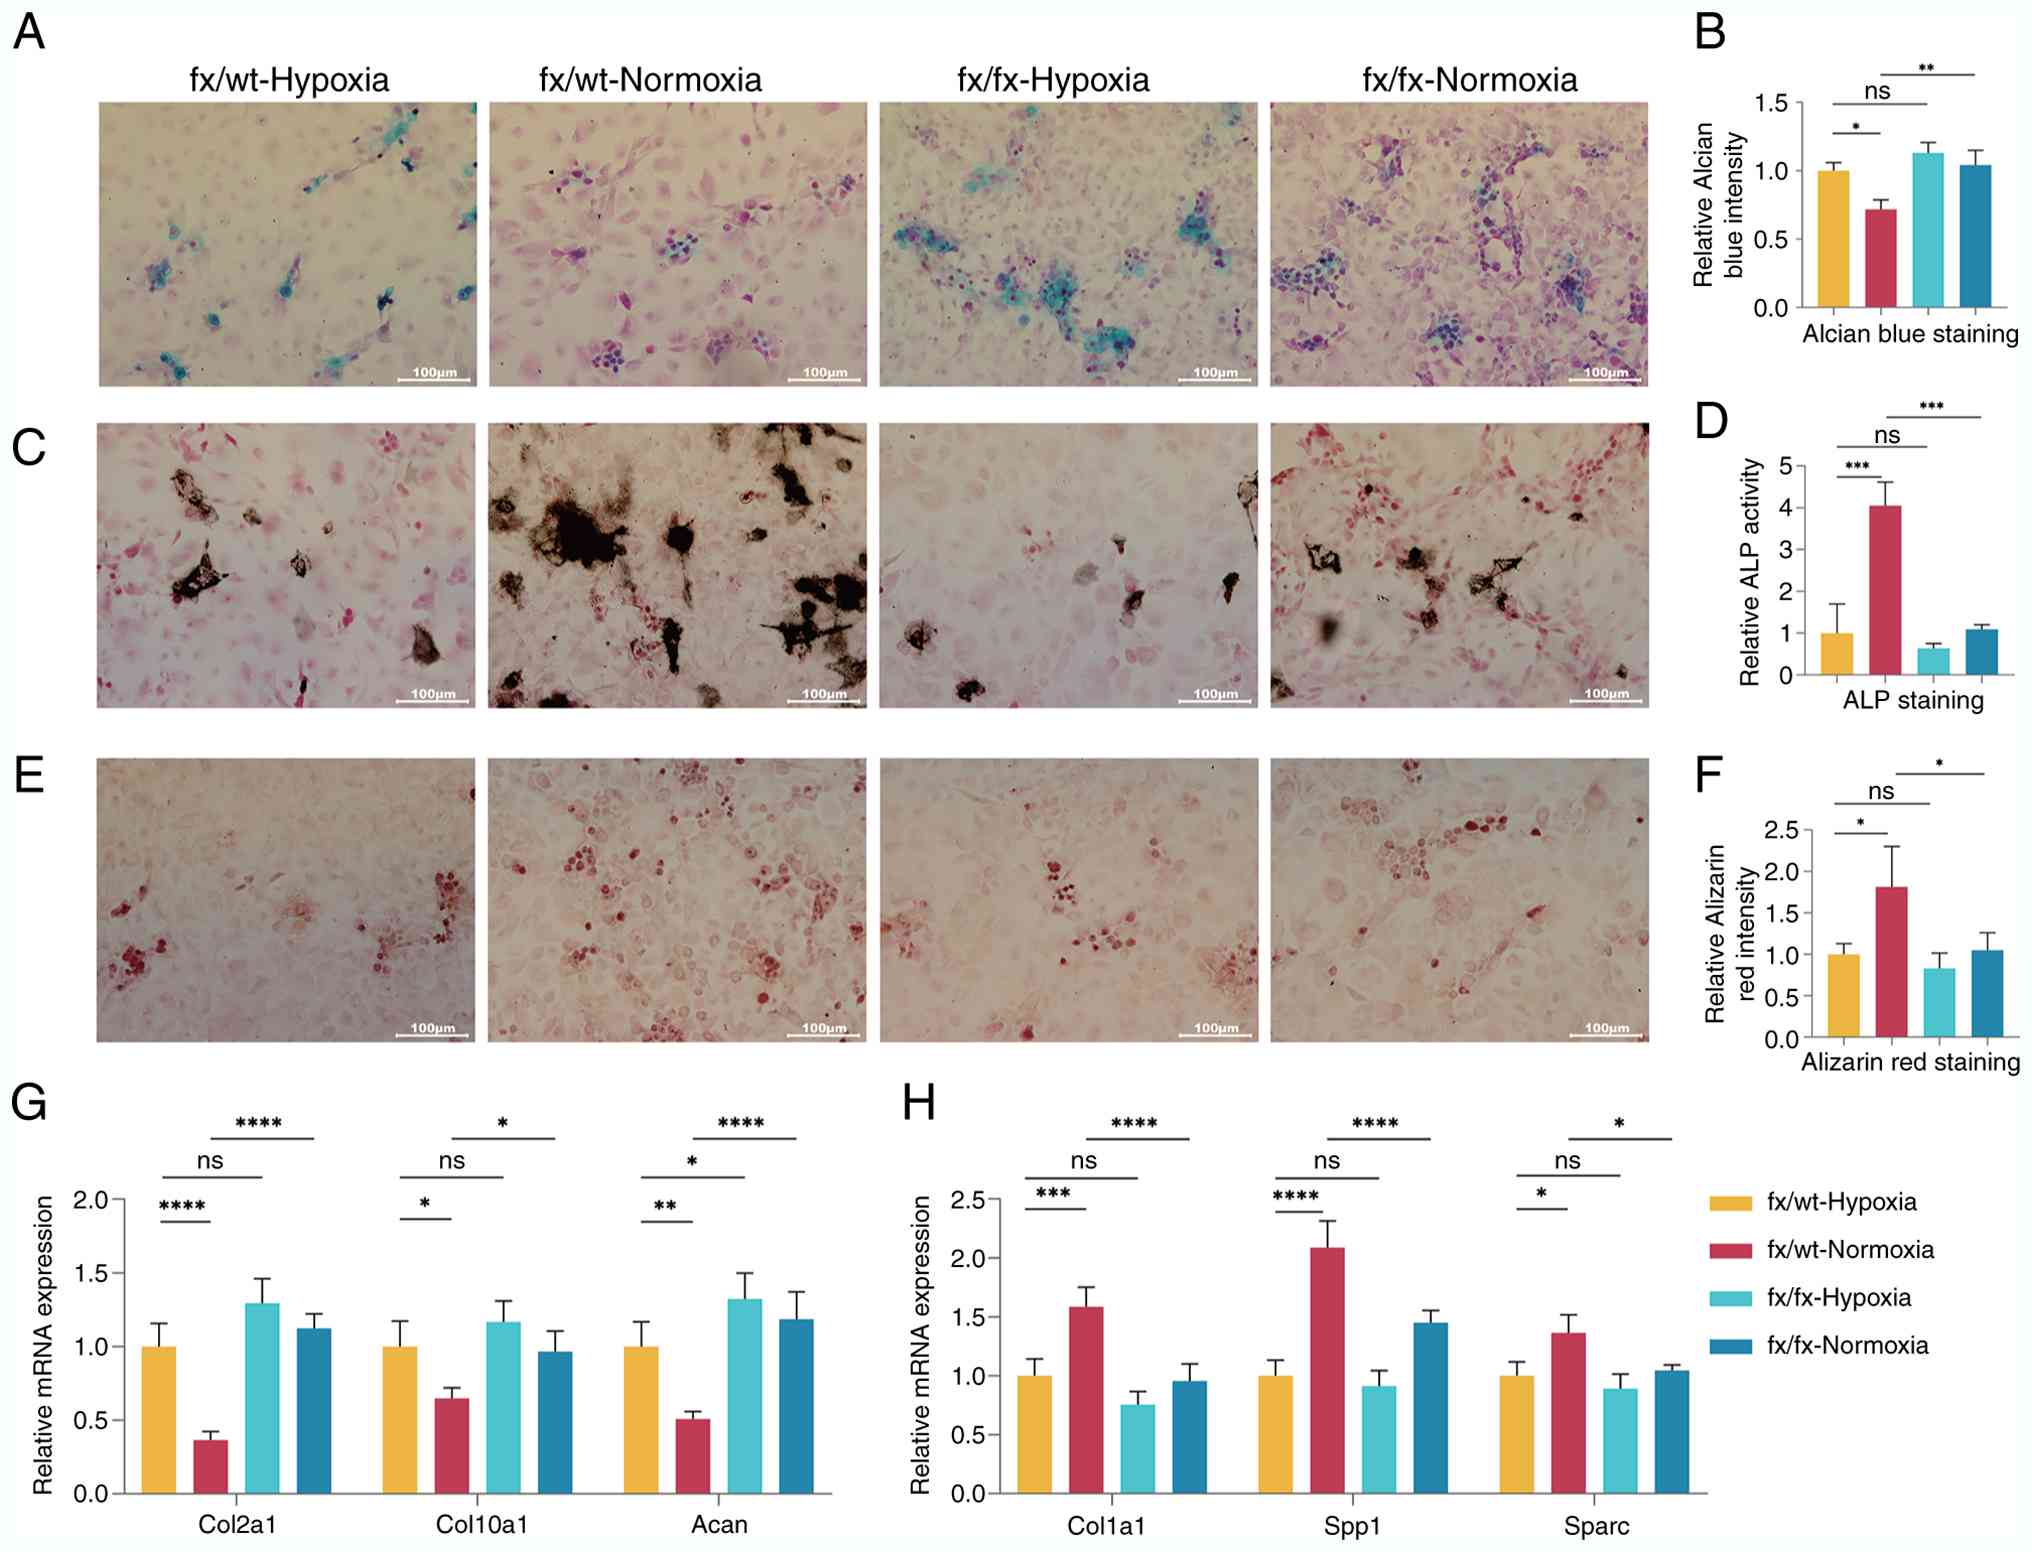 | Figure 3Oxygen availability facilitates the
osteogenic differentiation of CHs via lysine demethylase 6A. (A)
Alcian blue staining of cells from each group after 7 days of
induction (scale bar, 100 µm). (B) Quantitative analysis of Alcian
blue staining in each group. (C) ALP staining of cells from each
group after 7 days of induction (scale bar, 100 µm). (D)
Quantitative analysis of ALP staining in each group. (E) Alizarin
red staining of cells from each group after 7 days of induction
(scale bar, 100 µm). (F) Quantitative analysis of Alizarin Red
staining in each group. (G) Relative mRNA expression levels of CH
marker genes in each group 3 days after induction. (H) Relative
mRNA expression levels of osteogenic differentiation-related genes
in each group 3 days after induction. n=3, data derived from three
independent experiments. P-values were calculated using one-way
ANOVA followed by Tukey's post hoc test. The values are presented
as the mean ± SD. *P<0.05, **P<0.01,
***P<0.001 and ****P<0.0001. Acan,
aggrecan; ALP, alkaline phosphatase; CH, chondrocyte; Col1a1,
collagen type I α1 chain; Col10a1, collagen type X α1 chain;
Col2a1, collagen type II α1 chain; fx, Kdm6a conditional knockout
mice; IntDen, integrated density; ns, not significant; Sparc,
secreted protein acidic and cysteine rich; Spp1, secreted
phosphoprotein 1; wt, wild-type. |
qPCR analysis of CH marker gene expression 3 days
after induction (Fig. 3G) showed
that the mRNA levels of Col10a1, Acan and Col2a1 were reduced in
the fx/wt-normoxic group compared with the fx/wt-hypoxic group
(P<0.05, P<0.01 and P<0.0001, respectively). By contrast,
fx/fx-normoxic mice exhibited increased expression of all three
genes compared with fx/wt-normoxic mice (P<0.05), with a
particularly significant upregulation of Col2a1 and Acan
(P<0.0001). Furthermore, analysis of the relative mRNA levels of
osteogenic differentiation-related genes (Fig. 3H) revealed that Col1a1, Spp1 and
Sparc were significantly upregulated in the fx/wt-normoxic group
compared with the fx/wt-hypoxic group (P<0.001, P<0.0001 and
P<0.05, respectively). However, the expression levels of all
three genes were markedly reduced in the fx/fx-normoxic group
compared with the fx/wt-normoxic group (P<0.0001, P<0.0001
and P<0.05, respectively).
KDM6A promotes the differentiation of CHs
into CDOPs by activating the Wnt signaling pathway
scRNA-seq was also performed on chondral callus cell
samples from fx/wt (WT) and fx/fx mice (FX), 10 days post-fracture.
The analysis focused on CHs, pre-HTCs, HTCs, CDOPs and osteoblasts
(Fig. 4A). Violin plots of gene
expression (Fig. 4B) revealed
that the mean expression levels of Col2a1 in the WT group were
lower than those in the FX group, whereas Col10a1, RUNX2 and Col1a1
were more highly expressed in the WT group than in the FX group.
The expression levels of Acan and Bglap were similar in the two
groups. The present study specifically focused on the CDOP
subpopulation. The volcano plot of differentially expressed genes
showed that osteogenic genes, including Col1a1, Sp7, RUNX2 and
Spp1, were significantly upregulated in CDOPs of the WT group
compared with those of the FX group (Fig. 4C). GO analysis indicated that the
upregulated genes were enriched in biological processes, such as
'cell adhesion', 'chondrocyte differentiation', 'skeletal system
development', 'endochondral ossification' and 'osteoblast
differentiation'. Pathway analysis revealed that the 'Wnt signaling
pathway' was the most prominent osteogenic pathway enriched in our
dataset (Fig. 4D and E). GSEA
(Fig. 4F) indicated that the
'Wnt signaling pathway' was significantly enriched in the WT group
(enrichment score, 0.276; P=0.0063; false discovery rate, 0),
suggesting that global Wnt pathway activity was higher in WT
cells.
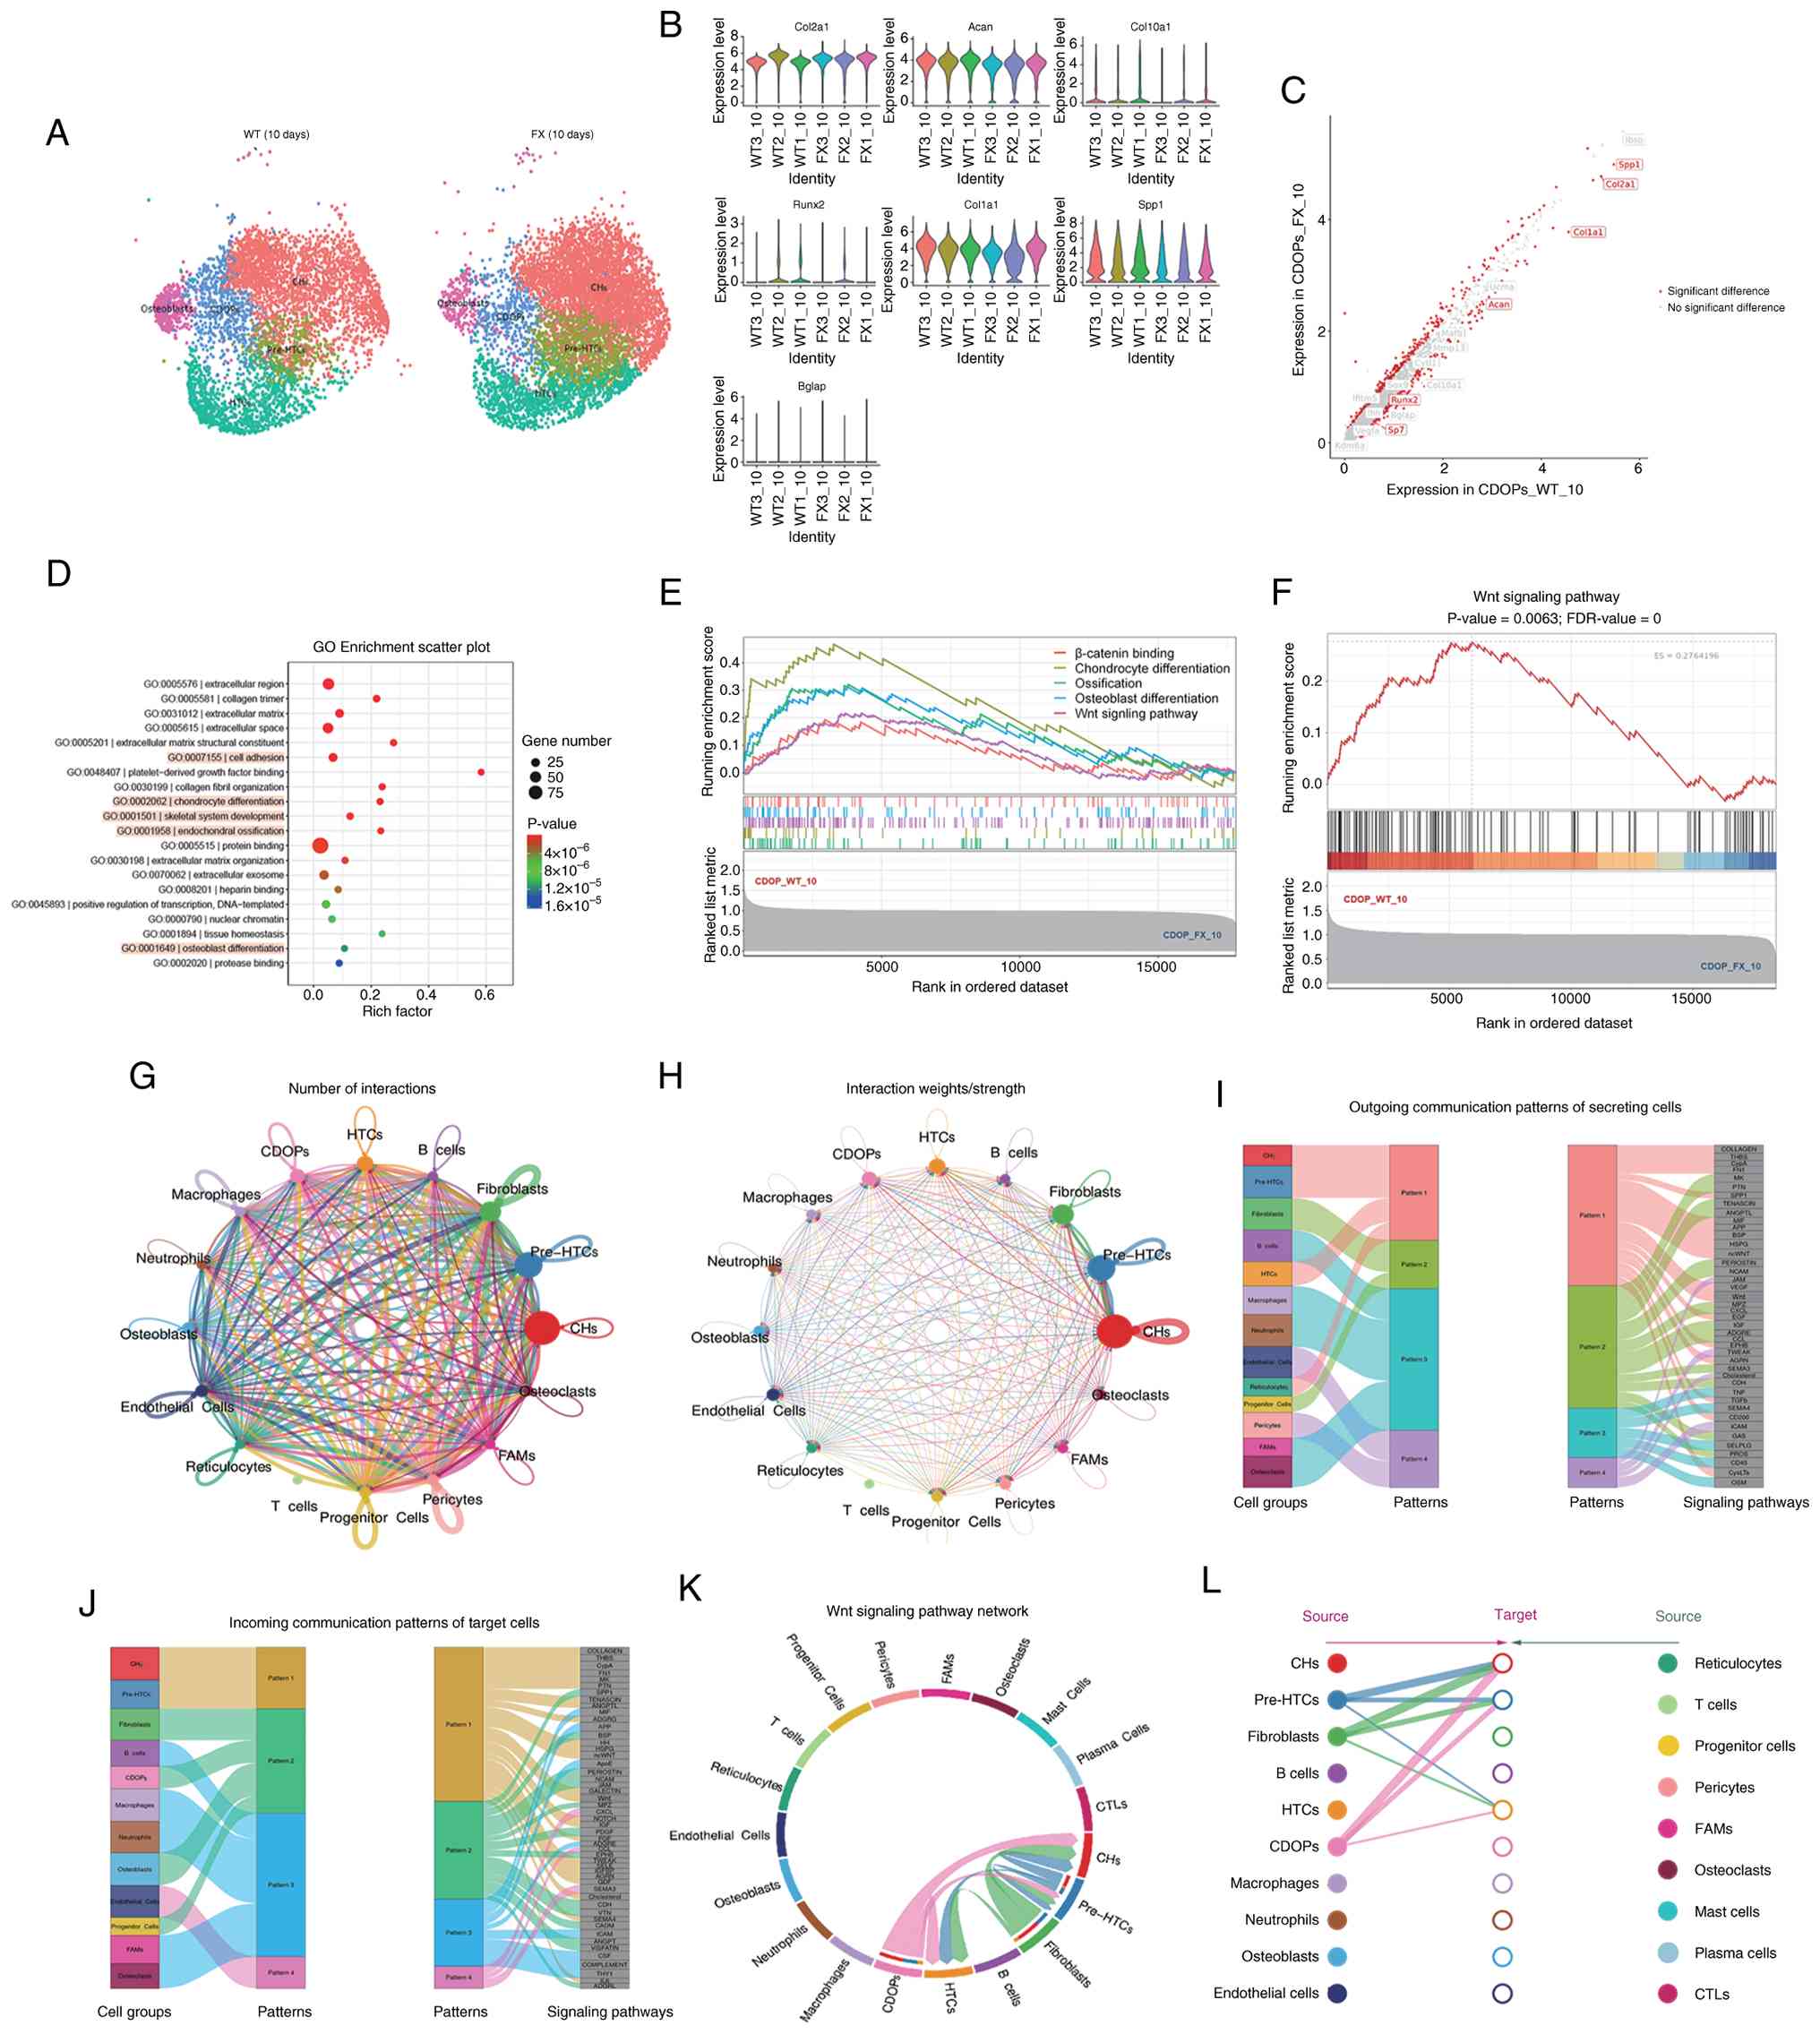 | Figure 4Lysine demethylase 6A promotes the
differentiation of CHs into CDOPs by activating the Wnt signaling
pathway. (A) UMAP visualization of CH and osteoblast subpopulations
in WT and FX groups. (B) Violin plots showing the average
expression levels of marker genes across six samples. (C) Volcano
plot depicting upregulated genes in CDOPs between the WT and FX
groups. (D) Bubble plot of GO functional enrichment analysis of
upregulated genes in CDOPs. (E) Line graph of gene set enrichment
analysis enrichment scores for upregulated genes in CDOPs based on
the GO database. (F) Line graph of enrichment scores from the Kyoto
Encyclopedia of Genes and Genomes pathway analysis showing
upregulation of the Wnt pathway in CDOPs. (G) Network plot
illustrating the number of interactions between any two cell
groups. (H) Network plot displaying the interaction strength
between any two cell groups. (I) Visualization of outgoing
communication patterns of cell populations. (J) Visualization of
incoming communication patterns of cell populations, with Sankey
diagrams showing relationships between cell clusters and patterns,
as well as between pathways and patterns. (K) Chord diagram of Wnt
signaling pathway interactions among CH subpopulations. (L)
Hierarchical plot of Wnt signaling pathway interactions among CH
subpopulations. Source (left) and target (right) cell populations
are represented by colored circles. Connecting lines indicate
inferred Wnt ligand-receptor interactions, with the line color
corresponding to the source cell type and the line thickness
proportional to the interaction probability/strength. The plot
highlights CDOPs as a prominent source of Wnt signals within the
chondro-osteogenic lineage, with CHs also contributing as a target.
For each timepoint, callus tissues were harvested from three
independent mice (n=3 biologically independent animals per
timepoint). CDOP, chondrocyte-derived osteoprogenitor; CH,
chondrocyte; CTL, cytotoxic T lymphocyte; ES, enrichment score;
FAM, fibroblastic reticular cell-associated macrophage; FDR, false
discovery rate; FX, Kdm6a conditional knockout mice; GO, Gene
Ontology; HTC, hypertrophic chondrocyte; UMAP, uniform manifold
approximation and projection; WT, wild-type. |
CellChat analysis identified intercellular
communication among the 16 clusters detected in callus samples on
day 10 post fracture, revealing extensive molecular interactions
(Fig. 4G and H). Sankey plots
showed how 13 sender cell populations (acting as signaling sources)
coordinated with one another and with specific signaling pathways
to drive communication, and how 12 receiver cell populations
(acting as targets) coordinated to respond to incoming signals
(Fig. 4I and J). Notably, CHs
and CDOPs exhibited the highest frequency of intercellular
interactions via the Wnt signaling pathway (Fig. 4K). Furthermore, the hierarchical
plot (Fig. 4L) delineated the
sending and receiving roles of different CH subsets within the Wnt
signaling network, highlighting CDOPs as key signaling hubs.
KDM6A deficiency inhibits endochondral
ossification under normoxic conditions by suppressing the
Wnt/β-catenin pathway through enhanced histone H3K27
methylation
Western blot analysis was performed to assess the
histone methylation levels in CHs from fx/wt-normoxic and
fx/fx-normoxic cells during transdifferentiation. H3K27me2 and
H3K27me3 levels were normalized to those of total histone H3
(loading control) to quantify relative changes in these histone
modifications independently of total protein variation. As shown in
Fig. 5A, the expression levels
of H3K27me2 and H3K27me3 proteins were significantly higher in the
fx/fx-normoxic group than in the fx/wt-normoxic group (P<0.001).
ChIP-PCR (Fig. 5B) showed that
enrichment of H3K27me2 and H3K27me3 at the Wnt3a promoter region
was markedly increased in the fx/fx normoxic group compared with
the fx/wt-normoxic group. H3K27me3 enrichment at the RUNX2 promoter
was also higher in the fx/fx-normoxic group than in the
fx/wt-normoxic group. Additionally, the protein expression levels
of Wnt3a, β-catenin and RUNX2 (Fig.
5C and D) were reduced in the fx/fx-hypoxic group compared with
the fx/wt-hypoxic group (P<0.05). In addition, the
fx/wt-normoxic group exhibited significantly higher expression
levels of β-catenin and RUNX2 compared with the fx/wt-hypoxic group
(P<0.001), while Wnt3a expression was also increased
(P<0.01). By contrast, the expression levels of all three
proteins were significantly decreased in fx/fx-normoxic mice
compared with fx/wt-normoxic mice (P<0.001). Differences in the
mRNA expression levels of Wnt3a, β-catenin and RUNX2 (Fig. 5E) among the groups were in
accordance with their respective protein expression patterns.
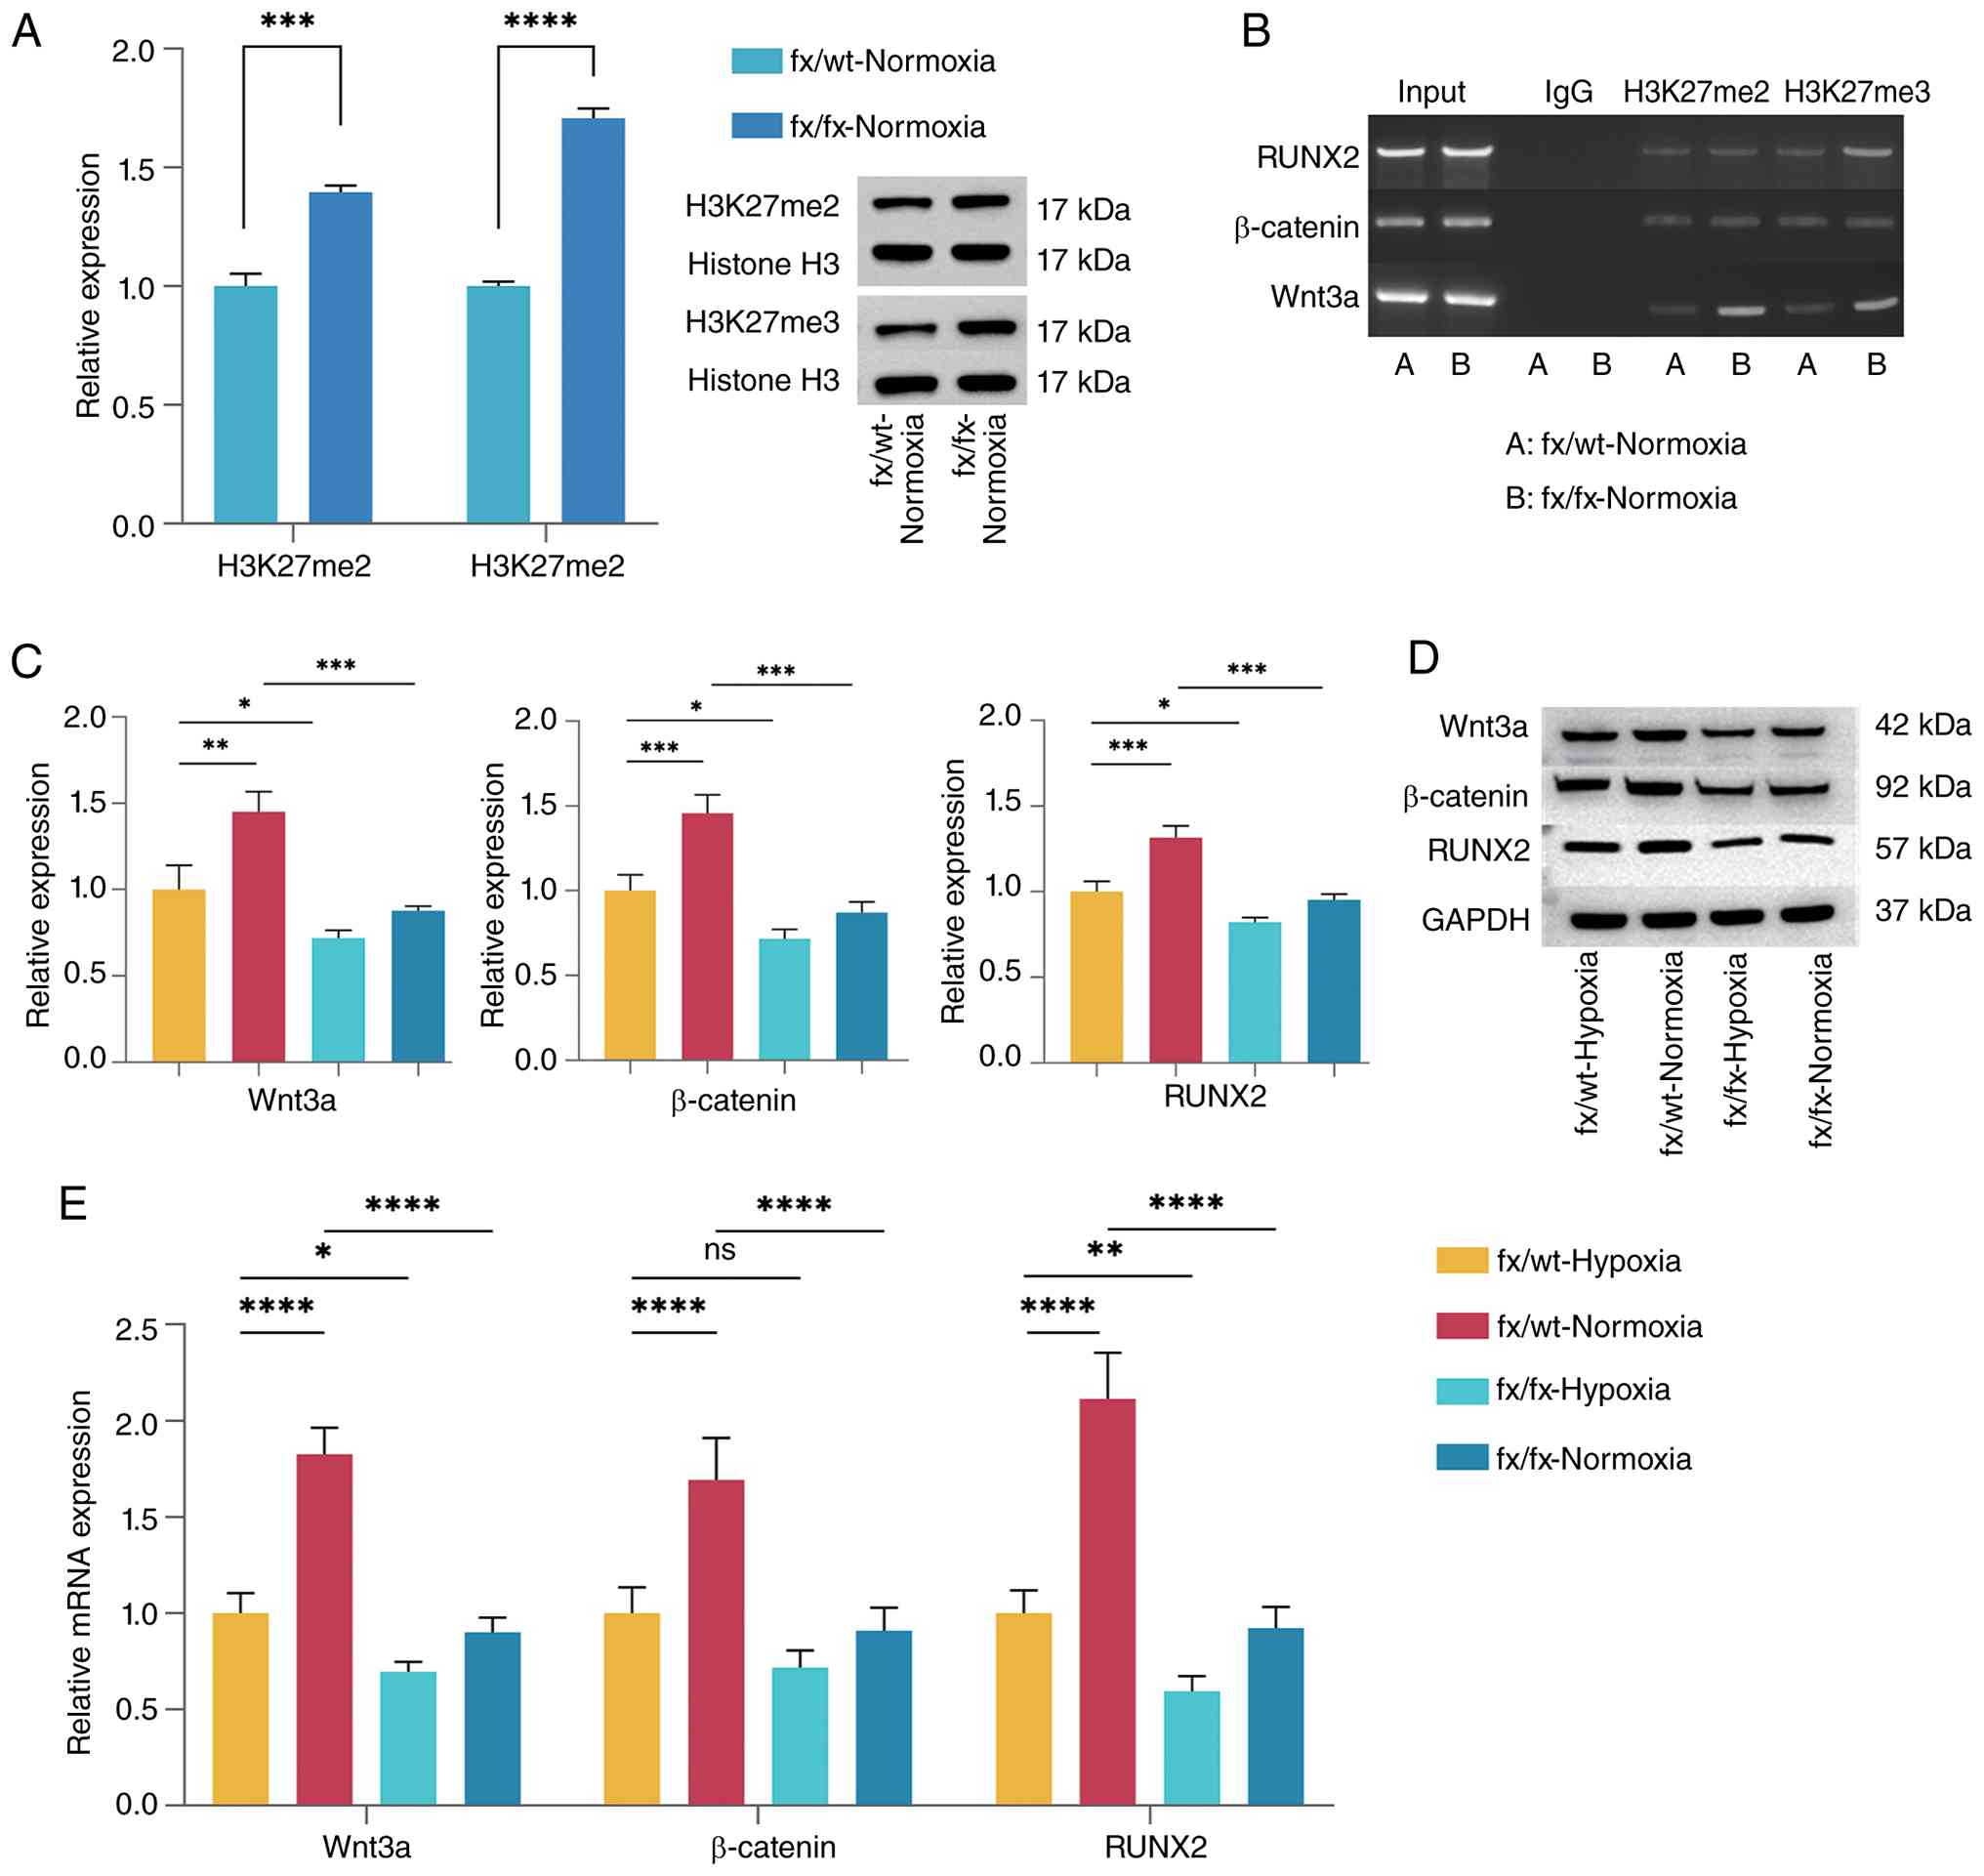 | Figure 5Lysine demethylase 6A deficiency
inhibits endochondral ossification under normoxic conditions by
suppressing the Wnt/β-catenin pathway through enhanced histone
H3K27 methylation. (A) Densitometric analysis of H3K27me2 and
H3K27me3 protein bands. Representative western blot bands of
H3K27me2 and H3K27me3 are shown. Statistical analysis was performed
using unpaired t-tests. The values are presented as the mean ± SD,
***P<0.001, ****P<0.0001. (B) Gel
electrophoresis of chromatin immunoprecipitation-PCR showing
differences in H3K27me2 and H3K27me3 enrichment at the Wnt3a,
β-catenin and RUNX2 promoter regions between the two groups. (C)
Densitometric analysis of the Wnt3a, β-catenin and RUNX2 protein
bands. P-values were calculated using one-way ANOVA followed by
Tukey's post hoc test. (D) Representative protein bands for Wnt3a,
β-catenin and RUNX2. (E) Relative mRNA expression levels of Wnt3a,
β-catenin and RUNX2 in each group after 3 days of induction. n=3,
data derived from three independent experiments. P-values were
calculated using one-way ANOVA followed by Tukey's post hoc test.
The values are presented as the mean ± SD. *P<0.05,
**P<0.01, ***P<0.001,
****P<0.0001. fx, Kdm6a conditional knockout mice;
H3K27me2, histone H3 lysine 27 dimethylation; H3K27me3, histone H3
lysine 27 trimethylation; RUNX2, Runt-related transcription factor
2; wt, wild-type. |
KDM6A deletion inhibits the
transdifferentiation of CHs within the cartilage callus and delays
fracture healing in mice
The present study subsequently investigated the
impact of KDM6A deletion on fracture healing in mice. H&E
staining (Fig. 6A) showed that
at 10 days post-fracture, both fx/wt and fx/fx mice exhibited
calluses comprising a small amount of fibrous tissue and a large
amount of cartilage tissue, with woven bone already formed in both
groups. Notably, the fx/wt group displayed a greater amount of
woven bone than the fx/fx group. By day 28 post-fracture, the bone
entered the remodeling phase; the woven bone in the fx/fx group
appeared loose and irregular, whereas the fracture ends in the
fx/wt group were smoother. In the fx/wt group, the woven bone
transformed into lamellar bone, with a relatively continuous
lamellar bone observed, suggesting a better degree of healing than
in the fx/fx group.
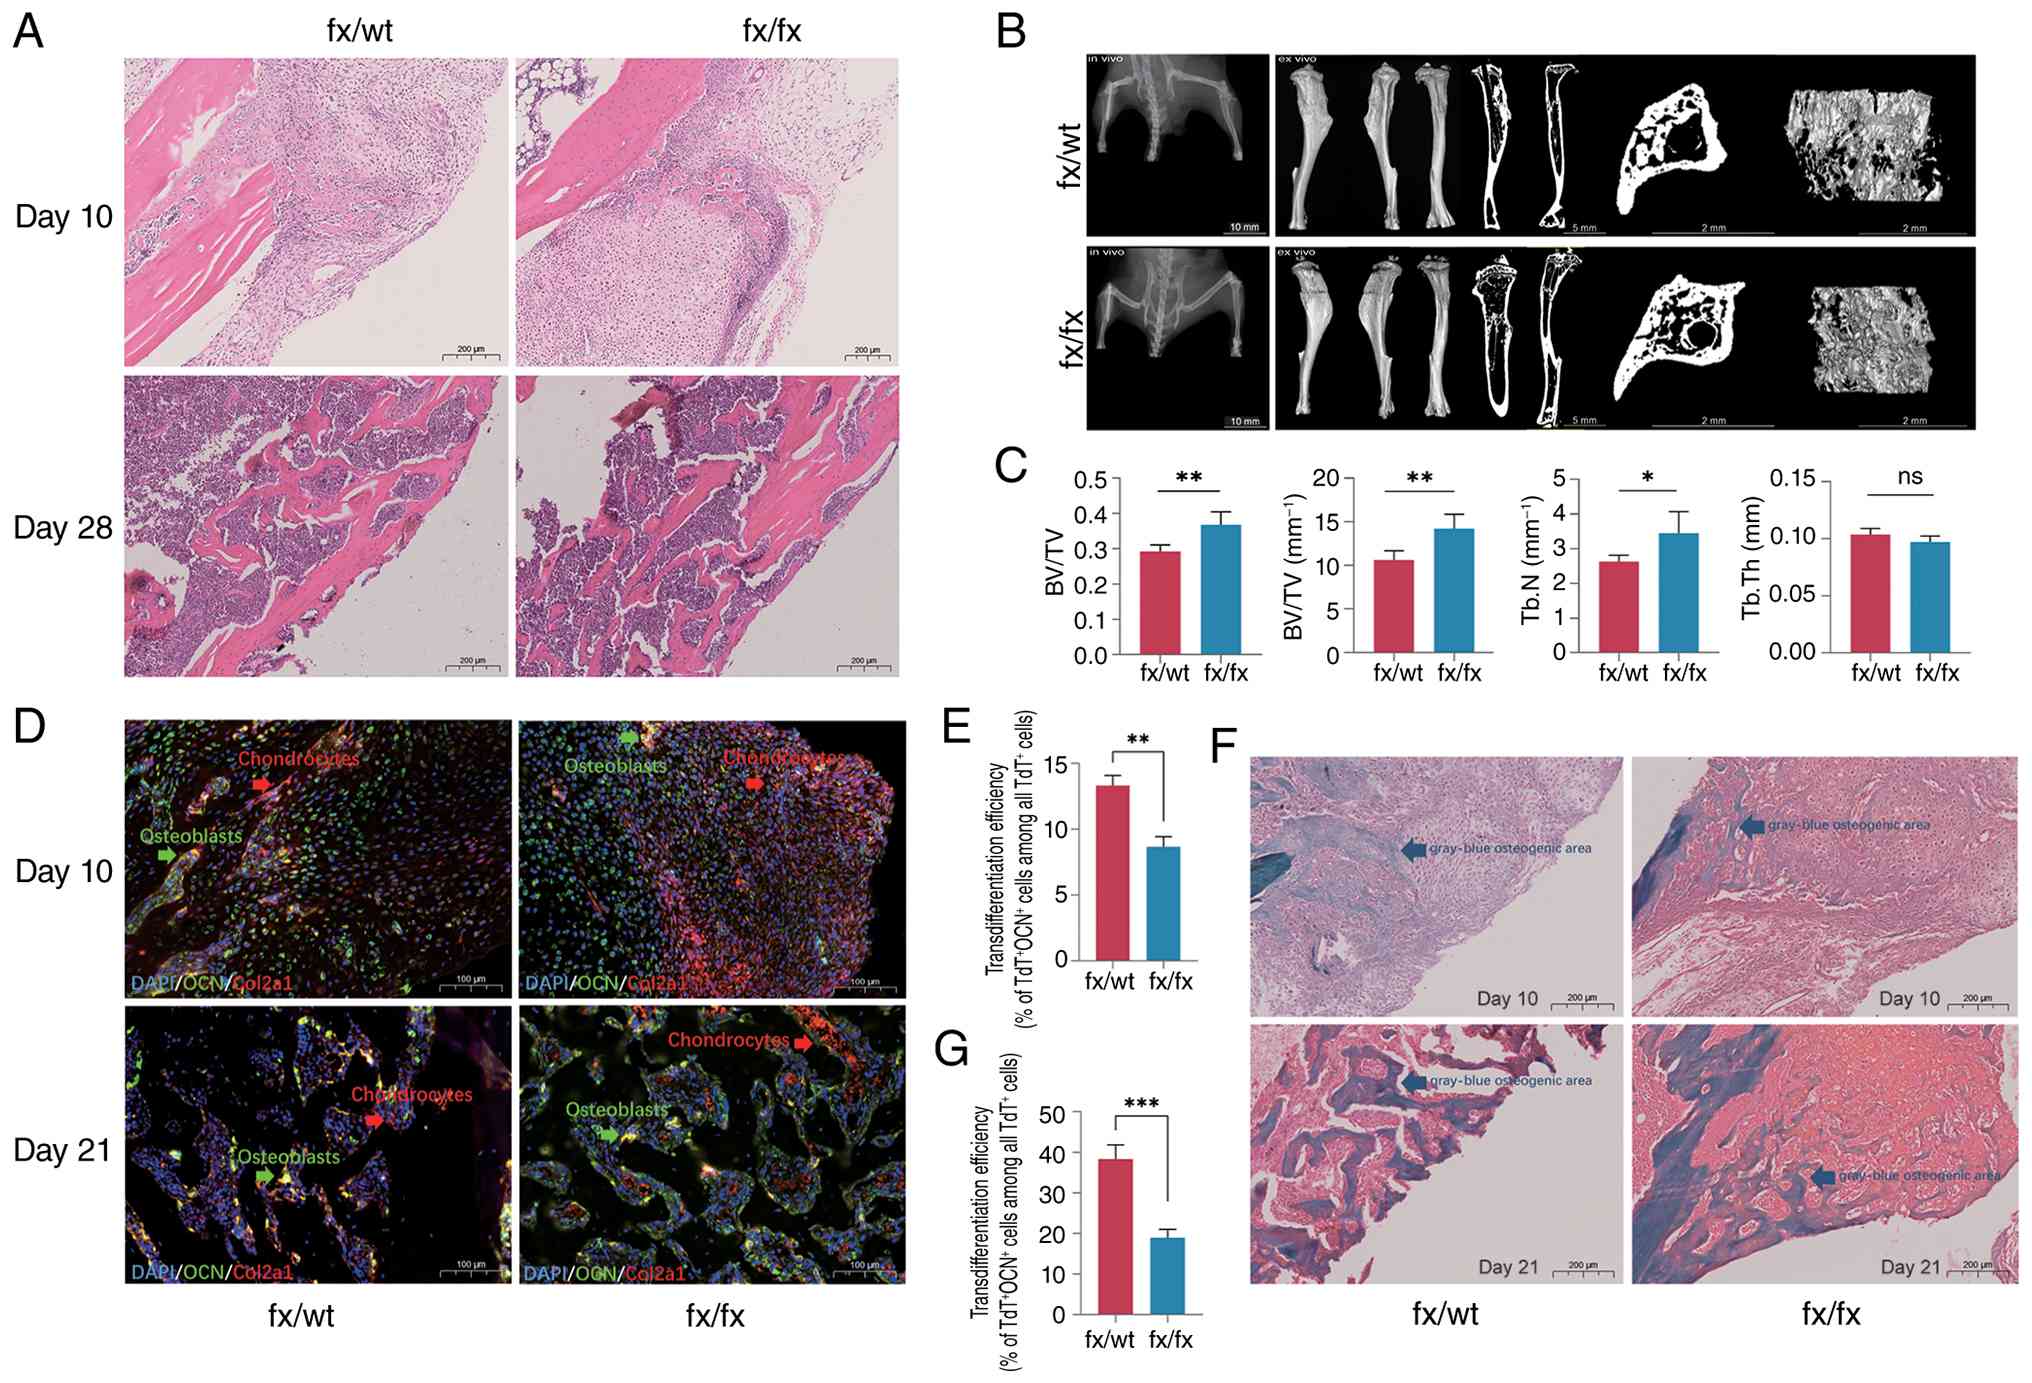 | Figure 6Lysine demethylase 6A deletion
inhibits the transdifferentiation of CHs within the cartilage
callus and delays fracture healing in mice. (A) Representative
H&E staining of the fracture callus from each group at 10 and
28 days post-surgery (scale bar, 200 µm). (B) Micro-CT scans and
three-dimensional reconstruc- tion images at 28 days post-fracture
(scale bar, 10 mm) showing lateral, medial and dorsal views,
trabecular bone within 1 mm above and below the fracture site, and
two-dimensional sagittal, coronal and transverse sections (scale
bars, 5 and 2 mm). (C) Statistical analyses of BV/TV, BS/TV, Tb.N
and Tb.Th. n=6; six samples in each group were independently
derived from 6 separate mice. Statistical analysis was performed
using unpaired t-tests. The values are presented as the mean ± SD.
*P<0.05, **P<0.01. (D) OCN was marked
with green fluorescence, CHs marked with tdTomato have inherent red
fluorescence and the overlapping part in yellow indicates
osteoblasts derived from CHs. Representative fluorescence images
showing OCN+ and Col2a1 tdTomato+ cells
(scale bar, 100 µm). (E) Quantification of transdifferentiation
rates on day 10 post-fracture. n=3, three samples in each group
were independently derived from 3 separate mice. Statistical
analysis was performed using unpaired t-tests. The values are
presented as the mean ± SD. **P<0.01. (F)
Representative Safranin O/Fast Green staining of the fracture
callus from each group at 10 and 21 days post-surgery (scale bar,
200 µm). (G) Quantification of transdifferentiation rates at day 21
post-fracture. For each timepoint, callus tissues were harvested
from three independent mice (n=3 biologically independent animals
per timepoint). Statistical analysis was performed using unpaired
t-tests. The values are presented as the mean ± SD.
***P<0.001. OCN, osteocalcin; BS/TV, trabecular bone
surface area fraction; BV/TV, trabecular bone volume fraction; CHs,
chondrocytes; Col2a1, collagen type II α1 chain; fx, Kdm6a
conditional knockout mice; ns, not significant; Tb.N, trabecular
number; Tb.Th, trabecular thickness; TdT, tdTomato; wt,
wild-type. |
At 28 days post-fracture, in vivo micro-CT
scanning and three-dimensional reconstruction (Fig. 6B) were performed to assess the
morphology of the fracture ends. In the fx/wt group, a cortical
bone bridge was formed, with no obvious peripheral callus observed,
and partial recanalization of the medullary cavity was evident. By
contrast, in the fx/fx group, a bone bridge was present, but the
peripheral callus was not completely resorbed. Ex vivo
micro-CT standard scanning and three-dimensional reconstruction
(Fig. 6B) were performed on the
harvested mouse tibiae to assess bone microarchitecture at the
fracture ends. Three-dimensional views from the lateral, medial and
dorsal aspects of the tibia, as well as two-dimensional sagittal
and coronal sections, revealed that both groups exhibited bony
union at the fracture site, with varying degrees of endosteal and
periosteal callus resorption. Calli in the remodeling phase were
observed in the outer cortex. On two-dimensional sagittal and
transverse sections, irregular block-like intramedullary calluses
were visible at the fracture ends, which were more pronounced in
the fx/fx group. Quantitative analyses were conducted for BV/TV,
BS/TV, Tb.N and Tb.Th within 1 mm of and below the fracture line
(Fig. 6C). In the fx/fx group,
both BV/TV and BS/TV were significantly higher than those in the
fx/wt group (P<0.01), whereas Tb.N was also higher in the fx/fx
group (P<0.05); no significant difference in Tb.Th was observed
(P>0.05).
Immunofluorescence staining for OCN at the fracture
callus at 10 and 21 days (Fig.
6D) was performed to assess the proportion of CH-to-osteoblast
transdifferentiation. KDM6A deletion resulted in a significant
reduction in transdifferentiation efficiency on day 10 (Fig. 6E; P<0.01) and a further
decrease by day 21 (Fig. 6G;
P<0.001). Safranin O/Fast Green staining (Fig. 6F) on day 10 post-fracture
revealed active cartilage callus formation in both groups, with
HTC-rich matrix stained bright red (proteoglycan content) and
cartilage predominating in the callus, while a few
gray-blue-stained osteogenic regions were visible. The fx/wt group
had a greater osteogenic area than the fx/fx group, and the latter
had fewer gray-blue regions than the former. At 21 days
post-fracture, the red-stained cartilage area in the fx/wt group
was decreased, indicating active ossification, and the gray-blue
osteogenic area was increased; the red cartilage alternated with
the loose gray-blue woven bone. In the fx/fx group, abundant red
cartilage regions persisted, and the gray-blue woven bone was
sparser, indicating a lower degree of ossification compared with
the fx/wt group.
Discussion
The present study provided compelling evidence for a
novel regulatory axis in fracture healing, in which the
oxygen-sensing histone demethylase KDM6A orchestrated
CH-to-osteoblast transdifferentiation through epigenetic activation
of the Wnt/β-catenin pathway. Using an integrated approach
combining scRNA-seq, genetic lineage tracing and conditional gene
knockout, the cellular dynamics and molecular mechanisms underlying
this critical bone repair process were delineated.
Single-cell transcriptomic analysis of the fracture
calli at different time points (days 10 and 21) revealed a
previously unknown complexity in CH differentiation trajectories
during endochondral ossification. A distinct population of CDOPs
that represent a transitional state between HTCs and mature
osteoblasts was identified. These CDOPs co-expressed both
chondrogenic (Col2a1) and osteogenic (Col1a1) markers, while
exhibiting elevated expression of matrix remodeling genes,
including Mmp13 and Spp1. This unique gene expression signature
suggested that CDOPs serve an active role in modifying the
extracellular environment to facilitate the transition from
cartilage to bone. Pseudotime trajectory analysis further supported
the existence of a direct differentiation pathway from CHs to
osteoblasts through this CDOP intermediate, challenging the
traditional view that HTCs primarily undergo apoptosis during
endochondral ossification (9-12).
GO enrichment analysis of genes differentially
expressed along the transdifferentiation trajectory provided
crucial insights into the biological processes regulated by KDM6A.
The significant enrichment of terms including 'skeletal system
development', 'endochondral ossification' and 'ossification'
directly links the identified gene set to bone formation processes.
Particularly noteworthy was the concurrent enrichment of 'ECM
proteoglycans' and 'PID INTEGRIN1 PATHWAY', indicating that KDM6A
promoted a transcriptional program conducive to extensive
extracellular matrix remodeling. This finding is consistent with
the recognized importance of matrix remodeling in endochondral
ossification (7), and suggests
that KDM6A-mediated epigenetic regulation coordinates both cell
fate determination and microenvironment modification. The
co-enrichment of 'response to mechanical stimulus' with integrin
signaling pathways further implies that KDM6A may help integrate
biophysical cues with biochemical signals during fracture healing,
representing a sophisticated mechanism for regulating bone repair
in response to complex environmental signals.
To investigate the regulatory role of the oxygen
microenvironment in endochondral ossification, an in vitro
CH transdifferentiation model was established, and the effect of
the oxygen environment on CH transdifferentiation was investigated
by changing the oxygen concentration in the culture. Mice with
cartilage-specific deletion of KDM6A were generated to explore the
role of KDM6A in this process. CHs cultured under normoxic
conditions exhibited greater osteogenic differentiation than those
cultured under hypoxic conditions. The enhanced expression of
osteogenesis-related marker genes (Col1a1, Spp1 and Sparc) and key
Wnt/β-catenin pathway components (Wnt3a, β-catenin and RUNX2) under
normoxic conditions promoted CH-to-osteoblast transdifferentiation.
Conversely, the loss of KDM6A abrogated this pro-osteogenic effect
of normoxia, resulting in a significant reduction in the expression
of these molecules and a consequent impairment of osteogenic
differentiation, indicating the importance of KDM6A in
oxygen-mediated chondrogenic and osteogenic transdifferentiation.
Single-cell sequencing results indicated that the influence of
KDM6A was primarily exerted during the early and middle stages of
transdifferentiation, specifically from CHs to the CDOP stage.
Furthermore, KDM6A deficiency inhibited endochondral ossification
under normoxic conditions by suppressing the Wnt/β-catenin pathway
through enhanced histone H3K27 methylation. To further determine
the epigenetic target of KDM6A in the osteogenic differentiation of
CHs, western blotting was performed to detect the levels of
H3K27me2 and H3K27me3 in cells. The levels of H3K27me2 and H3K27me3
were significantly increased in KDM6A knockout cells, indicating
that KDM6A serves a role in removing H3K27me2 and me3 during
chondrogenic transdifferentiation. ChIP-PCR showed that KDM6A
knockdown increased H3K27me2 and H3K27me3 levels in the Wnt3a
promoter region, and H3K27me3 levels in the RUNX2 promoter region.
Combined with the aforementioned experiments, we hypothesized that
oxygen might remove histone H3K27me2 and me3 methylation in the
Wnt3a promoter region and H3K27me3 methylation in the RUNX2
promoter region by activating KDM6A to relieve the transcriptional
repression of Wnt3a and RUNX2. Consistent with the present
findings, it has been widely reported that KDM6A activates the Wnt
signaling pathway through H3K27 demethylation (54,55). A previous study has shown that
KDM6A directly removes H3K27me3 modifications in the promoter
regions of OCN and RUNX2 to initiate osteogenic differentiation in
bone marrow mesenchymal stem cells (30). KDM6A activates RUNX2 and OSX by
removing H3K27me3 and promotes MSCs differentiation into
osteoblasts (31). KDM6A protein
expression is increased during differentiation of MC3T3-E1 cells
and primary osteoblasts. GSK-J1, a KDM6A inhibitor, increases
H3K27me3 levels in the RUNX2 and osterix promoter regions in
MC3T3-E1 cells. This inhibitor reduces the expression levels of
RUNX2 and Osterix, and ALP activity, indicating that KDM6A serves
an important role in osteoblast differentiation by regulating the
expression of RUNX2 and Osterix (56). These findings are similar to the
present results and confirm the important influence of KDM6A on
cell differentiation at the epigenetic level. Previous studies have
demonstrated that KDM6A is closely associated with embryonic
development and genomic stability. KDM6A contains a JmjC domain and
six tetratricopeptide repeat domains responsible for
protein-protein interactions. Its activity is highly dependent on
the oxygen concentration. However, KDM6A functions independently of
classical HIF-1α (57,58). Unlike the HIF-1α pathway, which
is mainly responsible for cell hypoxic adaptation and survival
(16,17), KDM6A mediates a 'directive'
pathway that directly determines cell fate (22). The two may act synergistically in
hypoxic calli: HIF-1α provides the necessary metabolic basis and
angiogenic conditions for regeneration, while the KDM6A-Wnt axis
directly initiates the osteogenic transformation program.
Finally, the present study demonstrated that oxygen
promoted the transdifferentiation of CHs into osteoblasts and
facilitated fracture healing in mice by activating KDM6A, which
upregulated the Wnt signaling pathway and RUNX2 expression. In
KDM6A-deficient mice, woven bone formation was markedly reduced in
the fractured callus on day 10 post-fracture. At 21 days after
fracture, there were still more bright red cartilage areas in the
callus of KDM6A-knockout mice, and the gray-blue woven bone was
sparse. By day 28, during the bone remodeling phase, the callus in
KDM6A-knockout mice retained a loose woven bone structure, and the
healing process was delayed. Micro-CT analysis further revealed
that following KDM6A deletion, irregular, bulky intramedullary
calli remained at the fracture site and healing was slowed.
Immunofluorescence staining of tibial tissue sections was performed
using an anti-OCN antibody (green) to label osteoblasts. Since CHs
were genetically labeled with tdTomato (red), cells exhibiting both
green (OCN) and red (tdTomato) fluorescence were identified as
CH-derived osteoblasts. The proportion of these double-positive
cells relative to all tdTomato+ cells was analyzed.
KDM6A knockdown resulted in reduced transdifferentiation efficiency
at both 10 and 21 days, visually demonstrating the effect of KDM6A
on callus CH differentiation.
The core finding of the present study was that KDM6A
was the key molecular switch that coordinated cell fate switching.
Deletion of KDM6A inhibited the transcription of Wnt pathway genes
by increasing H3K27me3 modification levels, thereby blocking the
transformation trajectory from CHs to CDOPs and osteoblasts.
Notably, cell communication analysis further suggested that KDM6A
activity enhanced signal communication between various subsets of
CHs. This suggested that KDM6A not only determines cell fate
through a cell-autonomous mechanism but may also regulate the
expression of cytokines to coordinate the behavior of cell
populations in the endochondral osteogenic microenvironment at a
broader scale and ensure the orderly progression of fracture
repair.
The present study has some limitations. The fracture
model was limited to a single tibial fracture in mice, and data
from studies on other species and calluses in humans are lacking.
In addition, to avoid the side effects of Tam on the reproductive
system and hormone secretion in female mice (59), only male mice were used for the
experiment. The generalizability and clinical relevance of the
present findings to different biological settings, such as
different species, sex and fracture sites, need to be further
explored. Although the present study confirmed that KDM6A activated
the Wnt/β-catenin pathway, it did not verify the broader upstream
regulatory inputs or alternative downstream effector pathways of
KDM6A beyond this axis. KDM6A may also serve a role in endochondral
osteogenesis via a non-Wnt pathway. Future studies employing
ChIP-seq could map the genome-wide binding sites of KDM6A, thereby
clarifying its specific epigenetic regulation of Wnt target genes
and potential effects on other pathways. The results of the cell
experiments showed that a normoxic environment could promote the
transdifferentiation of callus CHs into osteoblasts. Subsequent
studies could include a hyperoxia group to further explore the
effect of different oxygen concentrations on this process and
screen the appropriate therapeutic concentration to promote
transdifferentiation to provide a basis for clinical application.
Oxygen-sensitive KDM6A was shown to be a therapeutic target for
fracture healing. In the future, its spatiotemporally specific
regulatory network can be further analyzed, and the combination of
biomaterials, gene editing and precision medicine technology can
promote the efficient transformation of this mechanism into
clinical applications. Examples include local oxygen therapy at the
fracture site (biomaterial delivery of oxygen) and targeting of
KDM6A.
Novel KDM6A agonists could be developed as bone
regeneration drugs. Their therapeutic potential may be enhanced
through synergistic application with Wnt or BMP pathway modulators.
Such a combination strategy could provide individualized treatment
for patients whose stem cell osteogenic capacity is compromised by
underlying diseases, ultimately aiming to accelerate callus
maturation and shorten the fracture healing cycle. In summary, the
present study revealed that endochondral ossification during
fracture healing was a highly coordinated, multi-step process in
which CH-derived CDOPs differentiated into functional osteoblasts
to complete bone tissue reconstruction. Oxygen accelerated fracture
healing by activating KDM6A, which removed H3K27me2 and H3K27me3
methylation marks at the Wnt3a promoter and H3K27me3 at the RUNX2
promoter, thereby promoting CH differentiation into osteoblasts.
These findings not only deepen the fundamental understanding of
bone development and repair but also provide a theoretical basis
for the development of epigenetics-based bone tissue engineering
technologies and for optimizing clinical strategies for fracture
treatment. Future research will focus on developing small-molecule
compounds that specifically regulate KDM6A activity and explore
their therapeutic potential in challenging bone injuries, such as
osteoporotic fractures and nonunions.
Supplementary Data
Availability of data and materials
The sequencing data generated in the present study
may be found in the National Center for Biotechnology Information
database under BioProject accession number PRJNA1267459 or at the
following URL: https://www.ncbi.nlm.nih.gov/bioproject/PRJNA1267459.
The other data generated in the present study may be requested from
the corresponding author.
Authors' contributions
YR and HYu contributed to experiment design, data
analysis and manuscript writing. HYi provided resources and
contributed to designing and performing experiments. SL contributed
to experiment design and reviewing the bioinformatics analysis. JW
and ZS contributed to data analysis. XD, FB and TD contributed to
data analysis, review and revision of the manuscript. GW and ZH
contributed to conception and design, funding acquisition, and
supervision. GW and ZH confirm the authenticity of all raw data.
All authors have read and approved the final version of the
manuscript.
Ethics approval and consent to
participate
All animal protocols were approved by the Animal
Care and Use Committee of Wuxi Affiliated Hospital of Nanjing
University of Chinese Medicine (approval no. GZR2023032801; Wuxi,
China).
Patient consent for publication
No applicable.
Competing interests
The authors declare that they have no competing
interests.
Acknowledgements
Not applicable.
Funding
The present study was supported by the National Natural Science
Foundation of China (grant no. 82205142), the Top Talent Support
Program for Young and Middle-Aged People of the Wuxi Health
Committee (grant no. HB 2023073), and the Postgraduate Research
& Practice Innovation Program of Jiangsu Province (grant no.
KYCX22_2062).
References
|
1
|
GBD 2019 Fracture Collaborators: Global,
regional, and national burden of bone fractures in 204 countries
and territories, 1990-2019: A systematic analysis from the global
burden of disease study. Lancet Healthy Longev. 2:e580–e592. 2021.
View Article : Google Scholar
|
|
2
|
Wildemann B, Ignatius A, Leung F, Taitsman
LA, Smith RM, Pesántez R, Stoddart MJ, Richards RG and Jupiter JB:
Non-union bone fractures. Nat Rev Dis Primers. 7:572021. View Article : Google Scholar : PubMed/NCBI
|
|
3
|
Noorlander-Borgdorff MP, Şekercan A,
Young-Afat DA, Bouman M, Botman M and Giannakópoulos GF: Nationwide
study on open tibial fractures in the Netherlands: Incidence,
demographics and level of hospital care. Injury. 55:1114872024.
View Article : Google Scholar : PubMed/NCBI
|
|
4
|
Zhang S, Chen L, Zhang C, Gong C, He X,
Zhong H, Liu C, Cao Z, Chen W, Lin N, et al: Osteoking exerts
pro-osteogenic and anti-adipogenic effects in promoting bone
fracture healing via EGF/EGFR/HDAC1/Wnt/β-catenin signaling. Int J
Mol Med. 55:752025. View Article : Google Scholar
|
|
5
|
Claes L, Recknagel S and Ignatius A:
Fracture healing under healthy and inflammatory conditions. Nat Rev
Rheumatol. 8:133–143. 2012. View Article : Google Scholar : PubMed/NCBI
|
|
6
|
Mathavan N, Singh A, Marques FC, Günther
D, Kuhn GA, Wehrle E and Müller R: Spatial transcriptomics in bone
mechanomics: Exploring the mechanoregulation of fracture healing in
the era of spatial omics. Sci Adv. 11:eadp84962025. View Article : Google Scholar : PubMed/NCBI
|
|
7
|
Dennis SC, Berkland CJ, Bonewald LF and
Detamore MS: Endochondral ossification for enhancing bone
regeneration: Converging native extracellular matrix biomaterials
and developmental engineering in vivo. Tissue Eng Part B Rev.
21:247–266. 2015. View Article : Google Scholar
|
|
8
|
Amizuka N, Hasegawa T, Oda K, Luiz de
Freitas PH, Hoshi K, Li M and Ozawa H: Histology of epiphyseal
cartilage calcification and endochondral ossification. Front Biosci
(Elite Ed). 4:2085–2100. 2012. View
Article : Google Scholar
|
|
9
|
Aizawa T, Kokubun S and Tanaka Y:
Apoptosis and proliferation of growth plate chondrocytes in
rabbits. J Bone Joint Surg Br. 79:483–486. 1997. View Article : Google Scholar : PubMed/NCBI
|
|
10
|
Farnum CE and Wilsman NJ: Morphologic
stages of the terminal hypertrophic chondrocyte of growth plate
cartilage. Anat Rec. 219:221–232. 1987. View Article : Google Scholar : PubMed/NCBI
|
|
11
|
Farnum CE and Wilsman NJ: Condensation of
hypertrophic chondrocytes at the chondro-osseous junction of growth
plate cartilage in Yucatan swine: relationship to long bone growth.
Am J Anat. 186:346–358. 1989. View Article : Google Scholar : PubMed/NCBI
|
|
12
|
Gibson G: Active role of chondrocyte
apoptosis in endochondral ossification. Microsc Res Tech.
43:191–204. 1998. View Article : Google Scholar : PubMed/NCBI
|
|
13
|
Yang L, Tsang KY, Tang HC, Chan D and
Cheah KSE: Hypertrophic chondrocytes can become osteoblasts and
osteocytes in endochondral bone formation. Proc Natl Acad Sci USA.
111:12097–12102. 2014. View Article : Google Scholar : PubMed/NCBI
|
|
14
|
Giovannone D, Paul S, Schindler S, Arata
C, Farmer DT, Patel P, Smeeton J and Crump JG: Programmed
conversion of hypertrophic chondrocytes into osteoblasts and marrow
adipocytes within zebrafish bones. Elife. 8:e427362019. View Article : Google Scholar : PubMed/NCBI
|
|
15
|
Im GI and Kim TK: Overcoming current
dilemma in cartilage regeneration: Will direct conversion provide a
breakthrough? Tissue Eng Regen Med. 17:829–834. 2020. View Article : Google Scholar : PubMed/NCBI
|
|
16
|
Stegen S, Laperre K, Eelen G, Rinaldi G,
Fraisl P, Torrekens S, Van Looveren R, Loopmans S, Bultynck G,
Vinckier S, et al: HIF-1α metabolically controls collagen synthesis
and modification in chondrocytes. Nature. 565:511–515. 2019.
View Article : Google Scholar : PubMed/NCBI
|
|
17
|
Lu C, Saless N, Wang X, Sinha A, Decker S,
Kazakia G, Hou H, Williams B, Swartz HM, Hunt TK, et al: The role
of oxygen during fracture healing. Bone. 52:220–229. 2013.
View Article : Google Scholar
|
|
18
|
Johnson RW, Sowder ME and Giaccia AJ:
Hypoxia and bone metastatic disease. Curr Osteoporos Rep.
15:231–238. 2017. View Article : Google Scholar : PubMed/NCBI
|
|
19
|
An Y, Liu WJ, Xue P, Ma Y, Zhang LQ, Zhu
B, Qi M, Li LY, Zhang YJ, Wang QT and Lin Y: Autophagy promotes
MSC-mediated vascularization in cutaneous wound healing via
regulation of VEGF secretion. Cell Death Dis. 9:582018. View Article : Google Scholar : PubMed/NCBI
|
|
20
|
Schipani E, Ryan HE, Didrickson S,
Kobayashi T, Knight M and Johnson RS: Hypoxia in cartilage:
HIF-1alpha is essential for chondrocyte growth arrest and survival.
Genes Dev. 15:2865–2876. 2001. View Article : Google Scholar : PubMed/NCBI
|
|
21
|
Provot S and Schipani E: Fetal growth
plate: A developmental model of cellular adaptation to hypoxia. Ann
N Y Acad Sci. 1117:26–39. 2007. View Article : Google Scholar : PubMed/NCBI
|
|
22
|
Chakraborty AA, Laukka T, Myllykoski M,
Ringel AE, Booker MA, Tolstorukov MY, Meng YJ, Meier SR, Jennings
RB, Creech AL, et al: Histone demethylase KDM6A directly senses
oxygen to control chromatin and cell fate. Science. 363:1217–1222.
2019. View Article : Google Scholar : PubMed/NCBI
|
|
23
|
Tamagawa H, Fujii M, Togasaki K, Seino T,
Kawasaki S, Takano A, Toshimitsu K, Takahashi S, Ohta Y, Matano M,
et al: Wnt-deficient and hypoxic environment orchestrates squamous
reprogramming of human pancreatic ductal adenocarcinoma. Nat Cell
Biol. 26:1759–1772. 2024. View Article : Google Scholar : PubMed/NCBI
|
|
24
|
Kong N, Zhang R, Wu G, Sui X, Wang J, Kim
NY, Blake S, De D, Xie T, Cao Y and Tao W: Intravesical delivery of
KDM6A-mRNA via mucoadhesive nanoparticles inhibits the metastasis
of bladder cancer. Proc Natl Acad Sci USA. 119:e21126961192022.
View Article : Google Scholar : PubMed/NCBI
|
|
25
|
Wang JJ, Wang X, Xian YE, Chen ZQ, Sun YP,
Fu YW, Wu ZK, Li PX, Zhou ES and Yang ZT: The JMJD3 histone
demethylase inhibitor GSK-J1 ameliorates lipopolysaccharide-induced
inflammation in a mastitis model. J Biol Chem. 298:1020172022.
View Article : Google Scholar : PubMed/NCBI
|
|
26
|
Gao M, Li Y, Cao P, Liu H, Chen J and Kang
S: Exploring the therapeutic potential of targeting polycomb
repressive complex 2 in lung cancer. Front Oncol. 13:12162892023.
View Article : Google Scholar : PubMed/NCBI
|
|
27
|
De Santa F, Totaro MG, Prosperini E,
Notarbartolo S, Testa G and Natoli G: The histone H3 lysine-27
demethylase Jmjd3 links inflammation to inhibition of
polycomb-mediated gene silencing. Cell. 130:1083–1094. 2007.
View Article : Google Scholar : PubMed/NCBI
|
|
28
|
Lee S, Lee JW and Lee SK: UTX, a histone
H3-lysine 27 demethylase, acts as a critical switch to activate the
cardiac developmental program. Dev Cell. 22:25–37. 2012. View Article : Google Scholar
|
|
29
|
Thieme S, Gyárfás T, Richter C, Özhan G,
Fu J, Alexopoulou D, Muders MH, Michalk I, Jakob C, Dahl A, et al:
The histone demethylase UTX regulates stem cell migration and
hematopoiesis. Blood. 121:2462–2473. 2013. View Article : Google Scholar : PubMed/NCBI
|
|
30
|
Hemming S, Cakouros D, Isenmann S, Cooper
L, Menicanin D, Zannettino A and Gronthos S: EZH2 and KDM6A act as
an epigenetic switch to regulate mesenchymal stem cell lineage
specification. Stem Cells. 32:802–815. 2014. View Article : Google Scholar
|
|
31
|
Pribadi C, Cakouros D, Camp E, Anderson P
and Gronthos S: KDM6A-mediated regulation of cranial frontal bone
suture fusion in mice is sex dependent. Stem Cells Dev. 32:398–409.
2023. View Article : Google Scholar : PubMed/NCBI
|
|
32
|
Wise JK, Sena K, Vranizan K, Pollock JF,
Healy KE, Hughes WF, Sumner DR and Virdi AS: Temporal gene
expression profiling during rat femoral marrow ablation-induced
intramembranous bone regeneration. PLoS One. 5:e129872010.
View Article : Google Scholar : PubMed/NCBI
|
|
33
|
Teng JW, Ji PF and Zhao ZG: MiR-214-3p
inhibits β-catenin signaling pathway leading to delayed fracture
healing. Eur Rev Med Pharmacol Sci. 22:17–24. 2018.PubMed/NCBI
|
|
34
|
Zhou J, Liu HX, Li SH, Gong YS, Zhou MW,
Zhang JH and Zhu GY: Effects of human umbilical cord mesenchymal
stem cells-derived exosomes on fracture healing in rats through the
Wnt signaling pathway. Eur Rev Med Pharmacol Sci. 23:4954–4960.
2019.PubMed/NCBI
|
|
35
|
Yao CJ, Lv Y, Zhang CJ, Jin JX, Xu LH,
Jiang J, Geng B, Li H, Xia YY and Wu M: MicroRNA-185 inhibits the
growth and proliferation of osteoblasts in fracture healing by
targeting PTH gene through down-regulating Wnt/β-catenin axis: In
an animal experiment. Biochem Biophys Res Commun. 501:55–63. 2018.
View Article : Google Scholar : PubMed/NCBI
|
|
36
|
Zhou H, Zhang L, Chen Y, Zhu CH, Chen FM
and Li A: Research progress on the hedgehog signalling pathway in
regulating bone formation and homeostasis. Cell Prolif.
55:e131622022. View Article : Google Scholar :
|
|
37
|
Minear S, Leucht P, Jiang J, Liu B, Zeng
A, Fuerer C, Nusse R and Helms JA: Wnt proteins promote bone
regeneration. Sci Transl Med. 2:29ra302010. View Article : Google Scholar : PubMed/NCBI
|
|
38
|
Suen PK, He YX, Chow DHK, Huang L, Li C,
Ke HZ, Ominsky MS and Qin L: Sclerostin monoclonal antibody
enhanced bone fracture healing in an open osteotomy model in rats.
J Orthop Res. 32:997–1005. 2014. View Article : Google Scholar : PubMed/NCBI
|
|
39
|
Florio M, Gunasekaran K, Stolina M, Li X,
Liu L, Tipton B, Salimi-Moosavi H, Asuncion FJ, Li C, Sun B, et al:
A bispecific antibody targeting sclerostin and DKK-1 promotes bone
mass accrual and fracture repair. Nat Commun. 7:115052016.
View Article : Google Scholar : PubMed/NCBI
|
|
40
|
Jin H, Wang B, Li J, Xie W, Mao Q, Li S,
Dong F, Sun Y, Ke HZ, Babij P, et al: Anti-DKK1 antibody promotes
bone fracture healing through activation of β-catenin signaling.
Bone. 71:63–75. 2015. View Article : Google Scholar :
|
|
41
|
Houben A, Kostanova-Poliakova D,
Weissenböck M, Graf J, Teufel S, von der Mark K and Hartmann C:
β-catenin activity in late hypertrophic chondrocytes locally
orchestrates osteoblastogenesis and osteoclastogenesis.
Development. 143:3826–3838. 2016. View Article : Google Scholar : PubMed/NCBI
|
|
42
|
Meng Y, Zhang T, Zheng R, Ding S, Yang J,
Liu R, Jiang Y and Jiang W: Depletion of demethylase KDM6 enhances
early neuroectoderm commitment of human PSCs. Front Cell Dev Biol.
9:7024622021. View Article : Google Scholar : PubMed/NCBI
|
|
43
|
Kikuchi K, Haneda M, Hayashi S, Maeda T,
Nakano N, Kuroda Y, Tsubosaka M, Kamenaga T, Fujita M, Ikuta K, et
al: P21 deficiency exhibits delayed endochondral ossification
during fracture healing. Bone. 165:1165722022. View Article : Google Scholar : PubMed/NCBI
|
|
44
|
Catheline SE, Hoak D, Chang M, Ketz JP,
Hilton MJ, Zuscik MJ and Jonason JH: Chondrocyte-specific RUNX2
overexpression accelerates post-traumatic osteoarthritis
progression in adult mice. J Bone Miner Res. 34:1676–1689. 2019.
View Article : Google Scholar : PubMed/NCBI
|
|
45
|
Gao H, Huang J, Wei Q and He C: Advances
in animal models for studying bone fracture healing. Bioengineering
(Basel). 10:2012023. View Article : Google Scholar : PubMed/NCBI
|
|
46
|
Ramírez-Salazar EG, Almeraya EV,
López-Perez TV, Patiño N, Salmeron J and Velázquez-Cruz R:
MicroRNA-548-3p overexpression inhibits proliferation, migration
and invasion in osteoblast-like cells by targeting STAT1 and MAFB.
J Biochem. 168:203–211. 2020. View Article : Google Scholar : PubMed/NCBI
|
|
47
|
Cheng Z, Li A, Tu CL, Maria CS, Szeto N,
Herberger A, Chen TH, Song F, Wang J, Liu X, et al: Calcium-sensing
receptors in chondrocytes and osteoblasts are required for callus
maturation and fracture healing in mice. J Bone Miner Res.
35:143–154. 2020. View Article : Google Scholar :
|
|
48
|
Livak KJ and Schmittgen TD: Analysis of
relative gene expression data using real-time quantitative PCR and
the 2(-Delta Delta C(T)) method. Methods. 25:402–408. 2001.
View Article : Google Scholar
|
|
49
|
Peyrin F, Dong P, Pacureanu A and Langer
M: Micro-and nano-CT for the study of bone ultrastructure. Curr
Osteoporos Rep. 12:465–474. 2014. View Article : Google Scholar : PubMed/NCBI
|
|
50
|
Wang C, Brisson BK, Terajima M, Li Q,
Hoxha K, Han B, Goldberg AM, Sherry Liu X, Marcolongo MS,
Enomoto-Iwamoto M, et al: Type III collagen is a key regulator of
the collagen fibrillar structure and biomechanics of articular
cartilage and meniscus. Matrix Biol. 85-86:47–67. 2020. View Article : Google Scholar
|
|
51
|
Chen M, Zhu X, Zhang L and Zhao D: COL5A2
is a prognostic-related biomarker and correlated with immune
infiltrates in gastric cancer based on transcriptomics and
single-cell RNA sequencing. BMC Med Genomics. 16:2202023.
View Article : Google Scholar : PubMed/NCBI
|
|
52
|
Wang L, Chen S, Zhang H, Wei G, Ma F,
Zhang M, Zhang B, Yang S, Cheng H, Yang R, et al: Serine protease
inhibitor E2 protects against cartilage tissue destruction and
inflammation in osteoarthritis by targeting NF-κB signalling.
Rheumatology (Oxford). 63:3172–3183. 2024. View Article : Google Scholar : PubMed/NCBI
|
|
53
|
Chen YH, Xu NZ, Hong C, Li WQ, Zhang YQ,
Yu XY, Huang YL and Zhou JY: Myo1b promotes tumor progression and
angiogenesis by inhibiting autophagic degradation of HIF-1α in
colorectal cancer. Cell Death Dis. 13:9392022. View Article : Google Scholar
|
|
54
|
Shi B, Li W, Song Y, Wang Z, Ju R, Ulman
A, Hu J, Palomba F, Zhao Y, Le JP, et al: UTX condensation
underlies its tumour-suppressive activity. Nature. 597:726–731.
2021. View Article : Google Scholar : PubMed/NCBI
|
|
55
|
Wen Y, Chen X, Feng H, Wang X, Kang X,
Zhao P, Zhao C and Wei Y: Kdm6a deficiency in microglia/macrophages
epigenetically silences Lcn2 expression and reduces photoreceptor
dysfunction in diabetic retinopathy. Metabolism. 136:1552932022.
View Article : Google Scholar : PubMed/NCBI
|
|
56
|
Yang D, Okamura H, Teramachi J and Haneji
T: Histone demethylase Utx regulates differentiation and
mineralization in osteoblasts. J Cell Biochem. 116:2628–2636. 2015.
View Article : Google Scholar : PubMed/NCBI
|
|
57
|
Duplaquet L, Li Y, Booker MA, Xie Y, Olsen
SN, Patel RA, Hong D, Hatton C, Denize T, Walton E, et al: KDM6A
epigenetically regulates subtype plasticity in small cell lung
cancer. Nat Cell Biol. 25:1346–1358. 2023. View Article : Google Scholar : PubMed/NCBI
|
|
58
|
Yang Y, Chen C, Zuo Q, Lu H, Salman S, Lyu
Y, Huang TYT, Wicks EE, Jackson W III, Datan E, et al: NARF is a
hypoxia-induced coactivator for OCT4-mediated breast cancer stem
cell specification. Sci Adv. 8:eabo50002022. View Article : Google Scholar : PubMed/NCBI
|
|
59
|
Li H, Liu Y, Wang Y, Zhao X and Qi X:
Hormone therapy for ovarian cancer: Emphasis on mechanisms and
applications (Review). Oncol Rep. 46:2232021. View Article : Google Scholar : PubMed/NCBI
|


