Introduction
Biliary tract cancers (BTC) comprise tumors of the
extra- and intrahepatic bile ducts and the gallbladder cancer
(1). The prognosis is poor as the
only curative treatment, resection, is feasible in about 50% of
patients only due to advanced stage and co-morbidities precluding
surgery (2). Additionally, the
5-year survival rate is 13–44% only, even with optimal conditions
of tumor cell-free margins and absence of lymph node dissemination
(3). For non-resectable BTC,
palliation using chemo- radio-chemotherapy or photodynamic tumor
ablation could achieve median survival times of up to 18–28 months
(4–6). As yet these therapies cannot stop BTC
tumor cell proliferation in the long-term. Therefore, the
identification of molecular mechanisms of tumor growth, of
tumorigenic sub-populations of cells and of predictors of
therapeutic response is needed to develop better strategies for
treatment of BTC (7,8).
In this context, it was recently proposed that
cancer cells achieve a malignant phenotype by re-activating early
embryonic differentiation programs that physiologically regulate
invasion, migration, angiogenesis and differentiation, thus
adopting characteristics of normal stem cells (9–11).
Particularly the re-expression of embryonic transcriptions factors
like c-Myc, Sox-2, Oct3/4, KLF4 or Nanog is now considered as a
mediator of oncogenesis in solid tumors (11,12).
The identification of cell surface markers expressed
on tumor initiating cell populations (e.g. CD24, CD44) (13–15)
has led to the description of so called stem cell-like signatures
in various human cancers, including hepatocellular carcinoma
[CD44+, CD90+, CD133+, ALDH
(aldehyde dehydrogenase)], neuroblastomas (Oct3+,
Sox-2+, Nanog+, KLF4+) and other
disease entities (15). Although
these markers are neither specific for a certain cancer histology
nor for all stem cells per se, these profiles are
independently associated with a poorer outcome in patients with
e.g. colorectal cancer (16) and,
in part, also in BTC (17). Yet, a
detailed analysis of stem cell markers in BTC is still missing and
only recently cells with stem cell-like properties (such as
CD24+, CD44+, EpCAM+) were
isolated from extrahepatic BTC (18). In line with these results, an
aggressive phenotype was observed in BTC cells subsequent to
overexpression of the stem cell-like genes c-MYC, Sox-2, OCT3/4,
and KLF4 (19).
In this study, we investigated the expression of
markers of putative stem- or progenitor cells in several human
biliary tract cancer cell lines in vitro, in a nude mouse
xenograft model in vivo and in a human TMA and correlated
these expression patterns with cell proliferation and histological
differentiation as well as clinicopathological characteristics.
Materials and methods
Cell culture and human BTC model
Bile duct carcinoma cell lines CCLP-1, Egi-1,
SkChA-1, TFK-1 and gallbladder cancer cell lines MzChA-1, MzChA-2,
GBC were cultured as described previously (20) using Dulbecco’s modified Eagle’s
medium (DMEM) supplemented with 10% (v/v) fetal bovine serum (FBS;
PAA Laboratories, Pasching, Austria) at 37°C and 5% CO2.
Cell lines and human tissue samples are collectively referred to as
biliary tract cancer (1) in the
following [see (20) for original
tumor grading].
Quantitative real-time RT-PCR
For quantification of mRNA levels, cells cultured in
10 cm diameter Petri dishes were lysed using TRIzol reagent
(Invitrogen, Lofer, Austria) and total RNA was isolated according
to the manufacturer’s instructions. Total RNA was subjected to
DNase treatment, reverse transcription and the cDNA was analyzed
using quantitative real-time reverse transcription PCR (qRT-PCR) as
described previously (20) using a
Rotorgene 6000 real-time PCR thermocycler (Qiagen, Hilden, Germany)
- see Table IA for primer
sequences. The relative expression of each transcript (X) was
calculated using the formula 2−ΔCt (21,20),
in which
ΔCt=Ct(x)−Ct(housekeeping
gene) with β-actin as the housekeeping gene (22).
 | Table IPrimer sequences for qRT-PCR and
antibodies for IHC. |
Table I
Primer sequences for qRT-PCR and
antibodies for IHC.
| A, Primer sequences
for real-time RT-PCR. |
|
| Transcript | Primer (forward /
reverse) | Amplicon [bp] |
|
| β-Actin |
ATCTTCACGGTGCTGGGCATTG /
TCCTGTGTCCTGGCGGTTGACT | 206 |
| Bmi-1 |
GCTAAATCCCCACCTGATGTGTGTG /
TGGTCTGGTCTTGTGAACTTGGACAT | 163 |
| CD133 |
GAACTCTCTTGAATGAAACTCCAGAGCA /
GGTCTCCTTGATCGCTGTTGCC | 194 |
| CD44 |
CCCAAATTCCAGAATGGCTGATC /
GACGACTCCTTGTTCACCAAATGC | 220 |
| Nanog |
GCCGAAGAATAGCAATGGTGTGAC /
GACTGGATGTTCTGGGTCTGGTTG | 171 |
| Nestin |
GGCAGCGTTGGAACAGAGGTT /
GGCTGAGGGACATCTTGAGGTG | 170 |
| Sox-2 |
GCACAACTCGGAGATCAGCAAGC /
GGCAGCGTGTACTTATCCTTCTTCATG | 186 |
|
| B, Antibodies and
conditions used for IHC. |
|
| Antibody | Cat.-No. | Species |
Dilution/incubation |
Pretreatmentc |
|
| Bmi-1 | ab14389a | Mouse | 1:100 / ½ h | Pascal / pH
6.0 |
| CD133 | ab19898a | Rabbit | 1:200 / ½ h | WB / pH 9.0 |
| CD44 | NCL-CD44-2b | Mouse | 1:100 / ½ h | WB / pH 9.0 |
| Nanog | ab21603a | Rabbit | 1:100 / ½ h | Pascal / pH
6.0 |
| Nestin | ab22035a | Mouse | 1:200 / ½ h | WB / pH 9.0 |
| Sox2 | ab97959a | Rabbit | 1:1,000 / ½ h | WB / pH 9.0 |
Xenograft model
Cell lines were harvested, resuspended in sterile
physiologic NaCl solution and injected into the flank of 4 to
6-week old NMRI mice (each 3x10⁶ cells per mouse/5 mice
per cell line; Harlan Winkelmann GmbH, Borchen, Germany) (20,23,24).
Animals were kept in a light- and temperature-controlled
environment and provided with food and water ad libitum.
Animals were sacrificed at mean day 45 (range 39–46) by cervical
dislocation and tumor samples were fixed in 10% phosphate-buffered
formalin. Ethical approval was granted before any animal experiment
by the Regional Government of Lower Franconia, Würzburg, Germany
(no. 54–2531.31–9/06).
Tissue preparation and
immunochistochemistry
All specimens were fixed in 4% buffered formalin,
routinely processed and embedded in paraffin wax.
Immunohistochemistry was done using routine diagnostic methods as
published recently (25). In
short, immunohistochemical stainings were carried out using an
autostainer system (Dako, Vienna, Austria) according to the
manufacturer’s recommendations. Antigen retrieval was performed by
heat induced epitope retrieval in pH 9.0 antigen retrieval buffer
(Dako) at 95°C for 40 min. Table
IB lists the used antibodies, pretreatment conditions and
dilutions. Tonsils and lymph nodes served as positive controls;
control experiments were negative using PBS replacement of primary
or secondary antibodies and same processing as described above (not
shown).
Interpretation of
immunohistochemistry
The stained slides were digitalized using the
ImageAccess 9 Enterprise software (Imagic Bildverarbeitung,
Glattbrugg, Switzerland). Images were evaluated using the particle
analysis module with optimized binarization method and assessed by
two independent investigators (R.K. and D.N.).
Patient characteristics and tissue
microarray
Only patients who underwent surgical resection
between 1997 and 2010 with complete histopathological records at
the Institute of Pathology (Salzburg) were included in the
investigations. None of these patients received neoadjuvant
therapies. Follow-up data were received from the clinical database
and the tumor registry of the Paracelsus Medical
University/Salzburger Landeskliniken. Overall, 34 paraffin-embedded
tissue samples with primary BTC were included (mean age of
65.90±12.6 years, sex: 12 male/22 female) with complete
comprehensive clinical information which were subsequently used as
covariables (for detail see Table
II). All cases were re-classified according the 7th TNM
classification of 2010 (26). In
contrast to published data (27),
cases with intrahepatic BTC (58.8%, n=20) were more frequent in our
sample pool. In short, intrahepatic BTC showed preferential mass
forming growth pattern and were larger than perihilar BTC, whereas
perihilar BTC had a more advanced disease stage according TNM
(details see Table II).
| Table IIClinical characteristics of human BCT
cases (TMA). |
Table II
Clinical characteristics of human BCT
cases (TMA).
| Overall | Intrahepatic | Perihilar | Extrahepatic |
|---|
| n (%) | 34 | 20 (58.8) | 11 (32.4) | 3 (8.8) |
| Female | 12 (35.2) | 7 (35) | 4 (39.4) | 1 (33.3) |
| Male | 22 (64.8) | 13 (65) | 7 (63.6) | 2 (67.7) |
| Age (mean ±
SD) | 65.9 ± 12.6 | 64.7 ± 13.9 | 68.2 ± 10.7 | 66.8 ± 13.6 |
| Female | 65.5 ± 13.2 | 65.1 ± 13.1 | 64.9 ± 16.8 | 70.3f |
| Male | 66.1 ± 12.5 | 64.4 ± 14.9 | 70.1 ± 6.1 | 62.6 ± 15.4 |
| Growth
patternc, m/p/i | 18 / 16 / 0 | 16 / 4 / 0b | 1 / 10 / 0b | 1 / 2 / 0 |
| G: I / II /
III | 2 / 17 / 15 | 2 / 7 / 11 | 0 / 8 / 3 | 0 / 2 / 1 |
| Size (cm, mean ±
SD) | 3.7 ± 3.6 | 5.1 ± 4.0b | 1.3 ± 0.7b | 3.1 ± 1.6 |
| T stagingd | | p<0.01 | p<0.01 | |
| 1 | 13 | 13 | 0 | 0 |
| 2 | 2 | 0 | 0 | 2 |
| 2a | 11 | 6 | 5 | 0 |
| 2b | 5 | 0 | 5 | 0 |
| 3 | 2 | 1 | 0 | 1 |
| 4 | 1 | 0 | 1 | 0 |
| N stagingd, 0 / 1 | 21 / 13 | 15 /
5a1 | 3 /
8a1,a2 | 3 /
0a2 |
| M stagingd, 0 / 1 | 26 / 8 | 16 / 4 | 8 / 3 | 2 / 1 |
| Rd: 0 / 1 | 22 / 12 | 14 / 6 | 6 / 5 | 2 / 1 |
| Mean survival
[CI] | 11.6
[4.5–18.7] | 10.8
[0.07–21.6] | 14.6
[4.9–24.3] | 7.3 [0–19.8] |
| Median survival
[CI] (months) | 2.1 [0–8.3] | 2.0 [0–4.3] | 12.8 [0– 34.4] | 0.9 [g] |
| Therapye, LR/BT/WR | 24 / 24 / 4 | 20 / 10 /
0a1,a2 | 4 / 11 /
2a1 | 0 / 3 /
2a2 |
Tissue microarrays were prepared from
paraffin-embedded tissue blocks. First, we designed a grid using
commercial drawing software Microsoft Office 2007 Visio consisting
of 2 mm black circles leaving 2 mm space between them and printed
the grid on plain paper. The grid was fixed to stainless steel
moulds and dried cores of paraffin-embedded BTC tissue blocks
obtained using a 2 mm Harris Uni-Core punch (Ted Pella Inc.,
Redding, CA, USA) were aligned to the grid. Once all cores were
attached to the mould, melted paraffin was gently poured into the
mould and the TMA was handled according to routine
histopathological procedures from this point on. Additionally, to
exclude heterogeneous distribution pattern of the investigated stem
cell markers, immunohistochemical staining was performed on tumor
center and tumor border areas corresponding to conventional H&E
stained slides.
Ethics
All analyses on human BTC samples were carried out
according to the guidelines of the Paracelsus Medical University
Salzburg/Salzburger Landeskliniken and were approved by the local
ethics committee (415-EP/73/37-2011).
Statistical analysis
Statistical analysis was performed with SPSS 18.0
(SPSS Inc., Chicago, IL, USA). Kendall’s rank two-tailed test and
Spearman rank correlation test was used for the correlation
analysis. The χ2 test, Mann-Whitney U test or Student’s
t-test was used to compare data of nominal, ordinal or interval
level, respectively. Univariate ANOVA (analysis of variance) was
used to test for differences between groups of tissue samples
[using least significant difference (LSD) test post hoc test to
adjust for multiple comparisons]. For survival analysis, cases with
missing date of death were excluded. Univariate survival analysis
was performed using the Kaplan-Meier method comparing the survival
curves with the log-rank test. For multivariate survival analysis,
the Cox proportional hazards model was used. Differences were
considered significant at p<0.05.
Results
Expression pattern of stem cell markers
identify distinct groups of cell lines
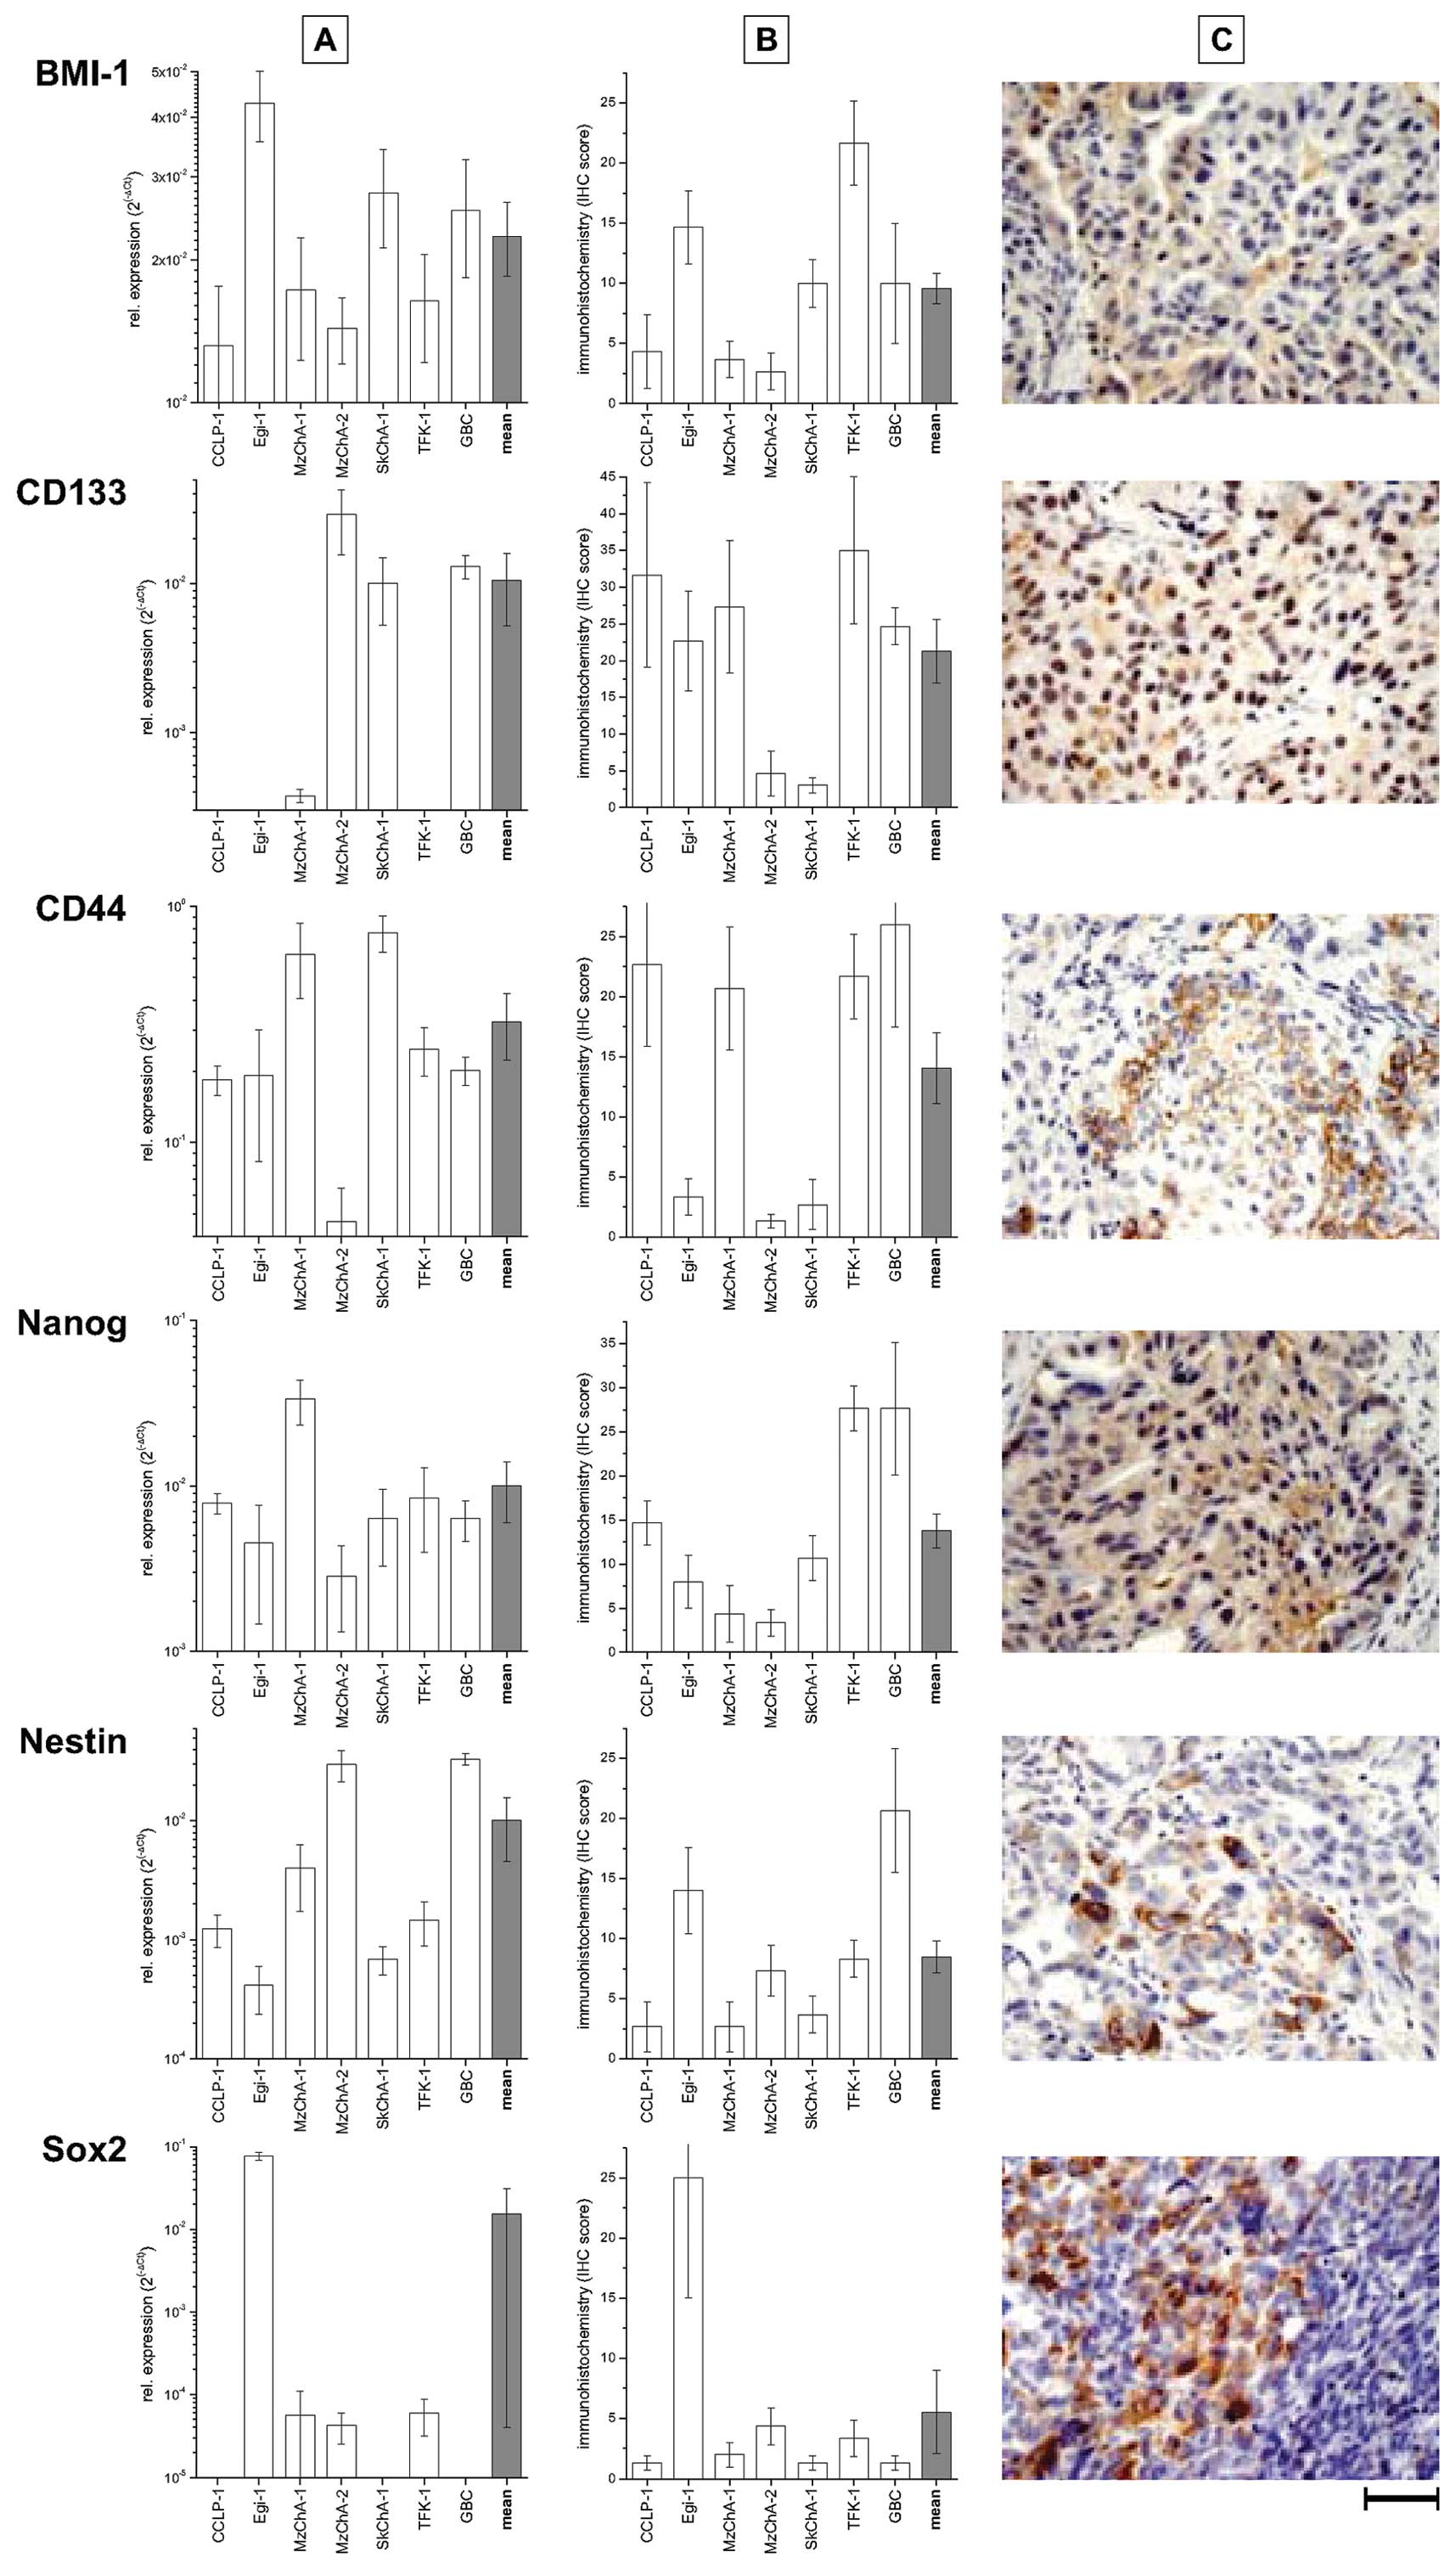
The mRNA of all stem cell markers could be detected
at low levels throughout all tested human BTC cell lines in
vitro, with highest level for CD44 compared to lower levels in
all other BTC cell lines, Fig. 1A.
The levels of mRNA in vitro mostly correspond to the protein
expression levels in vivo (compare Fig. 1A and B). Generally, the expression
data on mRNA and protein levels revealed a heterogeneous pattern
with cell lines expressing rather low levels of e.g. CD133 and CD44
(Egi-1, MzCha-2, SkChA-1) compared to the others.
Based on the observed protein expression
heterogeneity, hierarchical cluster analysis was used to test
whether these patterns could identify distinct subgroups of cells
lines. As shown in Fig. 2A,
protein expression of CD133 and CD44 classified the cell lines into
two groups of which the first group (GBC, MzChA-1, TFK-1 and
SkChA-1) is characterized by a
CD133+/CD44+/Nanog+/Sox-2−
expression pattern. The second group (MzChA-2, Egi-1 and CCLP-1)
displayed an inverse expression pattern (Fig. 2B). Further comparison between these
groups indicated that the first cluster
(CD133+/CD44+/Nanog+/Sox-2−)
shows decreased proliferation markers (Ki67, cyclin D1) and a
higher level of differentiation markers (Ck7, Ck8/18,
E-cadherin).
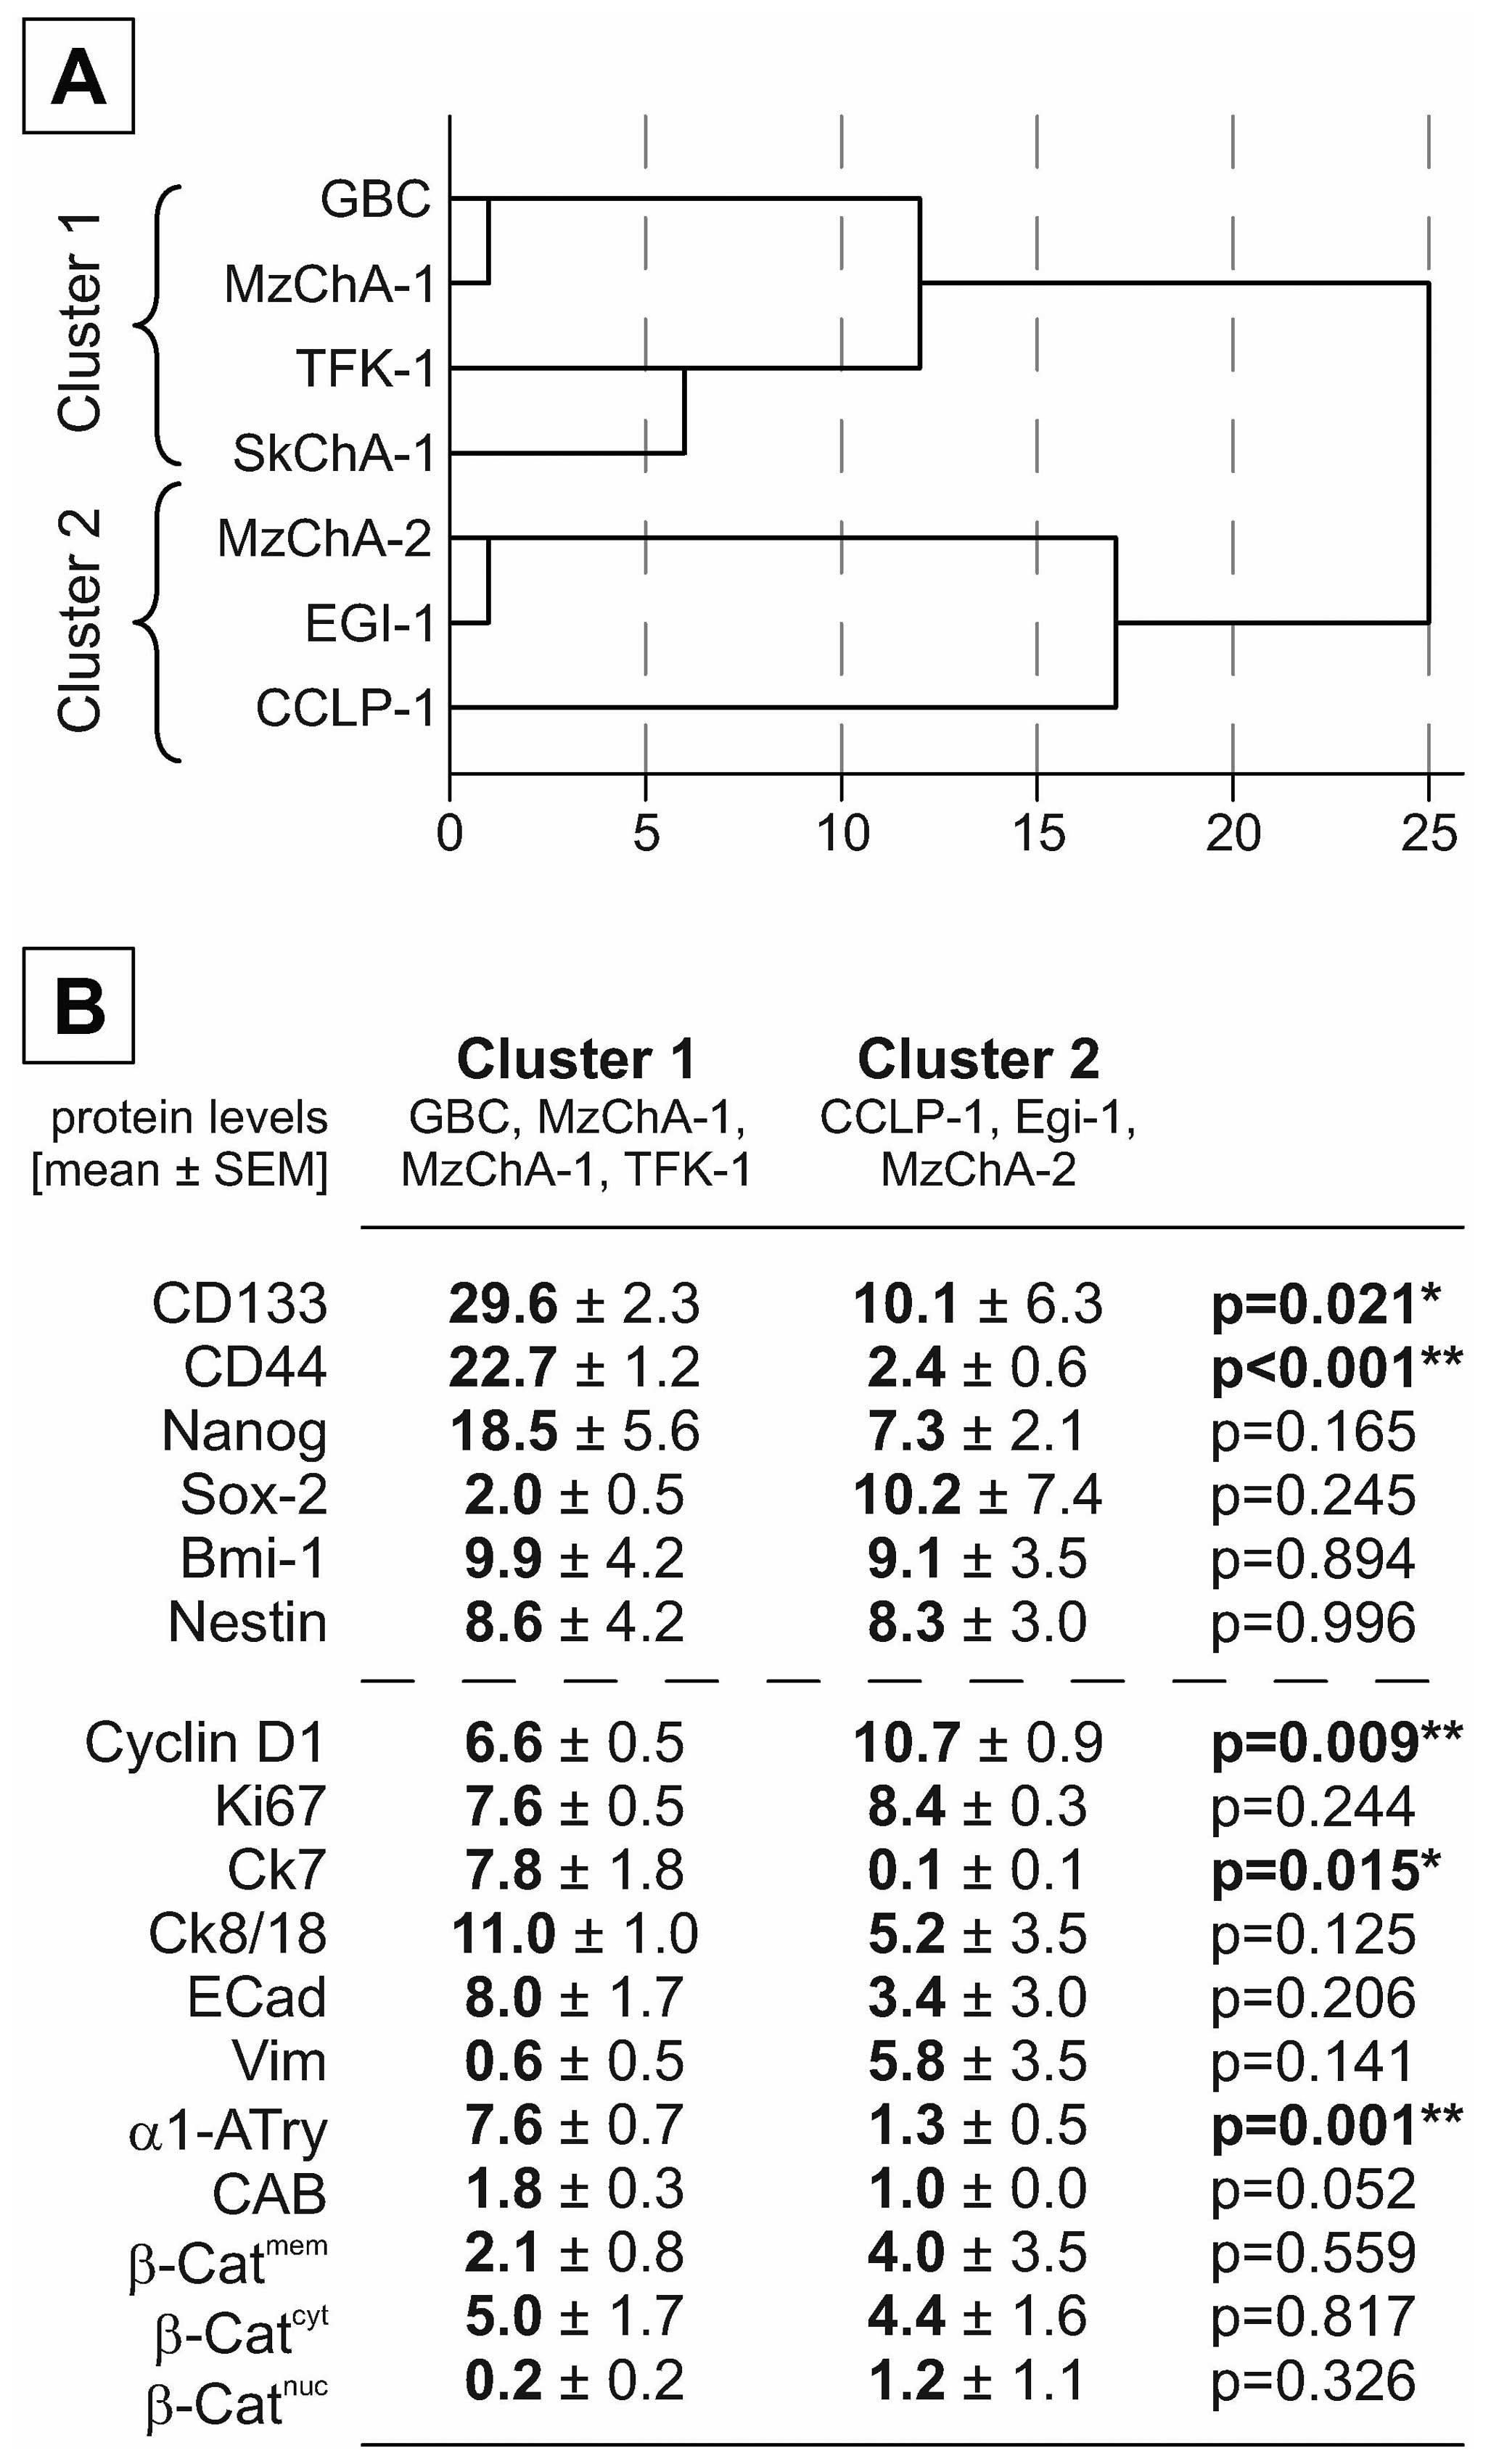 | Figure 2Cluster analysis of BTC xenografts
based on stem cell markers. (A) Cell lines were clustered using
hierarchical cluster analysis based on the IHC protein expression
levels of the stem cell markers CD133, CD44, Nestin, Nanog, Sox-2,
and Bmi-1. (B) Mean values of stem cell and proliferation or
differentiation markers are given as mean ± SEM. Significant and
highly significant differences are marked with
*p<0.05 or **p<0.01, respectively
(independent t-test). β-Cat, β-catenin; CAB, chromotropeaniline
blue; cyt, cytoplasmatic; ECad, E-cadherin; mem, membranous; nuc,
nuclear; Vim, vimentin. |
Correlation analysis of stem cell marker
expression and differentiation in vitro and in vivo
In the next step, we compared the expression of stem
cell markers with those of differentiation in these human BTC cell
lines which were comprehensively analyzed for immunochemical and
histological characteristics in a previous study (20). As shown in Fig. 3, correlation analysis revealed
significant association with morphological and molecular markers of
proliferation and differentiation as follows: overall, similar
correlations are found based on mRNA data (in vitro;
Fig. 3A) and protein data sets for
these cell lines (in vivo/xenografts; Fig. 3B). As expected from cluster
analysis (Fig. 2), the expression
of the differentiation markers Ck7 and Ck19 is significantly
associated with CD133 and CD44 expression (Fig. 3A and B, respectively). In xenograft
tumors, expression of proliferation markers (cyclin D1 and Ki67)
are preferentially low in cell lines with high expression of CD44.
Interestingly, the expression level of Sox-2 is positively
associated with vimentin and nuclear β-catenin expression, while
negatively correlated with the differentiation markers Ck8/18 (not
shown) and Ck19.
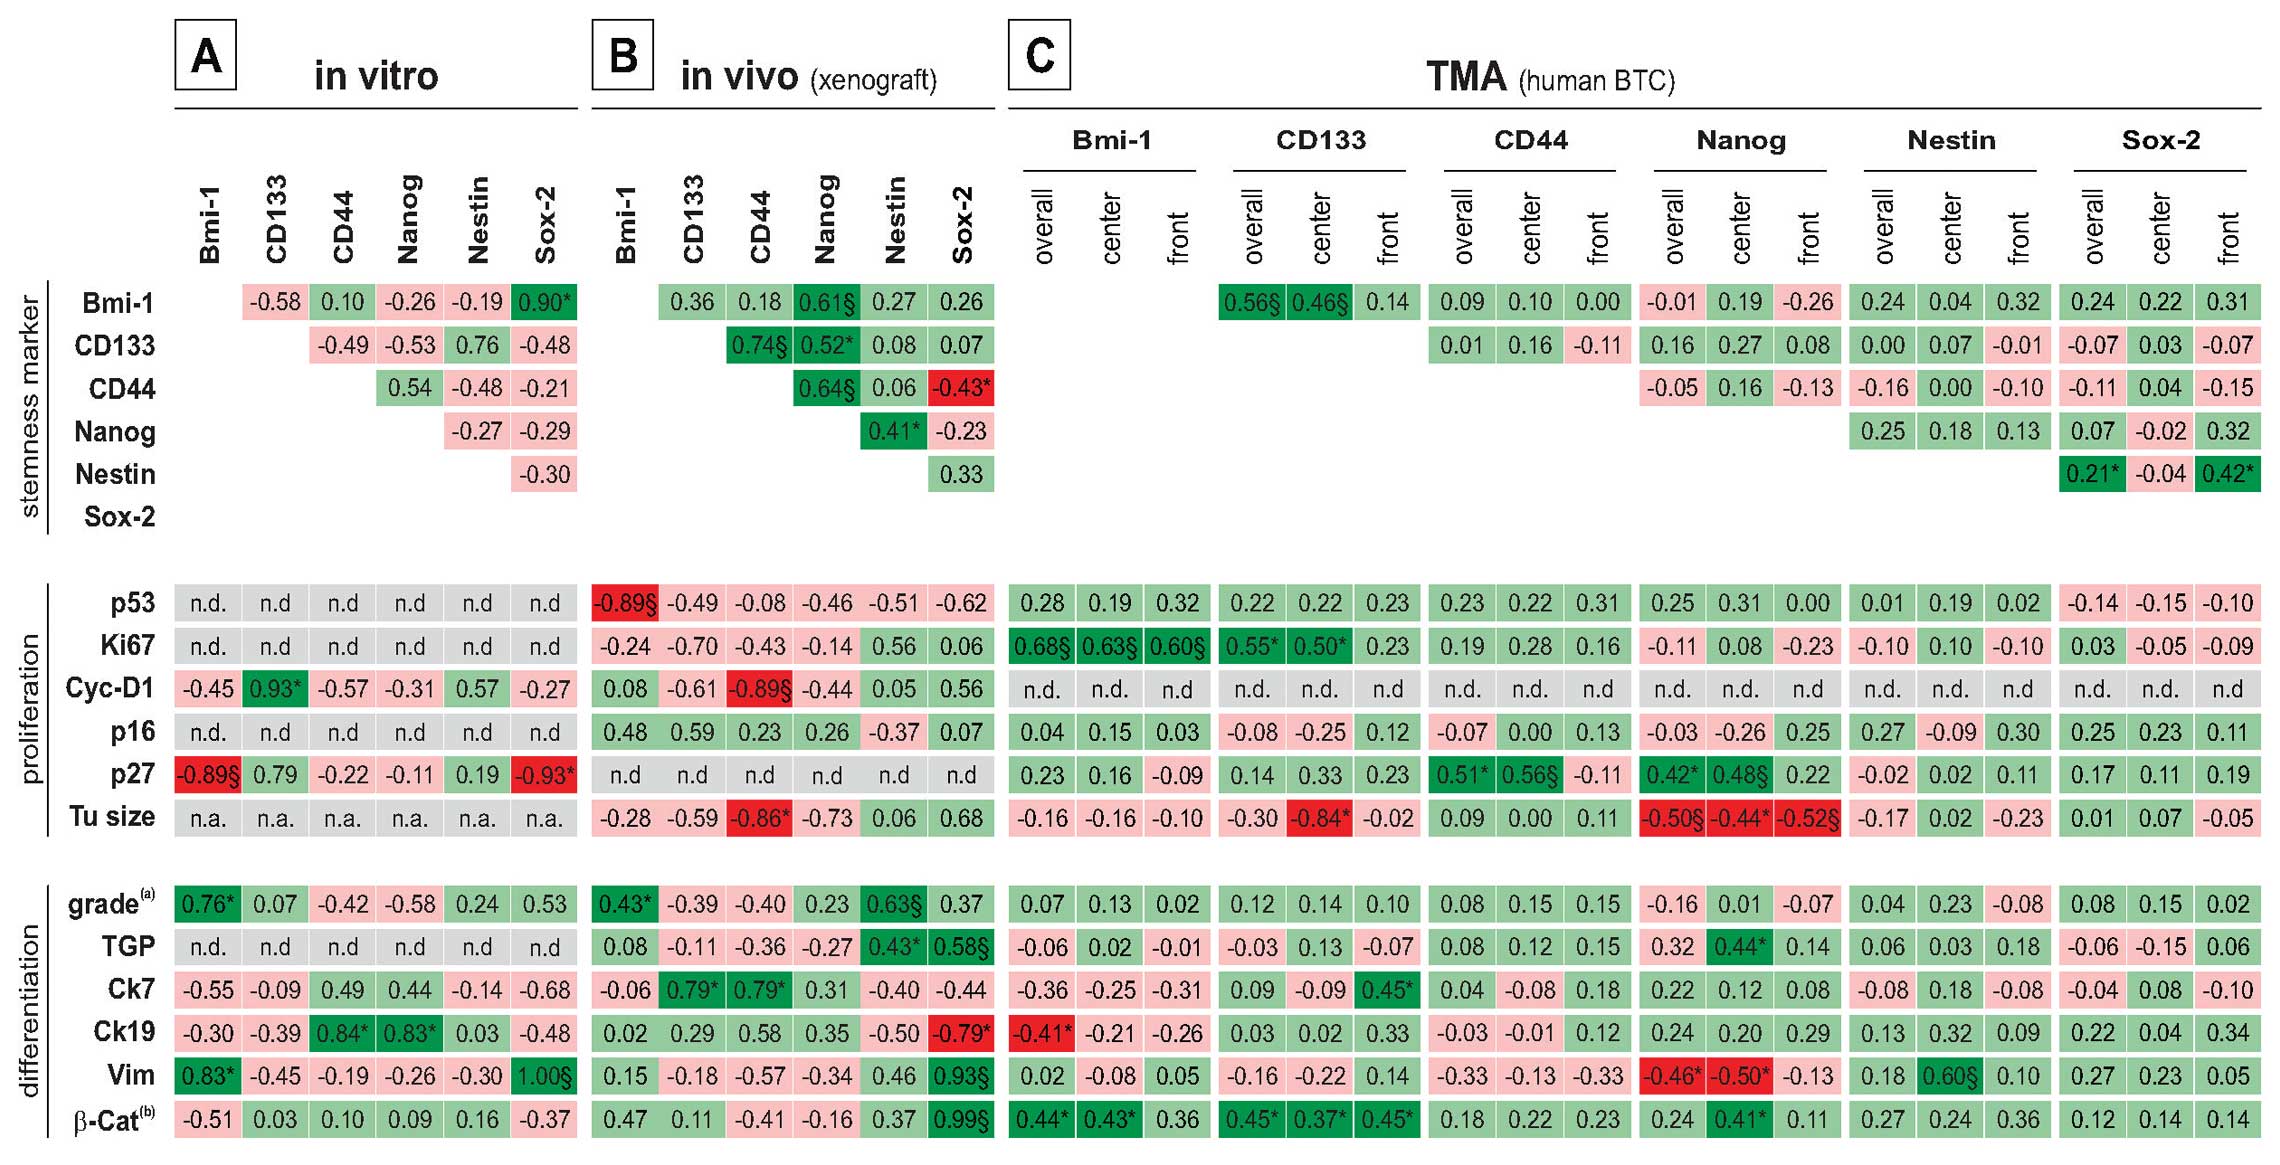 | Figure 3Correlation analysis between stem
cell marker, morphological and molecular markers of proliferation
and differentiation. Correlations were calculated for mRNA (in
vitro) and protein levels [in vivo (xenografts) and
human TMAs)] and are given by the Pearson correlation coefficient
*p<0.05; §p<0.01;
(a)original tumor grading; (b)nuclear
localization. Cyc-D1, cyclin-D1; n.a., not applicable; n.d., not
determined; TGP, tumor growth pattern [in vivo: ductal
(1), mixed (2), solid (3); TMA: mass forming (1) periductal (2)]; TMA, tissue microarray; Tu, tumor;
Vim, Vimentin. |
Expression of stemness markers in human
BTC
The expression of the mentioned stem cell markers
were investigated in human BTC using a tissue microarray consisting
of a total of 34 cases including 20 intrahepatic, 11 perihilar, and
3 cases of extrahepatic BTC (see Table
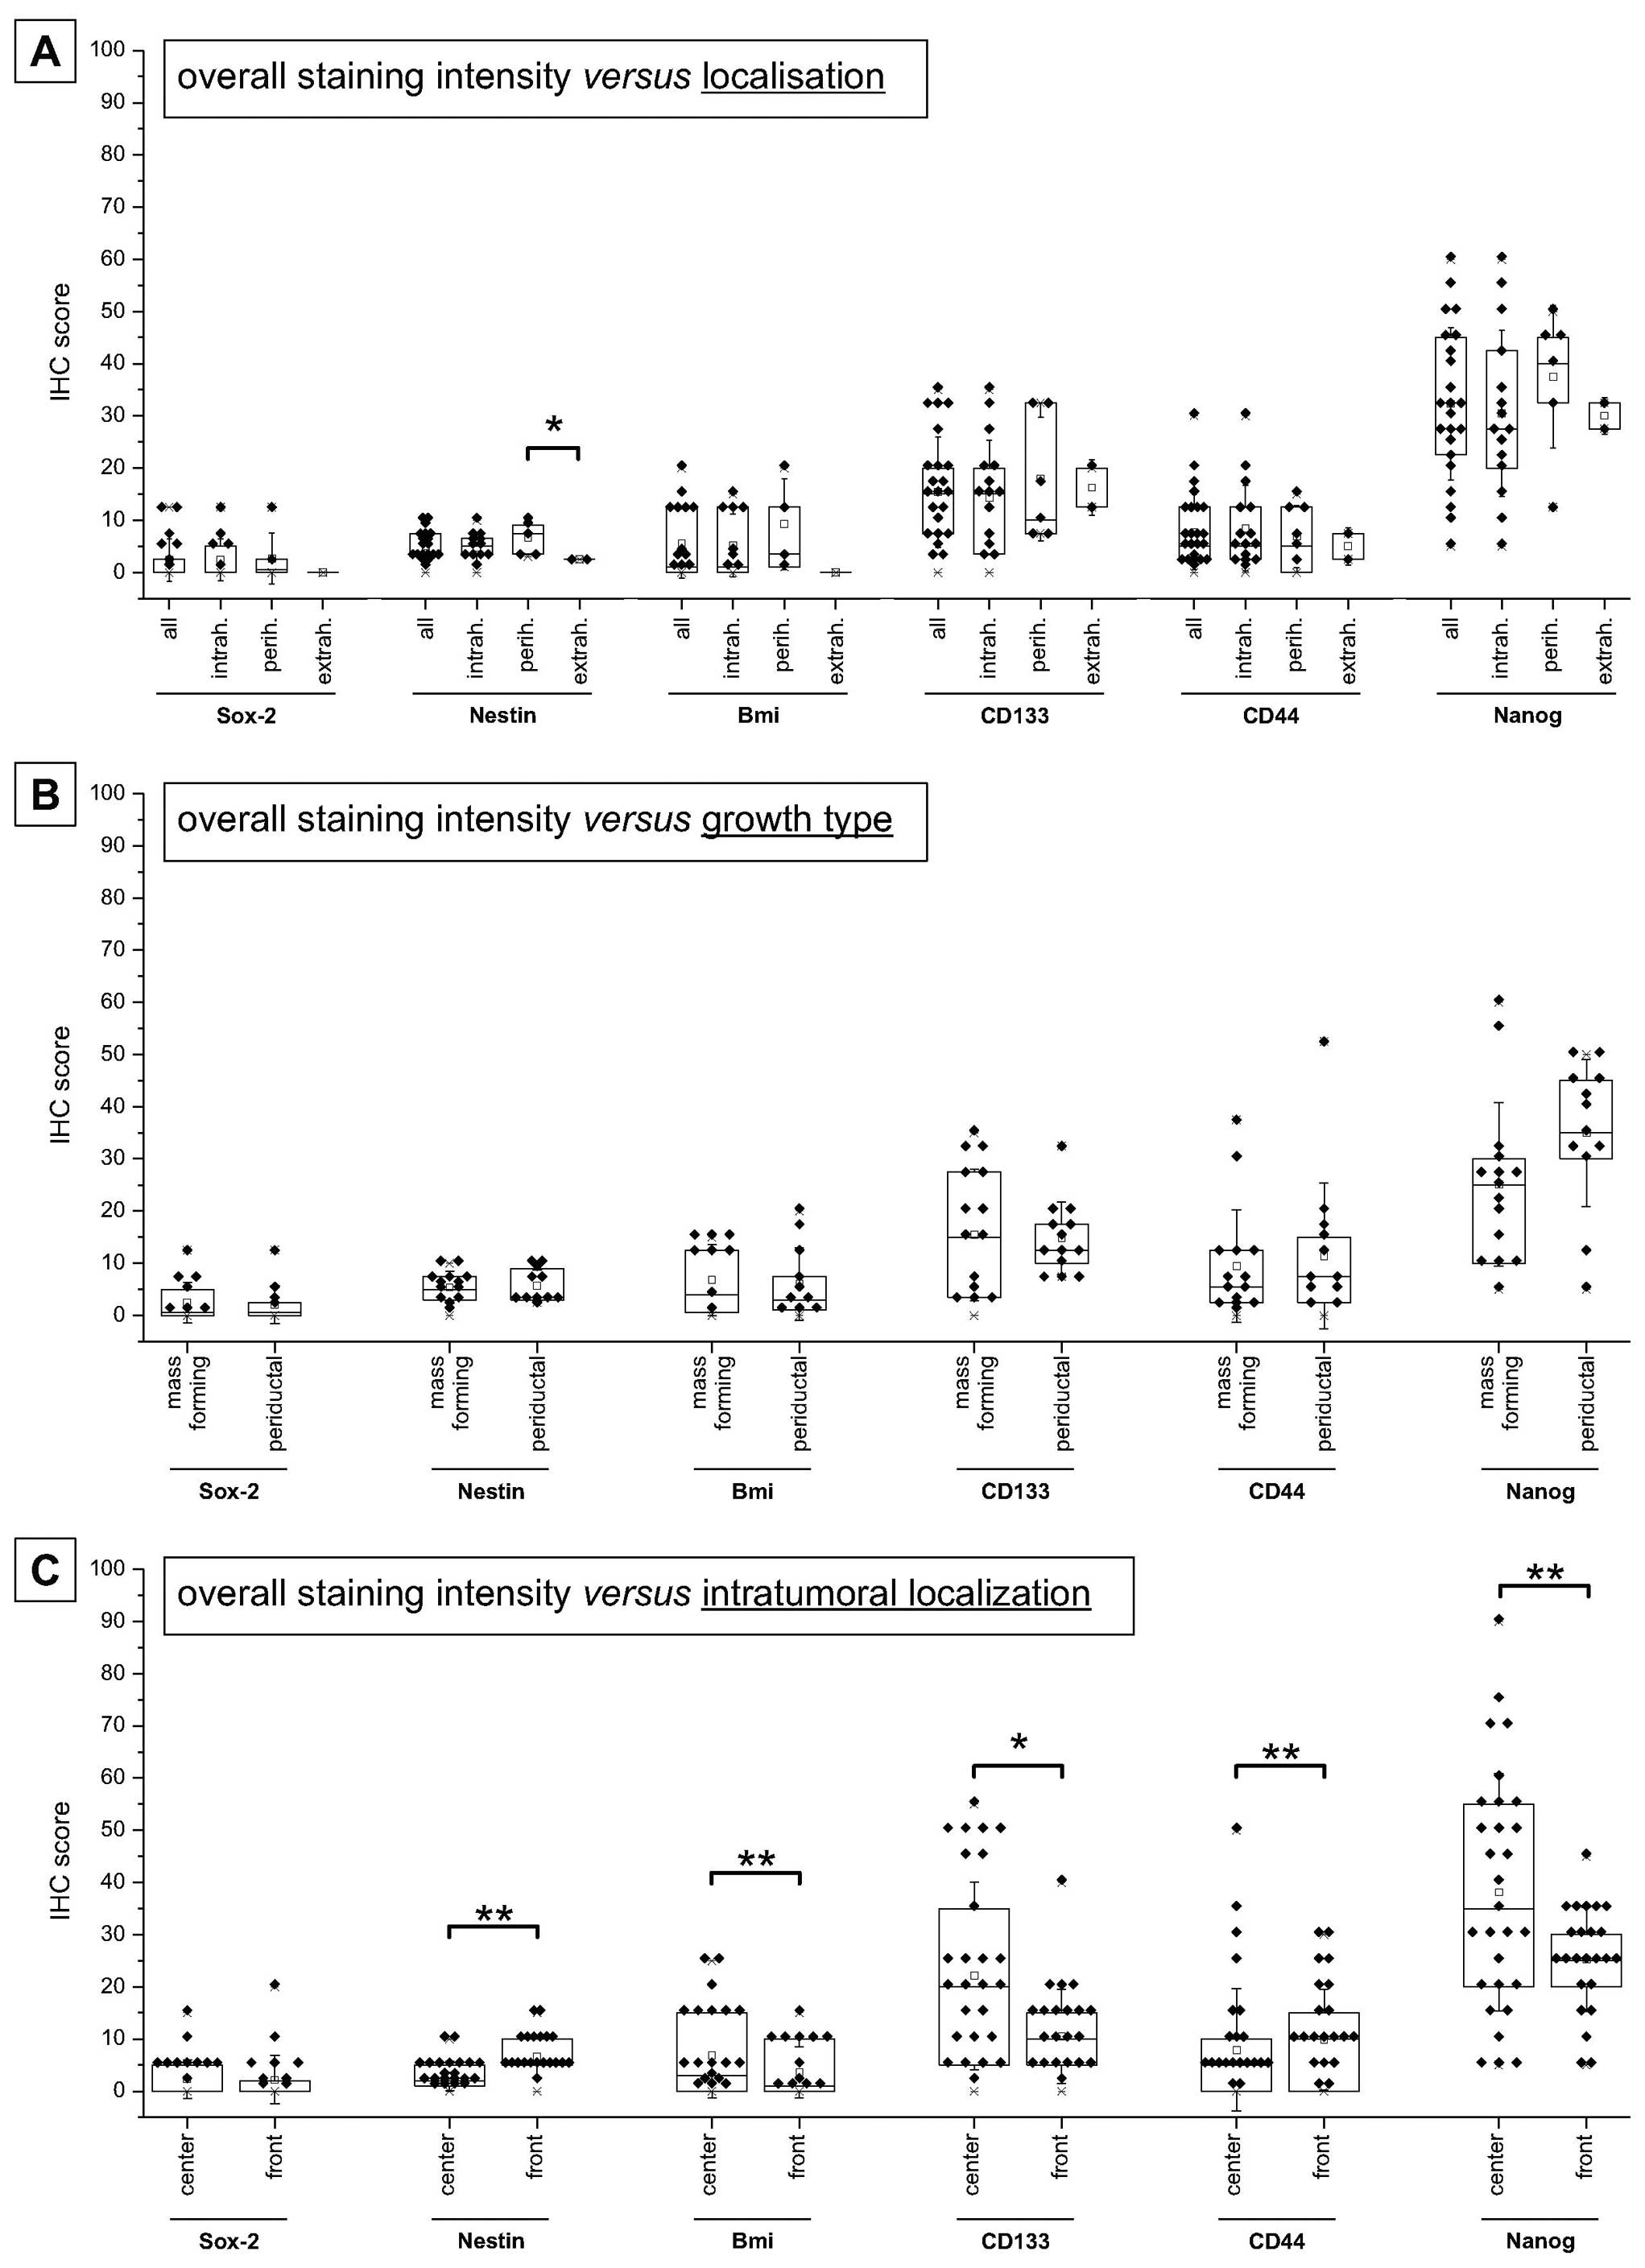
II for details). As shown in Fig.
4A, overall protein expression exhibited the highest levels of
Nanog followed by CD133 as well as CD44, Bmi-1, Nestin and Sox-2.
Fig. 4A also indicates that the
expression of these stem cell markers is not dependent on the
anatomical location (intra- versus perihilar or extrahepatic),
except for Nestin (only perihilar versus extrahepatic). Analysis of
stemness marker expression levels depending on the growth type also
revealed no significant differences, yet a trend to increased
expression of Nanog can be seen for periductal compared to a
mass-forming growth type (Fig.
4B). Detailed analysis depending on the intratumoral
localization indicated significant higher expression of Bmi-1,
CD133 and Nanog in the tumor centers, while Nestin and CD44 are
preferentially expressed in the tumor front sections (all
p<0.05, paired t-test; Fig.
4C).
Correlation analysis of the marker expression and
selected differentiation/proliferation characteristics is shown in
Fig. 3C: positive correlation
between the proliferation marker Ki67 and stemness marker
expression can be found for CD133 and Bmi-1, while CD44 and Nanog
expression is associated with high levels of the cell cycle
inhibitor p27. Additionally, other cell cycle associated proteins
were positively associated with the stemness marker expression.
Nuclear β-catenin is indicative of active Wnt signaling, a
signaling pathway implicated in the generation and maintenance of
the cancer stem cell population. Interestingly, expression of Bmi-1
CD133 and Nanog in our set of samples is significant positively
correlated with nuclear β-catenin. Interestingly, markers of
differentiation (cytokeratins/vimentin) showed no consistent and
partially opposite relationship with the stem cell markers.
Significant correlation are preferentially found in the tumor
center (in detail see Fig. 3C).
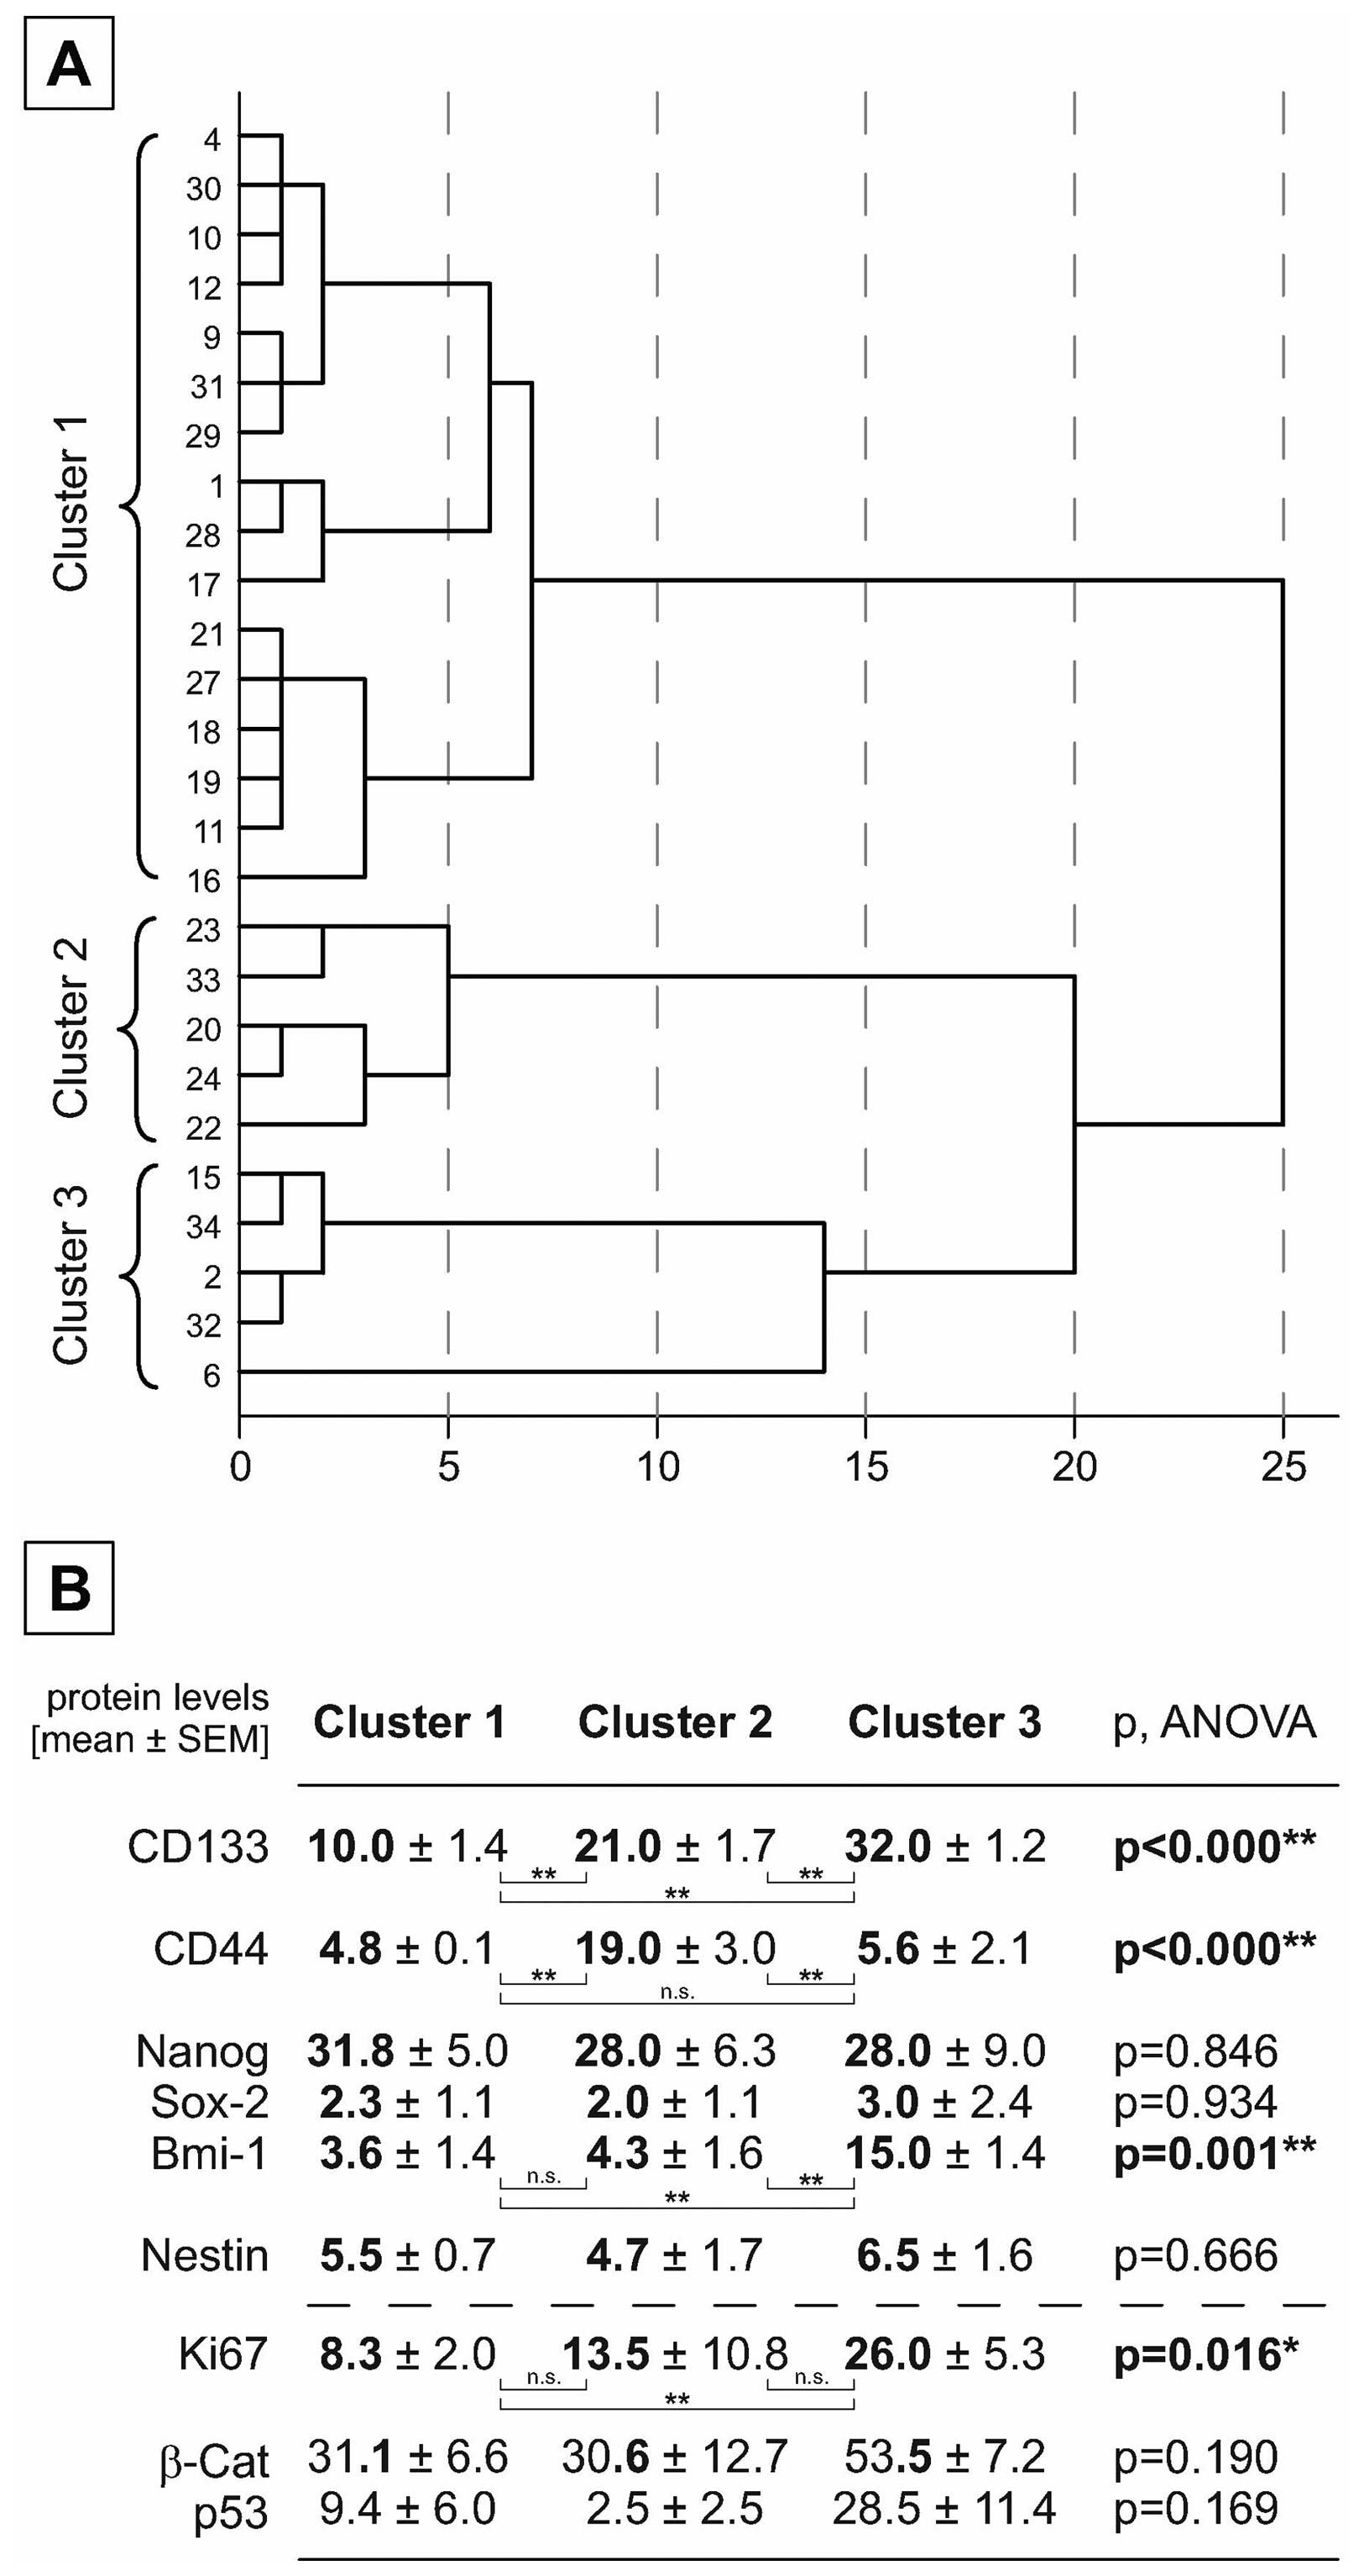
Based on the findings from xenograft stemness marker expression,
the TMA cases were classified using hierarchical cluster analysis
based on the marker expression of CD133 and CD44. As shown in
Fig. 5A, three distinct clusters
could be identified characterized by significant differences in
expression of these markers. The marker Bmi-1 showed a significant
different expression in the three groups similarly to that of
CD133. Interestingly, the proliferation marker Ki67 is
significantly higher expressed in the cluster which shows high
levels of CD133 and Bmi-1 (Fig.
5B).
Association of stem cell marker
expression with clinicopathological data
Using univariate ANOVA (LSD post hoc test), the
expression of the investigated stemness markers was compared for
different groups of samples stratified either for the different
UICC stages, grading, the T-, N-, M-status, growth type and the
intra-tumoral localization (see Fig.
6). Here, the analysis revealed only significant different
expression of stemness markers for T-status (CD44) and M-status
(Nestin) as well as tumor localization (CD133 and Nestin) regarding
the tumor subregions (emphasizing predominantly the impact of the
tumor front). It is notably that clinicopathological data
summarizing different cofactors such as UICC stage (T-, N- and
M-status as well as tumor localization) and tumor grading
(different morphological aspects) did not reveal a clear dependency
of the stemness marker expression pattern.
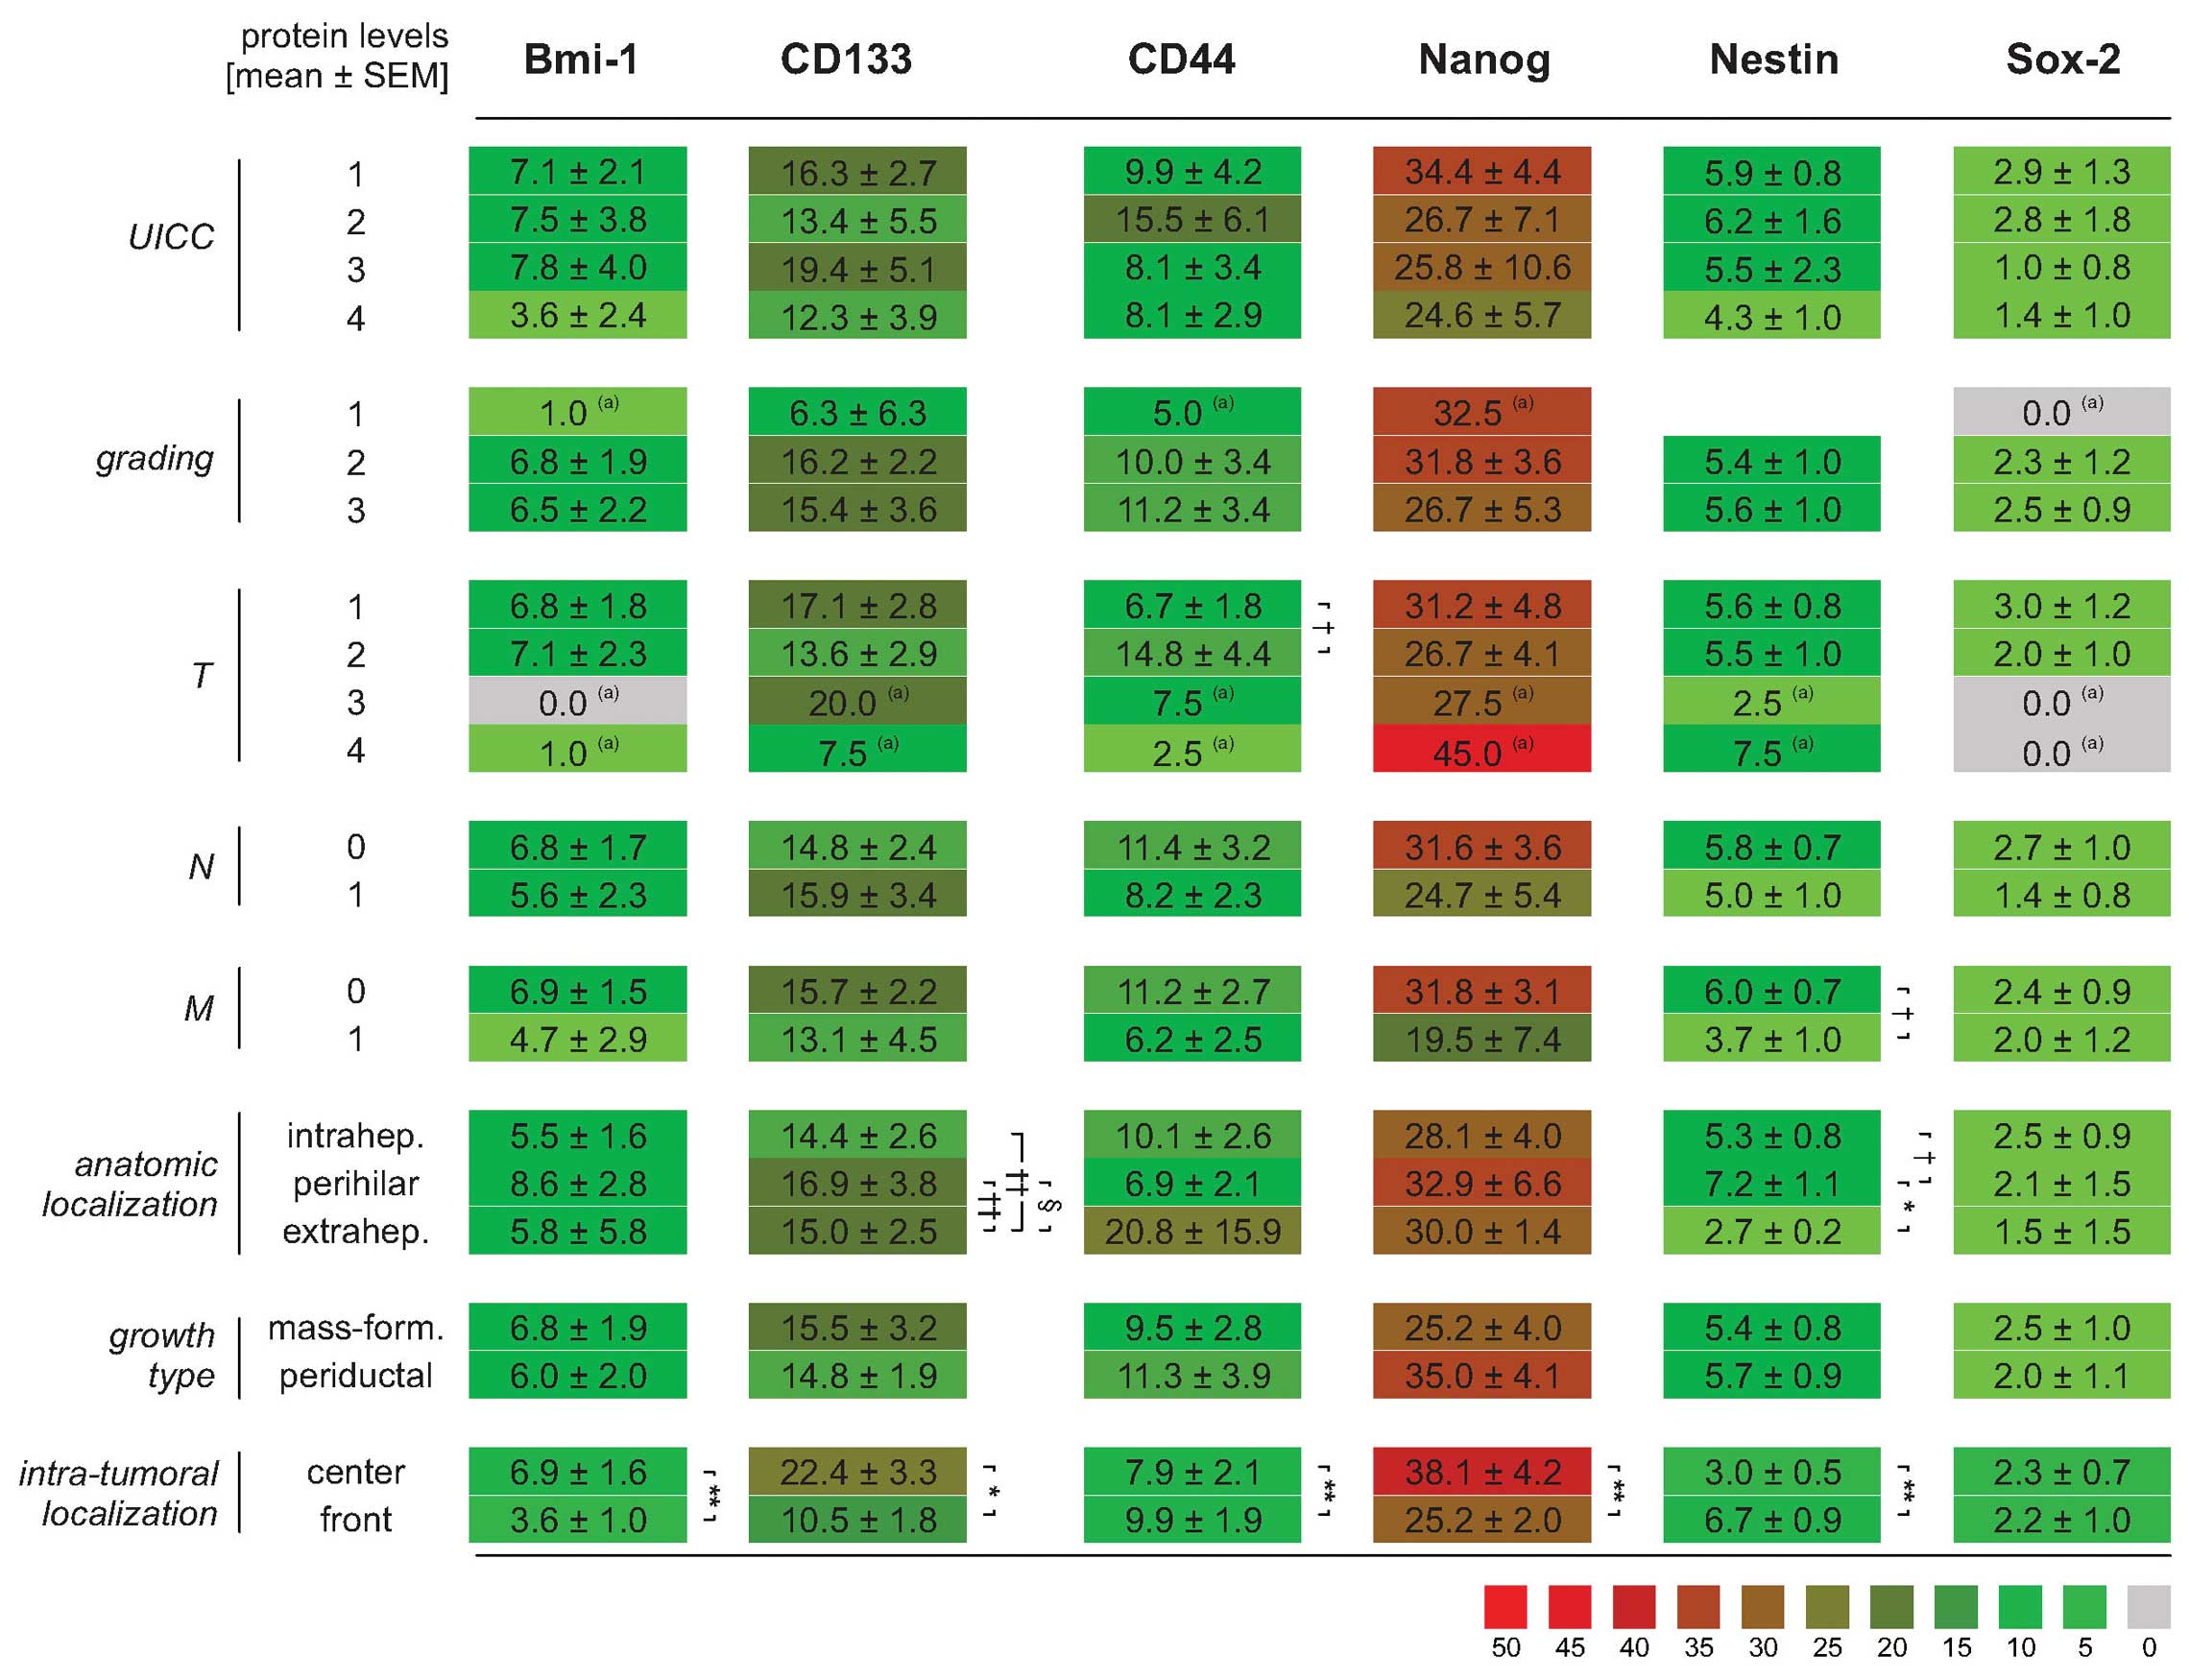 | Figure 6Comparison of stemness marker
expression in different sample groups according to
clinicopathological parameters. Mean values of stem cell markers
are given as mean ± SEM. (a)Indicates groups with only
one case. Significant and highly significant differences between
the individual groups are marked with *,§,†p<0.05 or
**,§§,††p<0.01, respectively (ANOVA, LSD post hoc
test) - with *,§,† stands for overall, tumor center and
tumor front, respectively. |
Impact of differential stemness marker
expression on overall survival
Survival analysis using the Kaplan-Meier method as
well as log-rank test showed that patients with mass-forming growth
types of BTC have a tendency to poorer survival characteristics
compared to those with a periductal growth pattern (Fig. 7A). When patients were stratified
for low versus high expression levels of the stemness markers, a
clear yet not significant trend of high expression towards shorter
survival times could be found for CD133 and CD44 when these markers
were used individually (Fig. 7B and
C). Combination of all stem cell markers revealed a similar
trend of poorer prognosis in patients with tumors of higher marker
expression (Fig. 7D) which was
statistically significant for the protein expression values
(p=0.017, Fig. 7E).
Discussion
Referring to the recently updated hallmarks of
cancer by Hanahan and Weinberg (28) the cancer stem cell model is now
accepted as a valid concept of carcinogenesis. This model implies
that either a subpopulation of cancer cells acquires a stem
cell-like phenotype or dormant tissue stem cells are activated and
gain oncogenic properties, associated with enhanced tumorigenic
potency of self-renewal, migration and metastatic dissemination. On
this background, numerous studies investigated stem cell
characteristics in diverse human malignancies giving evidence that
most if not all tumors showed a specific stem cell signature
(15). Therefore, the current
study aimed to investigate the expression of protein markers in
human BTC associated with the stemness phenotype and its
clinicopathological consequences. In brief, analysis of in
vitro samples, xenograft tumor and a human BTC TMA revealed a
heterogeneous expression pattern of stemness marker expression.
Additionally, survival analyses of these samples indicate a trend
to a worse prognosis for cases with higher expression of CD133 and
CD44.
In the first part of our investigations we detect
all of the employed stem cell markers Bmi-1, Sox-2, Nestin, CD133,
CD44 and Nanog showing differential expression pattern in
vitro and in vivo, whereby mRNA and protein expression
were mostly concordant. Compared to data of stem cell markers in
BTC, we confirm the upregulated expression of CD44 and CD133
(17–19,29),
but also of the other investigated stemness markers. We expand
existing limited data by linking the expression of these stem cell
markers with morphology (ductal-solid, positive) and molecular
markers of proliferation (negative) and differentiation
(dedifferentiation: positive/transdifferentiation negative). As
published earlier, dedifferentiation is preferentially linked to
stemness characteristics, which can be readily recognized at the
level of morphology emphasizing the role of basic histology
(30). However, not the
hyperproliferative tumor fraction, but rather the resting tumor
compartment shows higher expression of these stem cell markers,
partly explaining the fact that conventional therapeutic approaches
such as chemo- and radiotherapy frequently cannot eradicate the
tumor cells completely leading to subsequent recurrence (29,31).
Nevertheless, Sasaki et al (32) were able to show that Bmi-1 is
expressed in intrahepatic BTC independent of histologic
differentiation or location and knockdown of Bmi-1 in BTC cell
lines decreased proliferation/colony formation (32). In line with these results, the
groups of BTC samples generated by cluster analysis based on CD133
and CD44 marker expression show a concordant expression of Bmi-1
and the proliferation marker Ki-67 (Fig. 5B). Such protein associated
subgrouping of primary BTC could be relevant for targeted
therapeutic approaches in future (32), as it was shown that expression
analysis of nuclear β-catenin and CD133 in CRC were able to detect
high risk cases in patients CRC subgroups of stage IIA for
therapeutic decisions (33).
In the second part of our study we investigated the
expression pattern of these stem cell markers in a TMA of resected
primary BTC. The markers were detected to a heterogeneous extent as
seen in the experimental in vitro and in vivo
setting, whereby the different levels possibly reflect the
influence of the extracellular matrix. Interestingly, we could not
detect differences between intrahepatic, perihilar and extrahepatic
anatomic location (except for Nestin) as would be expected from
studies investigating cell cycle-associated components (34–36).
Similarly, a recent publication revealed a significantly different
expression of CD133 depending on the tumor growth pattern, but not
on intrahepatic and perihilar tumor localization of BTC (37). However, we found a significant
preferential localization of CD133, Bmi-1 and Nanog in the tumor
center, whereas CD44 and Nestin tend to be expressed in the tumor
front. This is in line with earlier findings that intra-tumoral
gradients are important for tumorigenesis as well as progression
[for review see (38,39)]. Experimental investigation revealed
that tumor stem cell population is heterogeneous reflecting full
morphologic and phenotypic heterogeneity and forcing whole tumor
analysis (40). In own previous
studies, we were able to show that members of the hedgehog pathway
as well as markers of cell cycle-associated proteins were
topographically differentially distributed in ductal adenocarcinoma
of the pancreas (41) reflecting
the intratumoral heterogeneity as well as the associated complexity
of tumorigenesis. Our findings that not anatomy, but intra-tumor
compartments are linked to expression pattern must be seen under
the limitation of small number of extrahepatic cases and need
confirmation in a larger set of BTC samples.
Interestingly, we found similar correlation of the
stem cell markers with markers of differentiation and
cell-cycle-associated proteins in the BTC TMA and in our in
vitro and in vivo experiments, whereby the in
vitro/in vivo situation rather reflects a long-term
quiescent than an actively cycling (primed) stem cell as seen in
the BTC TMA analysis described (42,43).
Moreover, these results do not challenge the indispensable
explanatory worth of clinical samples (44) yet they highlight the value of
preclinical models as a starting point for investigations as well
as models for development of novel therapeutic approaches (45).
In the third part of our study we investigated
whether the expression of stem cell markers is linked to
clinicopathological data (such as staging, grading and survival).
Interestingly, depending on the intra-tumoral localization, only a
few stem cell markers (such as CD133, CD44 and Nestin) showed an
association with clinicopathological data (T and M status as well
as tumor localization) emphasizing the importance to investigate
all tumor subregions and indicating that the classical WHO grades
for BTC do not reflect the biological and clinical characteristics
of BTC. Using Kaplan-Meier survival analyses, high expression of
CD133 and CD44 goes along with a non-significant trend to lower
overall survival. This result is supported by published data in
different human cancers: especially gastric [Sox-2, Oct34 (46,47),
Nanog (48), Bmi-1 (49)], colorectal [c-MYC, Sox-2, OCT3/4,
LIN28, KLF4, and Nanog (50)],
liver [Bmi-1 (51)] and esophageal
squamous cell cancer [Oct3/4 and Sox-2 (52)] as well as of human
non-gastrointestinal cancers {breast [Sox-2 (53)], lung [Bmi-1 (54)] and brain [Bmi-1 (55)]}. Additionally, these studies could
partially demonstrate an association of stem cell marker expression
with clinical and pathomorphological data such as stage, and lymph
node status. Such relationships could not be found in our sample
set, possible due to the rather small sample size. Nevertheless,
survival analyses showed that, besides tumor growth pattern, the
combination of CD133 and CD44 likely is as a prognostic marker
significantly associated with worse survival. This is in line with
the data of Shimada et al who demonstrated that intrahepatic
cholangiocarcinoma expressing the CD133 marker has a significantly
worse survival than patients without expression of CD133 (29). The initial isolation and
characterization of cancer stem cells in extrahepatic
cholangiocarcinoma by Wang et al (18) was based on a marker combination of
CD44+, CD24+, EpCAMhigh. Cells
encompassing this marker phenotype were present in human
extrahepatic cholangiocarcinoma to an extent of 0.39–2.27% and
showed high tumorigenic potential in a NOD/SCID mouse model. It
remains to be analyzed, whether these markers have a more
significant prognostic value than those investigated in the present
study. Finally, our findings are supported by recent published
investigations on primary cell cultures of gall bladder cancer
showing that CD133+ as well as
CD133+/CD44+ tumor cell population were more
resistant to chemotherapeutic reagents, possessed higher
colony-formation ability in vivo and higher tumorigenicity
in nude mice than their antigen-negative counterparts (37,56,57).
In conclusion, analysis of expression patterns of
putative stem cell markers in vitro and in a xenograft model
classified the human BTC into subgroups indicating the
heterogeneity of carcinogenesis in BTC. Additionally, the
prognostic relevance of the markers identified in this study to
significantly impact on overall survival must be proven in further
experimental and morphological studies of human tumor specimens of
BTC in a larger patient cohort.
Abbreviations:
|
ALDH
|
aldehyde dehydrogenase;
|
|
BTC
|
biliary tract cancer;
|
|
CI
|
confidence interval;
|
|
FBS
|
fetal bovine serum;
|
|
LSD
|
least significant difference;
|
|
qRT-PCR
|
quantitative real-time reverse
transcription PCR;
|
|
SD
|
standard deviation;
|
|
TMA
|
tissue microarray;
|
|
WR
|
whipple resection
|
Acknowledgements
The expert technical assistance of
Mrs. Berta Lechner is gratefully acknowledged. TK was supported by
a research grant of the research fund of the Paracelsus Medical
University Salzburg (grant no. R-10/04/17-KIE).
References
|
1
|
de Groen PC, Gores GJ, LaRusso NF,
Gunderson LL and Nagorney DM: Biliary tract cancers. N Engl J Med.
341:1368–1378. 1999.
|
|
2
|
Aljiffry M, Abdulelah A, Walsh M,
Peltekian K, Alwayn I and Molinari M: Evidence-based approach to
cholangiocarcinoma: a systematic review of the current literature.
J Am Coll Surg. 208:134–147. 2009. View Article : Google Scholar : PubMed/NCBI
|
|
3
|
Zografos GN, Farfaras A, Zagouri F,
Chrysikos D and Karaliotas K: Cholangiocarcinoma: principles and
current trends. Hepatobiliary Pancreat Dis Int. 10:10–20. 2011.
View Article : Google Scholar
|
|
4
|
Kiesslich T, Wolkersdorfer G, Neureiter D,
Salmhofer H and Berr F: Photodynamic therapy for non-resectable
perihilar cholangiocarcinoma. Photochem Photobiol Sci. 8:23–30.
2009. View
Article : Google Scholar : PubMed/NCBI
|
|
5
|
Verslype C, Prenen H and Van Cutsem E: The
role of chemotherapy in biliary tract carcinoma. HPB (Oxford).
10:164–167. 2008. View Article : Google Scholar : PubMed/NCBI
|
|
6
|
Bailey JM, Singh PK and Hollingsworth MA:
Cancer metastasis facilitated by developmental pathways: Sonic
hedgehog, Notch, and bone morphogenic proteins. J Cell Biochem.
102:829–839. 2007. View Article : Google Scholar : PubMed/NCBI
|
|
7
|
Fava G, Marzioni M, Benedetti A, Glaser S,
DeMorrow S, Francis H and Alpini G: Molecular pathology of biliary
tract cancers. Cancer Lett. 250:155–167. 2007. View Article : Google Scholar : PubMed/NCBI
|
|
8
|
Wiedmann MW and Mossner J: Molecular
targeted therapy of biliary tract cancer - results of the first
clinical studies. Curr Drug Targets. 11:834–850. 2010. View Article : Google Scholar : PubMed/NCBI
|
|
9
|
Neureiter D, Herold C and Ocker M:
Gastrointestinal cancer -only a deregulation of stem cell
differentiation? (Review). Int J Mol Med. 483–489. 2006.PubMed/NCBI
|
|
10
|
Brabletz T, Jung A, Spaderna S, Hlubek F
and Kirchner T: Opinion: migrating cancer stem cells - an
integrated concept of malignant tumour progression. Nat Rev Cancer.
5:744–749. 2005. View
Article : Google Scholar : PubMed/NCBI
|
|
11
|
Brabletz S, Schmalhofer O and Brabletz T:
Gastrointestinal stem cells in development and cancer. J Pathol.
217:307–317. 2009. View Article : Google Scholar : PubMed/NCBI
|
|
12
|
Jopling C, Boue S and Izpisua Belmonte JC:
Dedifferentiation, transdifferentiation and reprogramming: three
routes to regeneration. Nat Rev Mol Cell Biol. 12:79–89. 2011.
View Article : Google Scholar : PubMed/NCBI
|
|
13
|
Al Hajj M, Wicha MS, Benito-Hernandez A,
Morrison SJ and Clarke MF: Prospective identification of
tumorigenic breast cancer cells. Proc Natl Acad Sci USA.
100:3983–3988. 2003.
|
|
14
|
Todaro M, Francipane MG, Medema JP and
Stassi G: Colon cancer stem cells: promise of targeted therapy.
Gastroenterology. 138:2151–2162. 2010. View Article : Google Scholar : PubMed/NCBI
|
|
15
|
Alison MR, Lim SM and Nicholson LJ: Cancer
stem cells: problems for therapy? J Pathol. 223:147–161. 2011.
View Article : Google Scholar : PubMed/NCBI
|
|
16
|
Horst D, Kriegl L, Engel J, Kirchner T and
Jung A: Prognostic significance of the cancer stem cell markers
CD133, CD44, and CD166 in colorectal cancer. Cancer Invest.
27:844–850. 2009. View Article : Google Scholar : PubMed/NCBI
|
|
17
|
Shimada M, Sugimoto K, Iwahashi S,
Utsunomiya T, Morine Y, Imura S and Ikemoto T: CD133 expression is
a potential prognostic indicator in intrahepatic
cholangiocarcinoma. J Gastroenterol. 45:896–902. 2010. View Article : Google Scholar : PubMed/NCBI
|
|
18
|
Wang M, Xiao J, Shen M, et al: Isolation
and characterization of tumorigenic extrahepatic cholangiocarcinoma
cells with stem cell-like properties. Int J Cancer. 128:72–81.
2011. View Article : Google Scholar : PubMed/NCBI
|
|
19
|
Nagai K, Ishii H, Miyoshi N, et al:
Long-term culture following ES-like gene-induced reprogramming
elicits an aggressive phenotype in mutated cholangiocellular
carcinoma cells. Biochem Biophys Res Commun. 395:258–263. 2010.
View Article : Google Scholar
|
|
20
|
Kiesslich T, Alinger B, Wolkersdorfer GW,
Ocker M, Neureiter D and Berr F: Active Wnt signalling is
associated with low differentiation and high proliferation in human
biliary tract cancer in vitro and in vivo and is
sensitive to pharmacological inhibition. Int J Oncol. 36:49–58.
2010.PubMed/NCBI
|
|
21
|
Berman DM, Karhadkar SS, Maitra A, et al:
Widespread requirement for Hedgehog ligand stimulation in growth of
digestive tract tumours. Nature. 425:846–851. 2003. View Article : Google Scholar : PubMed/NCBI
|
|
22
|
Radonic A, Thulke S, Mackay IM, Landt O,
Siegert W and Nitsche A: Guideline to reference gene selection for
quantitative real-time PCR. Biochem Biophys Res Commun.
313:856–862. 2004. View Article : Google Scholar : PubMed/NCBI
|
|
23
|
Neureiter D, Zopf S, Dimmler A, et al:
Different capabilities of morphological pattern formation and its
association with the expression of differentiation markers in a
xenograft model of human pancreatic cancer cell lines.
Pancreatology. 5:387–397. 2005. View Article : Google Scholar
|
|
24
|
Zopf S, Neureiter D, Bouralexis S, et al:
Differential response of p53 and p21 on HDAC inhibitor-mediated
apoptosis in HCT116 colon cancer cells in vitro and in
vivo. Int J Oncol. 31:1391–1402. 2007.PubMed/NCBI
|
|
25
|
Kemmerling R, Stintzing S, Muhlmann J,
Dietze O and Neureiter D: Primary testicular lymphoma: A strictly
homogeneous hematological disease? Oncol Rep. 23:1261–1267.
2010.PubMed/NCBI
|
|
26
|
Tannapfel A and Wittekind C: The current
TNM system for gastrointestinal tumors part II. Pathologe.
31:348–352. 2010.(In German).
|
|
27
|
Malhi H and Gores GJ: Cholangiocarcinoma:
modern advances in understanding a deadly old disease. J Hepatol.
45:856–867. 2006. View Article : Google Scholar : PubMed/NCBI
|
|
28
|
Hanahan D and Weinberg RA: Hallmarks of
cancer: the next generation. Cell. 144:646–674. 2011. View Article : Google Scholar : PubMed/NCBI
|
|
29
|
Shimada M, Sugimoto K, Iwahashi S,
Utsunomiya T, Morine Y, Imura S and Ikemoto T: CD133 expression is
a potential prognostic indicator in intrahepatic
cholangiocarcinoma. J Gastroenterol. 45:896–902. 2010. View Article : Google Scholar : PubMed/NCBI
|
|
30
|
Zhang C, Fu X, Chen P, et al:
Dedifferentiation derived cells exhibit phenotypic and functional
characteristics of epidermal stem cells. J Cell Mol Med.
14:1135–1145. 2010.PubMed/NCBI
|
|
31
|
Singh A and Settleman J: EMT, cancer stem
cells and drug resistance: an emerging axis of evil in the war on
cancer. Oncogene. 29:4741–4751. 2010. View Article : Google Scholar : PubMed/NCBI
|
|
32
|
Sasaki M, Yamaguchi J, Ikeda H, Itatsu K
and Nakanuma Y: Polycomb group protein Bmi1 is overexpressed and
essential in anchorage-independent colony formation, cell
proliferation and repression of cellular senescence in
cholangiocarcinoma: tissue and culture studies. Hum Pathol.
40:1723–1730. 2009. View Article : Google Scholar
|
|
33
|
Horst D, Kriegl L, Engel J, Jung A and
Kirchner T: CD133 and nuclear beta-catenin: the marker combination
to detect high risk cases of low stage colorectal cancer. Eur J
Cancer. 45:2034–2040. 2009. View Article : Google Scholar : PubMed/NCBI
|
|
34
|
Miller G, Socci ND, Dhall D, et al: Genome
wide analysis and clinical correlation of chromosomal and
transcriptional mutations in cancers of the biliary tract. J Exp
Clin Cancer Res. 28:622009. View Article : Google Scholar : PubMed/NCBI
|
|
35
|
Jarnagin WR, Klimstra DS, Hezel M, et al:
Differential cell cycle-regulatory protein expression in biliary
tract adenocarcinoma: correlation with anatomic site, pathologic
variables, and clinical outcome. J Clin Oncol. 24:1152–1160. 2006.
View Article : Google Scholar
|
|
36
|
Karamitopoulou E, Tornillo L, Zlobec I, et
al: Clinical significance of cell cycle- and apoptosis-related
markers in biliary tract cancer: a tissue microarray-based approach
revealing a distinctive immunophenotype for intrahepatic and
extrahepatic cholangiocarcinomas. Am J Clin Pathol. 130:780–786.
2008. View Article : Google Scholar
|
|
37
|
Ohtsubo I, Ajiki T, Hori Y, et al:
Distinctive expression of CD133 between intraductal papillary
neoplasms of the bile duct and bile duct adenocarcinomas. Hepatol
Res. Jan 6–2012.(Epub ahead of print).
|
|
38
|
Hanahan D and Folkman J: Patterns and
emerging mechanisms of the angiogenic switch during tumorigenesis.
Cell. 86:353–364. 1996. View Article : Google Scholar : PubMed/NCBI
|
|
39
|
Kiesslich T, Berr F, Alinger B, Kemmerling
R, Pichler M, Ocker M and Neureiter D: Current status of
therapeutic targeting of developmental signalling pathways in
oncology. Curr Pharm Biotechnol. May 24–2011.(Epub ahead of
print).
|
|
40
|
Dalerba P, Dylla SJ, Park IK, et al:
Phenotypic characterization of human colorectal cancer stem cells.
Proc Natl Acad Sci USA. 104:10158–10163. 2007. View Article : Google Scholar : PubMed/NCBI
|
|
41
|
Quint K, Stintzing S, Alinger B, et al:
The expression pattern of PDX-1, SHH, patched and Gli-1 is
associated with pathological and clinical features in human
pancreatic cancer. Pancreatology. 9:116–126. 2009. View Article : Google Scholar : PubMed/NCBI
|
|
42
|
Li L and Clevers H: Coexistence of
quiescent and active adult stem cells in mammals. Science.
327:542–545. 2010. View Article : Google Scholar : PubMed/NCBI
|
|
43
|
Scoville DH, Sato T, He XC and Li L:
Current view: intestinal stem cells and signaling.
Gastroenterology. 134:849–864. 2008. View Article : Google Scholar : PubMed/NCBI
|
|
44
|
Gillet JP, Calcagno AM, Varma S, et al:
Redefining the relevance of established cancer cell lines to the
study of mechanisms of clinical anti-cancer drug resistance. Proc
Natl Acad Sci USA. 108:18708–18713. 2011. View Article : Google Scholar : PubMed/NCBI
|
|
45
|
Kiesslich T and Neureiter D: Editorial:
Advances in targeting the hedgehog signaling pathwy in cancer
therapy. Expert Opin Ther Targets. 16:151–156. 2012. View Article : Google Scholar
|
|
46
|
Matsuoka J, Yashiro M, Sakurai K, et al:
Role of the stemness factors Sox2, Oct3/4, and Nanog in gastric
carcinoma. J Surg Res. 130–135. 2012. View Article : Google Scholar : PubMed/NCBI
|
|
47
|
Zhang X, Yu H, Yang Y, et al: SOX2 in
gastric carcinoma, but not Hath1, is related to patients’
clinicopathological features and prognosis. J Gastrointest Surg.
14:1220–1226. 2010.PubMed/NCBI
|
|
48
|
Lin T, Ding YQ and Li JM: Overexpression
of Nanog protein is associated with poor prognosis in gastric
adenocarcinoma. Med Oncol. Feb 20–2011.(Epub ahead of print).
|
|
49
|
Liu JH, Song LB, Zhang X, et al: Bmi-1
expression predicts prognosis for patients with gastric carcinoma.
J Surg Oncol. 97:267–272. 2008. View Article : Google Scholar : PubMed/NCBI
|
|
50
|
Saiki Y, Ishimaru S, Mimori K, et al:
Comprehensive analysis of the clinical significance of inducing
pluripotent stemness-related gene expression in colorectal cancer
cells. Ann Surg Oncol. 16:2638–2644. 2009. View Article : Google Scholar : PubMed/NCBI
|
|
51
|
Wang H, Pan K, Zhang HK, et al: Increased
polycomb-group oncogene Bmi-1 expression correlates with poor
prognosis in hepatocellular carcinoma. J Cancer Res Clin Oncol.
134:535–541. 2008. View Article : Google Scholar : PubMed/NCBI
|
|
52
|
Wang Q, He W, Lu C, et al: Oct3/4 and Sox2
are significantly associated with an unfavorable clinical outcome
in human esophageal squamous cell carcinoma. Anticancer Res.
29:1233–1241. 2009.PubMed/NCBI
|
|
53
|
Lengerke C, Fehm T, Kurth R, et al:
Expression of the embryonic stem cell marker SOX2 in early-stage
breast carcinoma. BMC Cancer. 11:422011. View Article : Google Scholar : PubMed/NCBI
|
|
54
|
Vrzalikova K, Skarda J, Ehrmann J, et al:
Prognostic value of Bmi-1 oncoprotein expression in NSCLC patients:
a tissue microarray study. J Cancer Res Clin Oncol. 134:1037–1042.
2008. View Article : Google Scholar : PubMed/NCBI
|
|
55
|
Hayry V, Tynninen O, Haapasalo HK, et al:
Stem cell protein BMI-1 is an independent marker for poor prognosis
in oligodendroglial tumours. Neuropathol Appl Neurobiol.
34:555–563. 2008. View Article : Google Scholar : PubMed/NCBI
|
|
56
|
Shi CJ, Gao J, Wang M, et al: CD133(+)
gallbladder carcinoma cells exhibit self-renewal ability and
tumorigenicity. World J Gastroenterol. 17:2965–2971. 2011.
|
|
57
|
Shi C, Tian R, Wang M, et al:
CD44+ CD133+ population exhibits cancer stem
cell-like characteristics in human gall-bladder carcinoma. Cancer
Biol Ther. 10:1182–1190. 2010.
|