Introduction
Aberrant DNA methylation and epigenetic silencing of
gene expression are well recognized hallmarks of cancer (1,2), and
methylation-dependent gene silencing occurs frequently in breast
cancer (3–6). Changes in gene expression patterns
secondary to methylation-dependent gene silencing fundamentally
contribute to initiation, development, and progression of breast
cancer (7–9). We identified a novel hypermethylation
defect that is expressed in a subset of breast cancer cell lines
and is characterized by epigenetic silencing of
methylation-sensitive genes secondary to overexpression of DNMT3b
and DNA methyltransferase hyperactivity (10). The hypermethylation defect observed
among breast cancer cell lines is associated with a characteristic
gene expression signature that reflects methylation-dependent
silencing of a panel of epigenetic biomarker genes (including
CDH1, CEACAM6, CST6, ESR1, GNA11, MUC1, MYB, SCNN1A and
TFF3) (10). This
hypermethylation gene signature was established in human breast
cancer cell lines, but also identifies a subset of primary sporadic
breast cancers (10). A robust
correspondence is observed between the expression of the
hypermethylation defect and the basal-like molecular subtype of
breast cancer, suggesting that this may be a defining
characteristic of this breast cancer subtype (10). However, the molecular mechanism
that governs the overexpression of DNMT3b among hypermethylator
breast cancer cell lines has not been investigated.
DNMT3b is constitutively expressed by all
mammalian cell types, but is frequently overexpressed in cancer
(11–14). However, unlike other genes that are
overexpressed in cancer, the mechanisms accounting for increased
DNMT3b levels infrequently involve gene mutations and/or
gene amplification (15).
Likewise, increased DNMT3b transcription due to increased
trans-activation does not commonly occur in cancer (15). Rather, it is now recognized that
DNMT3b is subject to post-transcriptional regulation by microRNAs
(miRs), which are small non-coding RNAs (19–25 nucleotide long)
that regulate gene expression through sequence-specific targeting
of mRNAs, producing either translational repression or degradation
of the target mRNA (16,17). miRs are expressed in a
tissue-specific manner and have been implicated in the regulation
of several biological processes, including cellular proliferation,
apoptosis, and development (18–21).
Altered miR expression is associated with several types of human
cancer, including breast cancer (22–25).
Recent studies have identified miRs as both regulators of DNA
methyltransferase (DNMT) expression and targets of aberrant DNA
methylation in various tissue types. The miR-29 family (miR-29a,
miR-29b, miR-29c) directly targets DNMT3a and DNMT3b in lung cancer
(26) and acute myeloid leukemia
(27). Likewise, the miR-148
family (miR-148a, miR-148b) regulates DNMT3b in cell lines
of multiple origin, including the MCF-7 breast cancer cell line
(28). In human bladder cancer,
miR-127 is silenced by promoter hypermethylation (29). In similar fashion, miR-148a is
epigenetically silenced in human cancer cell lines established from
lymph node metastasis from colon, melanoma, and head/neck,
suggesting that epigenetic loss of miR-148 is associated with
progressive changes such as development of metastatic potential
(24). All of these observations
indicate direct interactions as well as cross-talk between the DNA
methylation machinery and miRs.
In the present study, we analyzed breast cancer cell
lines for differential expression of regulatory miRs to determine
if loss of miR-mediated post-transcriptional regulation of
DNMT3b represents the molecular mechanism that governs the
overexpression of DNMT3b which drives the hypermethylation defect
in breast cancer. The results show that multiple miRs (miR-29c,
miR-148a, miR-148b, miR-26a, miR-26b, and miR-203)
post-transcriptionally regulate DNMT3b in combination and
loss of expression of these regulatory miRs contributes to DNMT3b
overexpression in hypermethylator cell lines. We also observed that
enforced expression of regulatory miRs results in reduced
DNMT3b mRNA levels in hypermethylator breast cancer cell
lines, and that down-regulation of regulatory miRs results in
increased DNMT3b mRNA levels in non-hypermethylator breast
cancer cell lines. These observations combine to suggest that the
loss of multiple regulatory miRs that post-transcriptionally
regulate DNMT3b levels is involved in the molecular mechanism
governing the DNMT3b-mediated hypermethylation defect in breast
cancer cell lines.
Materials and methods
Cell lines and growth conditions
Human breast cancer cell lines BT20 (ATCC no.
HTB19), BT549 (HTB122), Hs578T (HTB126), MCF7 (HTB22), MDA-MB-231
(HTB26), MDA-MB-415 (HTB128), MDA-MB-435S (HTB129), MDA-MB-436
(HTB130), MDA-MB-453 (HTB131), MDA-MB-468 (HTB132), SKBR3 (HTB30),
and ZR-75-1 (CRL-1500) were obtained from the Tissue Culture Core
Facility of the University of North Carolina Lineberger
Comprehensive Cancer Center (Chapel Hill, NC). Human breast cancer
cell lines SUM102, SUM149, and SUM185 were a gift from the
laboratories of Dr Carolyn I. Sartor (Department of Radiation
Oncology, UNC School of Medicine, Chapel Hill, NC) and Dr Stephen
Ethier (Department of Pathology, Wayne State University School of
Medicine, Detroit, MI). Human breast cancer cell line HCC1937
(CRL-2336) was a gift from the laboratory of Dr William K. Kaufmann
(Department of Pathology and Laboratory Medicine, UNC School of
Medicine). The normal breast epithelial cell line MCF12A
(CRL-10782) was obtained from the ATCC (American Type Culture
Collection, http://www.atcc.org/). Cell lines were
propagated in growth medium recommended by the ATCC, except for
SUM102, SUM149, and SUM185 cells which were cultured in 1:1 mixture
of Dulbecco’s modified Eagle’s medium and Ham’s F12 (DMEM/F12,
Gibco/Invitrogen Life Technologies, Carlsbad, CA) medium
supplemented with 10% horse serum (Gibco/Invitrogen Life
Technologies), and 1% antibiotic-antimycotic (Gibco/Invitrogen Life
Technologies). Growth medium was refreshed three times weekly
unless otherwise specified for antagomir and pre-miR transfections.
Cells were maintained at 37°C and 5% CO2 (except for
MDA-MB-468 which was propagated in 100% atmospheric air).
RNA extraction for gene expression
analysis
Total RNA for gene expression analysis and miR
expression analysis was isolated from breast cancer cell lines,
MCF12A (normal mammary epithelial cell line), and transfected cell
lines (antagomir or pre-miR transfected) utilizing the method of
Chomczynski and Sacchi (30),
modified for TRIzol Reagent (Invitrogen Life Technologies,
Carlsbad, CA), according to the manufacturer’s protocol. Nucleic
acid samples were DNAse (Cat no. M610A; Promega, Madison, WI)
treated (0.02 U/μl at 37°C for 30 min), and purified using
the Qiagen RNeasy mini-kit (Cat no. 74104; Qiagen, Valencia, CA).
Isolated RNA was quantified after extraction using a Nanodrop
Spectrophotometer (NanoDrop Technologies, Wilmington, DE).
MicroRNA expression analysis
DNMT3b is subject to miR-mediated
post-translational regulation. The miR-29 family (miR-29a, miR-29b,
miR-29c) has been implicated in DNMT3b dysregulation in lung
cancer (26) and acute myeloid
leukemia (27), and the miR-148
family (miR-148a, miR-148b) has been implicated in DNMT3b
dysregulation in cell lines of multiple origins, including the
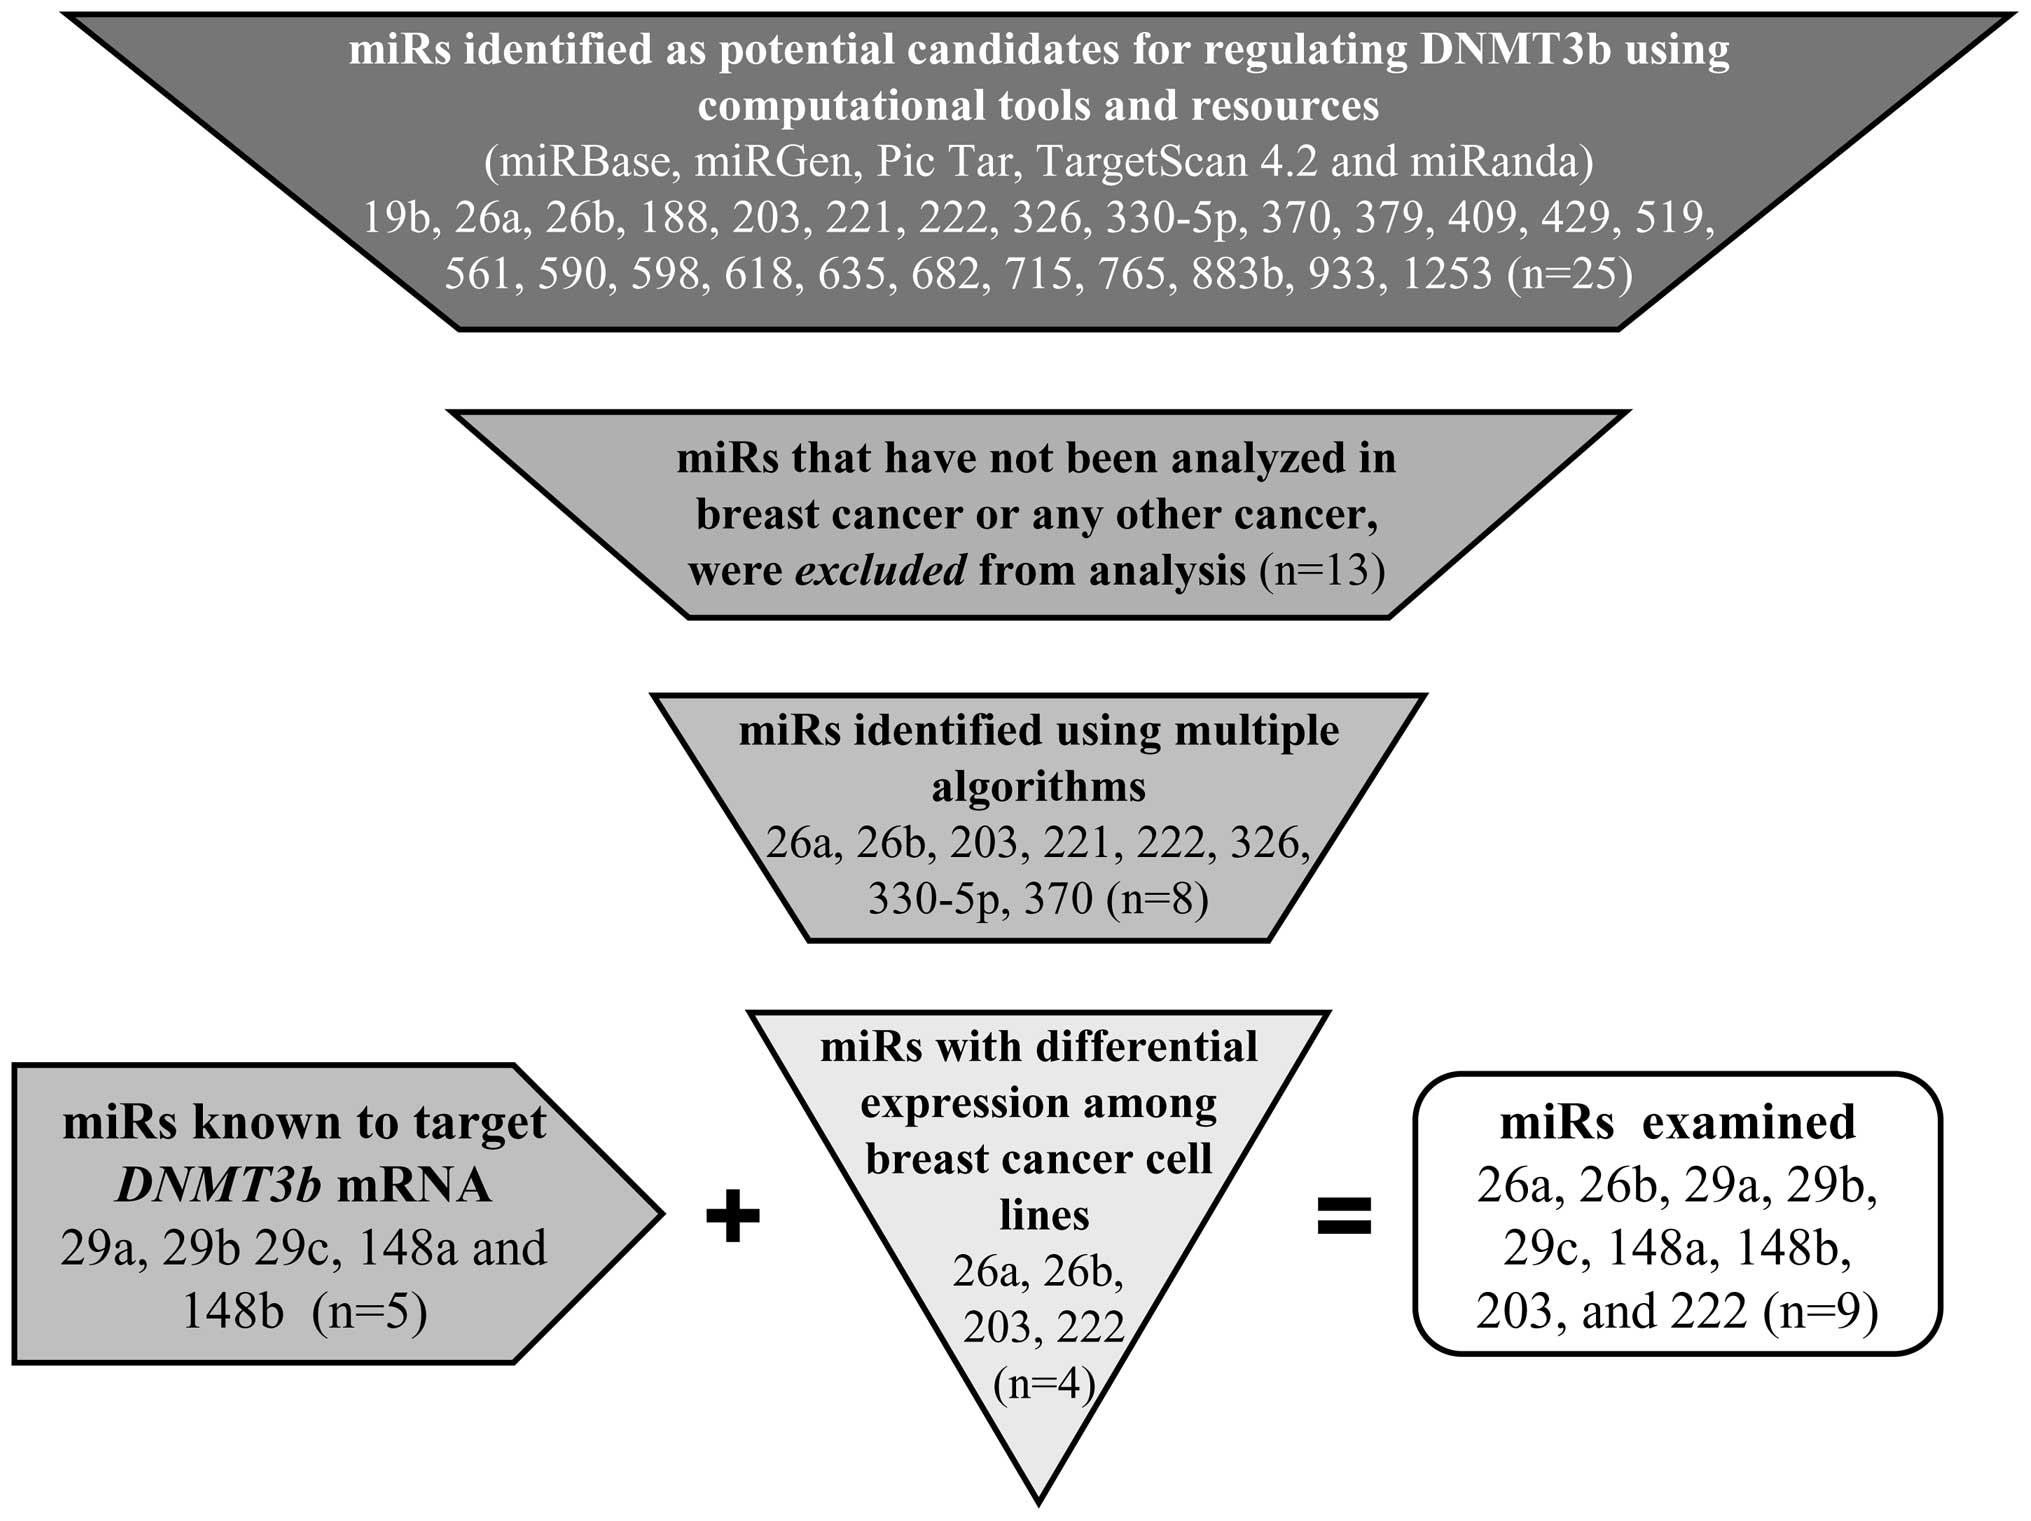
MCF-7 breast cancer cell line (28). We identified candidate miRs as
potential regulators of DNMT3b using the computational tools
of target prediction programs and resources from publicly available
databases, including Miranda (http://www.microRNA.org/), TargetScan (http://www.targetscan.org/vert_42/), miRGen
(http://www.diana.pcbi.upenn.edu/miRGen/v3/miRGen.html),
PicTar (http://pictar.mdc-berlin.de/), and
miRBase (http://microrna.sanger.ac.uk/sequences/) computing for
target predictions based on searches using Gene symbol DNMT3b
(Entrez Gene ID 1789 and Ensembl Gene ID ENSG00000088305). Based on
high stringency in silico selection criteria that included
PicTar score (indicative of HMM maximum likelihood fit), highly
conserved miRs, and good mirSVR scores (indicative of seed-site
pairing, site context, free-energy, and conservation), we
identified 25 additional miRs that potentially target DNMT3b
(Fig. 1). We prioritized the
candidate miRs based on the available literature and/or their
recognition as potential candidates by multiple target prediction
programs (Fig. 1). miRs that were
differentially expressed among breast cancer cells in primary
tumors (23) and cell lines
(31) were considered for further
analysis. Based upon this computational analysis, we selected nine
miRs for examination: miR-29a, miR-29b, miR-29c, miR-148a,
miR-148b, miR-26a, miR-26b, miR-203, and miR-222 (Fig. 1).
miR expression analysis was accomplished by
real-time PCR utilizing an ABI 7500 real-time PCR System (Applied
Biosystems, Foster City, CA) according to TaqMan miRNA assay
protocol (Applied Biosystems). Total RNA samples (10 ng) were
reverse transcribed using the TaqMan MiRNA Reverse Transcription
Kit (Part no. 4366596 Applied Biosystems) and TaqMan miRNA specific
primers (Applied Biosystems) according to the manufacturer’s
protocol. Real-time primers and probes for miR-29a (Assay ID
000412), miR-29b (Assay ID 000413), miR-29c (Assay ID 000415),
miR-148a (Assay ID 000470), miR-148b (Assay ID 000471), miR-26a
(Assay ID 000405), miR-26b (Assay ID 000407), miR-203 (Assay ID
000507), miR-222 (Assay ID 002276), and RNU66 (Assay ID 001002)
were purchased from Applied Biosystems. These assays specifically
detect mature miRNAs (not pre-miRNAs). All real-time PCR reactions
were performed in triplicate using TaqMan Universal PCR Master Mix
(Cat no. 4324018, Applied Biosystems) in 20 μl volume
containing 10 μl TaqMan Universal PCR Master Mix, 1
μl of primers and probe mix of the miR-specific TaqMan
MicroRNA Assay (Applied Biosystems), 1.33 μl of RT product,
and 7.67 μl of nuclease free water and the following
amplification conditions: 95°C for 10 min, 40 cycles of 95°C for 15
sec and 60°C for 1 min. Relative expression levels for each miR
were calculated based upon the expression of RNU66 and differences
in gene expression were determined relative to MCF-12A using the
comparative Ct method described in the ABI PRISM 7700
User Bulletin no. 2 (Applied Biosystems).
Gene expression analysis
Gene expression analysis was accomplished by
real-time PCR utilizing an ABI 7500 Real-Time PCR System (Applied
Biosystems). Total RNA samples (2 μg) were reverse
transcribed using the High Capacity cDNA Reverse Transcription Kit
(Part no. 4368814 Applied Biosystems) according to the
manufacturer’s protocol. Real-time primers and probes for
CEACAM6 (Hs00366002_m1), CST6 (Hs00154599_ m1),
DNMT3b (Hs00171876_m1), SCNN1A (Hs00168906_m1), and
β-actin (Hs99999903_m1) were purchased from Applied Biosystems. All
real-time PCR reactions were performed in triplicate using TaqMan
Universal PCR Master Mix (Cat no. 4324018, Applied Biosystems) in
20 μl volume (10 μl TaqMan Universal PCR Master Mix,
1.0 μl TaqMan Real-time primers and probes, and 9 μl
cDNA and nuclease-free water) and the following amplification
conditions: 95°C for 10 min, 40 cycles of 95°C for 15 sec and 60°C
for 1 min. Relative expression levels for each gene were calculated
based upon the expression of β-actin for each cell line and
differences in gene expression were determined relative to MCF-12A
using the comparative Ct method described in the ABI
Prism 7700 User Bulletin no. 2 (Applied Biosystems).
DNMT3b protein expression in breast
cancer cell lines
Cultured breast cancer cell lines, MCF12A (normal
mammary epithelial cell line), and transfected cell lines
(antagomir or pre-miR transfected) were lysed in phosphate buffered
saline (137 mM NaCl, 2.7 mM KCl, 8 mM Na2PO4,
2 mM KH2PO4, pH 7.4) containing 0.1 mM
phenylmethanesulphonylfluoride, 1 μg/ml pepstain A, 1
μg/ml leupeptin, 1 μg/ml aprotinin, 1 mM β-glycerol
phosphate, 1 mM sodium orthovanadate, and 0.1% Triton X-100. Cell
lysates were utilized for western blot analysis using standard
methods. Protein concentrations were determined using the Bradford
assay (Bio-Rad Quick Start Bradford, Cat no. 500-0205). Protein
lysates (20–40 μg) were resolved on 8% SDS-PAGE gels,
followed by transfer onto polyvinylidene difluoride (PVDF)
membranes (Cat no. 162-0184, Bio-Rad Sequi-Blot PVDF, 0.2 μM
pore size, Millipore, Billerica, MA). PVDF membranes were blocked
for 30 min in TBST (10 mM Tris-Cl, pH 7.6, 150 nM NaCl, 1%
Tween-20) containing 5% milk, and then incubated with either
anti-DNMT3b mouse monoclonal antibody (Cat no. IMG-184A Imgenex,
San Diego, CA) diluted 1:5000 or anti-actin rabbit polyclonal
antibody diluted 1:10,000 (Cat no. sc-1616 Santa Cruz
Biotechnology, Santa Cruz, CA) overnight in TBST containing 1%
milk. Subsequently, membranes were washed with TBST 3 times for 5
min, and then incubated with a sheep anti-mouse (1:5000, Cat no.
NA931 GE Healthcare, Piscataway, NJ) or donkey anti-rabbit
(1:10,000, Cat no. NA934 GE Healthcare) horseradish
peroxidase-conjugated secondary antibody in TBST containing 1% milk
for 1 h at room temperature. The membranes were washed with TBST 3
times for 10 min each, and bound primary antibody was detected
using ECL-Plus substrate (GE Healthcare).
Breast cancer cell line transfection with
pre-miRs
Hypermethylator cell lines Hs578T, HCC1937, and
SUM185 were selected for pre-miR transfection with miR-148b,
miR-26b, and miR-29c. These cell lines exhibit DNMT hyperactivity,
express DNMT3b at high levels (10), and exhibit negligible levels of
expression of miR-26b, miR-29c, and miR-148b. All pre-miR
transfections were performed in triplicate. Pre-miR miRNA
precursors (miR-148b, PM10264; miR-26b, PM12899; miR-29c, PM10518)
and standard control oligomers were obtained from Applied
Biosystems. For optimization purposes, the Pre-miR miRNA Precursor
Starter Kit (Applied Biosystems) was utilized for the reverse
transfection procedure according to the manufacturer’s protocol
using siPORT NeoFX Transfection Agent (Part no. AM4510,
Applied Biosystems). Four concentrations of transfection reagent
(9, 12, 15 and 18 μl) were tested to obtain optimum
conditions for pre-miR transfections for each cell line.
Transfection reagent was diluted to 300 μl with opti-MEM
(Gibco/Invitrogen Life Technologies), incubated for 10 min at room
temperature, 24 μl of 6.25 nM of Pre-miR hsa-miR-1 miRNA
precursor or Pre-miR negative control no. 1 was diluted to 300
μl with opti-MEM for final concentration of 50 nM and gently
mixed with diluted transfection agent before incubating for 10 min
at room temperature. The transfection complexes were dispensed into
6-well culture plates, and non-transfected controls were set up in
parallel. Cells (2.4×10⁵) were transferred in 2.4 ml of
growth medium per well and incubated at recommended growth
conditions. After 24 h, the culture medium was replaced with fresh
normal growth medium. Two days after transfection, total RNA was
extracted from transfected and control cells. The expression level
of PTK9 mRNA (target of pre-miR miR-1 miRNA precursor) was assessed
by real-time PCR (Hs00702289_s1, Applied Biosystems) according to
the manufacturer’s instructions. Optimal transfection was observed
with 12 μl transfection reagent in each cell line, producing
75–90% reduction of PTK9 mRNA after transfection with
Pre-miR miR-1. Hs578T, SUM185, and HCC1937 cells were transfected
with pre-miR precursors for miR-148b, miR-26b and miR-29c employing
the optimized conditions. After 48 h, total RNA was harvested for
real-time PCR analysis for miR and gene expression analyses. In
addition, transfected and control cells were lysed for western blot
analysis (as described above).
Breast cancer cell line transfection with
antagomirs
Non-hypermethylator cell lines BT20, MDA-MB-415, and
MDA-MB-468 were selected for antagomir transfection with miR-148b,
miR-26b, and miR-29c. These cell lines have lower DNMT activity,
express DNMT3b at low levels (10), and exhibit normal levels of
expression of miR-26b, miR-29c, and miR-148b. All antagomir
transfections were performed in triplicate. Antagomirs (miR-148b,
AM10264; miR-26b, AM12899; miR-29c, AM10518) and standard control
oligomers were obtained from Applied Biosystems. For optimization
of transfection conditions, the reverse transfection procedure was
performed using four concentrations of transfection reagent (9, 12,
15 and 18 μl), as described for pre-miR transfections.
Transfection reagent was diluted to 300 μl with opti-MEM
(Gibco/Invitrogen Life Technologies), incubated for 10 min at room
temperature, 24 μl of 6.25 nM of Anti-miR let-7c miRNA
inhibitor positive control or Anti-miR negative control no. 1 was
diluted to 300 μl with opti-MEM for final concentration of
50 nM and gently mixed with diluted transfection agent before
incubating for 10 min at room temperature. Levels of HMGA2
mRNA (target of Anti-miR let-7c miRNA inhibitor positive control)
were assessed by real-time PCR (Hs00171569_m1, Applied Biosystems)
after RNA extraction. Optimal transfection was observed with 12
μl transfection reagent in each cell line, producing 1.8-to
2.4-fold increases in HMGA2 mRNA after transfection with Anti-miR
let-7c miRNA inhibitor. BT20, MDA-MB-415, and MDA-MB-468 cells were
transfected with antagomirs for miR-148b, miR-26b, and miR-29c, and
after 48 h, total RNA was harvested for real-time PCR analysis for
miR and gene expression analyses. In addition, transfected and
control cells were lysed for western blot analysis (as described
above).
Statistical analysis
The values for the mean and standard error of the
mean (SEM) were calculated using the statistical function of
Microsoft Excel 2007. Statistical significance was determined using
an unpaired t-test (two-tailed). Error bars depicted in bar graphs
represent SEM of 3–6 independent experiments.
Results
Hypermethylator breast cancer cell lines
express diminished levels of regulatory miRs
Previous investigations identified a
hypermethylation defect in a subset of breast cancer cell lines
(10). Hypermethylator cell lines
display DNMT hyperactivity and overexpression of DNMT3b, in
contrast to non-hypermethylator cell lines (10). In the present study, we are
investigating possible molecular mechanisms governing DNMT3b
overexpression in hypermethylator cell lines, with a focus on
miR-mediated regulation of DNMT3b. Hence, we examined the
levels of expression of select miRs that are known or predicted to
regulate DNMT3b (miR-26a, miR-26b, miR-29a, miR-29b,
miR-29c, miR-148a, miR-148b, miR-203, miR-222) among breast cancer
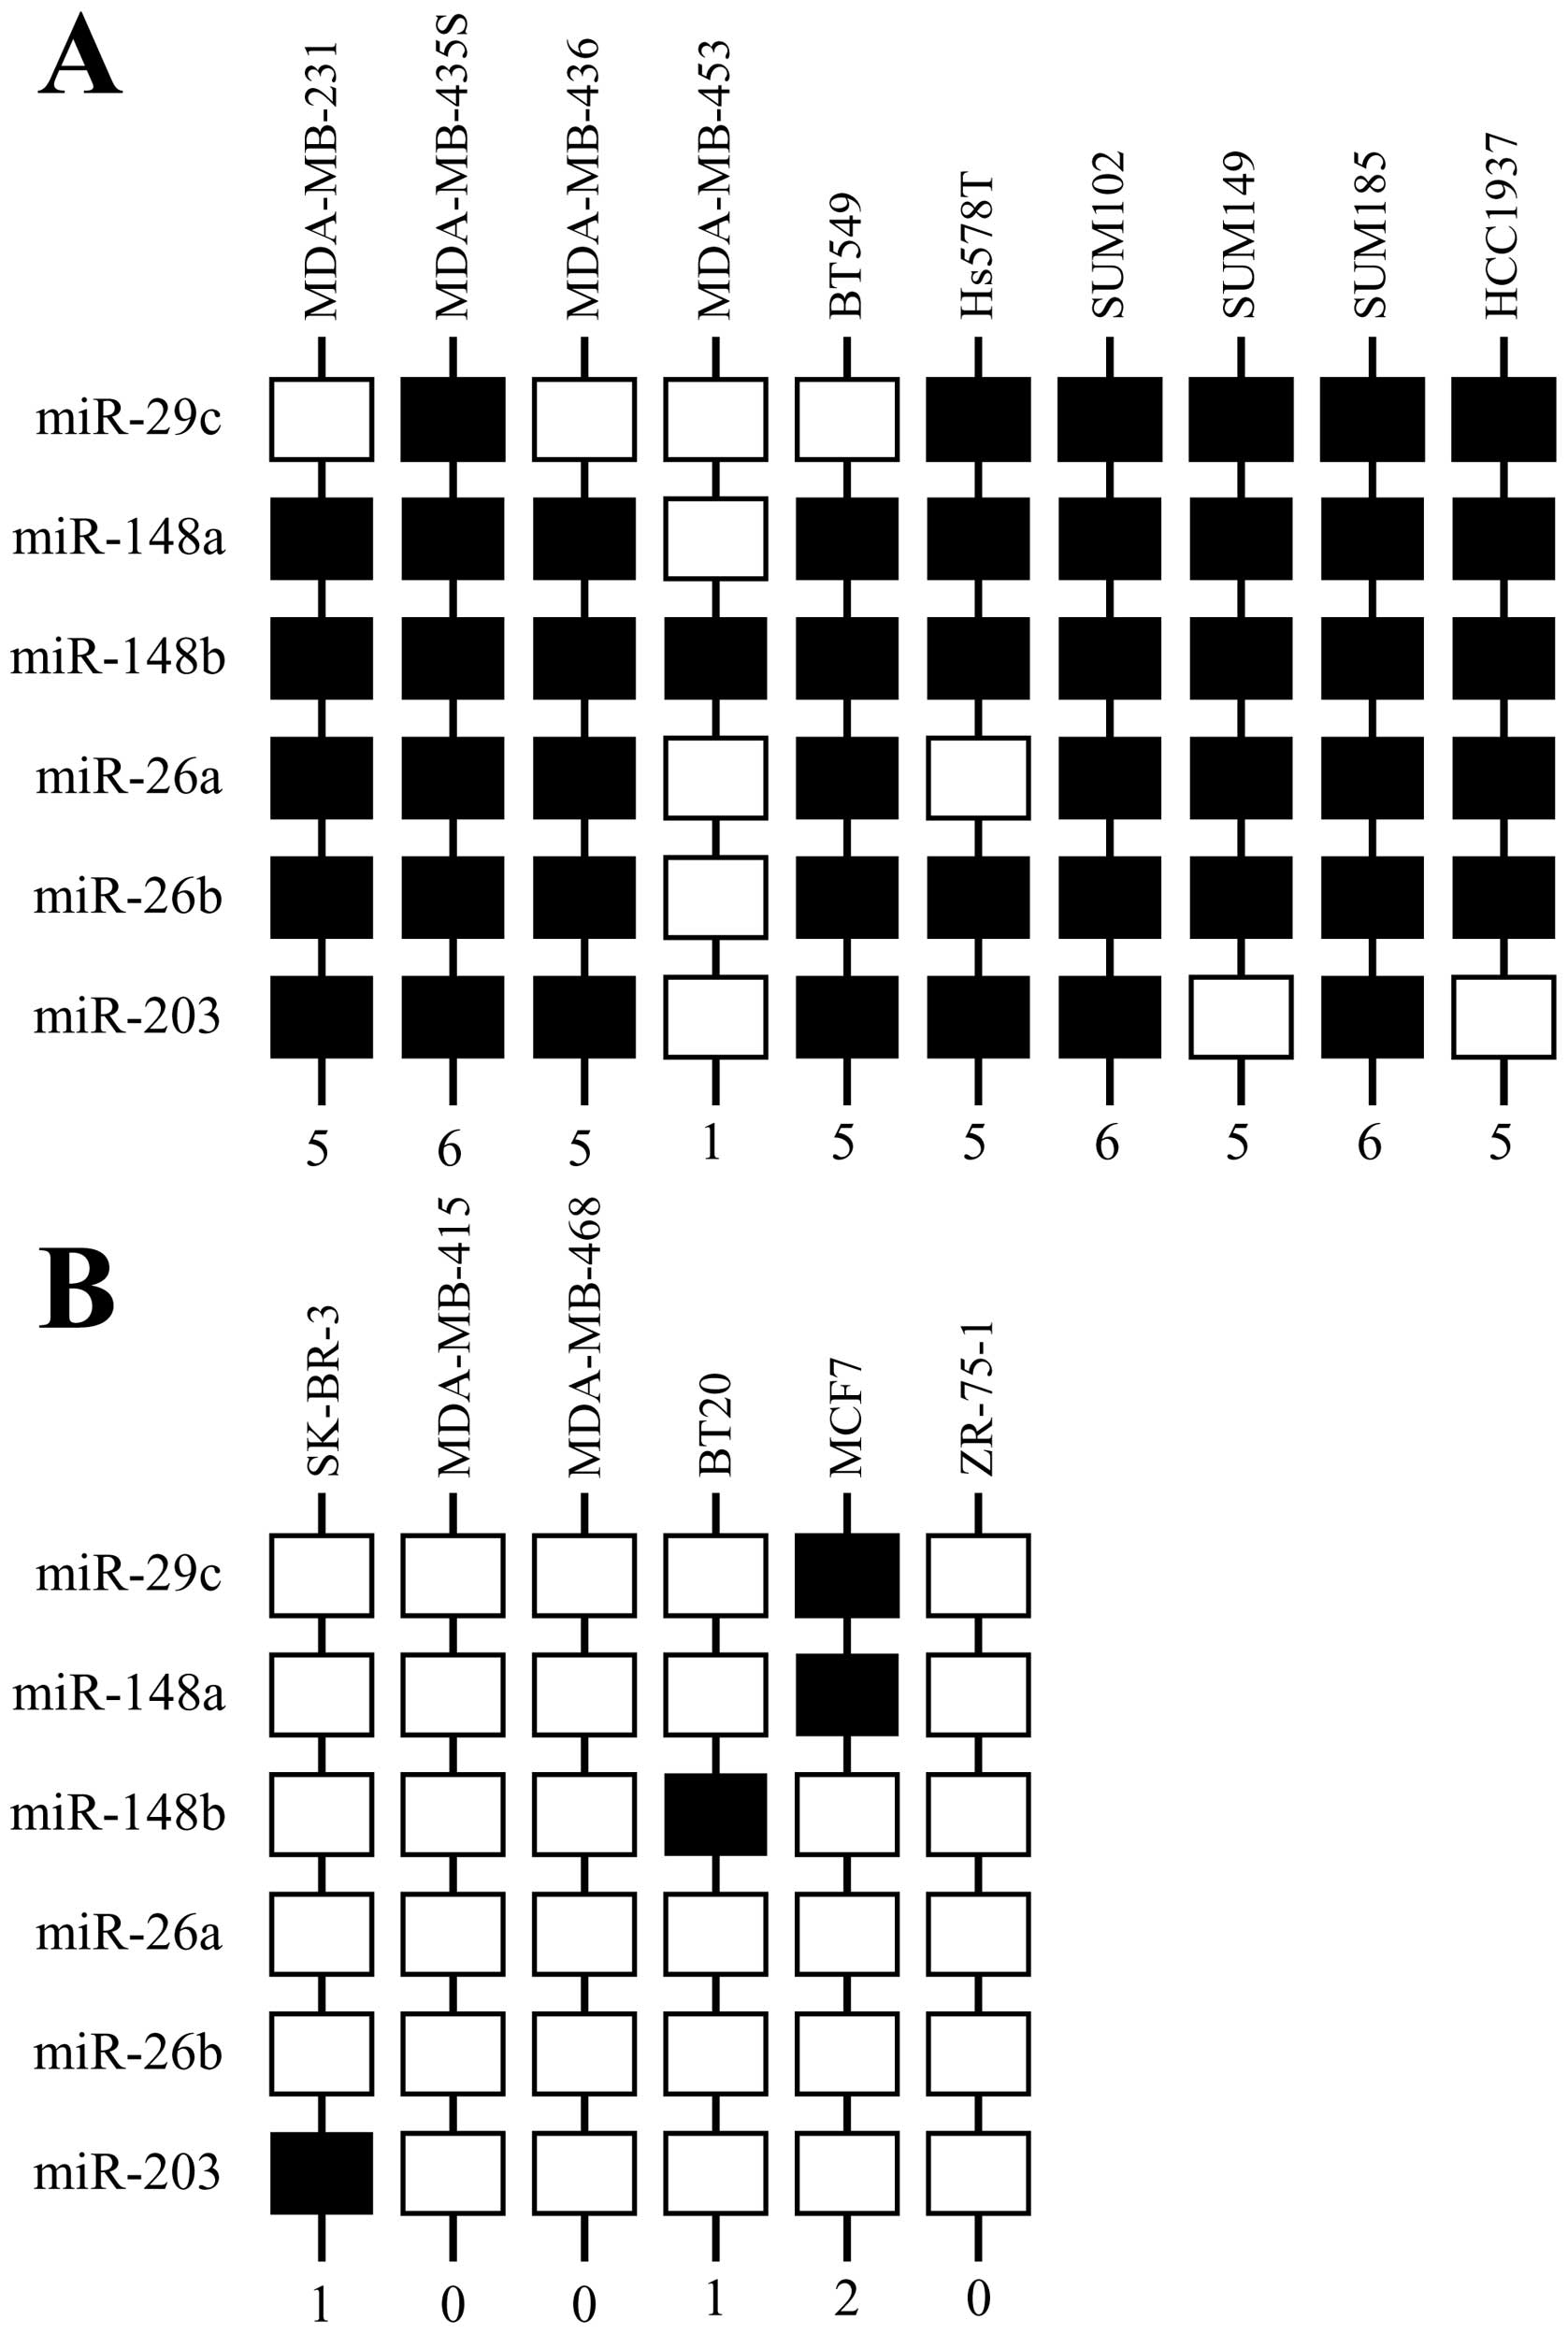
cell lines that differentially express DNMT3b. Ten of these
cell lines express the hypermethylation defect (BT-549, HS578T,
HCC1937, MDA-MB-231, MDA-MB-435S, MDA-MB-436, MDA-MB-453, SUM102,
SUM149, SUM185) and six are non-hypermethylators (BT-20, MCF-7,
MDA-MB-415, MDA-MB-468, SK-BR-3, ZR-75-1) (10,32; unpublished
data). Differential levels of miR expression were observed for six
of the nine miRs evaluated, including miR-26a, miR-26b, miR-29c,
miR-148a, miR-148b, and miR-203 (Fig.
2A). While there was variability in expression among the miRs
examined, in general the hypermethylator cell lines expressed
diminished levels compared to the non-hypermethylator cell lines
(Fig. 2B–G). miR-29a, miR-29b, and
miR-222 did not display the pattern of expression observed with the
majority of miRs. miR-29a and miR-29b were expressed at similar
levels among breast cancer cell lines irrespective of their
methylation status. The lack of differential expression of these
miRs is evident from a comparison of average levels in
hypermethylator and non-hypermethylator cell lines (Fig. 2A). In contrast to the pattern
observed with other miRs, the average expression of miR-222 among
hypermethylator cell lines was higher than in non-hypermethylator
cell lines. This is consistent with the suggestion that miR-222
functions as an oncogenic miR (33,34).
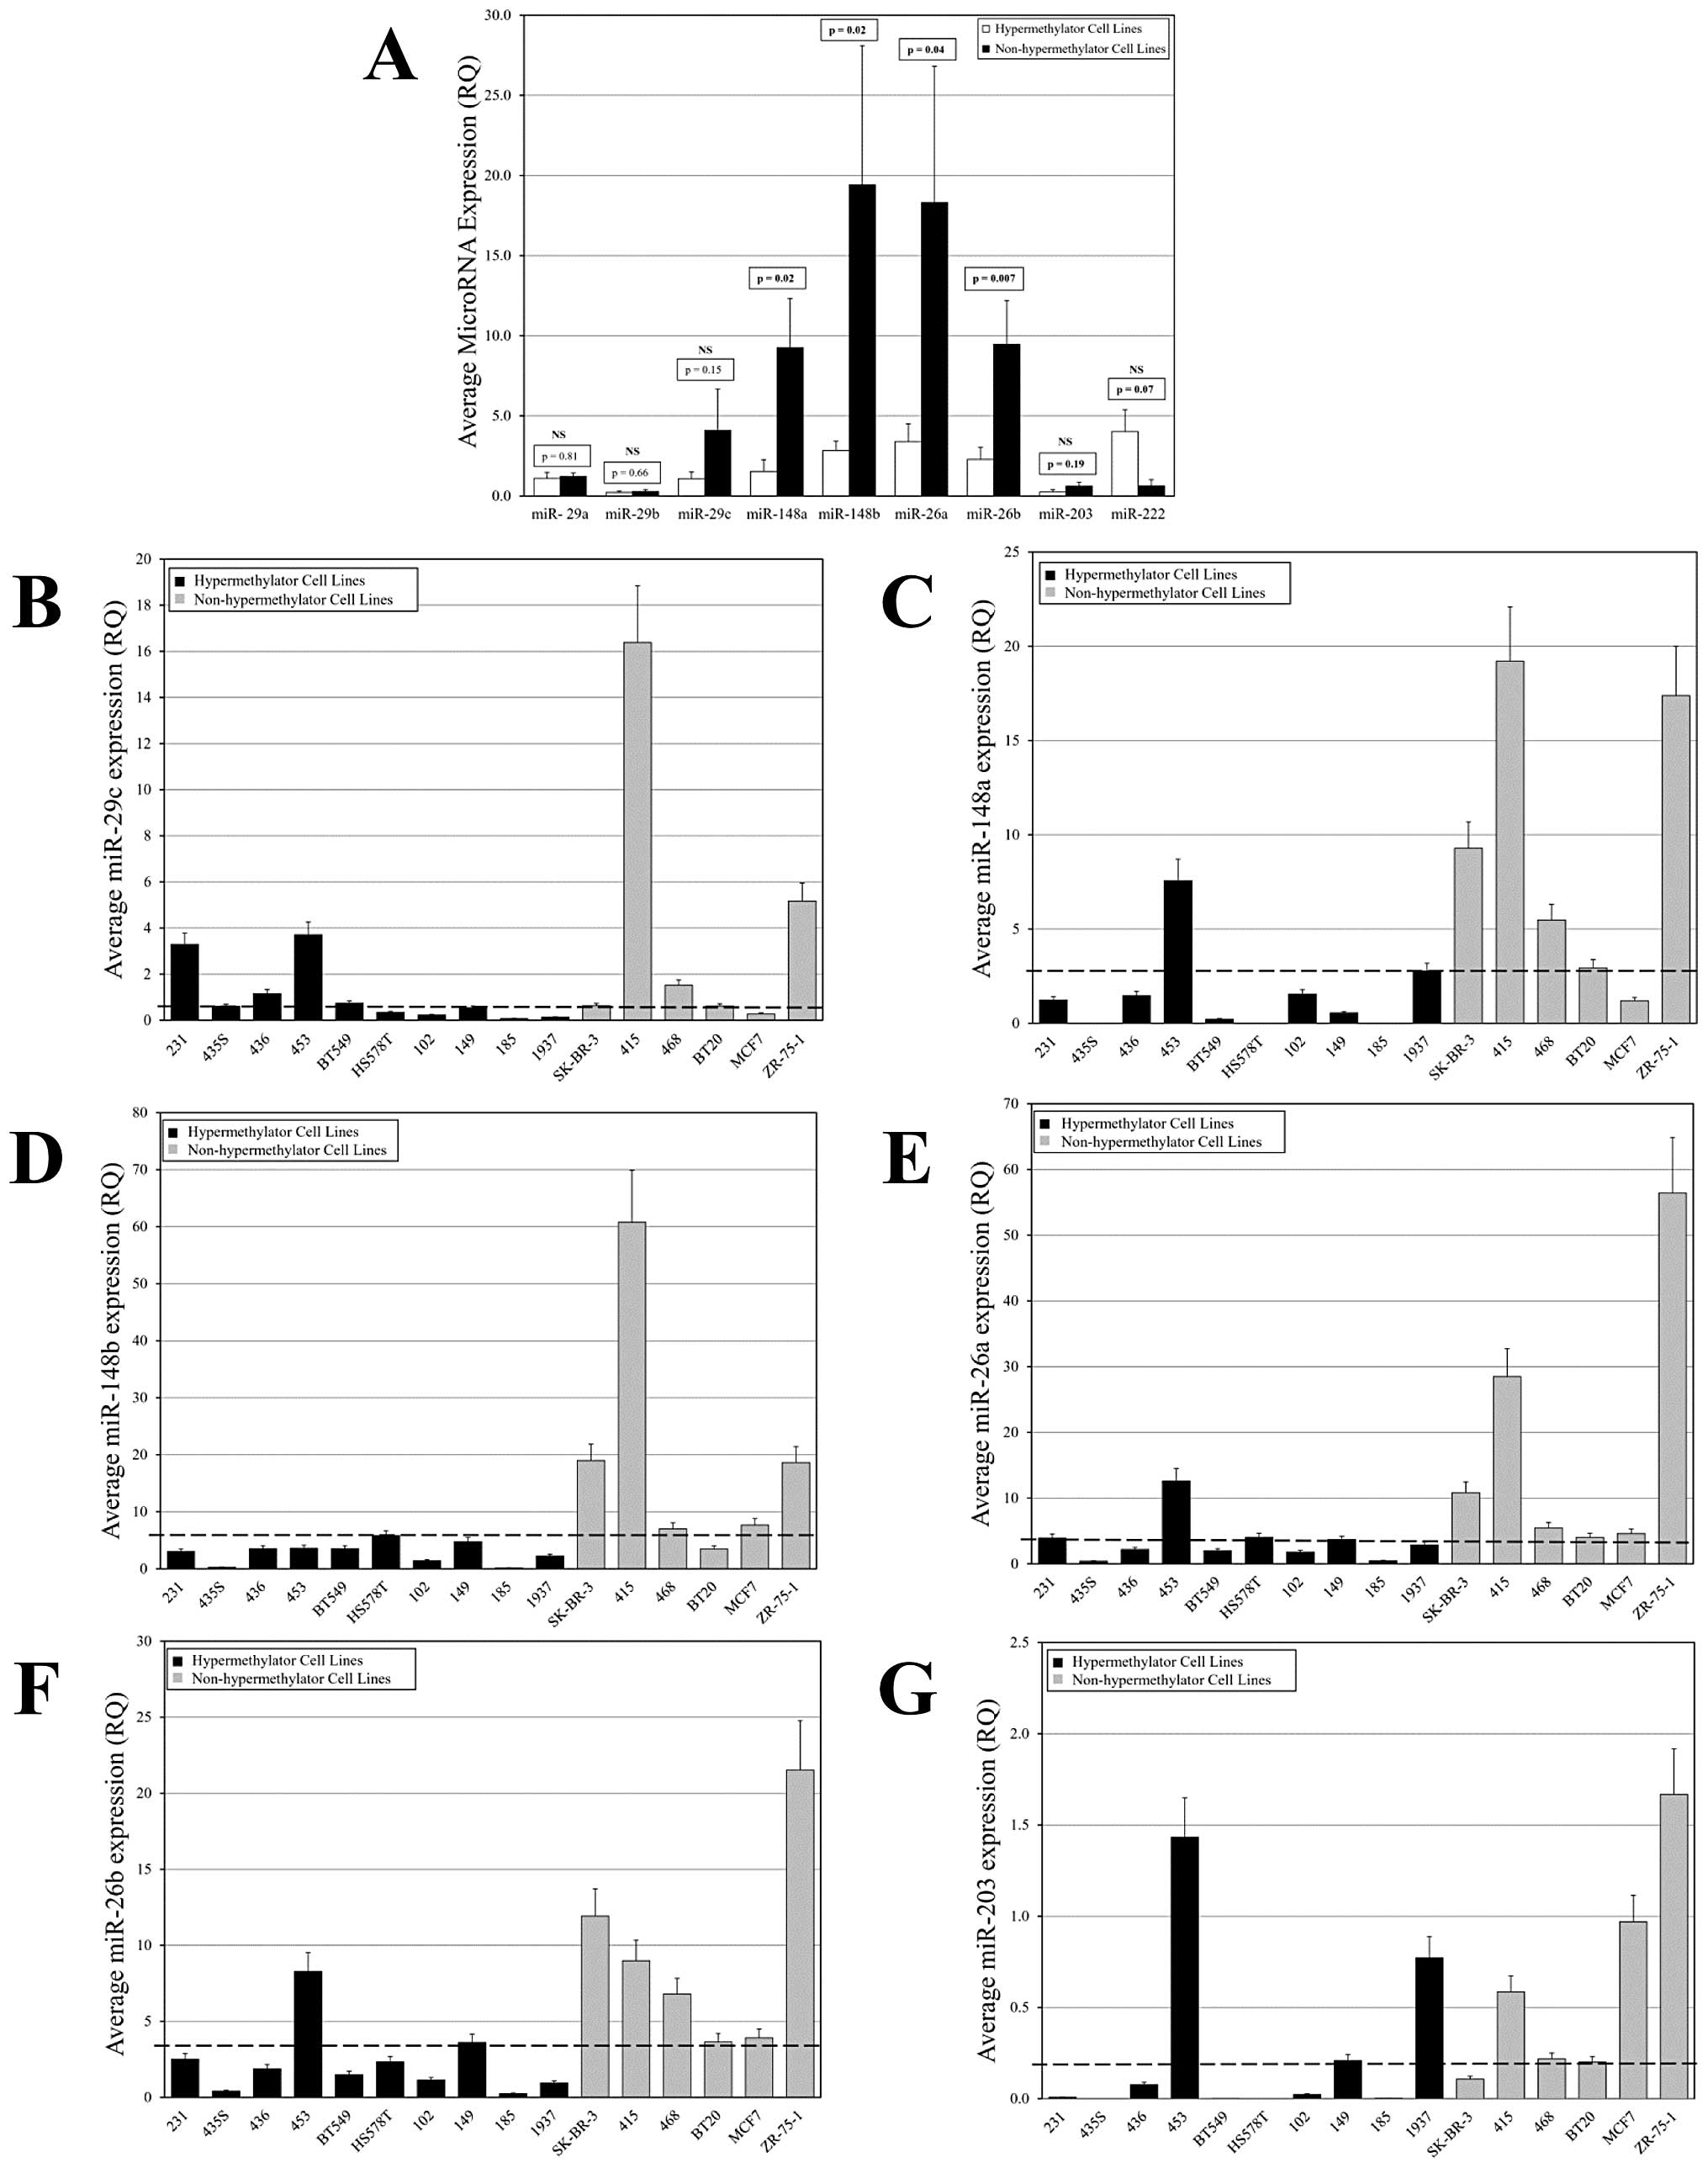 | Figure 2Differential miR expression among
hypermethylator and non-hypermethylator breast cancer cell lines.
(A) White bars represent average miR expression among
hypermethylator cell lines (n=10), and black bars represent average
miR expression among non-hypermethylator cell lines (n=6).
Comparison of the observed expression levels between
hypermethylator cell lines and non-hypermethylator cell lines was
accomplished using an unpaired t-test (two-tailed) and
corresponding p-values are given (NS, not significant). (B–G)
Analysis of miR expression levels among hypermethylator and
non-hypermethylator breast cancer cell lines. Hypermethylator cell
lines are represented by black bars and non-hypermethylator cell
lines are represented by gray bars. The dashed line represents the
optimal threshold value determined by Bayesian analysis for correct
assignments related to the hypermethylator status of individual
cell lines. Each real-time assay was performed in triplicate and
error bars represent 15% SEM. MDA-MB-231, MDA-MB-415, MDA-MB-435s,
MDA-MB-436, and MDA-MB-453 cell lines are designated 231, 415,
435s, 436, and 453, respectively; SUM102, SUM149, and SUM185 cell
lines are represented as 102, 149, and 185, respectively; and
HCC1937 is labeled 1937. (B) miR-29c expression, (C) miR-148a
expression, (D) miR-148b expression, (E) miR-26a expression, (F)
miR-26b expression and (G) miR-203 expression. |
The average expression of miR-148a, miR-148b,
miR-26a, and miR-26b among hypermethylator cell lines was
significantly diminished compared to the average expression of
these miRs among non-hypermethylator cell lines (p<0.05)
(Fig. 2A). Ten/ten (100%)
hypermethylator cell lines expressed low levels of miR-148b, and
5/6 (83%) non-hypermethylator cell lines express higher levels of
miR-148b (except BT20; Fig. 2D).
Likewise, miR-148a is expressed at low levels in 9/10 (90%)
hypermethylator cell lines (except MDA-MB-453) and the majority of
non-hypermethylator cell lines (5/6, 83%) express miR-148a at
higher levels (except MCF7; Fig.
2C). Eight/ten (80%) hypermethylator cell lines display low
levels of miR-26a expression (except Hs578T and MDA-MB-453),
whereas all non-hypermethylator cell lines (6/6, 100%) express
higher levels of miR-26a (Fig.
2E). Similarly, 9/10 (90%) hypermethylator cell lines express
low levels of miR-26b (except MDA-MB-453), and 5/6 (83%)
non-hypermethylator cell lines express higher levels of miR-26b
(except BT20; Fig. 2F).
Differences in average expression of miR-29c and miR-203 in
hypermethylator cell lines versus non-hypermethylator cell lines
were not statistically significant (Fig. 2A), although there was a distinct
trend towards lower expression in the hypermethylator cell lines
(p=0.15 and p=0.19). Six/ten (60%) of hypermethylator cell lines
expressed low levels of miR-29c (except MDA-MB-231, MDA-MB-436,
MDA-MB-453, and BT549) and 5/6 (83%) non-hypermethylator cell lines
demonstrated higher levels of miR-29c (except MCF7; Fig. 2B). The expression of miR-203 was
low in both hypermethylator and non-hypermethylator cell lines, but
with differential expression levels (Fig. 2G). Seven/ten (70%) of
hypermethylator cell lines expressed miR-203 at low or undetectable
levels (except MDA-MB-453, SUM149, and HCC1937), while 5/6 (83%)
non-hypermethylator cell lines expressed miR-203 at easily
detectable levels (except SK-BR-3).
Diminished expression of miR-29c,
miR-148a, miR-148b, miR-26a, miR-26b, and miR-203 predict
hypermethylator status among breast cancer cell lines
We observed differential expression of miR-26a,
miR-26b, miR-29c, miR-148a, miR-148b, and miR-203 among breast
cancer cell lines with strong trends towards diminished expression
in hypermethylators compared to non-hypermethylator cell lines
(Fig. 2A). To evaluate the value
of individual miR expression levels in the prediction of the
methylation status of a given breast cancer cell line, a Bayesian
analysis was performed. Threshold values were determined for each
of the differentially expressed miRs using correct assignments (CA)
as a guiding principle. These threshold values are indicated in
Fig. 2B–G. The expression levels
of five miRs emerged as excellent individual predictors of
methylator status among breast cancer cell lines: miR-148b (CA
94%), miR-26b (CA 94%), miR-148a (CA 88%), miR-26a (88%), and
miR-203 (CA 81%). These miRs individually displayed excellent
sensitivity (range 80–100%) and specificity (range 83–100%), as
well as excellent positive predictive value (PPV range: 89–100%)
and negative predictive value (NPV range 71–100%). The best
threshold value for miR-29c produced CA 69% (sensitivity, 60%;
specificity, 83%; PPV, 86%; and NPV, 56%). The remaining miRs
displayed poor predictive value for determination of methylation
status of breast cancer cell lines.
miR expression patterns and miR scores
for hypermethylator and non-hypermethylator breast cancer cell
lines
Six regulatory miRs were chosen for further analysis
based on excellent characteristics related to prediction of
methylation status (CA, sensitivity, specificity, PPV, and NPV)
among hypermethylator and non-hypermethylator breast cancer cell
lines, including miR-29c, miR-148a, miR-148b, miR-26a, miR-26b, and
miR-203. miR scores were generated for each breast cancer cell
line, reflecting the number of miRs with diminished expression.
Hypermethylator breast cancer cell lines frequently express
diminished levels of this panel of miRs. Nine/ten (90%)
hypermethylator cell lines express >5 miRs at diminished levels
(Fig. 3A), resulting in higher miR
scores. The exception to this is MDA-MB-453, which expresses
diminished levels of miR-148b only (Fig. 2D). Hence, MDA-MB-453 has a low miR
score reflecting higher levels of expression of the majority of
miRs examined (Fig. 3A). Three
hypermethylator cell lines (MDA-MB-435s, SUM102, SUM185) express
diminished levels of all six miRs examined (Fig. 3A). In contrast to the
hypermethylator cell lines, non-hypermethylator cell lines
typically express the majority of this panel of miRs at higher
levels. Five/six (83%) of non-hypermethylator cell lines express ≥5
miRs at higher levels (Fig. 3B),
resulting in lower miR scores. The exception was MCF7, which
expresses diminished levels of miR-29c and miR-148a (Fig. 2B and C). Three non-hypermethylator
cell lines (MDA-MB-415, MDA-MB-468, ZR-75-1) expressed higher
levels of all six miRs in this panel (Fig. 3B). Hypermethylator breast cancer
cell lines exhibit an average miR score of 4.9±0.46, whereas,
non-hypermethylator cell lines exhibit an average miR score of
0.67±0.33 (p<0.0001).
miR score correlates with gene expression
score and promoter methylation score
A linear correlation analysis was performed to
determine if miR score significantly associates with methylation
score and expression score for each breast cancer cell line.
Methylation score and expression score reflect the relative
promoter methylation status (number of hypermethylated gene
promoters) and the relative gene expression status (number of
methylation-sensitive genes expressed), respectively, for
methylation-sensitive biomarker genes associated with the
hypermethylation defect (CEACAM6, CDH1, CST6, ESR1, GNA11, MUC1,
MYB, TFF3 and SCNNIA) (10). A strong inverse correlation
(r=−0.66, p=0.0056) was observed between miR score and gene
expression score (Fig. 4A). Breast
cancer cell lines that exhibit diminished expression of multiple
regulatory miRs (high miR score) tend to express low levels of
methylation-sensitive genes (gene expression score) and cell lines
that express higher levels of regulatory miRs (low miR score) tend
to express methylation-sensitive genes at higher levels (Fig. 4A). A strong correlation (r=0.72,
p=0.002) was observed between miR score and methylation score
(Fig. 4B). Breast cancer cell
lines that exhibit diminished expression of multiple regulatory
miRs (high miR score) exhibit higher methylation scores and cell
lines that express higher levels of regulatory miRs (low miR score)
tend to have lower methylation scores (Fig. 4B). Previous studies demonstrated
significant relationships between overexpression of DNMT3b and gene
expression scores and methylation scores for methylation-sensitive
genes (10). The current results
strongly support the suggestion that loss of miR expression may
account for the DNMT3b-mediated hypermethylation defect among
breast cancer cell lines that is characterized by
methylation-dependent loss expression of methylation-sensitive
biomarker genes.
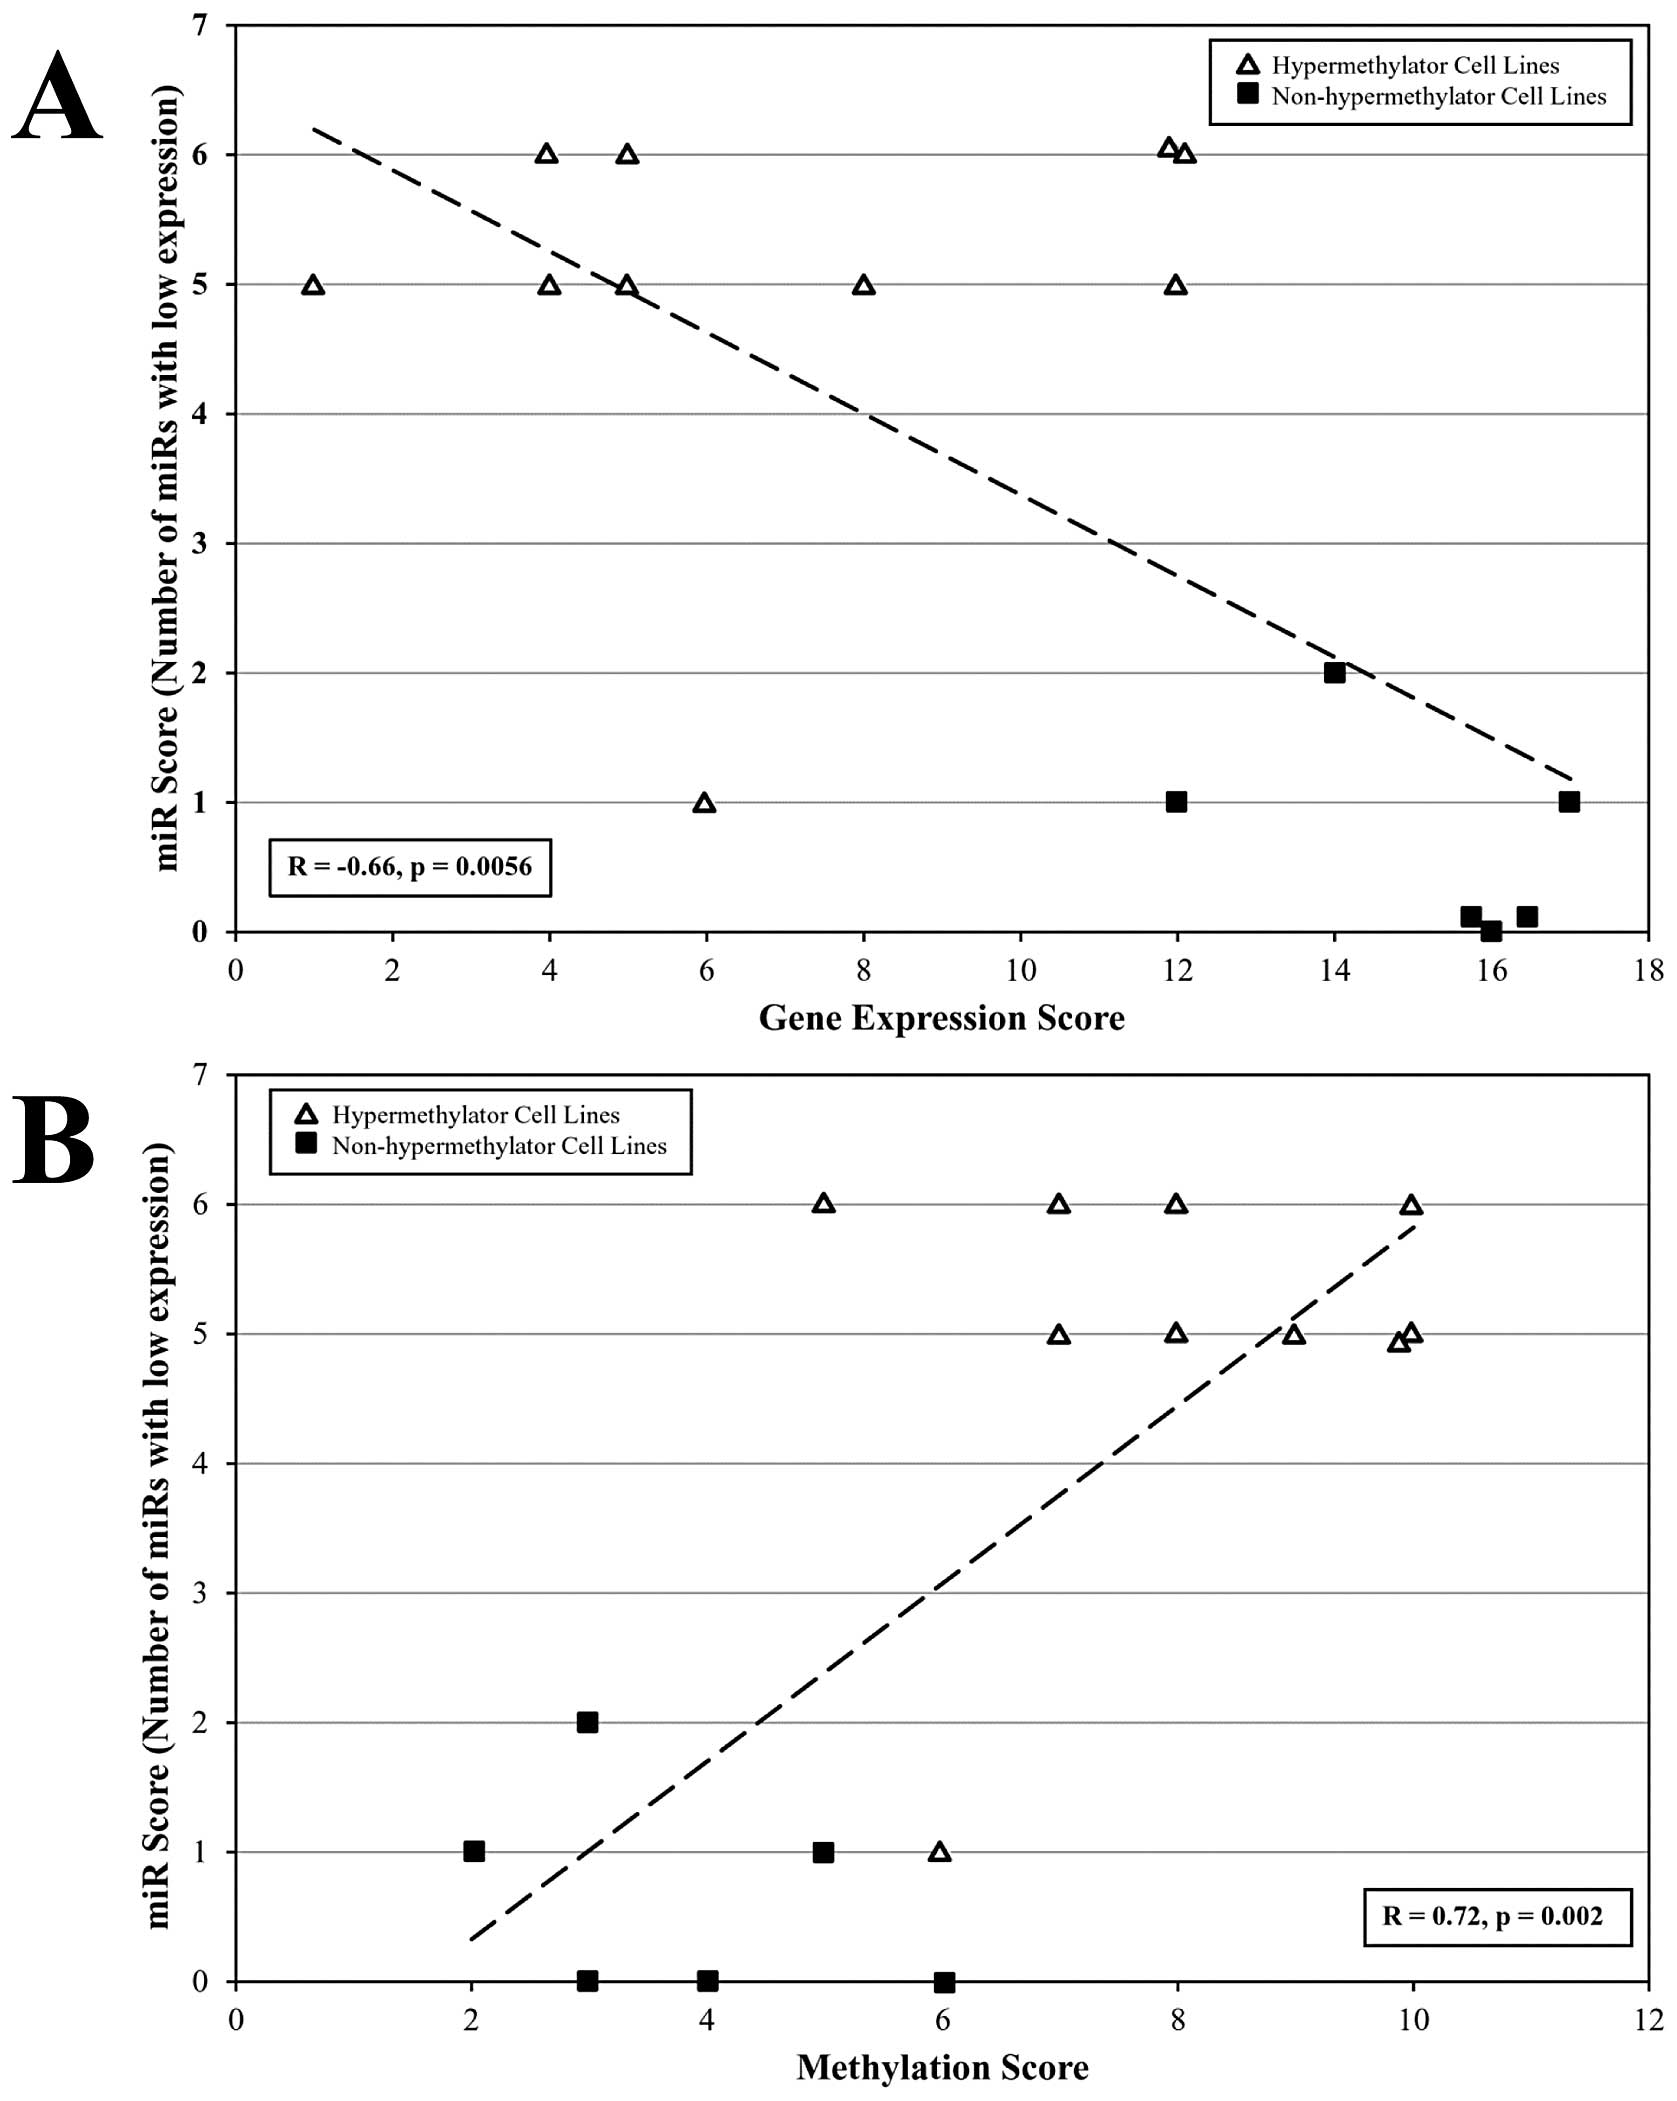 | Figure 4miR expression patterns correlate
with methylation-sensitive gene expression status and promoter
methylation status among breast cancer cell lines. Correlation of
miR expression patterns (miR score) with gene expression levels
(based on RT-PCR) and promoter methylation status (based on
methylation-sensitive PCR) for methylation-sensitive genes among
hypermethylator and non-hypermethylator breast cancer cell lines.
Scores were calculated for differentially expressed miRs (miR-29c,
miR-148a, miR-148b, miR-26a, miR-26b, and miR-203) and for
well-characterized methylation sensitive genes (CEACAM6, CDH1,
CST6, ESR1, GNA11, MUC1, MYB, TFF3, and SCNNIA).
Methylation-sensitive gene expression scores and promoter
methylation scores were taken from previous studies (10). (A) Relationship between miR score
and gene expression score among hypermethylator cell lines (open
triangles) and non-hypermethylator cell lines (black squares). (B)
Relationship between miR score and promoter methylation status
among hypermethylator cell lines (open triangles) and
non-hypermethylator cell lines (black squares). |
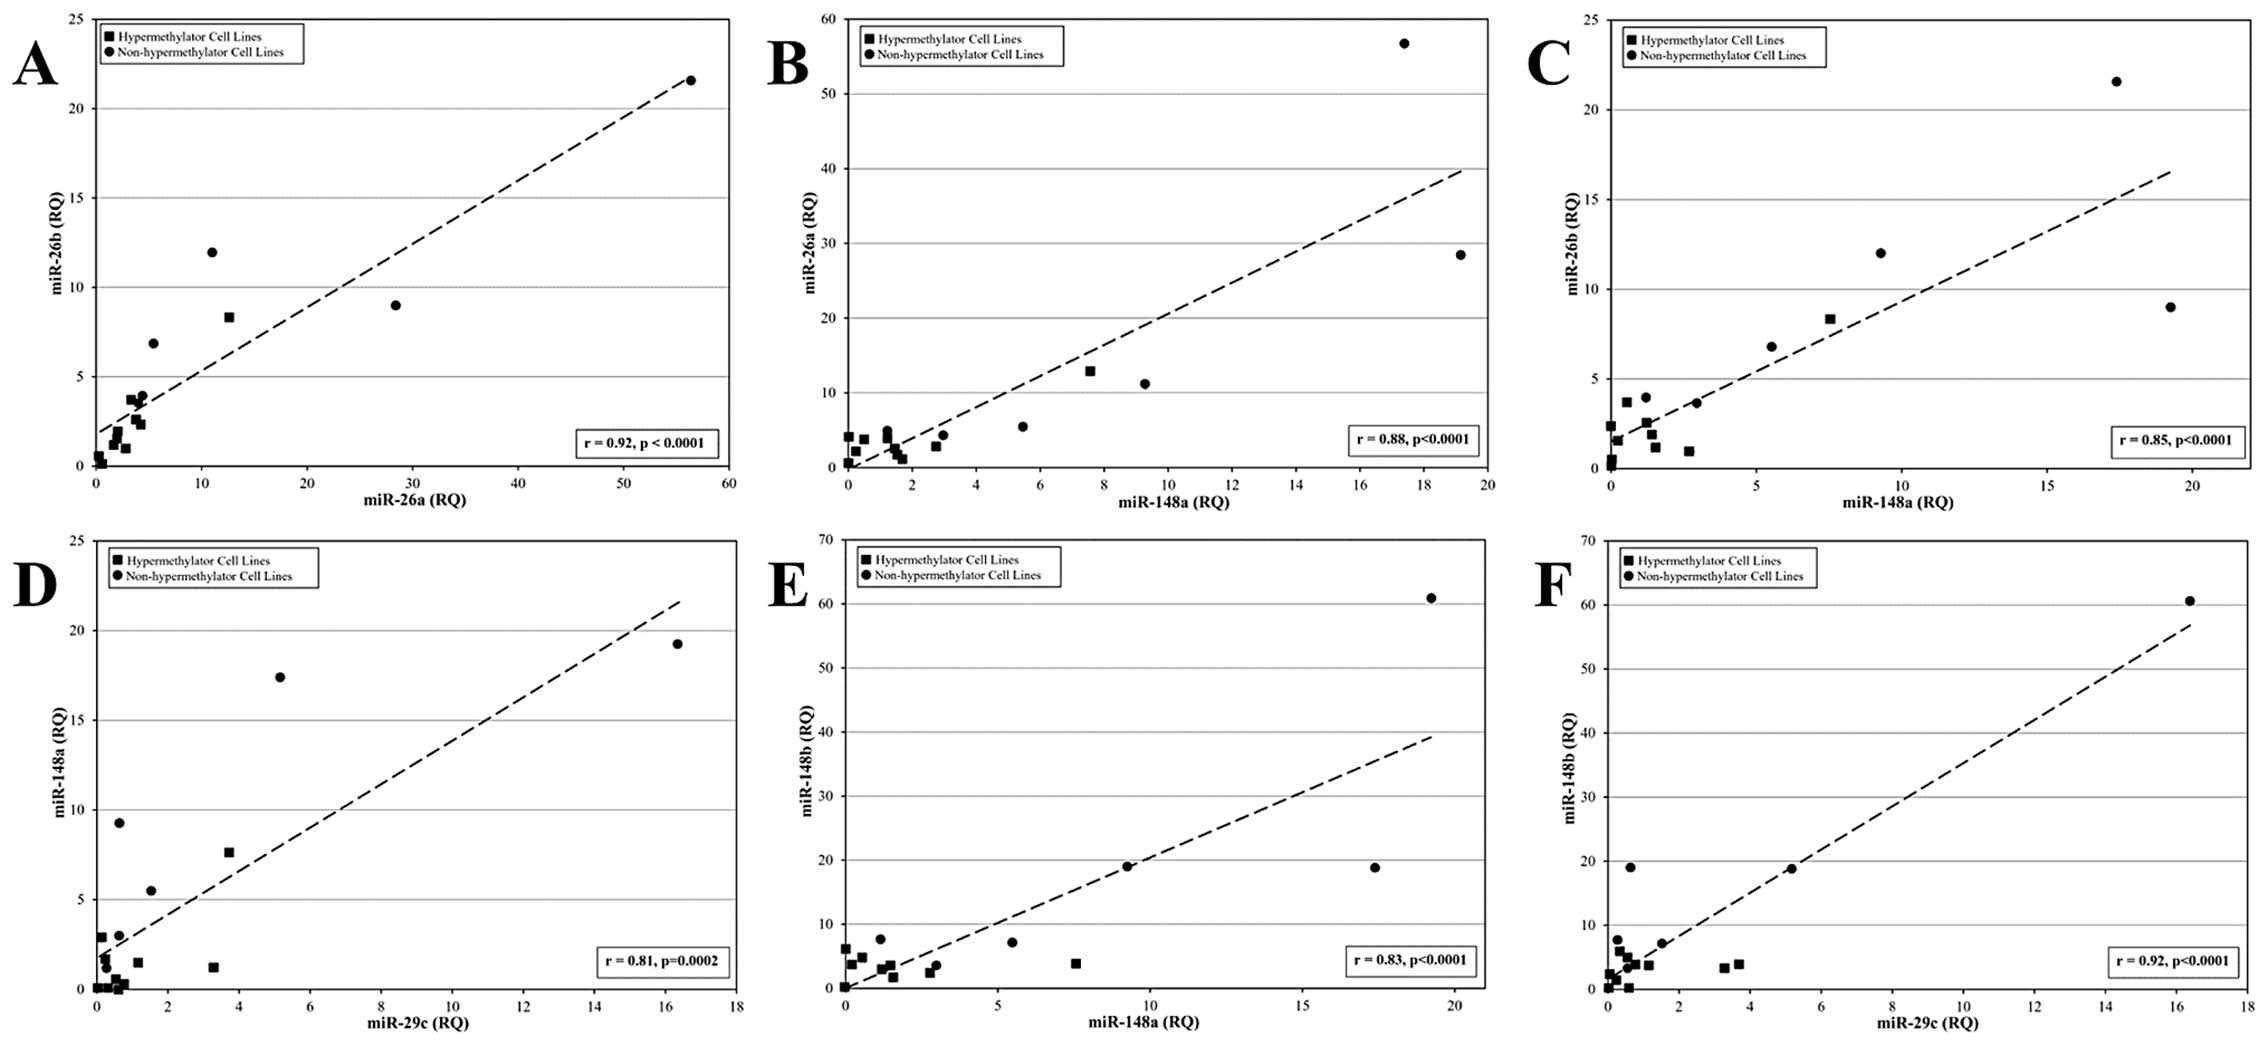
Co-regulation of miR expression in breast
cancer cell lines
To determine if miRs that regulate DNMT3b are
independently regulated or co-regulated at the level of expression,
a linear correlation analysis was performed to examine patterns of
miR expression among hypermethylator and non-hypermethylator breast
cancer cell lines. Statistically significant linear relationships
were observed between the levels of expression of several miRs
(Fig. 5A–F): miR-26a and miR-26b
(r=0.92, p<0.0001), miR-148a and miR-26a (r=0.88, p<0.0001),
miR-148a and miR-26b (r=0.85, p<0.0001), miR-29c and miR-148a
(r=0.81, p=0.0002), miR-148a and miR-148b (r=0.83, p<0.0001),
and miR-29c and miR-148b (r=0.92, p<0.0001). In addition,
significant linear relationships were observed for expression of
miR-26a and miR-203 (r=0.71, p=0.0019), miR26b and miR-203 (r=0.68,
p=0038), miR-26a and miR-29c (r=0.60, p=0.014), miR-148a and
miR-203 (r=0.60, p=0.014), and miR-26b and miR-148b (r=0.5,
p=0.04). No significant linear relationships were observed for
expression of miR-26b and miR-29c, miR-148c and miR-203, or miR-29c
and miR-203. Combined, these observations suggest that several miRs
that function in the regulation of DNMT3b are
co-regulated.
Changes in miR expression levels in
hypermethylator and non-hypermethylator breast cancer cell lines
after pre-miR and antagomir transfection
To determine the mechanistic role of specific miRs
in the dysregulation of DNMT3b among breast cancer cell
lines, the complementary approach of modulating miR levels by
transfection of pre-miR precursors (to enforce miR expression in
cells lacking a given miR) or transfection of antagomirs (to
knockdown miR expression in cells that express normal levels of a
given miR) was employed. Transfection of hypermethylator cell lines
Hs578T, HCC1937, and SUM185 with pre-miR precursors for miR-148b,
miR-26b, and miR-29c resulted in restoration of expression of these
miRs (Fig. 6A–C). Following
pre-miR transfection, Hs578T cells displayed 210-, 160- and
240-fold increased levels of miR-148b, miR-26b and miR-29c
(Fig. 6A). Likewise, pre-miR
transfection produced 430-, 2100- and 580-fold increases in
miR-148b, miR-26b and miR-29c levels in HCC1937 cells (Fig. 6B), and 54,000-, 4,700-and 2200-fold
increases in miR-148b, miR-26b and miR-29c levels in SUM185 cells
(Fig. 6C). Non-target control
pre-miR precursors did not produce any significant increase in
miR-148b, miR-26b and miR-29c levels in any of these cell lines
(Fig. 6A–C).
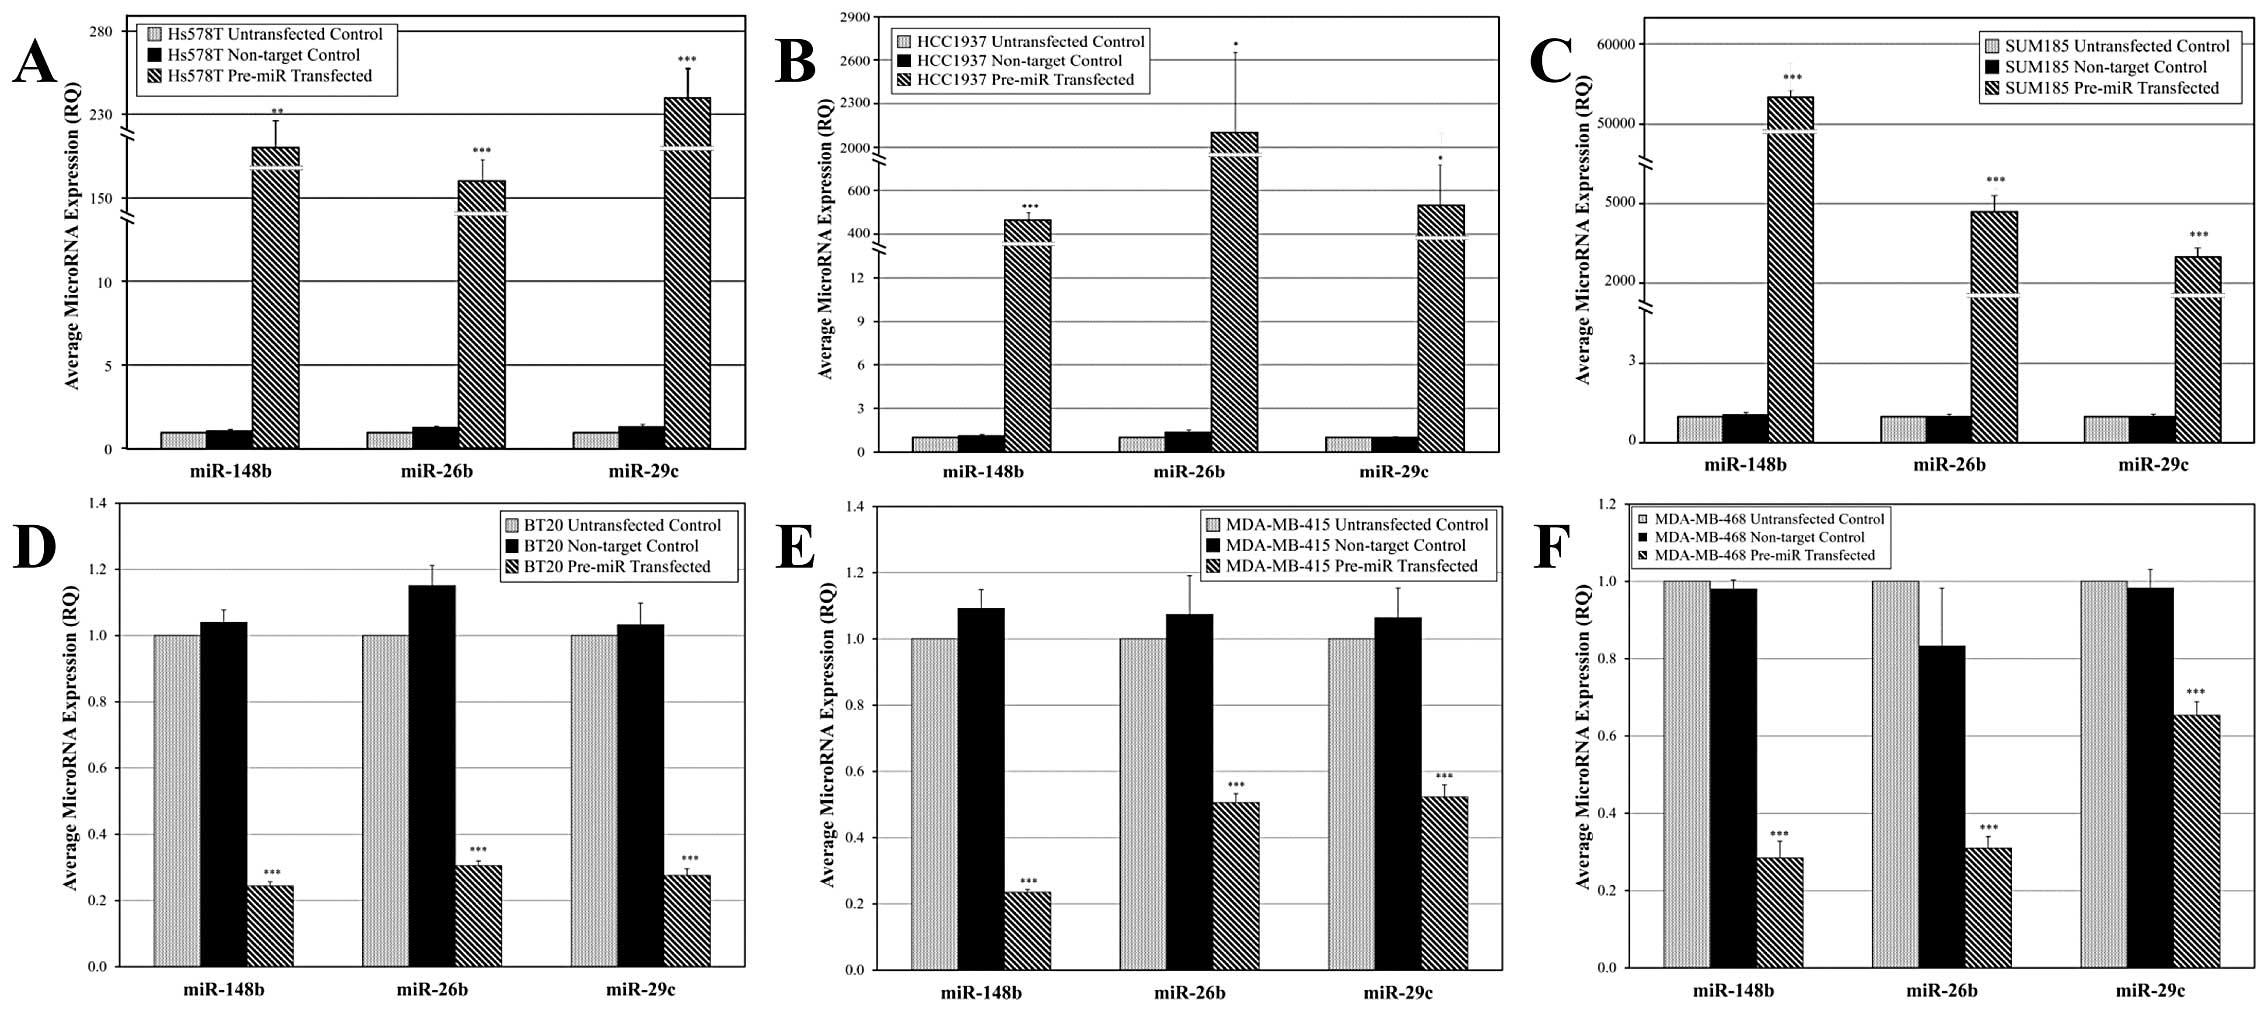 | Figure 6Changes in miR expression levels in
hypermethylator and non-hypermethylator breast cancer cell lines
after pre-miR and antagomir transfection. Speckled bars represent
miR expression levels in untransfected control cells, black bars
represent miR expression levels in cells transfected with
non-target control oligomers, and crosshatched bars represent miR
expression levels in cells after indicated pre-miR or antagomir
transfections. (A) Hs578T breast cancer cells re-express miR-148b,
miR-26b, and miR-29c after pre-miR transfection. (B) HCC1937 breast
cancer cells re-express miR-148b, miR-26b, and miR-29c after
pre-miR transfection. (C) SUM185 breast cancer cells re-express
miR-148b, miR-26b, and miR-29c after pre-miR transfection. (D) BT20
breast cancer cells express diminished levels of miR-148b, miR-26b,
and miR-29c after antagomir transfection. (E) MDA-MB-415 breast
cancer cells express reduced levels of miR-148b, miR-26b, and
miR-29c after antagomir transfection. (F) MDA-MB-468 breast cancer
cells express reduced levels of miR-148b, miR-26b, and miR-29c
after antagomir transfection. Each real-time assay was performed
3–6 times and error bars represent SEM. *p<0.05,
**p<0.005 and ***p<0.0005, compared to
untransfected control cells (unpaired t-test). |
Transfection of non-hypermethylator cell lines BT20,
MDA-MB-415, and MDA-MB-468 with antagomirs directed against
miR-148b, miR-26b and miR-29c resulted in a significant knockdown
of miR-148b, miR-26b and miR-29c levels (Fig. 6D–F). Antagomir transfection of BT20
cells resulted in reduction of miR-148b, miR-26b, and miR-29c
levels by 76, 69 and 73%, respectively (Fig. 6D). Likewise, antagomir transfection
of MDA-MB-415 cells produced 76, 49 and 48% reductions in miR-148b,
miR-26b, and miR-29c levels (Fig.
6E), and antagomir transfection of MDA-MB-468 cells resulted in
72, 69 and 35% reduction in miR-148b, miR-26b and miR-29c levels
(Fig. 6F). Non-target control
antagomirs did not produce significant alterations in the level of
miR-148b, miR-26b and miR-29c in any of these cell lines (Fig. 6D–F).
Perturbation of regulatory miR expression
alters DNMT3b levels in hypermethylator and non-hypermethylator
breast cancer cell lines
Enforced expression of miR-148b, miR-26b and miR-29c
in hypermethylator cell lines Hs578T, HCC1937 and SUM185 resulted
in statistically significant reduction in DNMT3b expression
levels (Fig. 7A). In Hs578T cells,
miR-29c expression reduced DNMT3b levels by 73%, and
expression of miR-148b and miR-26b produced 62% reduction in
DNMT3b levels (Fig. 7A).
Similar results were obtained in HCC1937 cells with 58–64%
reductions of DNMT3b levels in response to enforced expression of
miR-148b, miR-26b and miR-29c (Fig.
7A). The most dramatic effect of enforced pre-miR expression on
DNMT3b levels was observed in SUM185 cells. Expression of
miR-29c in SUM185 cells resulted in an 88% decrease in
DNMT3b mRNA (Fig. 7A).
Likewise, expression of miR-148b and miR-26b in SUM185 cells
produced 80 and 82% reduction in DNMT3b levels (Fig. 7A). Transfection of non-target
control pre-miR precursors did not produce any significant change
in DNMT3b levels in Hs578T, HCC1937 and SUM185 cells
(Fig. 7A). Western blot analysis
of cell lysates from Hs578T, HCC1937 and SUM185 cells following
pre-miR transfection failed to detect significant alterations in
DNMT3b protein levels (data not shown). However, the failure to
detect changes in DNMT3b protein is likely due to the transient (48
h) nature of this assay system and the relatively long half-life of
the DNMT3b protein. With persistent (stable) miR re-expression, we
expect to see decreases in DNMT3b. Likewise, assessment of
methylation-sensitive gene expression (for CEACAM6, CST6 and
SCNN1A) in Hs578T cells after enforced expression of
miR-148b, miR-26b and miR-29c did not reveal changes in levels of
expression compared to control cells (data not shown), consistent
with the lack of change in DNMT3b protein levels. As above, with
persistent (stable) miR re-expression, we expect to see alterations
in methylation-sensitive gene expression coordinate with changes in
DNMT3b levels.
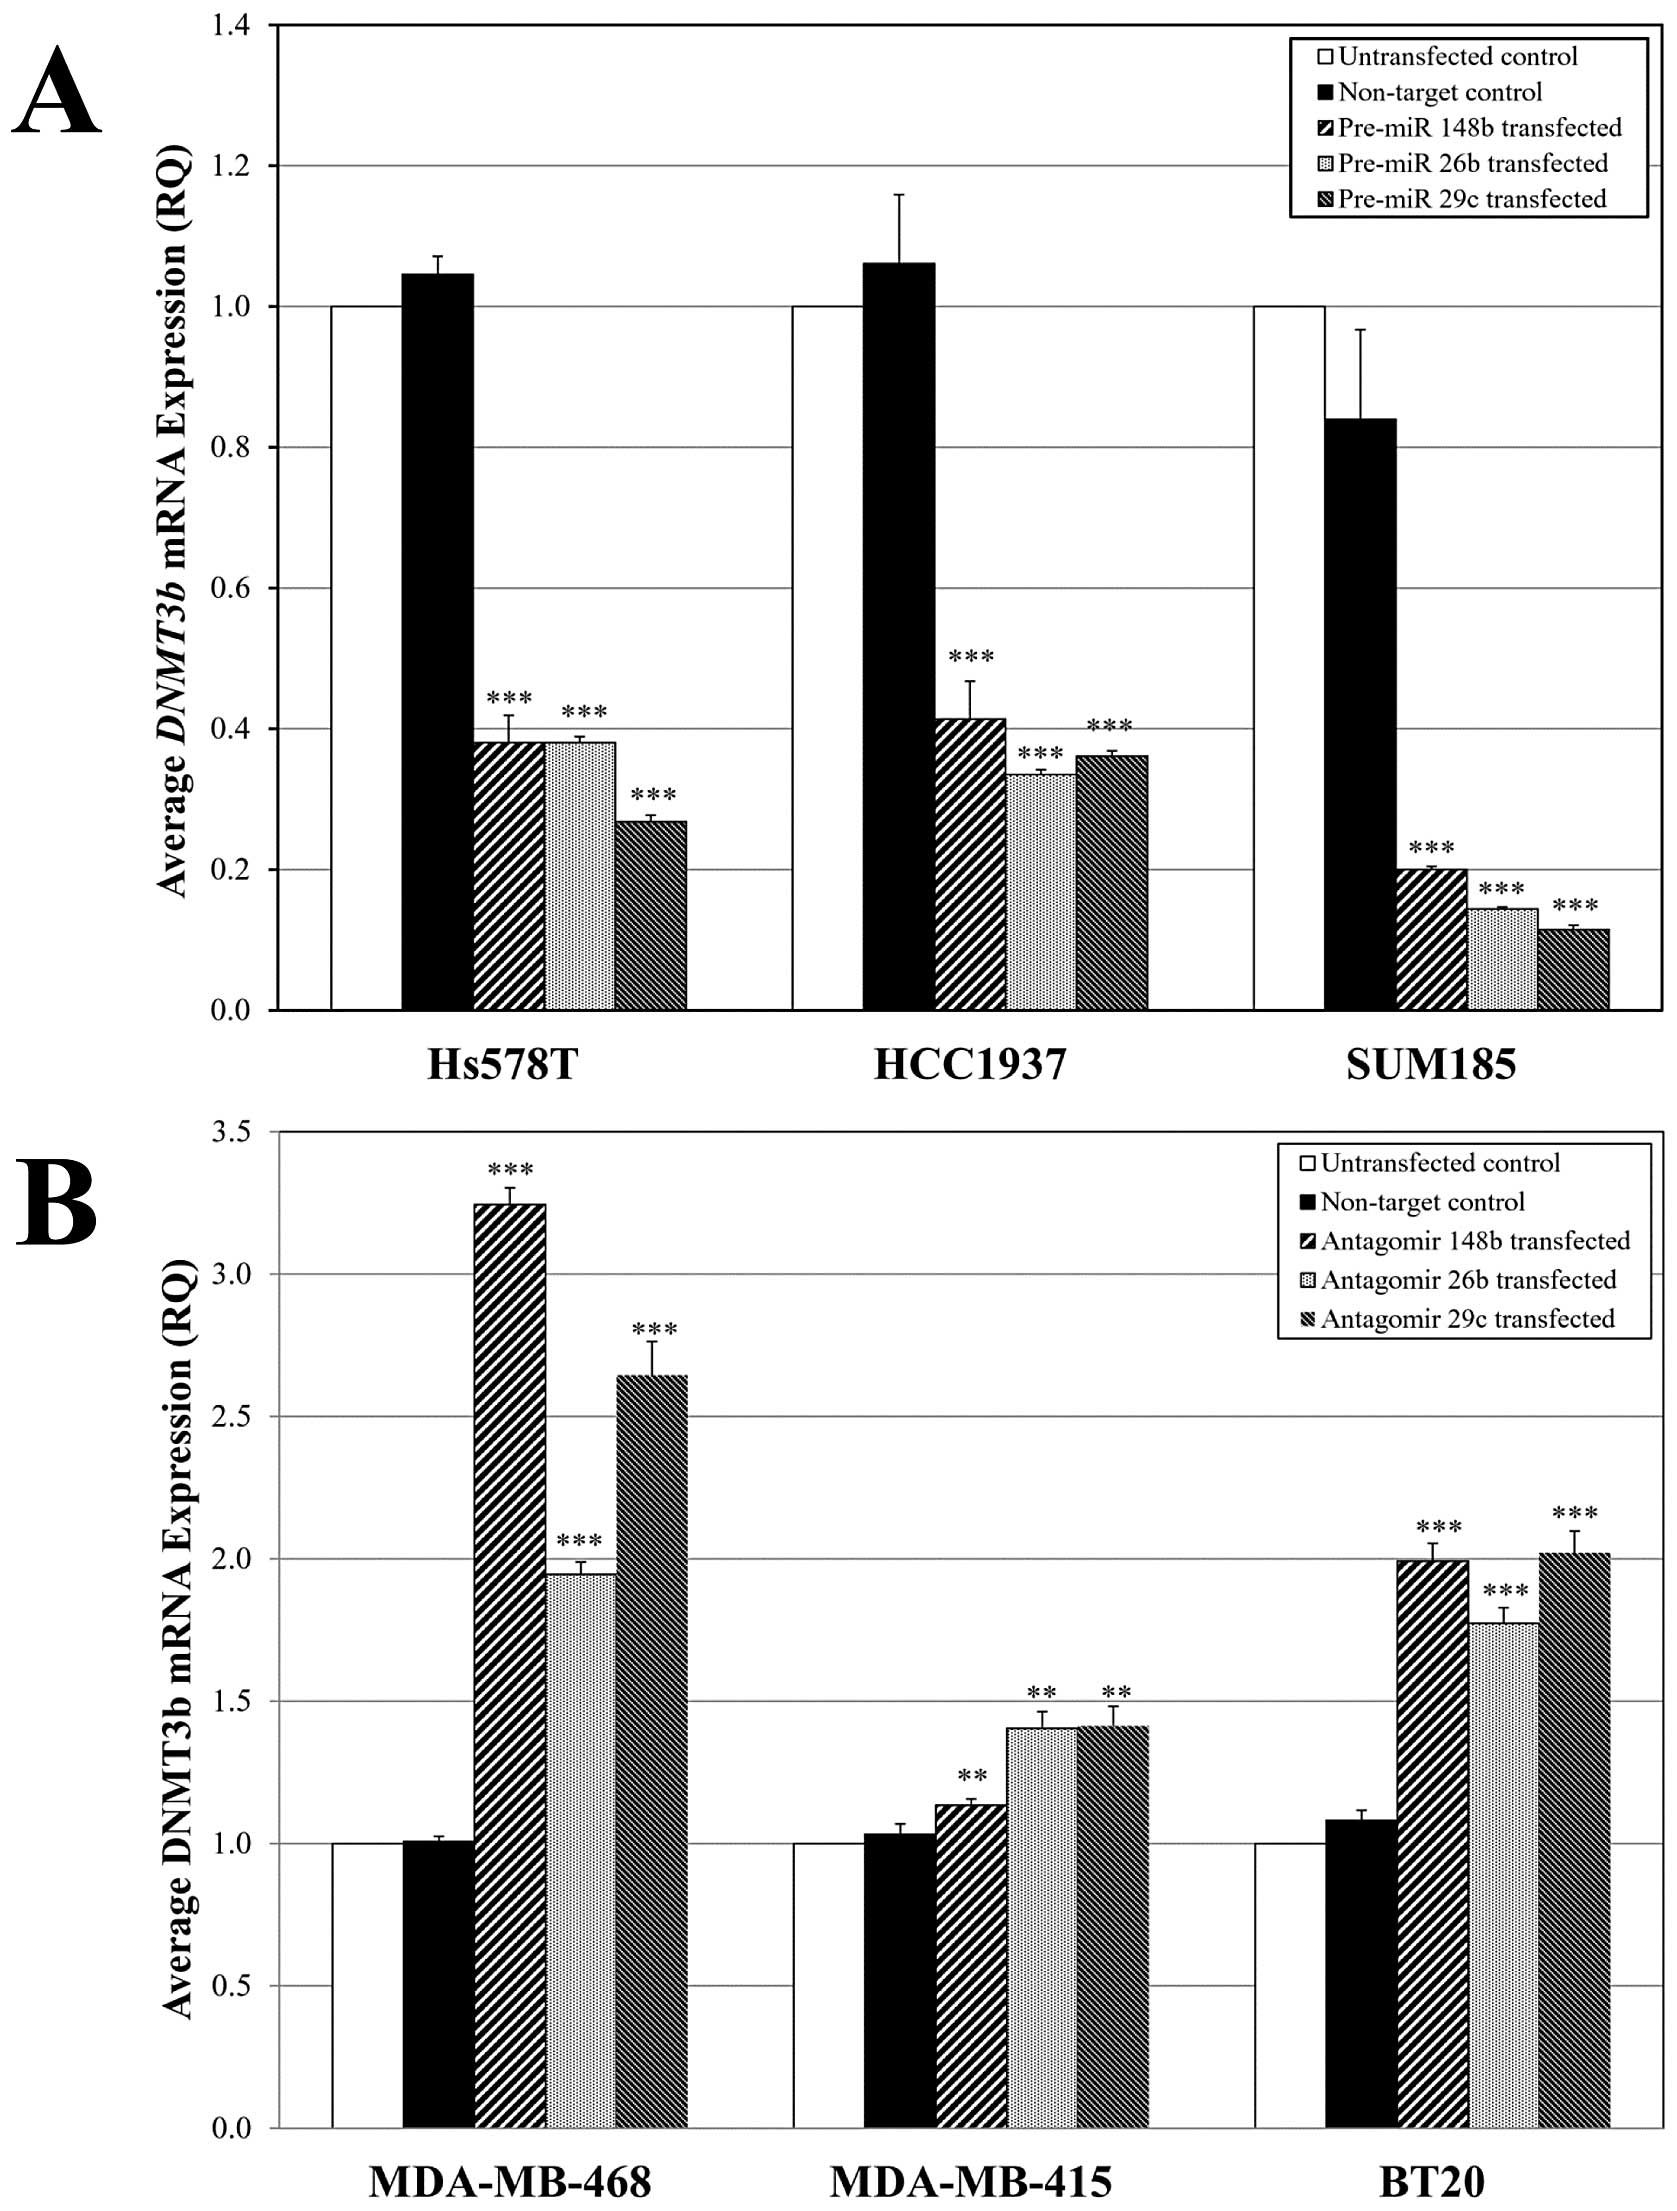 | Figure 7Perturbation of regulatory miR
expression affects DNMT3b levels in hypermethylator and
non-hypermethylator breast cancer cell lines. (A) Hypermethylator
breast cancer cells (Hs578T, HCC1937, and SUM185) exhibit
significant reduction in DNMT3b mRNA levels following
pre-miR transfection for miR-148b, miR-26b, and miR-29c. (B)
Non-hypermethylator breast cancer cells (MDA-MB-468, MDA-MB-415,
and BT20) display significantly increased DNMT3b mRNA levels
following transfection with antagomirs for miR-148b, miR-26b, and
miR-29c. Each real-time assay was performed 3–6 times and error
bars represent SEM. **p<0.005,
***p<0.0005, compared to untransfected control cells
(unpaired t-test). |
Antagomir-mediated knockdown of miR-148b, miR-26b
and miR-29c in non-hypermethylator cell lines MDA-MB-468,
MDA-MB-415 and BT20 resulted in statistically significant increases
in DNMT3b expression levels (Fig. 7B). The most dramatic effects were
observed in MDA-MB-468 cells, where miR-148b knockdown produced a
3.2-fold increase in DNMT3b mRNA, whereas knockdown of
miR-26b and miR-29c resulted in 2-and 2.6-fold increases in
DNMT3b levels, respectively (Fig. 7B). Comparable increases in
DNMT3b expression levels (1.8-to 2-fold) were observed in
BT20 cells following knockdown of miR-148b, miR-26b and miR-29c
(Fig. 7B). More modest increases
of DNMT3b levels (1.2-to 1.4-fold) were observed in
MDA-MB-415 cells after knockdown of miR-148b, miR-26b and miR-29c,
but these alterations were statistically significant. Transfection
of non-target control antagomirs did not produce any significant
change in DNMT3b levels in these cell lines (Fig. 7B). Similar to the results obtained
with pre-miR-transfected hypermethylator cell lines, western blot
analysis of cell lysates from MDA-MB-468, MDA-MB-415, and BT20
cells following antagomir transfection failed to detect significant
alterations in DNMT3b protein levels (data not shown). Failure to
detect changes in DNMT3b protein is likely due to the transient (48
hour) nature of this assay system. With persistent (stable) miR
knockdown, we expect to see increased DNMT3b levels. Further,
assessment of methylation-sensitive gene expression (for
CEACAM6, CST6 and SCNN1A) in MDA-MB-468 cells after
antagomir-mediated knockdown of miR-148b, miR-26b and miR-29c did
not reveal changes in levels of expression compared to control
cells (data not shown), consistent with the lack of change in
DNMT3b protein levels in this short-term assay system. As above,
with persistent (stable) miR knockdown, we expect to see
alterations in methylation-sensitive gene expression coordinate
with changes in the level of DNMT3b.
Discussion
Epigenetic changes significantly contribute to the
normal regulation of gene expression and when dysregulated can
significantly contribute to carcinogenesis (35,36).
Aberrant epigenetic silencing of tumor suppressor genes and other
negative mediators of cell proliferation has been documented in the
development and progression of breast cancer (3,5,9). The
CpG island methylator phenotype (or CIMP) represents a major
epigenetic mechanism of colorectal carcinogenesis that has also
been recognized in cancers affecting other tissues (37–39).
We have identified a hypermethylation defect in a subset of human
breast cancer cell lines and primary breast cancers that are
characterized by DNMT hyperactivity, overexpression of DNMT3b, and
concurrent methylation-dependent silencing of numerous genes
(including CDH1, CEACAM6, CST6, ESR1, GNA11, MYB, MUC1,
SCNN1A and TFF) (10).
Mining of microarray-based expression data identified a strong
cluster of primary breast cancers that display a gene expression
signature associated with hypermethylation defect (10). A strong association was established
between the expression of the hypermethylation defect signature and
the basal-like molecular subtype of breast cancers (10). Basal-like breast cancers are
typically classified as triple-negative, reflecting lack expression
of estrogen and progesterone receptors
(ER−/PR−), and absence of HER2 gene
amplification (HER2−) (40,41).
Hence, patients with basal-like breast cancer are not responsive to
targeted therapies like tamoxifen (targeting ER) and trastuzumab
(targeting HER2) (42,43). The poor prognosis associated with
basal-like breast cancer and lack of druggable targets makes the
fundamental observation of the co-segregation of the
hypermethylation defect with basal-like breast cancer to be of
utmost significance. Our observations suggest strongly that the DNA
methylation machinery (and specifically DNMT3b) represents
new/novel molecular target for development of drugs and treatment
strategies for basal-like breast cancer.
In the present study, our goal was to elucidate the
molecular mechanism accounting for overexpression of DNMT3b in
hypermethylator breast cancer cell lines. Recent studies link miRs
to the post-transcriptional regulation DNMT3b expression in
various tissues. Loss of expression of members of miR-29 family and
overexpression of DNMT3b has been shown in lung cancer
(26) and acute myeloid leukemia
(27). Likewise, there is evidence
supporting the negative regulation of DNMT3b by miR-148a and
miR-148b in cell lines of multiple origins (28). The results of the present study
strongly suggest that loss of regulatory miR expression contributes
to DNMT3b overexpression in hypermethylator breast cancer
cell lines. This evidence includes: i) differential expression of
regulatory miRs between hypermethylator and non-hypermethylator
cell lines, ii) significantly diminished expression of miR-29c,
miR-148a, miR-148b, miR-26a, miR-26b, and miR-203 among
hypermethylator breast cancer cell lines, iii) pre-miR-mediated
re-expression of miR-148b, miR-26b, or miR-29c in hypermethylator
breast cancer cell lines (Hs578T, HCC1937 and SUM185) reduces
DNMT3b mRNA levels, and iv) antagomir-mediated knockdown of
miR-148b, miR-26b, or miR-29c in non-hypermethylator breast cancer
cell lines (MDA-MB-468, MDA-MB-415, and BT20) leads to increased
DNMT3b mRNA levels. The observed loss of regulatory miRs in
expression of the pro-cancerogenic hypermethylation defect suggests
that these miRs possess a tumor suppressor-like function in breast,
similar to other tissues (26–28).
miRs are predicted to post-transcriptionally
regulate more that 60% of all protein-encoding genes in mammals and
contribute to almost every cellular process, normal and
pathological (44). miRs have been
recently been established as key players in carcinogenesis, with
functions that can be oncogenic or tumor suppressor-like (15). Our results suggest loss of
combinations of miR-29c, miR-148a, miR-148b, miR-26a, miR-26b and
miR-203 is associated with expression of the hypermethylation
defect in breast cancer cell lines, consistent with the idea that
these miRs function as negative mediators of the neoplastic
phenotype. Diminished levels of these miRs have been documented in
various forms of cancer, supporting the suggestion that these miRs
possess tumor suppressor-like function. Reduced expression of
miR-26a occurs in hepatocellular carcinoma, oral squamous cell
carcinoma, bladder cancer, thyroid anaplastic carcinoma, Burkitt’s
lymphoma, acute myeloid leukemia, papillary carcinoma, prostate
cancer, and breast cancer (44–46).
miR-26b expression is diminished in Hodgkin’s lymphoma, oral
squamous cell carcinoma, and prostate cancers (46). miR-29c expression is depressed in
nasopharyngeal carcinomas, bladder tumors, chronic lymphocytic
leukemia, acute myeloid leukemia, lung cancers, cholangiocarcinoma,
esophageal squamous cell carcinoma, and pancreatic ductal
adenocarcinoma (44–48). miR-148a is down-regulated in breast
cancers, papillary thyroid carcinoma, pancreatic ductal
adenocarcinoma, prostate cancer, and colorectal adenocarcinoma
(45,46). miR-148b is expressed at reduced
levels in oral squamous cell carcinoma, papillary thyroid
carcinoma, prostate cancer, colorectal adenocarcinoma, and
pancreatic ductal adenocarcinoma (46). miR-203 levels are diminished in
oral squamous cell carcinoma, chronic myeloid leukemia,
hepatocellular adenomas, and esophageal squamous cell carcinoma
(45,46). These studies from the literature
document loss or diminished expression of miR-29c, miR-148a,
miR-148b, miR-26a, miR-26b, and miR-203 in various forms of cancer,
including breast in some cases.
Several molecular mechanisms contribute to miR
dysregulation in cancer, including genetic abnormalities (such as
chromosomal rearrangement, deletion, amplification, or sequence
mutations) and epigenetic changes (methylation-dependent silencing
of miR expression or alterations in the miRNA biogenesis machinery)
(44). Numerous miR genes (more
than 50%) are positioned within or close to chromosomal fragile
sites and other genomic regions associated with cancer (44). Genetic alterations involving these
chromosomal regions result in dramatic alteration of miR expression
levels (44). Likewise, numerous
studies report promoter hypermethylation as an important mechanism
leading to loss of miR expression in cancer (15). Loss of miR-203 expression is
associated with fragile site on chromosome, 14q32 (49), as well as through promoter
hypermethylation in hematopoietic malignancies (49,50).
miR-148a and miR148b are also susceptible to methylation-dependent
silencing in cancer (15). We
found miR-203 to be significantly co-regulated with miR148a and
miR-148b, suggesting the possibility of a common epigenetic
mechanism accounting for their diminished expression in
hypermethylator cell lines. These examples from the literature
suggest that loss of regulatory miR expression leading to
DNMT3b dysregulation could be the result of genetic or
epigenetic mechanisms. Given the linkage between basal-like breast
cancers and expression of the hypermethylation defect, loss of
regulatory miR expression leading to DNMT3b overexpression
may represent a very early and significant molecular alteration
during the natural history of breast carcinogenesis. Further, loss
of regulatory miR expression and establishment of the
hypermethylation defect (with DNMT3b overexpression) may
determine and/or drive the basal-like molecular subtype of breast
cancer.
The purpose of this study was to elucidate the
molecular mechanism governing the overexpression of DNMT3b
associated with the expression of hypermethylation defect in breast
cancer. The results of this study strongly suggest that multiple
miRs post-transcriptionally regulate DNMT3b in combination
and that loss of expression of these regulatory miRs contributes to
DNMT3b overexpression. Mechanistic dissection of the role of
selected miRs in the regulation of DNMT3b among
hypermethylator and non-hypermethylator breast cancer cell lines
produced additional evidence for the importance of this molecular
regulating network in determination of the methylation status of
breast cancer cell lines. Re-expression of regulatory miRs reduces
DNMT3b mRNA levels in hypermethylator breast cancer cell
lines, and down-regulation of regulatory miRs increases
DNMT3b mRNA levels in non-hypermethylator breast cancer cell
lines.
In conclusion, the molecular mechanism governing
the DNMT3b-mediated hypermethylation defect in breast cancer cell
lines involves the loss of post-transcriptional regulation of
DNMT3b by regulatory miRs.
Abbreviations:
|
CDH1
|
E-cadherin
|
|
CEACAM6
|
carcinoembryonic antigen-related cell
adhesion molecule 6
|
|
CIMP
|
CpG island methylator phenotype
|
|
CST6
|
cystatin E/M
|
|
DNMT3a
|
DNA methyltransferase 3a
|
|
DNMT3b
|
DNA methyltransferase 3b
|
|
ESR1
|
estrogen receptor 1
|
|
GNA11
|
guanine nucleotide binding protein,
alpha 11
|
|
HER2
|
human epidermal growth factor
receptor 2
|
|
HMGA2
|
high mobility group AT-HOOK 2
|
|
miR
|
microRNA
|
|
MUC1
|
mucin 1
|
|
MYB
|
v-myb myeloblastosis viral oncogene
homolog
|
|
PR
|
progesterone receptor
|
|
PTK9
|
protein tyrosine kinase 9
|
|
SCNN1A
|
sodium channel nonvoltage-gated 1
alpha
|
|
TFF3
|
trefoil factor 3
|
Acknowledgements
This work was supported by a
University Cancer Research Fund grant from the UNC Lineberger
Comprehensive Cancer Center, and Friends for an Earlier Breast
Cancer Test (Earlier. org). AGR is supported by a Postdoctoral
Fellowship grant from the American Cancer Society
(PF-08-166-01-GMC).
References
|
1
|
Baylin SB, Herman JG, Graff JR, Vertino PM
and Issa JP: Alterations in DNA methylation: a fundamental aspect
of neoplasia. Adv Cancer Res. 72:141–196. 1998. View Article : Google Scholar : PubMed/NCBI
|
|
2
|
Baylin S: DNA methylation and epigenetic
mechanisms of carcinogenesis. Dev Biol. 106:85–87. 2001.PubMed/NCBI
|
|
3
|
Yang X, Yan L and Davidson NE: DNA
methylation in breast cancer. Endocr Relat Cancer. 8:115–127. 2001.
View Article : Google Scholar
|
|
4
|
Lapidus RG, Ferguson AT, Ottaviano YL,
Parl FF, Smith HS, Weitzman SA, Baylin SB, Issa JP and Davidson NE:
Methylation of estrogen and progesterone receptor gene 5′ CpG
islands correlates with lack of estrogen and progesterone receptor
gene expression in breast tumors. Clin Cancer Res. 2:805–810.
1996.
|
|
5
|
Esteller M: CpG island hypermethylation
and tumor suppressor genes: a booming present, a brighter future.
Oncogene. 21:5427–5440. 2002. View Article : Google Scholar : PubMed/NCBI
|
|
6
|
Esteller M: Dormant hypermethylated tumour
suppressor genes: questions and answers. J Pathol. 205:172–180.
2005. View Article : Google Scholar : PubMed/NCBI
|
|
7
|
Kanai Y and Hirohashi S: Alterations of
DNA methylation associated with abnormalities of DNA
methyltransferases in human cancers during transition from a
precancerous to a malignant state. Carcinogenesis. 28:2434–2442.
2007. View Article : Google Scholar : PubMed/NCBI
|
|
8
|
Lewis CM, Cler LR, Bu DW, Zochbauer-Muller
S, Milchgrub S, Naftalis EZ, Leitch AM, Minna JD and Euhus DM:
Promoter hypermethylation in benign breast epithelium in relation
to predicted breast cancer risk. Clin Cancer Res. 11:166–172.
2005.PubMed/NCBI
|
|
9
|
Ai L, Kim WJ, Kim TY, Fields CR, Massoll
NA, Robertson KD and Brown KD: Epigenetic silencing of the tumor
suppressor cystatin M occurs during breast cancer progression.
Cancer Res. 66:7899–7909. 2006. View Article : Google Scholar : PubMed/NCBI
|
|
10
|
Roll JD, Rivenbark AG, Jones WD and
Coleman WB: DNMT3b overexpression contributes to a hypermethylator
phenotype in human breast cancer cell lines. Mol Cancer. 7:152008.
View Article : Google Scholar : PubMed/NCBI
|
|
11
|
Robertson KD, Uzvolgyi E, Liang G,
Talmadge C, Sumegi J, Gonzales FA and Jones PA: The human DNA
methyltransferases (DNMTs) 1, 3a and 3b: coordinate mRNA expression
in normal tissues and overexpression in tumors. Nucleic Acids Res.
27:2291–2298. 1999. View Article : Google Scholar : PubMed/NCBI
|
|
12
|
Girault I, Tozlu S, Lidereau R and Bieche
I: Expression analysis of DNA methyltransferases 1, 3A and 3B in
sporadic breast carcinomas. Clin Cancer Res. 9:4415–4422.
2003.PubMed/NCBI
|
|
13
|
Mizuno S, Chijiwa T, Okamura T, Akashi K,
Fukumaki Y, Niho Y and Sasaki H: Expression of DNA
methyltransferases DNMT1, 3A and 3B in normal hematopoiesis and in
acute and chronic myelogenous leukemia. Blood. 97:1172–1179. 2001.
View Article : Google Scholar : PubMed/NCBI
|
|
14
|
Jin F, Dowdy SC, Xiong Y, Eberhardt NL,
Podratz KC and Jiang SW: Up-regulation of DNA methyltransferase 3B
expression in endometrial cancers. Gynecol Oncol. 96:531–538. 2005.
View Article : Google Scholar : PubMed/NCBI
|
|
15
|
Veeck J and Esteller M: Breast cancer
epigenetics: from DNA methylation to microRNAs. J Mammary Gland
Biol Neoplasia. 15:5–17. 2010. View Article : Google Scholar : PubMed/NCBI
|
|
16
|
Bartel B: MicroRNAs directing siRNA
biogenesis. Nat Struct Mol Biol. 12:569–571. 2005. View Article : Google Scholar : PubMed/NCBI
|
|
17
|
Bartel DP: MicroRNAs: genomics,
biogenesis, mechanism and function. Cell. 116:281–297. 2004.
View Article : Google Scholar : PubMed/NCBI
|
|
18
|
Sevignani C, Calin GA, Siracusa LD and
Croce CM: Mammalian microRNAs: a small world for fine-tuning gene
expression. Mamm Genome. 17:189–202. 2006. View Article : Google Scholar : PubMed/NCBI
|
|
19
|
Miska EA: How microRNAs control cell
division, differentiation and death. Curr Opin Geneτ Dev.
15:563–568. 2005.PubMed/NCBI
|
|
20
|
Carleton M, Cleary MA and Linsley PS:
MicroRNAs and cell cycle regulation. Cell Cycle. 6:2127–2132. 2007.
View Article : Google Scholar : PubMed/NCBI
|
|
21
|
Ambros V: The functions of animal
microRNAs. Nature. 431:350–355. 2004. View Article : Google Scholar : PubMed/NCBI
|
|
22
|
Calin GA, Dumitru CD, Shimizu M, Bichi R,
Rai K, et al: Frequent deletions and down-regulation of micro-RNA
genes miR15 and miR16 at 13q14 in chronic lymphocytic leukemia.
Proc Natl Acad Sci USA. 99:15524–15529. 2002. View Article : Google Scholar : PubMed/NCBI
|
|
23
|
Iorio MV, Ferracin M, Liu CG, Veronese A,
Spizzo R, et al: MicroRNA gene expression deregulation in human
breast cancer. Cancer Res. 65:7065–7070. 2005. View Article : Google Scholar : PubMed/NCBI
|
|
24
|
Lujambio A, Calin GA, Villanueva A, Ropero
S, Sanchez-Cespedes M, et al: A microRNA DNA methylation signature
for human cancer metastasis. Proc Natl Acad Sci USA.
105:13556–13561. 2008. View Article : Google Scholar : PubMed/NCBI
|
|
25
|
Hayashita Y, Osada H, Tatematsu Y, Yamada
H, Yanagisawa K, Tomida S, Yatabe Y, Kawahara K, Sekido Y and
Takahashi T: A polycistronic microRNA cluster, miR-17-92, is
overexpressed in human lung cancers and enhances cell
proliferation. Cancer Res. 65:9628–9632. 2005. View Article : Google Scholar : PubMed/NCBI
|
|
26
|
Fabbri M, Garzon R, Cimmino A, Liu Z,
Zanesi N, et al: MicroRNA-29 family reverts aberrant methylation in
lung cancer by targeting DNA methyltransferases 3A and 3B. Proc
Natl Acad Sci USA. 104:15805–15810. 2007. View Article : Google Scholar : PubMed/NCBI
|
|
27
|
Garzon R, Liu S, Fabbri M, Liu Z, Heaphy
CE, et al: MicroRNA-29b induces global DNA hypomethylation and
tumor suppressor gene reexpression in acute myeloid leukemia by
targeting directly DNMT3A and 3B and indirectly DNMT1. Blood.
113:6411–6418. 2009. View Article : Google Scholar : PubMed/NCBI
|
|
28
|
Duursma AM, Kedde M, Schrier M, Le Sage C
and Agami R: miR-148 targets human DNMT3b protein coding region.
RNA. 14:872–877. 2008. View Article : Google Scholar : PubMed/NCBI
|
|
29
|
Saito Y, Liang G, Egger G, Friedman JM,
Chuang JC, Coetzee GA and Jones PA: Specific activation of
microRNA-127 with down-regulation of the proto-oncogene BCL6 by
chromatin-modifying drugs in human cancer cells. Cancer Cell.
9:435–443. 2006. View Article : Google Scholar : PubMed/NCBI
|
|
30
|
Chomczynski P and Sacchi N: Single-step
method of RNA isolation by acid guanidinium
thiocyanate-phenol-chloroform extraction. Anal Biochem.
162:156–159. 1987. View Article : Google Scholar : PubMed/NCBI
|
|
31
|
Gaur A, Jewell DA, Liang Y, Ridzon D,
Moore JH, Chen C, Ambros VR and Israel MA: Characterization of
microRNA expression levels and their biological correlates in human
cancer cell lines. Cancer Res. 67:2456–2468. 2007. View Article : Google Scholar : PubMed/NCBI
|
|
32
|
Sandhu R, Rivenbark AG and Coleman WB:
Enhancement of chemotherapeutic efficacy in hypermethylator breast
cancer cells through targeted and pharmacologic inhibition of
DNMT3b. Breast Cancer Res Treatment. 131:385–399. 2012. View Article : Google Scholar : PubMed/NCBI
|
|
33
|
Calin GA, Ferracin M, Cimmino A, Di Leva
G, Shimizu M, et al: A microRNA signature associated with prognosis
and progression in chronic lymphocytic leukemia. N Engl J Med.
353:1793–1801. 2005. View Article : Google Scholar : PubMed/NCBI
|
|
34
|
Nikiforova MN, Tseng GC, Steward D, Diorio
D and Nikiforov YE: MicroRNA expression profiling of thyroid
tumors: biological significance and diagnostic utility. J Clin
Endocrinol Metab. 93:1600–1608. 2008. View Article : Google Scholar : PubMed/NCBI
|
|
35
|
Feinberg AP and Tycko B: The history of
cancer epigenetics. Nat Rev. 4:143–153. 2004. View Article : Google Scholar
|
|
36
|
Esteller M: Epigenetics in cancer. N Engl
J Med. 358:1148–1159. 2008. View Article : Google Scholar
|
|
37
|
Toyota M, Ahuja N, Ohe-Toyota M, Herman
JG, Baylin SB and Issa JP: CpG island methylator phenotype in
colorectal cancer. Proc Natl Acad Sci USA. 96:8681–8686. 1999.
View Article : Google Scholar : PubMed/NCBI
|
|
38
|
Shen L, Ahuja N, Shen Y, Habib NA, Toyota
M, Rashid A and Issa JP: DNA methylation and environmental
exposures in human hepatocellular carcinoma. J Natl Cancer Inst.
94:755–761. 2002. View Article : Google Scholar : PubMed/NCBI
|
|
39
|
Toyota M, Ahuja N, Suzuki H, Itoh F,
Ohe-Toyota M, Imai K, Baylin SB and Issa JP: Aberrant methylation
in gastric cancer associated with the CpG island methylator
phenotype. Cancer Res. 59:5438–5442. 1999.PubMed/NCBI
|
|
40
|
Diaz LK, Cryns VL, Symmans WF and Sneige
N: Triple negative breast carcinoma and the basal phenotype: from
expression profiling to clinical practice. Adv Anat Pathol.
14:419–430. 2007. View Article : Google Scholar : PubMed/NCBI
|
|
41
|
Korsching E, Jeffrey SS, Meinerz W, Decker
T, Boecker W and Buerger H: Basal carcinoma of the breast
revisited: an old entity with new interpretations. J Clin Pathol.
61:553–560. 2008. View Article : Google Scholar : PubMed/NCBI
|
|
42
|
Duffy MJ: Estrogen receptors: role in
breast cancer. Crit Rev Clin Lab Sci. 43:325–347. 2006. View Article : Google Scholar : PubMed/NCBI
|
|
43
|
Slamon D and Pegram M: Rationale for
trastuzumab (Herceptin) in adjuvant breast cancer trials. Semin
Oncol. 28:13–19. 2001. View Article : Google Scholar : PubMed/NCBI
|
|
44
|
Melo SA and Esteller M: Dysregulation of
microRNAs in cancer: playing with fire. FEBS Lett. 585:2087–2099.
2011. View Article : Google Scholar : PubMed/NCBI
|
|
45
|
Visone R and Croce CM: miRNAs and cancer.
Am J Pathol. 174:1131–1138. 2009. View Article : Google Scholar
|
|
46
|
Wang Y and Lee CG: MicroRNA and
cancer-focus on apoptosis. J Cell Mol Med. 13:12–23. 2009.
View Article : Google Scholar
|
|
47
|
Sengupta S, den Boon JA, Chen IH, Newton
MA, Stanhope SA, Cheng YJ, Chen CJ, Hildesheim A, Sugden B and
Ahlquist P: MicroRNA 29c is down-regulated in nasopharyngeal
carcinomas, up-regulating mRNAs encoding extracellular matrix
proteins. Proc Natl Acad Sci USA. 105:5874–5878. 2008. View Article : Google Scholar : PubMed/NCBI
|
|
48
|
Garzon R, Calin GA and Croce CM: MicroRNAs
in cancer. Annu Rev Med. 60:167–179. 2009. View Article : Google Scholar
|
|
49
|
Bueno MJ, Perez de Castro I, Gomez de
Cedron M, Santos J, Calin GA, Cigudosa JC, Croce CM,
Fernandez-Piqueras J and Malumbres M: Genetic and epigenetic
silencing of microRNA-203 enhances ABL1 and BCR-ABL1 oncogene
expression. Cancer Cell. 13:496–506. 2008. View Article : Google Scholar : PubMed/NCBI
|
|
50
|
Sato F, Tsuchiya S, Meltzer SJ and Shimizu
K: MicroRNAs and epigenetics. FEBS J. 278:1598–1609. 2011.
View Article : Google Scholar : PubMed/NCBI
|