Introduction
Gastric cancer (GC) is one of the most frequent
tumors and the second leading cause of mortality worldwide
(1). Since 1976, gastric cancer
has increased 4–10% per year among men in the United States, more
rapidly than any other type of cancer. Surgery is still the main
option for treating GC, however, even after performing curative
resection approximately 40–65% of GC patients will experience a
recurrence of the disease possibly encompassing local relapse,
peritoneal dissemination or hematogenous metastasis (2,3). The
high recurrence rate of GC is the main reason to treatment failure
and once it happens, the quality of life and survival will decrease
greatly. Therefore, identification of biomarkers with potential for
understanding molecular mechanisms and recognizing the biological
characteristics involved in recurrence is a key for early
evaluation of the prognosis in GC patients.
In 2011, we reported that the combination of a group
of microRNAs (miRNAs) as a predictor has potential to predict
recurrence risk in gastric cancer patients following surgical
resection (4). In our previous
study, we used miRNA microarray and bioinformatics methods to
characterize recurrence-related biomarkers from primary tumor
samples, and identified 17 differential miRNAs including 10
upregulated and 7 downregulated miRNAs in recurrence group. This
miRNA profiling provided us a with a powerful resource for better
understanding the molecular mechanism within GC recurrence.
The regulation by miRNAs is one of the important
modes for alterations of gene or protein. Compared with miRNAs,
more advantageous in clinical diagnosis and adjuvant therapy were
proved by using genes or proteins as signature. Several factors
including gene expression changes related with recurrence have been
reported (5,6). In addition, a few predictive or
diagnostic methods have been used to evaluate the recurrence risk
based on gene expression profiling or a set of clinical variables
(7–10). This led us to believe that
combination miRNAs expression profile, targeted genes and gene
expression profile may obtain more accurate genes to predict
recurrence. Thus, we set out to investigate recurrence-related
genes by intergration of miRNAs and gene expression profiling in
advanced gastric cancer.
In this study, we predicted the targeted genes which
plausibly are regulated by the identified miRNAs using miRanda,
TargetScan and PicTar and obtained 3,263 predicted miRNA targets.
At the same time, a recurrence related gene expression profile
based on 11 GC microarray data was constructed for combination with
miRNA targeted genes. A total of 228 different genes were
identified with the criteria of P<0.05, fold-change >2.0. We
further integrated three bioinformatics methods to extract genes
with characteristic expression and finally obtain a single gene set
(HNRPA0 and PRDM4) which have potential to predict recurrence risk
in GC.
Materials and methods
Clinical samples
Patients undergoing gastrectomy for potentially
curable GC at the Wuhan General Hospital of Guangzhou Command were
subjects in this study. Eligibility for inclusion in this study
included histologically confirmed adenocarcinoma of the stomach or
gastroesophageal junction. All patients had received complete
resections including an attempt at complete tumor removal with
inclusion of wide negative margins and extended retroperitoneal
lymphadenectomy (D2 type). Information on clinicopathological,
therapeutic and outcome parameters of patients from May 2005 to
June 2010 was collected retrospectively. Cancer staging was
performed according to the fifth edition of the American Joint
Commission on Cancer TNM criteria.
Recurrence was defined as any cancer recurrence
including lymph node, remnant stomach, local, peritoneal and
hematogenous metastases over 1 year after surgical operation. All
patients that experienced recurrence of cancer were diagnosed
clinically or radiographically and confirmed by biopsy via upper
gastrointestinal endoscope or percutaneous puncture. The
radiographic standard for the recurrence diagnosis included CT or
MRI of the chest, abdomen, pelvis, head and bone scans, or other
diagnostic tests which were used only under special circumstances.
All of the samples were obtained from surgical specimens of
patients with gastric adenocarcinoma and all patients gave written
consent for the use of these tissues for research purposes. We
selected samples from 48 patients with and without GC
recurrence.
This study has been approved by the Ethics Committee
of the Wuhan General Hospital of Guangzhou Command, PLA. All
gastric cancer patients provided written informed consent in our
study.
Prediction of miRNA targeted genes
We utilized three different databases to select
plausible targets of the differential expressed miRNAs: miRanda
(http://www.microrna.org), TargetScan (http://www.targetscan.org) and PicTar (http://pictar.mdc-berlin.de). To identify which genes
were most likely targeted with the given miRNAs, we integrated the
results come from the different databases.
Microarray experiments
The microarray experiments were performed as
described in detail on the website of CapitalBio (http://www.capitalbio.com). A Human Genome Oligo Set
Version 2.1 consisting of about 22,000 human genes was purchased
from Qiagen Operon Co. A total of 11 GC samples were selected for
microarray experiment, including 7 and 4 samples with and without
recurrence, respectively. Total RNA was extracted with TRIzol
reagent (Invitrogen, Gaithersburg, MD) and further purified with a
NucleoSpin RNA Clean-up kit (Macherey-Nagel, Germany). Fluorescent
dye (cy5 and cy3-dCTP) labeled DNA was produced through an RNA
amplification method and subsequently followed the method
previously published (11). Arrays
were scanned with a confocal Lux Scanner and images were analyzed
with two-channal microarray technology, fluorescent dye-labeled
cDNA from each GC samples were pooled to hybridize with one chip
and hybridization was performed in duplicate with dye-reversal
approach. Only spots with intensity in at least one channel
exceeding the local background signal plus 3 standard deviations
were accepted for further analysis. Then a space and
intensity-dependent normalization based on a LOWESS in the R
language package (http://www.R-project.org) was employed to normalize
the two-channel ratio value.
Unsupervised algorithms
Significance analysis of microarrays (SAM) was used
to perform the unsupervised calculation. SAM is a statistical
technique based on t-test for finding significant genes in a set of
microarray experiments. It was proposed by Tusher et al
(12). SAM computes a statistic
di for each gene i, measuring the
strength of the relationship between gene expression and the
response variable. It uses repeated permutations of the data to
determine if the expression level of some genes were significantly
related to the response. The cut-off for significance is determined
by a tuning parameter delta, chosen by the user based on the false
positive rate. A fold-change parameter can also be chosen to ensure
that the called genes change at least a pre-specified amount.
Hierarchical clustering of the differential expressed genes was
performed with Cluster 3.0 version and Genesis using the average
linkage algorithm.
Supervised machine learning
algorithms
For the purpose of selecting feature genes, as well
as classifying observations precisely, we applied various kinds of
machine learning algorithms. Prediction analysis of microarrays
(PAM) is a statistical technique for class prediction from gene
expression data using nearest shrunken centroids. The method of
nearest shrunken centroids identifies subsets of genes that best
characterize each class (13).
Support vector machine (SVM) is one of the most
classic supervised learning algorithms, useful for recognizing
subtle patterns in complex datasets (14). It has been successfully applied to
the classification of cancer tissue samples based on microarray
expression data (15). The
algorithm performs discriminative classification, learning by
example to predict the classifications of previously unclassified
data. In principle, the SVM can be applied to very high dimensional
data without altering its formulation. Such capacity is well suited
to the microarray data structure. In our study, we used
Bhattacharyya distance as classification index and SVM as
classifier to perform the feature selection. Leave-one-out cross
validation (LOOCV) was used to validate the classification
accuracy.
Random forests (RF) is one of the most important
supervised methods for feature gene selection (16–18).
During the classifying process, RF returns several measures of
variable importance. The most reliable measure is based on the
decrease of classification accuracy when values of a variable in a
node of a tree are permuted randomly.
Receiver operating characteristic (ROC)
curves and statistical analyses
ROC curves (MedCalc, 8.2.1.0 version, Mariakerke,
Belgium) were used to analyze the classification sensitivity and
specificity of the feature genes based on test samples. The Ct
values of each sample after real-time PCR were used to perform the
ROC analysis. The clinical data were analyzed using the t-test,
with P<0.05 considered statistically significant. The survival
curve study was also analyzed by MedCalc.
RNA isolation and real-time PCR
We collected 37 human GC tissues from the Wuhan
General Hospital of the Guangzhou Military Command for real-time
PCR experiment, including 16 GC samples with and 21 without
recurrence. Total RNA was extracted from the tissue samples
according to standard TRIzol protocol (Invitrogen, Carlsbad, CA,
USA). Total RNA (5 μg) was reverse transcribed to cDNA with 200 U
M-MLV reverse transcriptase (Promega, Madison, WI, USA) according
to a standard manufacturer’s protocol. RT reaction conditions were
used: 37°C for 60 min, 72°C for 10 min. Q-RT-PCR was performed in a
total 20 μl reaction mixture 2 μl of cDNA, 0.6 μl 20X EvaGreen
(CapitalBio Corp., Beijing, China), 0.5 μl of each 10 μM forward
and reverse primers, 0.5 μl of 2.5 mM dNTP, 1.5 U Cap Taq
polymerase (CapitalBio Corp.), 10 μl 2X PCR buffer for EvaGreen and
6.1 μl of H2O. Quantification of differentially
expressed genes was conducted with an RT-Cycler™ 2.0 system
(CapitalBio Corp.). Q-RT-PCR was carried out with programmed
parameters, heating at 95°C for 5 min followed by 40 cycles of a
three-stage temperature profile of 95°C for 30 sec, 57°C for 30
sec, 72°C for 30 sec. The expression of each gene/miRNAs was
normalized with β-actin/U6 snRNA expression and according to the
2−ΔΔCt formula (19).
Results
Clinical characteristics of GC
patients
A total of 48 patients with/without recurrence were
selected for systematic analysis. Twenty-three patients had
recurring GC that was proven pathologically by biopsy at
anastomosis sites via endoscopy. Twenty-five patients without
recurrence were selected as the control group with matches in
gender, age at diagnosis, TNM staging, treatment and the number of
involved lymph node (Table I).
 | Table IDetails of patients and tumors used in
this study. |
Table I
Details of patients and tumors used in
this study.
| Characteristics | Recurrence group
(n=23) | Non-recurrence group
(n=25) | P-value |
|---|
| Gender | | | |
| Male | 18 | 15 | |
| Female | 5 | 10 | 0.173 |
| Age (year) | | | |
| Median | 64 | 56 | 0.231 |
| Range | 30–83 | 33–79 | |
| Tumor location | | | |
| Cardia | 8 | 4 | 0.318 |
| Body | 4 | 5 | |
| Pyloric antrum | 11 | 16 | |
| Differentiation | | | |
| Poor | 13 | 15 | 0.971 |
|
Moderate-poor | 6 | 6 | |
| Others | 4 | 4 | |
| Lymph node
resection | | | |
| <12 | 20 | 25 | 0.062 |
| >12 | 3 | 0 | |
| UICC stage | | | |
| I | 2 | 5 | 0.108 |
| II | 2 | 5 | |
| III | 16 | 15 | |
| IV(M0) | 3 | 0 | |
| Embolus | | | |
| With | 9 | 3 | 0.03 |
| Without | 14 | 22 | |
| Adjuvant
chemotherapy | | | |
| Performed | 10 | 12 | 0.967 |
| Not
performed | 13 | 13 | |
| Patients’
status | | | |
| Survival | 7 | 20 | <0.001 |
| Death | 16 | 5 | |
| Median survival
time (month) | 23.4 | 61.1 | <0.001 |
There was no significant difference in the gender
(P=0.173), age (P= 0.231), tumor location (P= 0.318),
differentiation (P=0.971), lymph node resection (P=0.062), UICC
stage (P= 0.108) and status of adjuvant chemotherapy (P= 0.967).
There was a significant difference in survival/death ratio noted
(7/16 in recurrence group vs. 20/5 in non-recurrence group,
P<0.001), with median survival time of 23.4 months in recurrence
vs. 61.1 months in non-recurrence group respectively (P<0.001)
(Table I).
Identification of genes plausibly
regulated by recurrence-related miRNAs
We previous analyzed the miRNAs expression in 4
recurrence and 4 non-recurrence GC patients. A total of 17 miRNAs
were identified as candidate biomarkers related to the recurrence
risk of GC. We searched for putative 17 miRNAs targeted genes
employing the most widely used programs including miRanda,
TargetScan and PicTar, and obtained 4,352 plausible targeted genes,
including 1,089 genes regulated by more than two miRNAs. Finally, a
total of 3,263 targeted genes were focused for next study (Table II).
| Table IIDifferential expressed genes
regulated by identified microRNAs. |
Table II
Differential expressed genes
regulated by identified microRNAs.
| Expressed
level | microRNAs | No. of target
genes |
|---|
| Up in recurrence
samples | hsa-miR-128b | 433 |
| hsa-miR-133a/b | 302 |
| hsa-miR-375 | 161 |
|
hsa-miR-200b/c/429 | 484 |
| hsa-miR-194 | 207 |
| hsa-miR-335 | 146 |
| hsa-miR-422b | 477 |
| Down in recurrence
samples | hsa-miR-19a | 527 |
| hsa-miR-373 | 298 |
| hsa-miR-217 | 159 |
| hsa-miR-142-3p | 162 |
| hsa-miR-142-5p | 307 |
| hsa-miR-32 | 567 |
| hsa-miR-296 | 122 |
| Total | 17 | 4352 |
Meanwhile, a total of 2,736 genes were differential
expressed in recurrence compared with non-recurrence group with a
criteria of P<0.05, FC>1.0. Combined with the differential
expressed genes and the miRNAs targeted genes, we obtained 228
genes which were probably regulated by miRNAs. Hierarchical
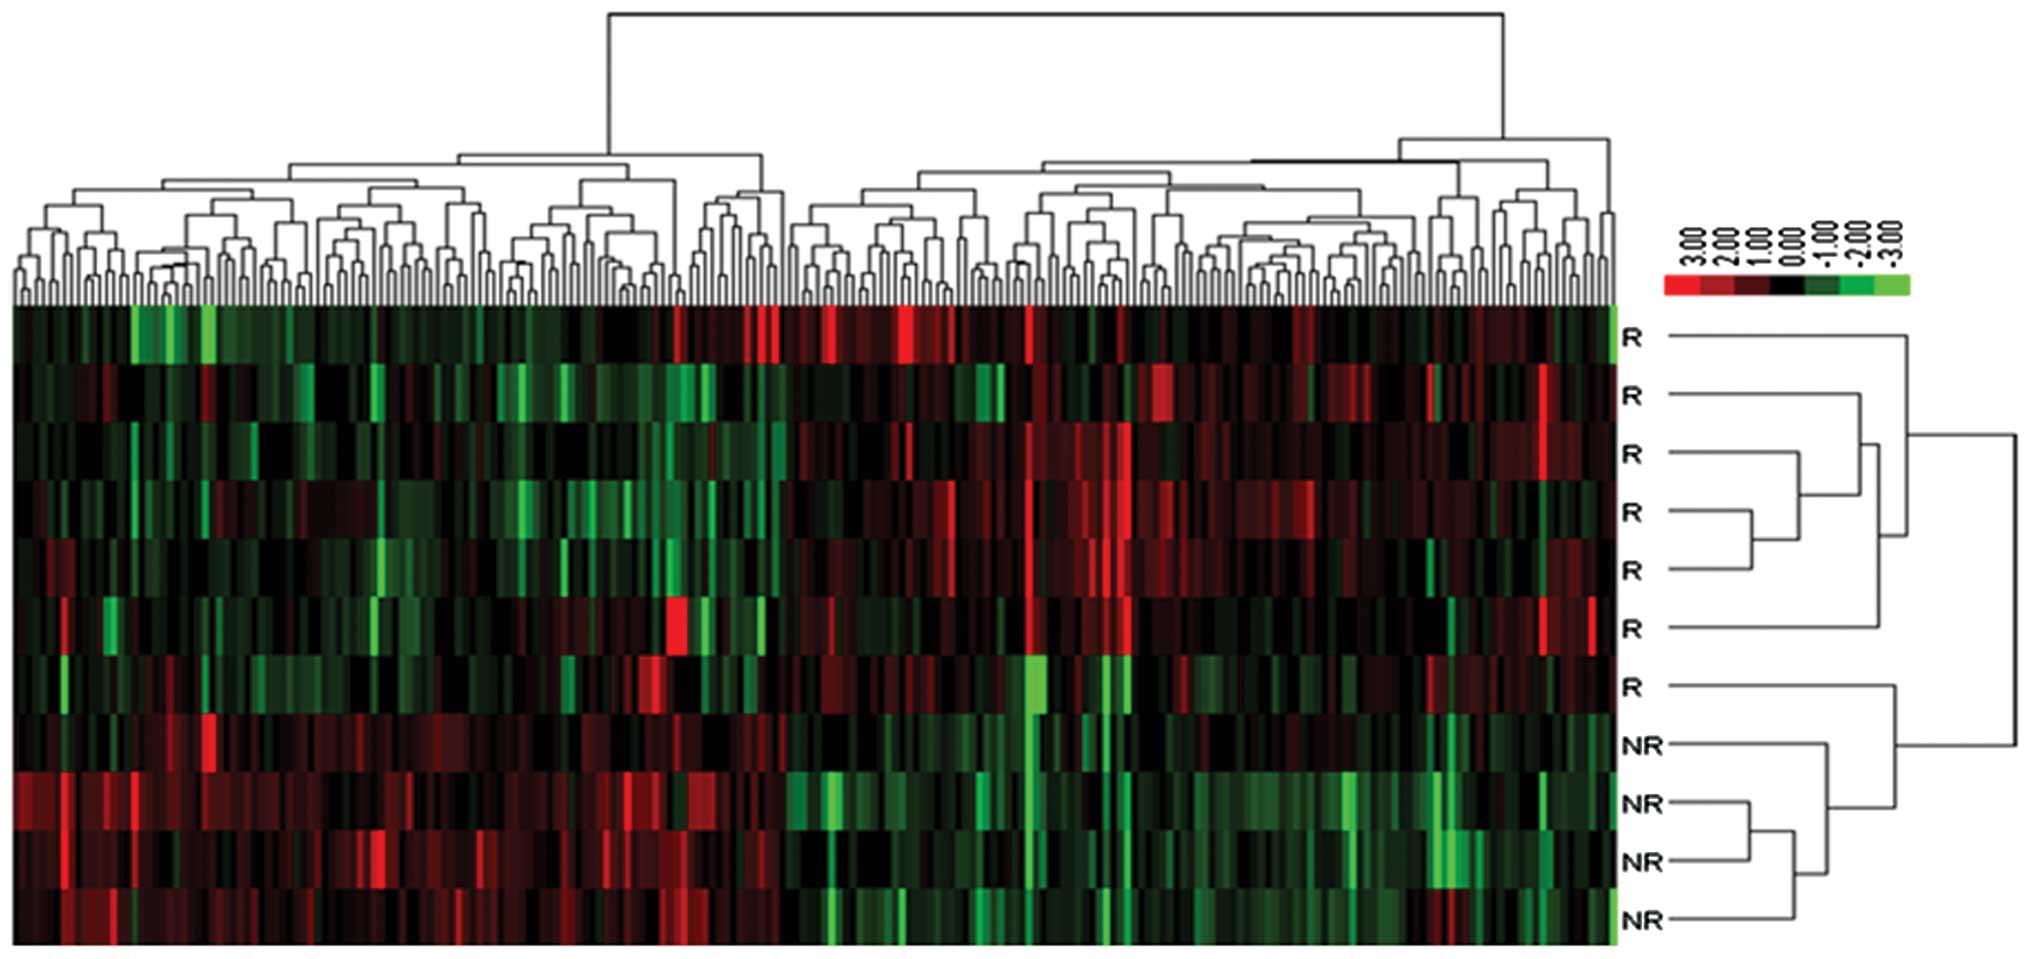
clustering of the data matrix consist of 228 genes is shown in
Fig. 1.
Identification of a two-gene signature to
distinguish recurrence from non-recurrence GC samples
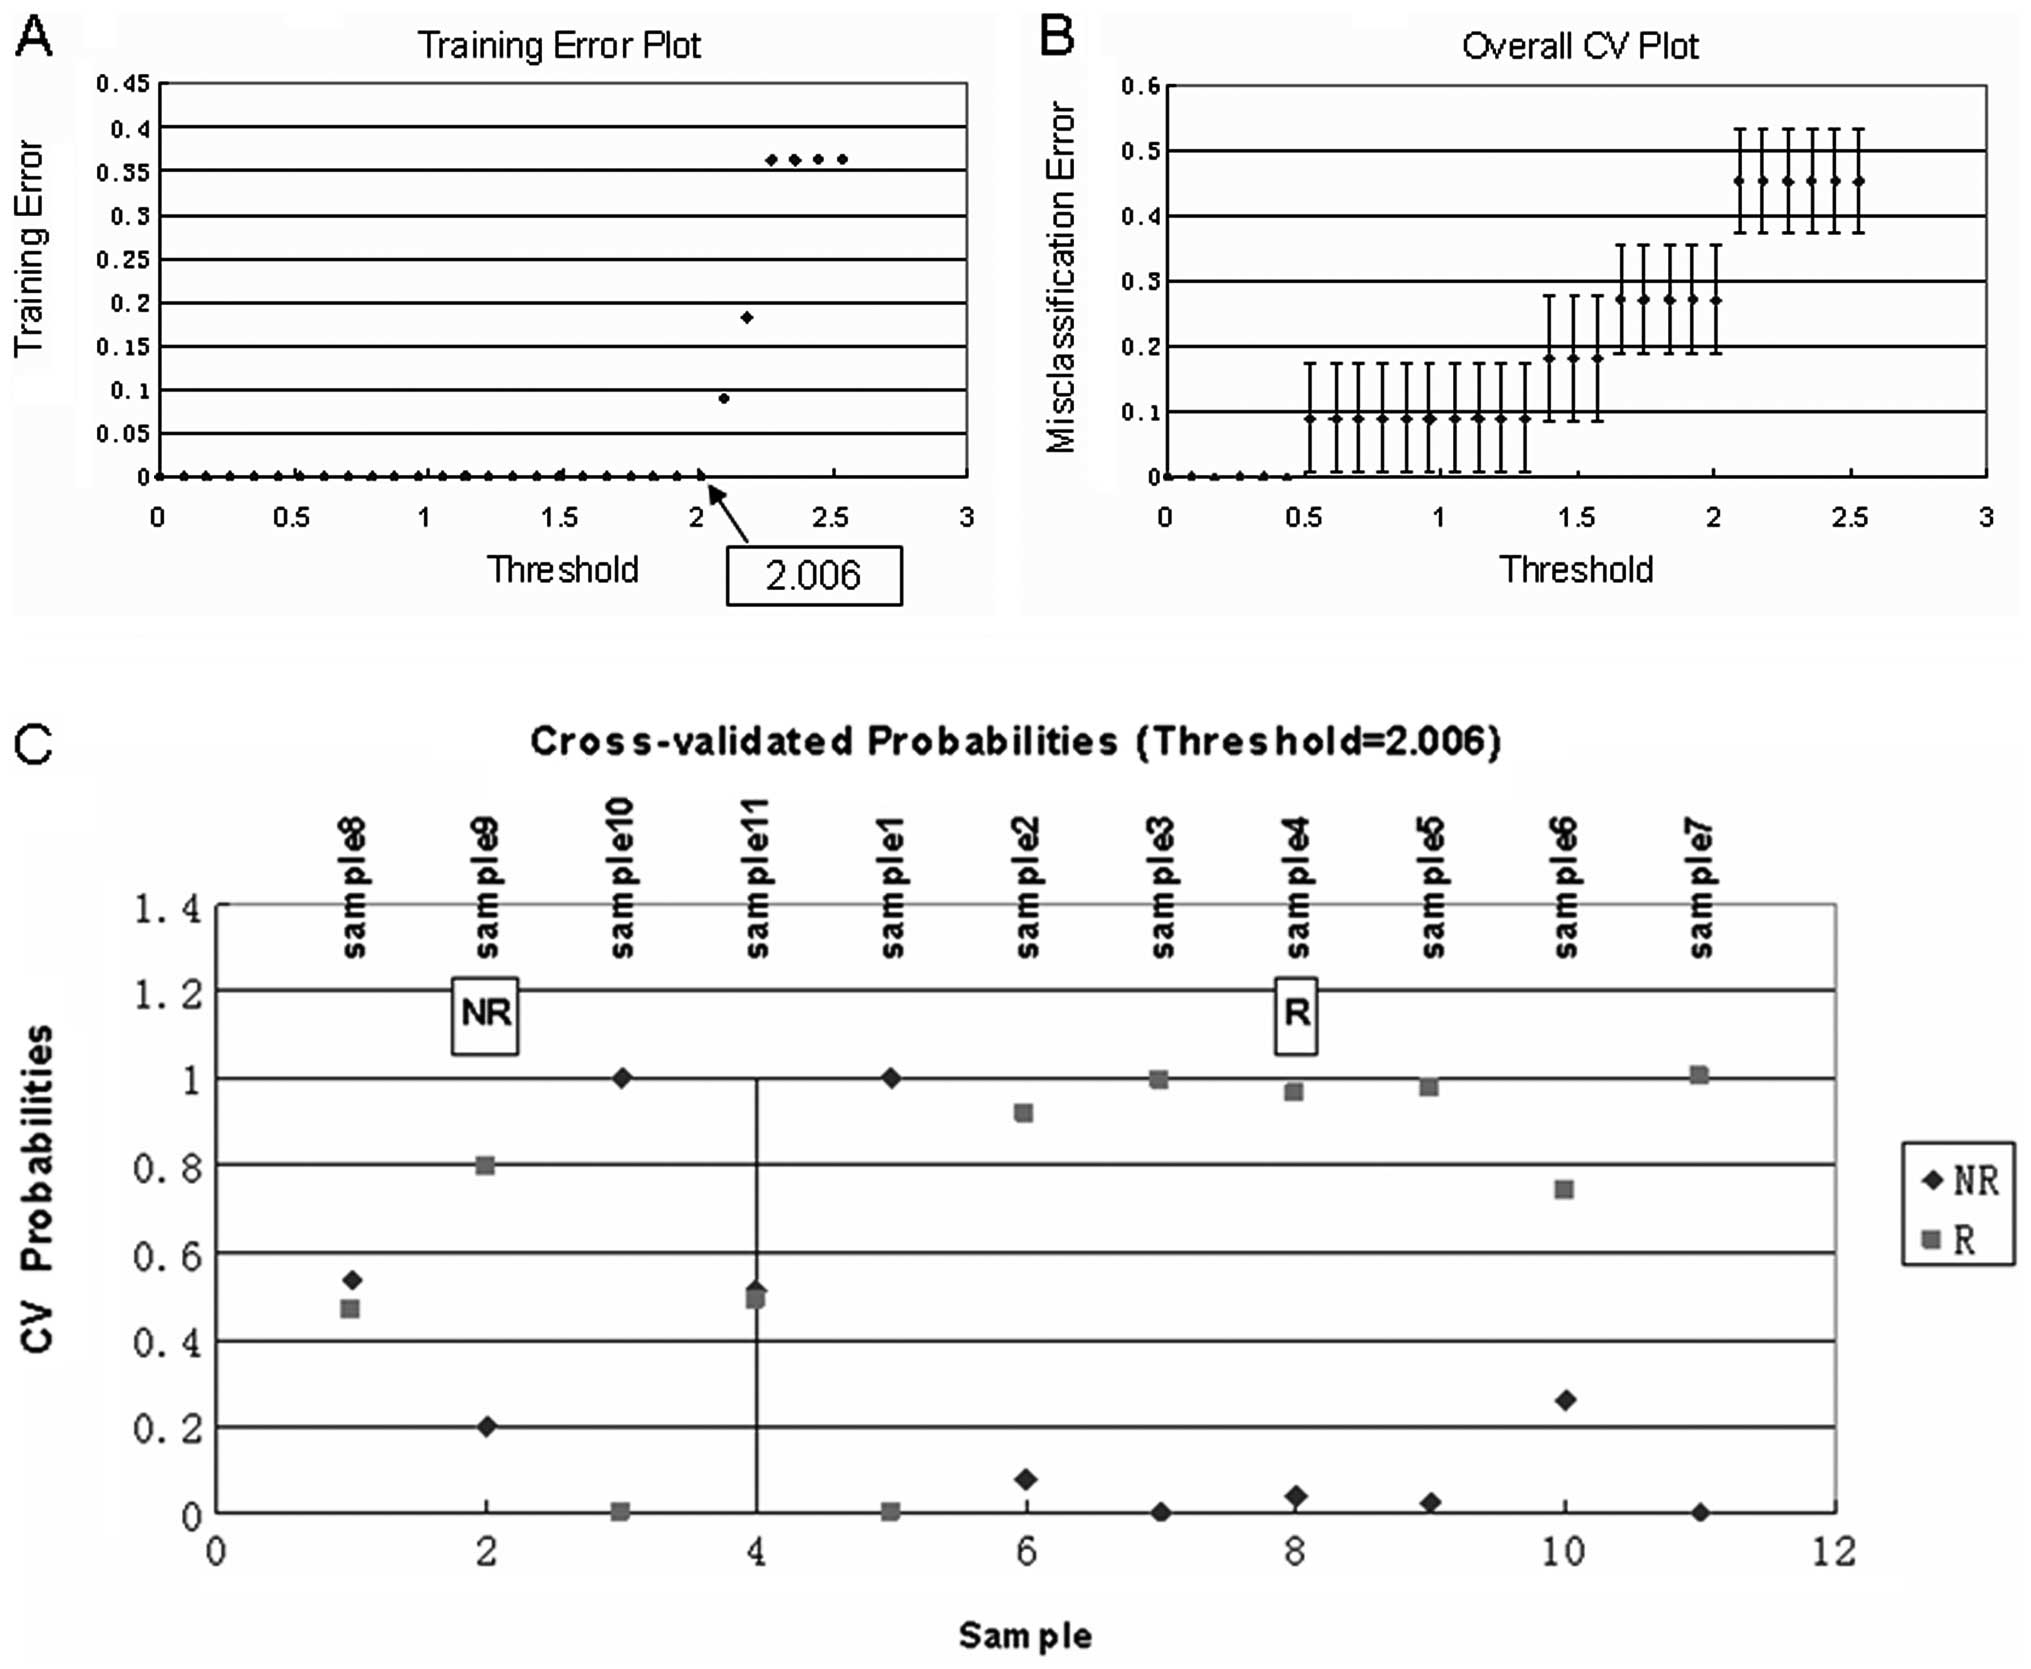
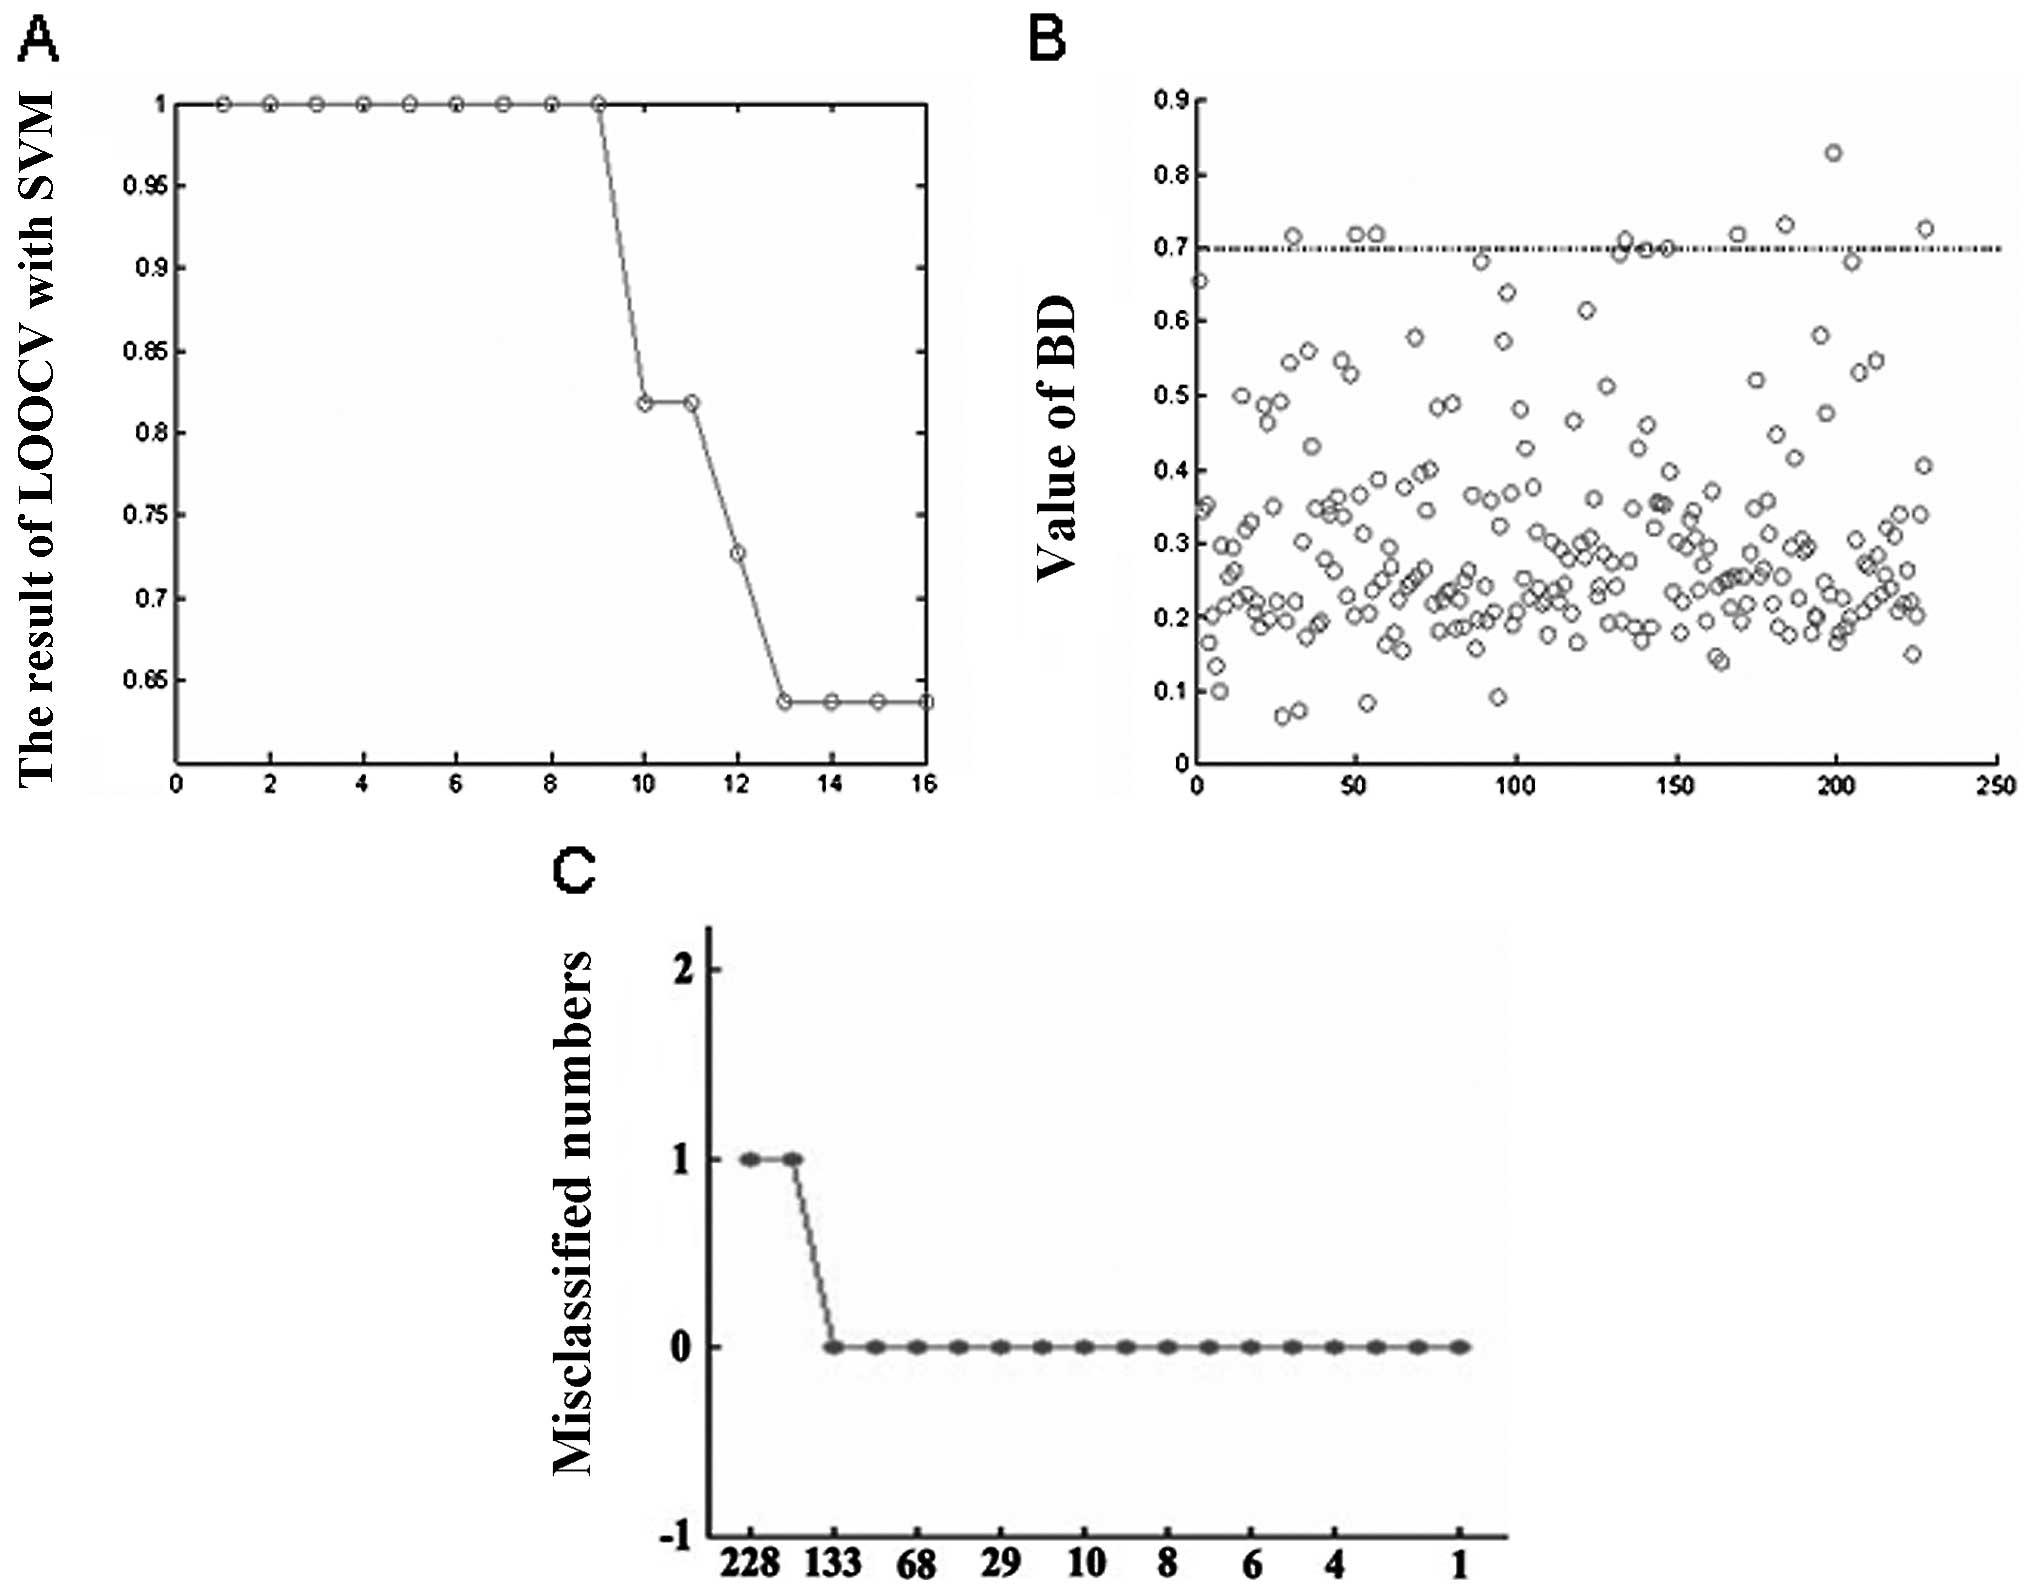
For these 228 differentially expressed genes, we
used PAM, SVM and RF approaches for supervised classification and
selecting feature genes. A total of 11, 9 and 10 genes were
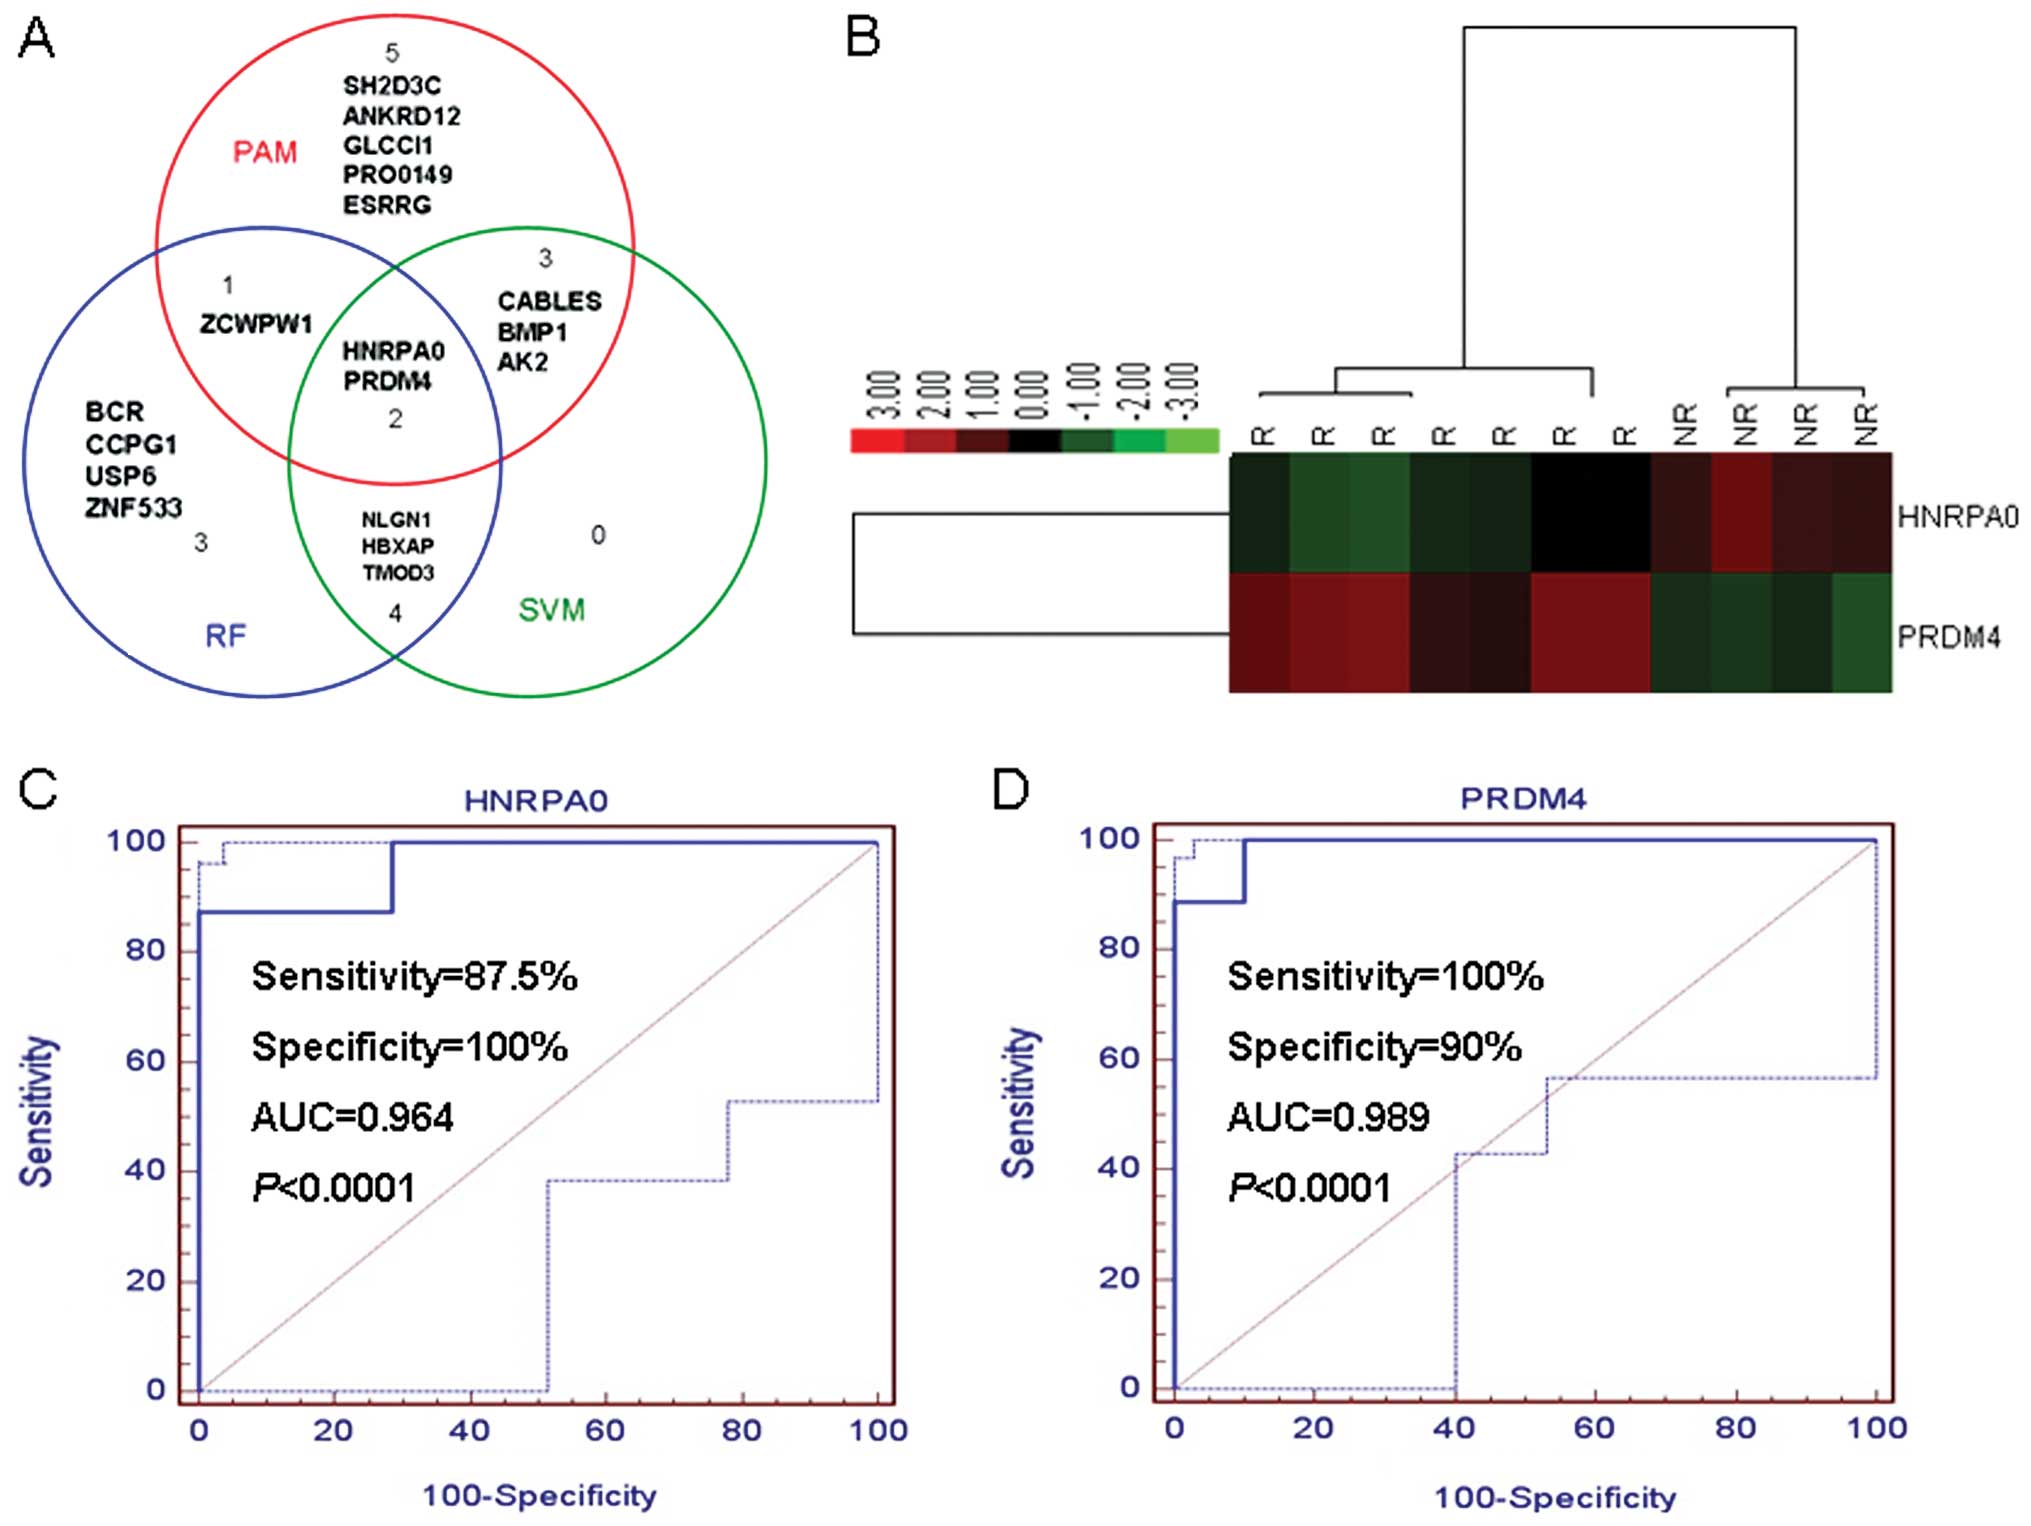
selected as best classifiers using PAM (Fig. 2 and Table III), SVM (Fig. 3A and B and Table IV) and RF (Fig. 3C and Table V), respectively. We integrated the
results from the 3 approaches, and identified a two-gene signature
(HNRPA0 and PRDM4) which has potential to classify the recurrence
and non-recurrence gastric cancer samples correctly (Fig. 4A and B) with a high sensitivity and
specificity in microarray samples, respectively (Fig. 4C and D). Our results showed that
HNRPA0 and PRDM4 were plausibly regulated by hsa-miR-194 and
hsa-miR-373, respectively. The results matched our previous
microarray study, hsa-miR-194 was upregulated while HNRPA0
downregulated in recurrence group; hsa-miR-373 was downregulated in
recurrence group while a low expression of PRDM4 were observed in
recurrence group.
| Table IIIFeature genes selection based on
PAM. |
Table III
Feature genes selection based on
PAM.
| Genes | ACC | R score | NR score |
|---|
| SH2D3C | NM_005489 | 0.1668 | −0.2918 |
| ANKRD12 | NM_015208 | 0.1474 | −0.258 |
| ZCWPW1 | NM_017984 | −0.1168 | 0.2044 |
| BMP1 | NM_006129 | −0.1102 | 0.1929 |
| CABLES2 | BC003122 | 0.1085 | −0.1899 |
| GLCCI1 | AK055741 | 0.0812 | −0.1421 |
| AK2 | AK023758 | −0.0665 | 0.1163 |
| HNRPA0 | U23803 | −0.0621 | 0.1086 |
| ESRRG | NM_001438 | 0.0316 | −0.0554 |
| PRO0149 | NM_014117 | −0.0269 | 0.0471 |
| PRDM4 | NM_012406 | 0.0048 | −0.0084 |
| Table IVFeature genes selection based on
SVM. |
Table IV
Feature genes selection based on
SVM.
| Value of BD | No. of genes | Correct rate
(%) |
|---|
| t=0.8 | 1 | 100 |
| t=0.7 | 8 | 100 |
| t=0.6 | 16 | 63.64 |
| t=0.5 | 27 | 63.64 |
| t=0.4 | 43 | 63.64 |
| t=0.3 | 90 | 63.64 |
| t=0.2 | 184 | 63.64 |
| t=0.1 | 223 | 63.64 |
| t=0 | 228 | 63.64 |
| Table VFeature genes selection based on
RF. |
Table V
Feature genes selection based on
RF.
| Genes | R score | NR score | Accuracy | Gini index |
|---|
| BCR | 17.330 | 20.893 | 12.513 | 0.481 |
| HBXAP | 16.939 | 21.181 | 12.418 | 0.492 |
| NLGN1 | 16.756 | 21.109 | 12.369 | 0.463 |
| ZCWPW1 | 16.718 | 21.328 | 12.336 | 0.460 |
| CCPG1 | 16.488 | 20.349 | 12.030 | 0.462 |
| TMOD3 | 15.923 | 19.992 | 11.713 | 0.457 |
| USP6 | 16.117 | 19.605 | 11.677 | 0.444 |
| PRDM4 | 15.614 | 20.020 | 11.653 | 0.466 |
| HNRPA0 | 15.503 | 19.711 | 11.503 | 0.464 |
| ZNF533 | 15.215 | 18.938 | 11.125 | 0.477 |
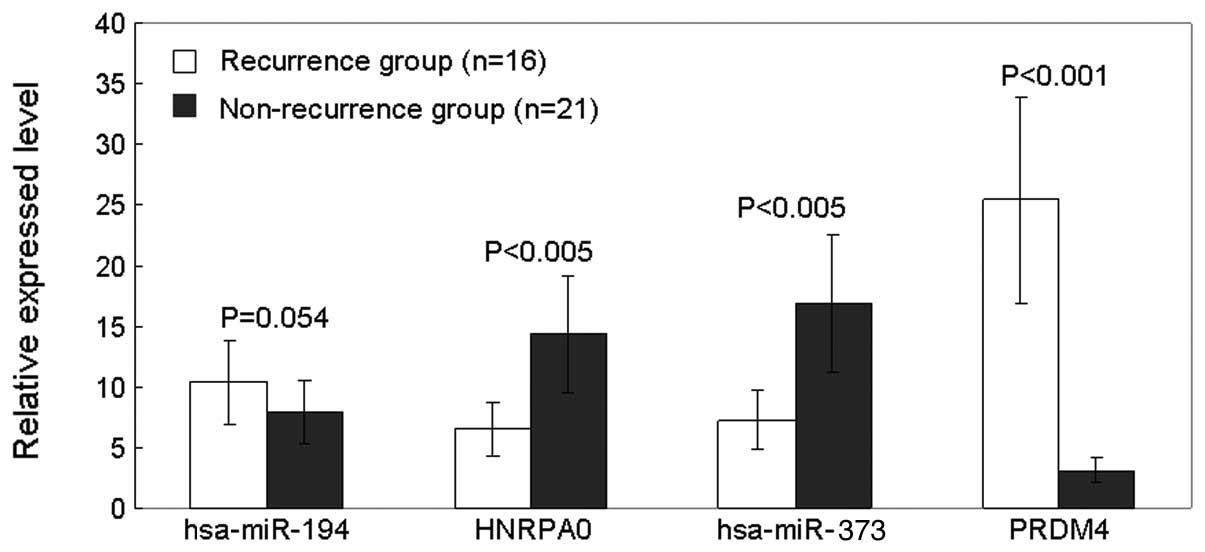
Validation of the expression levels of
the identified miRNAs and its target genes using quantitative
real-time PCR
The relative expression levels of hsa-miR-194,
hsa-miR-373, HNRPA0 and PRDM4 were detected by real-time PCR in all
the other 37 test samples (11 samples as training used for
microarray) compared with the matched adjacent tissue as control.
The results showed that the relative expression level of
hsa-miR-194 was 10.36 in recurrence group compared to 7.83 in
non-recurrence group; of HNRPA0 was 9.49 and 14.34 in recurrence
compared to non-recurrence group. Similar results were observed on
hsa-miR-373 and PRDM4. The relative expression level of hsa-miR-373
was 7.26 and 16.92, and PRDM4 was 25.42 and 3.11 in recurrence
compared to non-recurrence group, respectively (Fig. 5).
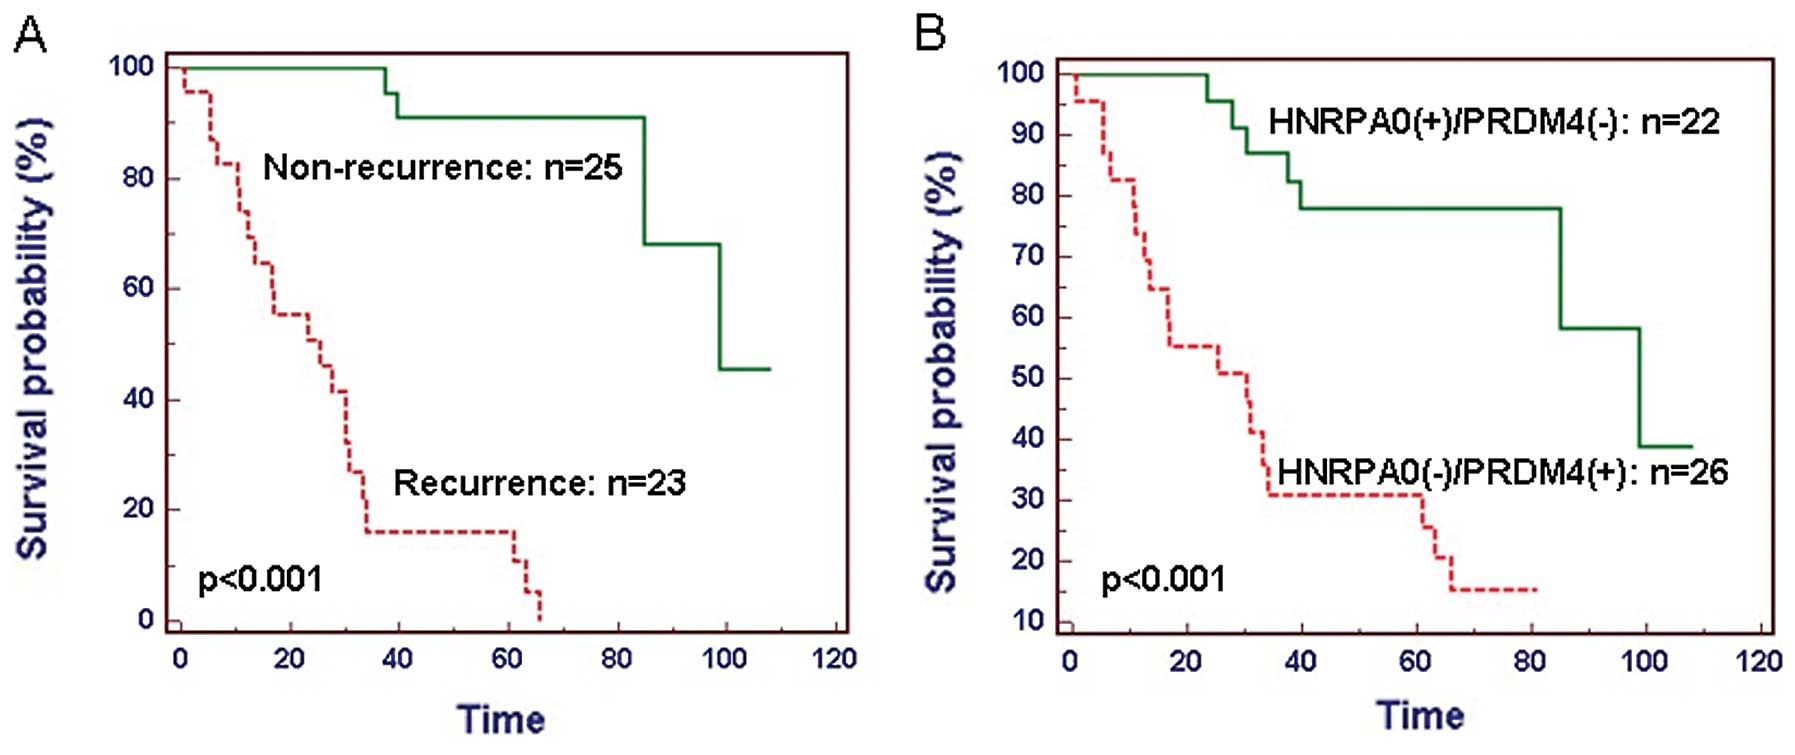
Combination of HNRPA0 and PRDM4 as a
signature to predict recurrence risk in GC patients
The 48 GC patients were divided into two groups,
including 23 patients with recurrence as a group and 25 patients
without recurrence as a group. The patients who experienced a
recurrence of GC had a significantly reduced median survival rate
(P<0.001; Fig. 6A). Combined
with the expression levels of HNRPA0 and PRDM4 detected by
real-time PCR in 37 GC test samples and the microarray data in 11
training samples, we divided our patients into two groups:
HNRPA0(+)/PRDM4(-) and HNRPA0(-)/PRDM4(+), represent high expressed
HNRPA0 and low expressed PRDM4 group, low expressed HNRPA0 and high
expressed PRDM4 group, respectively. A significant difference of
survival time was observed between HNRPA0(+)/PRDM4(-) and
HNRPA0(-)/PRDM4(+) group (P<0.001; Fig. 6B). GC patients with
HNRPA0(+)/PRDM4(-) had significantly reduced median and overall
survival compared to those with HNRPA0(-)/PRDM4(+).
Discussion
Recurrence in early gastric cancer patients is rare,
while most patients who have undergone non-curative surgery recur
rapidly. Therefore, it is important to identify high-risk cases for
recurrence among advanced gastric cancer patients after curative
resection. Traditional clinicopathological factors are sometimes
inadequate for prediction of recurrence in individuals and many
research groups have attempted to identify new technologies that
may distinguish high-risk cases. Many investigations documented
that miRNAs alterations are involved in the initiation and
progression of human cancers (20–25).
Microarray technology has developed significantly and become a
comprehensive and useful method to help us better understands
cancers (26). miRNA expression
profiling of human tumors from microarray technology has identified
signatures associated with diagnosis, staging, progression,
prognosis and response to treatment (27–33).
Therefore, we identified a recurrence related miRNA profiling for
recurrence risk prediction based on a group of Chinese GC
patients.
To commence understanding how the expression changes
of the 17 miRNAs affect outcome, we identified
recurrence-associated miRNA-targeted genes that are differentially
expressed in patients who develop recurrence. Then a combination
was performed between miRNA targeted genes and gene expression
profile data. In this study, we analyzed primary gastric cancer
cases to predict recurrence and defined recurrence-free cases as
those free of recurrence for at least one year after curative
resection. We integrated recurrence of advanced gastric cancer
associated miRNA expression profile, targeted genes and gene
expression profile and obtain a two-gene classifier to predict
recurrence.
Until now, the genes designated in this study to
predict the risk of GC recurrence have not been well-characterized.
There were no research articles reported on the differential
expression in human cancer and no reports on their expression
related with microRNAs. HNRPA0 belongs to the A/B subfamily of
ubiquitously expressed heterogeneous nuclear ribonucleo-proteins
(hnRNPs). Gene Ontology (GO) analyses show that HNRPA0 participated
in the process of 3′-UTR-mediated mRNA stabilization and regulated
the expression of downstream genes.
The protein encoded by PRDM4 is a transcription
factor of the PR-domain protein family. Transcription factors of
the PR-domain family are known to be involved in cell
differentiation and tumorigenesis. An elevated expression level of
this gene has been observed in PC12 cells treated with nerve growth
factor, β polypeptide and it also has been reported to act as a
tumor suppressor (34). Similar
results were confirmed by GO analyses: PRDM4 acts as a tumor
suppressor in negatively regulating cell growth, cell cycle and
cell proliferation. Although the functional role of PRDM4 in
gastric cancer is unknown, our findings are encouraging.
In summary, we identified a two-gene classifier
which can predict recurrence in patients with advanced gastric
cancer after curative resection. By combining this classifier with
conventional clinicopathological factors, we aim to predict the
patient outcome more accurately. The identification of high-risk
patients would lead to consideration of additional therapeutic
intervention and may be informative for selection of a better
follow-up program.
Acknowledgements
We thank Professor Jiangeng Li
(Academy of Electronic Information and Control Engineering, Beijing
University of Technology, China) for providing assistance in
processing the microarray data with machine learning algorithms. We
also thank the Department of Pathology of the Wuhan General
Hospital of Guangzhou Command for providing the gastric cancer
samples in this study.
References
|
1.
|
Yang L: Incidence and mortality of gastric
cancer in China. World J Gastroenterol. 12:17–20. 2006.
|
|
2.
|
Macdonald JS, Smalley SR, Benedetti J, et
al: Chemoradiotherapy after surgery compared with surgery alone for
adenocarcinoma of the stomach or gastroesophageal junction. N Engl
J Med. 345:725–730. 2001. View Article : Google Scholar
|
|
3.
|
Lehnert T, Rudek B, Buhl K, et al:
Surgical therapy for loco-regional recurrence and distant
metastasis of gastric cancer. Eur J Surg Oncol. 28:455–461. 2002.
View Article : Google Scholar : PubMed/NCBI
|
|
4.
|
Zhang X, Yan Z, Zhang J, et al:
Combination of hsa-miR-375 and hsa-miR-142-5p as a predictor for
recurrence risk in gastric cancer patients following surgical
resection. Ann Oncol. 22:2257–2266. 2011. View Article : Google Scholar : PubMed/NCBI
|
|
5.
|
Roukos DH and Kappas AM: Limitations in
controlling risk for recurrence after curative surgery for advanced
gastric cancer are now well-explained by molecular-based
mechanisms. Ann Surg Oncol. 8:620–621. 2001. View Article : Google Scholar : PubMed/NCBI
|
|
6.
|
Fondevila C, Metges JP, Fuster J, et al:
p53 and VEGF expression are independent predictors of tumour
recurrence and survival following curative resection of gastric
cancer. Br J Cancer. 90:206–215. 2004. View Article : Google Scholar : PubMed/NCBI
|
|
7.
|
Marrelli D, De Stefano A, de Manzoni G, et
al: Prediction of recurrence after radical surgery for gastric
cancer a scoring system obtained from a prospective multicenter
study. Ann Surg. 241:247–255. 2005. View Article : Google Scholar : PubMed/NCBI
|
|
8.
|
Inoue H, Matsuyama A, Mimori K, et al:
Prognostic score of gastric cancer determined by cDNA microarray.
Clin Cancer Res. 8:3475–3479. 2002.PubMed/NCBI
|
|
9.
|
Motoori M, Takemasa I and Yano M:
Prediction of recurrence in advanced gastric cancer patients after
curative resection by gene expression profiling. Int J Cancer.
114:963–968. 2005. View Article : Google Scholar : PubMed/NCBI
|
|
10.
|
Sim SH, Kim YJ, Oh DY, et al: The role of
PET/CT in detection of gastric cancer recurrence. BMC Cancer.
9:732009. View Article : Google Scholar : PubMed/NCBI
|
|
11.
|
Patterson TA, Lobenhofer EK,
Fulmer-Smentek SB, et al: Performance comparison of one-color and
two-color platforms within the MicroArray Quality Control (MAQC)
project. Nat Biotechnol. 24:1140–1150. 2006. View Article : Google Scholar : PubMed/NCBI
|
|
12.
|
Tusher VG, Tibshirani R and Chu G:
Significance analysis of microarrays applied to transcriptional
responses to ionizing radiation. Proc Natl Acad Sci USA.
98:5116–5121. 2001. View Article : Google Scholar : PubMed/NCBI
|
|
13.
|
Tibshirani RJ, Hastie TJ, Narasimhan B, et
al: Diagnosis of multiple cancer types by shrunken centroids of
gene expression. Proc Natl Acad Sci USA. 99:6567–6572. 2002.
View Article : Google Scholar : PubMed/NCBI
|
|
14.
|
Guyon I, Weston J, Barnhill S, et al: Gene
selection for cancer classification using support vector machines.
Machine Learning. 46:389–422. 2002. View Article : Google Scholar
|
|
15.
|
Furey TS, Cristianini N, Duffy N, et al:
Support vector machines classification and validation of cancer
tissue samples using microarray expression data. Bioinformatics.
16:906–914. 2000. View Article : Google Scholar : PubMed/NCBI
|
|
16.
|
Chen X and Ishwaran H: Random forests for
genomic data analysis. Genomics. 99:323–329. 2012. View Article : Google Scholar : PubMed/NCBI
|
|
17.
|
Li S, Harner EJ and Adjeroh DA: Random KNN
feature selection - a fast and stable alternative to Random
Forests. BMC Bioinformatics. 12:4502011. View Article : Google Scholar : PubMed/NCBI
|
|
18.
|
Yan Z, Li J, Xiong Y, et al:
Identification of candidate colon cancer biomarkers by applying a
random forest approach on microarray data. Oncol Rep. 28:1036–1042.
2012.PubMed/NCBI
|
|
19.
|
Kenneth JL and Thomas DS: Analysis of
relative gene expression data using real-time quantitative PCR and
the 2-ΔΔCt method. Methods. 25:402–408. 2001.
|
|
20.
|
Tang F, Zhang R, He Y, et al:
MicroRNA-125b induces metastasis by targeting STARD13 in MCF-7 and
MDA-MB-231 breast cancer cells. PLoS One. 7:e354352012. View Article : Google Scholar : PubMed/NCBI
|
|
21.
|
Gregersen LH, Jacobsen A, Frankel LB, et
al: microRNA-143 down-regulates Hexokinase 2 in colon cancer cells.
BMC Cancer. 12:2322012. View Article : Google Scholar : PubMed/NCBI
|
|
22.
|
Dey N, Das F, Ghosh-Choudhury N, et al:
microRNA-21 governs TORC1 activation in renal cancer cell
proliferation and invasion. PLoS One. 7:e373662012. View Article : Google Scholar : PubMed/NCBI
|
|
23.
|
Kumar B, Yadav A, Lang J, et al:
Dysregulation of microRNA-34a expression in head and neck squamous
cell carcinoma promotes tumor growth and tumor angiogenesis. PLoS
One. 7:e376012012. View Article : Google Scholar : PubMed/NCBI
|
|
24.
|
Poy MN, Eliasson L, Krutzfeldt J, et al: A
pancreatic islet-specific microRNA regulates insulin secretion.
Nature. 432:226–230. 2004. View Article : Google Scholar : PubMed/NCBI
|
|
25.
|
Chen CZ, Li L, Lodish HF, et al: MicroRNAs
modulate hematopoietic lineage differentiation. Science. 303:83–86.
2004. View Article : Google Scholar : PubMed/NCBI
|
|
26.
|
Liang RQ, Li W, Li Y, et al: An
oligonucleotide microarray for microRNA expression analysis based
on labeling RNA with quantum dot and nanogold probe. Nucl Acids
Res. 33:e172005. View Article : Google Scholar : PubMed/NCBI
|
|
27.
|
Ralfkiaer U, Hagedorn PH, Bangsgaard N, et
al: Diagnostic microRNA profiling in cutaneous T-cell lymphoma
(CTCL). Blood. 118:5891–5900. 2011. View Article : Google Scholar : PubMed/NCBI
|
|
28.
|
Yan Z, Xiong Y, Xu W, et al:
Identification of hsa-miR-335 as a prognostic signature in gastric
cancer. PLoS One. 7:e400372012. View Article : Google Scholar : PubMed/NCBI
|
|
29.
|
Augello C, Vaira V, Caruso L, et al:
MicroRNA profiling of hepatocarcinogenesis identifies C19MC cluster
as a novel prognostic biomarker in hepatocellular carcinoma. Liver
Int. 32:772–782. 2012. View Article : Google Scholar : PubMed/NCBI
|
|
30.
|
Ferracin M, Pedriali M, Veronese A, et al:
MicroRNA profiling for the identification of cancers with unknown
primary tissue-of-origin. J Pathol. 225:43–53. 2011. View Article : Google Scholar : PubMed/NCBI
|
|
31.
|
Lu Y, Govindan R, Wang L, et al: MicroRNA
profiling and prediction of recurrence/relapse-free survival in
stage I lung cancer. Carcinogenesis. 33:1046–1054. 2012. View Article : Google Scholar : PubMed/NCBI
|
|
32.
|
Liu R, Chen X, Du Y, et al: Serum microRNA
expression profile as a biomarker in the diagnosis and prognosis of
pancreatic cancer. Clin Chem. 58:610–618. 2012. View Article : Google Scholar : PubMed/NCBI
|
|
33.
|
White NM, Khella HW, Grigull J, et al:
miRNA profiling in metastatic renal cell carcinoma reveals a
tumour-suppressor effect for miR-215. Br J Cancer. 105:1741–1749.
2011. View Article : Google Scholar : PubMed/NCBI
|
|
34.
|
Yang XH and Huang S: PFM1 (PRDM4), a new
member of the PR-domain family, maps to a tumor suppressor locus on
human chromosome 12q23–q24.1. Genomics. 61:319–325. 1999.PubMed/NCBI
|