Introduction
Pancreatic cancer is among the malignancies with the
worst patient outcome, representing the fourth most common cause of
cancer-related death in the US (1,2).
Unfortunately, at the time of diagnosis, only a minority of tumors
are restricted locally and therefore resectable, while the majority
(>85%) already shows regional or distant spread. For these late
stage tumors, systemic chemotherapy with antimetabolites such as
5-fluorouracil (5-FU) or gemcitabine is only a palliative option.
Although gemcitabine has shown improved objective response rates
over 5-FU (3) in terms of tumor
mass reduction and time to progression, most studies investigating
gemcitabine-based combinations have failed to show a statistically
significant survival benefit compared to gemcitabine alone. An
exception is the combination of gemcitabine with the tyrosine
kinase inhibitor erlotinib, for which an increase of 6% in one-year
survival rates over gemcitabine alone could be achieved. However,
the median survival improvement was merely ten days and no
statistically significant objective response rates compared to
gemcitabine monotherapy were achieved (4). The recent FOLFIRINOX study reports
median overall survival rates of about 10%, however, these rates
still lag behind achievable rates in other gastrointestinal tumors
(5). Overall, poor response rates
after single agent and combined therapies as well as the
development of chemoresistance result in a disappointing 5-year
median survival rate of 5%, a number that has not changed
significantly during the past 40 years (1,6,7).
A characteristic feature of pancreatic cancer is its
intrinsic resistance to chemotherapy, which is mediated by various
factors, such as hypovascularization, prominent desmoplasia, the
expression of drug metabolizing enzymes, and, as recent
publications suggest, the presence of putative pancreatic cancer
stem cells (8–10). The concept of organ stem cells,
slow-cycling cells with the capacity of unlimited self-renewal,
asymmetric cell division and differentiation into mature cell types
which reside in a supportive microenvironment/niche, is widely
accepted (5,9,11–15).
In the context of cancer, it implicates that cell types within a
tumor are unequal at any given time and that there is a
predetermined cell population with a stem cell phenotype, which
perpetuates the tumor while other cells of the same cancer are
incapable of self-renewal. It has also been shown that the cancer
stem cell subpopulation exhibits an enhanced resistance to
chemotherapy and radiation, both in hematologic malignancies and
solid tumors (16,17) and cell lines (18,19).
At present, however, the exact stem cell phenotype characterizing
this subpopulation of cells is not known for most solid tumors.
CD24+CD44+ESA+ or
CD133+CXCR4+ cells have been proposed to
represent this subpopulation in pancreatic cancer based on their
ability to self-renew, to effectively form xenografts in nude mice
or being able to metastasize (20). Side populations, defined as cells
that are able to exclude DNA-binding dyes such as Hoechst 33342,
have also been shown to be rich in CD133+ cells and also
express higher levels of drug-efflux pumps such as ABCG2, which
have been associated with gemcitabine resistance (21). Besides the pre-existence of
inherently resistant stem cells, several studies showed that the
epithelial-mesenchymal transition (EMT) is another mechanism that
is triggered when cells are challenged by cytostatic drugs
(22–24). In the context of cancer, tumor
cells of epithelial origin revert to a mesenchymal state, survive
chemotherapy and acquire an enhanced migratory and invasive
potential that might be responsible for tumor recurrence and
metastasis. Interestingly, when EMT is induced in tumor cells, not
only the presence of transformed mesenchymal cells increases, but
also the presence of cells with the above described cancer stem
cell phenotype (25). Taken
together, these studies indicate that the stem cell phenotype and
the EMT process are functionally linked and might confer resistance
to chemotherapy.
We therefore hypothesized that high-dose gemcitabine
treatment would enrich chemotherapy resistant cells which can be
identified by their expression of stem cell associated genes. Here
we investigate the expression of several known and new stem cell
markers along with EMT-associated genes in response to high-dose
gemcitabine treatment and show that surviving cells express
increased levels of stem cell genes and acquire the molecular
characteristics typical for EMT.
Materials and methods
Cell culture
Panc-1 cells were grown in DMEM (Biochrom, Berlin,
Germany) substituted with 10% fetal bovine serum (FBS, Biochrom).
Capan-1 cells were maintained in RPMI (Biochrom) with 20% FBS. All
media contained 1% penicillin/streptomycin and 0.5% gentamicin
(Biochrom). Cells were grown in culture flasks (Nunc,
Langenselbold, Germany) under standard culture conditions (37°C, 5%
CO2). Medium was changed every 3 days. Passages 6 to 18
were used for all experiments. Cells tested negative for Mycoplasma
infection. Primary pancreatic cancer cells PaCaDD135, -159, -161,
-165 and -188 were established and cultured as described previously
(26,27).
Drug preparation
Gemcitabine was obtained from GRY Pharma
(Kirchzarten, Germany). Fresh stock solutions were prepared in
concentrations of 144 mM in phosphate-buffered saline (PBS,
Biochrom), kept in aliquots at −20°C and diluted in medium to the
final concentrations.
Viable cell counting
Of each cell line, 105 cells/well were
seeded in 6-well plates and allowed to attach overnight. Medium was
removed, wells washed with PBS once and new medium added to the
wells, containing gemcitabine in final concentrations of 0.01 to
100 μM. Untreated controls were run in parallel. At each time-point
of analysis, cells were washed, trypsinized using trypsin/EDTA
solutions (Biochrom) and resuspended in medium. Cells were counted
after trypan blue staining in a Neubauer chamber. Experiments were
performed in triplicates.
RNA purification and reverse
transcription
For the extraction of total cellular RNA, the medium
was removed from the culture flasks and the cell layer was washed
with PBS prior to adding trypsin. The trypsinized cells were
resuspended in medium and counted. Cells (1.5x10⁶) were
centrifuged at 1,000 x g for 10 min and the cell pellet was
subsequently used for RNA purification with RNeasy mini kit
(Qiagen, Hilden, Germany) according to the manufacturer’s
instructions. RNA concentration was determined photometrically on
an Eppendorf BioPhotometer (Eppendorf, Hamburg, Germany). RNA (1
μg) was used for cDNA synthesis using the iScript cDNA Synthesis
kit (Bio-Rad, Munich, Germany) following the manufacturer’s
instructions.
Quantitative real-time PCR
Quantitative real-time PCR (qPCR) was performed on a
Bio-Rad CFX96 Real-Time System (Bio-Rad Laboratories, Munich,
Germany) using SsoFast EvaGreen Supermix (Bio-Rad) and QuantiTect
Primer Assays for SHH, PDX1, GLI, PTCH, SMO, NOTCH, CD24, CD44,
CD133, EpCAM, SNAI1 (Snail), SNAI2 (Slug), TWIST, OCT4, CBX7 and
GAPDH (all from Qiagen) following the manufacturer’s standard
procedure outlined in the SYBR-Green leaflet. Reaction efficiency
was determined using standard curves. Gene expression analysis was
computed using CFX Manager 2.0 (Bio-Rad) and REST 2009 (Qiagen). To
indicate the baseline expression of each gene of interest in
untreated cells, the ΔCt value was calculated as
follows: ΔCtgene of interest = Ctgene of
interest - CtGAPDH, whereby high ΔCt
values indicate low baseline expression. Changes in gene expression
comparing treated with untreated cells were computed using the
2−ΔΔCt method with GAPDH as reference gene and expressed
as efficiency corrected n-fold changes ± standard error of the mean
(SEM). Measurements were performed in triplicates. Statistical
significant changes in gene expression were assessed using the
algorithm within the REST 2009 software (28,29)
and a p-value of <0.05 was considered statistically
significant.
Preparation of cell blocks and cover
slips
Cell pellets were resuspended in 200 μl citrate
plasma and 200 μl Thromborel S (Siemens Healthcare Diagnostics,
Deerfield, IL, USA) was added. After coagulation, cells were fixed
for 1 h in neutral-buffered saline containing 7% formalin and were
paraffin-embedded. In cases where morphology was to be preserved,
cells grown on coverslips were used. Fifty thousand cells per well
were plated in 24-well plates on round glass cover slips (Thermo
Scientific, Braunschweig, Germany), allowed to attach overnight
before treatment was performed as indicated. At each respective
time-point, cells were washed with PBS and fixed with
acetone/methanol (1:2 v/v) and stored at −20°C until
immunocytochemical staining.
Immunocytochemical staining
Cell blocks were cut into 5-μm sections and
deparaffinized using graded alcohols. Antigen retrieval was
performed by heat-induced epitope retrieval in pH 9.0 antigen
retrieval buffer (Dako, Glostrup, Denmark) at 95°C for 60 min.
Endogenous peroxidase blocking was carried out for 10 min with
peroxidase-blocking reagent (Dako). Subsequently, mouse monoclonal
primary antibodies against β-catenin (1:200, Dako), E-cadherin
(1:100, NeoMarkers), vimentin (1:2000, Dako) and Ki-67 (1:500,
Dako) were applied for 30 min at RT. Primary rabbit and mouse
antibodies were detected using the EnVision Detection System
(Dako). Staining of the coverslips was performed against SHH
(rabbit monoclonal, 1:100), CD133 (rabbit polyclonal, 1:100), OCT4
(rabbit polyclonal, 1:80) and PDX-1 (rabbit polyclonal, 1:3000)
(all from Abcam, Cambridge, UK) and diluted in background reducing
antibody diluent (Dako), with Vectastain Elite ABC Kit Rabbit
(Vector Laboratories, Burlingame, CA, USA) adhering to the
manufacturer’s instructions. Visualization was performed using DAB
(Roche, Mannheim, Germany) and counterstained with haematoxylin.
Control experiments for all stainings were negative using PBS
replacement of primary or secondary antibodies and same processing
as described above. The stained slides were digitalized using the
ImageAccess 9 Enterprise software (Imagic Bildverarbeitung,
Glattbrugg, Switzerland) and percentage of positive cells evaluated
using the Cell Explorer 2006 software (BioSciTec, Frankfurt,
Germany). In addition, staining intensities were graded
semiquantitatively as negative, low, moderate and high.
In vitro wound healing (scratch)
assay
Panc-1 cells (105/well) were seeded into
6-well plates and allowed to grow to approximately 80% confluence.
One day prior to the application of the scratch, gemcitabine was
added to the wells to a final concentration of 10 μM. PBS was used
as control. After 24 h of incubation, a scratch was applied to the
cell layer across each well using a 200 μl pipette tip. The cell
layer was washed twice with PBS to remove lose cells from the
scratch margins. The wells were refilled with 2 ml of fresh medium
and gemcitabine added, except in the controls. At regular,
intervals images were taken from definite locations of the
scratches with a Nikon Coolpix 995 digital camera on a Zeiss
Axiovert 40C phase contrast inverted microscope with scattered
light illumination.
Time-lapse microscopy
Time-lapse recording was performed using the JuLi
Smart Fluorescent Cell Analyzer (PAA Laboratories, Cölbe, Germany)
under standard conditions.
RNA-interference
Gene knockdown experiments were performed in 6-well
plates using the siLentFect Lipid Reagent (Bio-Rad) and siRNA
against SHH (Hs_SSH_6, SI03080182) and control non-coding siRNA
(AllStars Negative Control, 1027280, both from Qiagen). Cells
(1.5×10⁵/well) were seeded 1 day prior to transfection
and allowed to attach overnight. One hour prior to transfection,
the medium was replaced with fresh antibiotics-free medium
containing 1% FCS. For each well to be transfected, 3 μl siLentFect
reagent was diluted in 150 μl OptiMEM I (Life Technologies,
Darmstadt, Germany) and 3.6 μl siRNA solution in 150 μl OptiMEM.
Diluted siRNA and diluted siLentFect were mixed and incubated at
room temperature for 20 min after which they were slowly added to
the respective wells. The cells were incubated overnight, after
which they were trypsinized and used in the xCELLigence assay. A
portion of the same cells was used for determining the knockdown
efficiency by qPCR.
xCELLigence assay
Impedance-based real-time measurement of cellular
proliferation and IC50 calculation were performed on the
xCELLigence Real-Time Cell Analyzer (RTCA) in designated 96-well
electrode plates (E-plates) (all from Roche Applied Science,
Penzberg, Germany) under standard culture conditions (30). The RTCA software v. 1.2 was used
for data recording, analysis of proliferation and IC50
calculation. In all experiments, 50 μl of cell-free medium was
added to each well of the E-plate and background measurement
performed. Next, 100 μl of cell suspension (104
cells/100 μl) were added to each well, measurement was started and
the cells allowed at attach and proliferate for 24 h prior to the
addition of the compound. Readings were performed every 15 min for
at least 3 days. IC50 at day 3 was determined by
incubating the cells with serial concentrations of gemcitabine
ranging from 0.001 to 10 μM. The readout as recorded by the RTCA is
expressed as a dimensionless cell index (CI) value which correlates
with cell number and size. Measurements were performed in
quadruplicates.
Results
Determination of optimal gemcitabine
concentration
Aiming to analyze only the most resistant cells, we
decided to find the optimal concentration that would allow 5% of
the cells to survive 3 days of continuous gemcitabine incubation.
By treating Capan-1 and Panc-1 cells with serial concentrations of
gemcitabine and counting surviving cells after 3 days, we
determined that 1 and 10 μM, respectively, of gemcitabine were
needed to kill 95% of the cells. After 6 days of treatment at the
indicated concentrations, surviving cells could still be observed.
Therefore, gene expression analysis was performed at time-points of
1, 3 and 6 days of continuous gemcitabine incubation in order to
capture time-dependent changes in gene expression. Capan-1 cells
still viable after day 12 of 100 μM gemcitabine could be
observed.
mRNA expression of stem cell- and
EMT-associated markers
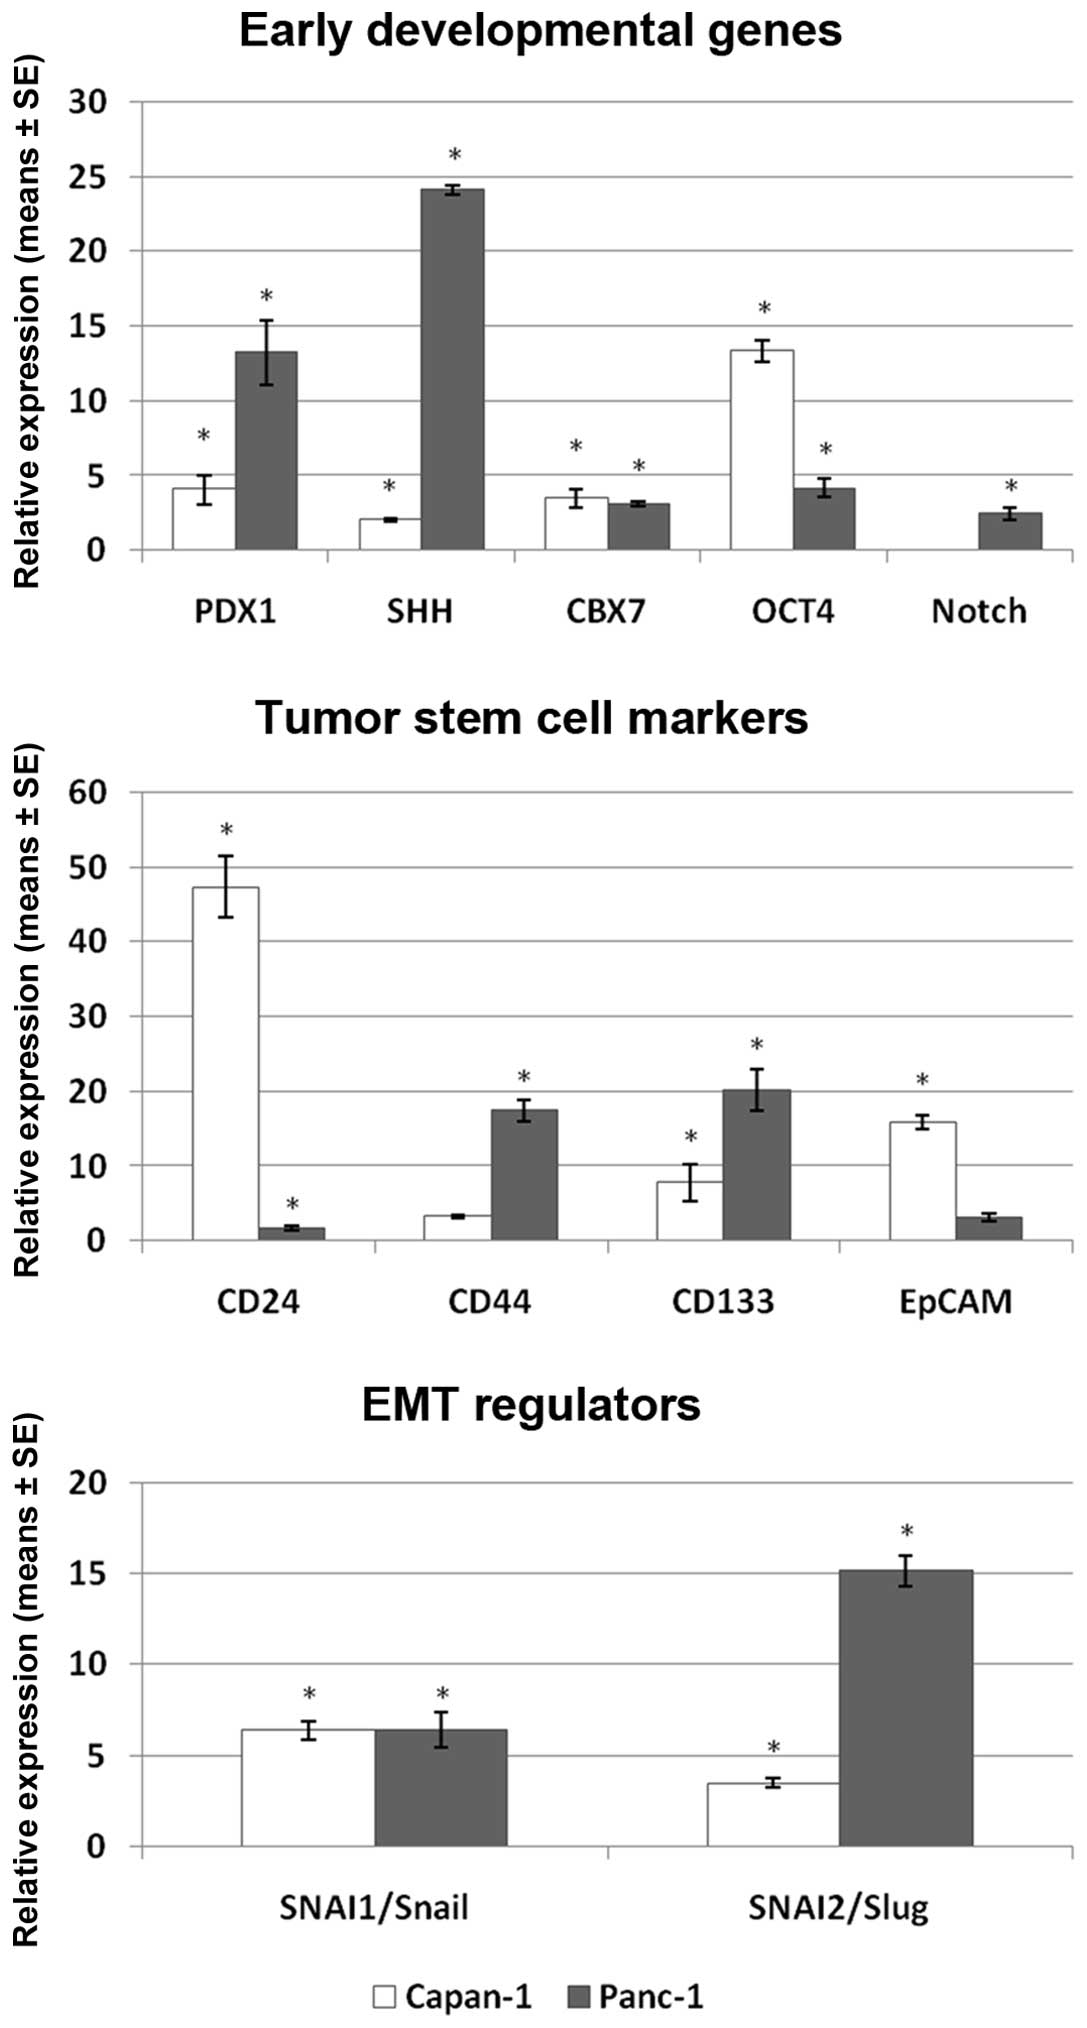
The expression of all investigated markers was
increased in the surviving cells after 6 days of continuous
incubation with gemcitabine (Fig.
1). In the group of the stem-cell associated markers, PDX1 and
SHH reached the highest expression after 6 days in Panc-1 cells
(13.4 and 24.1-fold, respectively) and PDX1 and OCT4 in Capan-1
cells (4.1 and 13.4-fold, respectively). OCT4 and PDX1 in Capan-1
and Panc-1 cells, respectively, were also the genes most strongly
induced already after 1 day of treatment (Table IA). In the group of tumor stem cell
markers, CD44 and CD133 showed the highest increase in Panc-1 (17.4
and 20.2-fold, respectively), while CD24 and EpCAM demonstrated the
highest expression in Capan-1 (47.3 and 15.9-fold, respectively).
Interestingly, genes which reached the highest expression in Panc-1
(CD44 and CD133) showed only moderate expression levels in Capan-1,
while reciprocally, the highest expressed genes in Capan-1 (CD24
and EpCAM) reached only low to moderate levels in Panc-1 cells. The
EMT regulators SNAI1/Snail and SNAI2/Slug showed a time-dependent
increase in expression in both cell lines. Snail and Slug were
induced 6.4- and 3.5-fold in Capan-1 and 6.4- and 15.2-fold in
Panc-1 cells after 6 days of continuous gemcitabine treatment.
TWIST was not detectable in either of the two cell lines. A
complete list of gene expression levels at 1, 3 and 6 days of
treatment are listed in Table
IA.
 | Table IGene expression analysis in Capan-1
and Panc-1 cell lines. |
Table I
Gene expression analysis in Capan-1
and Panc-1 cell lines.
A, Gene expression
analysis of the investigated genes.a
|
|---|
| Capan-1
| Panc-1
|
|---|
| ΔCt | Day 1 | Day 3 | Day 6 | ΔCt | Day 1 | Day 3 | Day 6 |
|---|
| PDX1 | 10.45 |
1.75±0.43 |
0.66±0.16 |
4.07±0.99 | 17.52 | 2.50±0.38 |
2.76±0.44 |
13.27±2.16 |
| SHH | 4.26 |
0.68±0.06 |
0.34±0.02 |
2.01±0.09 | 12.20 | 1.01±0.15 | 4.12±0.36 |
24.13±0.32 |
| CBX7 | 6.67 |
0.44±0.08 |
0.46±0.08 |
3.50±0.61 | 8.28 | 1.23±0.18 | 0.89±0.02 |
3.11±0.19 |
| OCT4 | 7.15 |
2.14±0.08 | 1.31±0.10 |
13.35±0.73 | 12.91 |
1.65±0.19 |
2.11±0.10 |
4.16±0.62 |
| NOTCH | | | not expressed | | 7.81 | 0.84±0.16 | 0.72±0.30 |
2.43±0.42 |
| CD24 | 6.31 | 0.56±0.05 | 6.00±0.54 |
47.33±4.11 | 4.13 |
0.75±0.13 | 0.54±0.03 |
1.71±0.31 |
| CD44 | 8.44 |
3.12±0.18 | 0.50±0.06 | 3.23±0.19 | 11.67 |
0.83±0.07 | 0.45±0.03 |
17.41±1.45 |
| CD133 | 5.22 | 1.17±0.40 | 1.20±0.38 |
7.81±2.46 | 16.72 | 1.38±0.02 |
5.23±1.60 |
20.18±2.73 |
| EpCAM | 0.30 |
0.65±0.04 |
1.79±0.16 |
15.90±0.92 | 6.78 |
1.59±0.26 |
1.85±0.10 | 3.14±0.59 |
| SNAI1/Snail | 10.30 |
0.38±0.03 |
1.43±0.19 |
6.39±0.53 | 15.93 |
1.26±0.18 | 2.29±0.23 |
6.38±0.97 |
| SNAI2/Slug | 10.71 |
0.34±0.03 | 0.65±0.05 |
3.50±0.27 | 26.54 | 1.47±0.20 | 2.45±0.39 |
15.16±0.85 |
| TWIST | | | not expressed | | | | not expressed | |
B, Gene expression
analysis in 5 primary pancreatic cancer cell lines.b
|
|---|
| PaCaDD135
| PaCaDD159
| PaCaDD161
| PaCaDD165
| PaCaDD188
|
|---|
| ΔCt | Day 3 | Day 6 | ΔCt | Day 3 | Day 6 | ΔCt | Day 3 | Day 6 | ΔCt | Day 3 | Day 6 | ΔCt | Day 3 | Day 6 |
|---|
| PDX1 | 11.24 |
2.56±0.09 | 1.44±0.11 | 11.00 | 0.98±0.02 |
1.90±0.09 | 21.06 | 0.98±0.00 | 2.15±0.10 | 19.77 |
8.92±0.37 |
8.75±0.51 | 10.47 |
0.76±0.07 |
0.70±0.03 |
| SHH | 13.26 | 2.68±0.05 | 1.65±0.15 | 11.64 | 1.33±0.02 |
1.91±0.15 | 15.59 | 1.32±0.04 | 1.05±0.12 | 12.91 |
4.08±0.33 |
2.28±0.08 | 12.01 | 1.19±0.12 | 0.91±0.05 |
| CBX7 | 9.91 |
3.23±0.09 |
1.45±0.14 | 9.70 | 1.35±0.04 |
2.97±0.12 | 11.30 |
2.04±0.02 | 2.00±0.08 | 10.76 |
9.71±0.22 | 4.25±0.20 | 10.26 | 1.14±0.11 | 1.09±0.06 |
| OCT4 | 11.10 |
3.47±0.24 | 1.86±0.14 | 11.20 | 0.98±0.30 |
1.20±0.07 | 11.23 |
1.49±0.03 |
1.41±0.07 | 8.56 |
2.08±0.10 | 1.23±0.07 | 11.25 | 1.73±0.21 | 1.87±0.09 |
| CD24 | 3.58 | 1.89±0.01 |
1.56±0.11 | 5.42 |
3.07±0.26 |
4.10±0.23 | 4.38 |
1.61±0.02 |
2.30±0.08 | 3.28 | 1.25±0.03 |
0.78±0.02 | 5.56 | 2.24±0.20 | 2.10±0.09 |
| CD44 | 12.76 | 4.24±0.05 | 2.85±0.21 | 7.59 | 0.92±0.10 | 1.59±0.35 | 9.79 | 1.05±0.08 | 0.88±0.08 | 14.60 |
1.81±0.11 |
1.42±0.20 | 7.83 | 0.36±0.04 | 0.99±0.32 |
| CD133 | 14.50 |
9.24±0.29 |
7.38±1.08 | 7.42 |
2.00±0.19 |
1.24±0.13 | 15.23 |
2.74±1.26 | 5.98±1.58 | 9.45 | 2.94±0.16 |
1.48±0.07 | 8.07 |
0.62±0.06 |
0.85±0.05 |
| EpCAM | 3.51 |
2.90±0.07 | 2.11±0.18 | 2.96 |
1.95±0.05 | 1.87±0.09 | 3.51 |
1.41±0.01 | 1.38±0.06 | 10.34 |
4.11±0.15 | 2.23±0.05 | 2.55 |
1.68±0.16 |
1.12±0.06 |
| SNAI1/Snail | 17.41 |
20.61±1.05 |
4.36±0.37 | 14.93 |
2.40±0.47 | 5.26±0.53 | 14.49 |
4.57±0.39 | 1.71±0.09 | 12.77 |
4.85±0.14 | 5.47±0.37 | 14.63 |
3.92±0.38 |
5.05±0.23 |
| SNAI2/Slug | 13.93 | 3.07±0.01 |
2.87±0.36 | 8.98 | 0.34±0.03 |
1.38±0.06 | 12.68 |
2.35±0.06 | 2.07±0.30 | 12.25 |
4.65±0.11 | 3.18±0.15 | 8.79 |
0.48±0.05 |
1.81±0.21 |
| TWIST | 23.73 |
4.04±0.89 | 1.72±0.13 | | not expressed | | 24.13 |
14.97±0.49 | 9.37±1.03 | | not expressed | | 20.46 |
39.57±8.49 |
51.72±7.01 |
Immunocytochemical validation of gene
expression
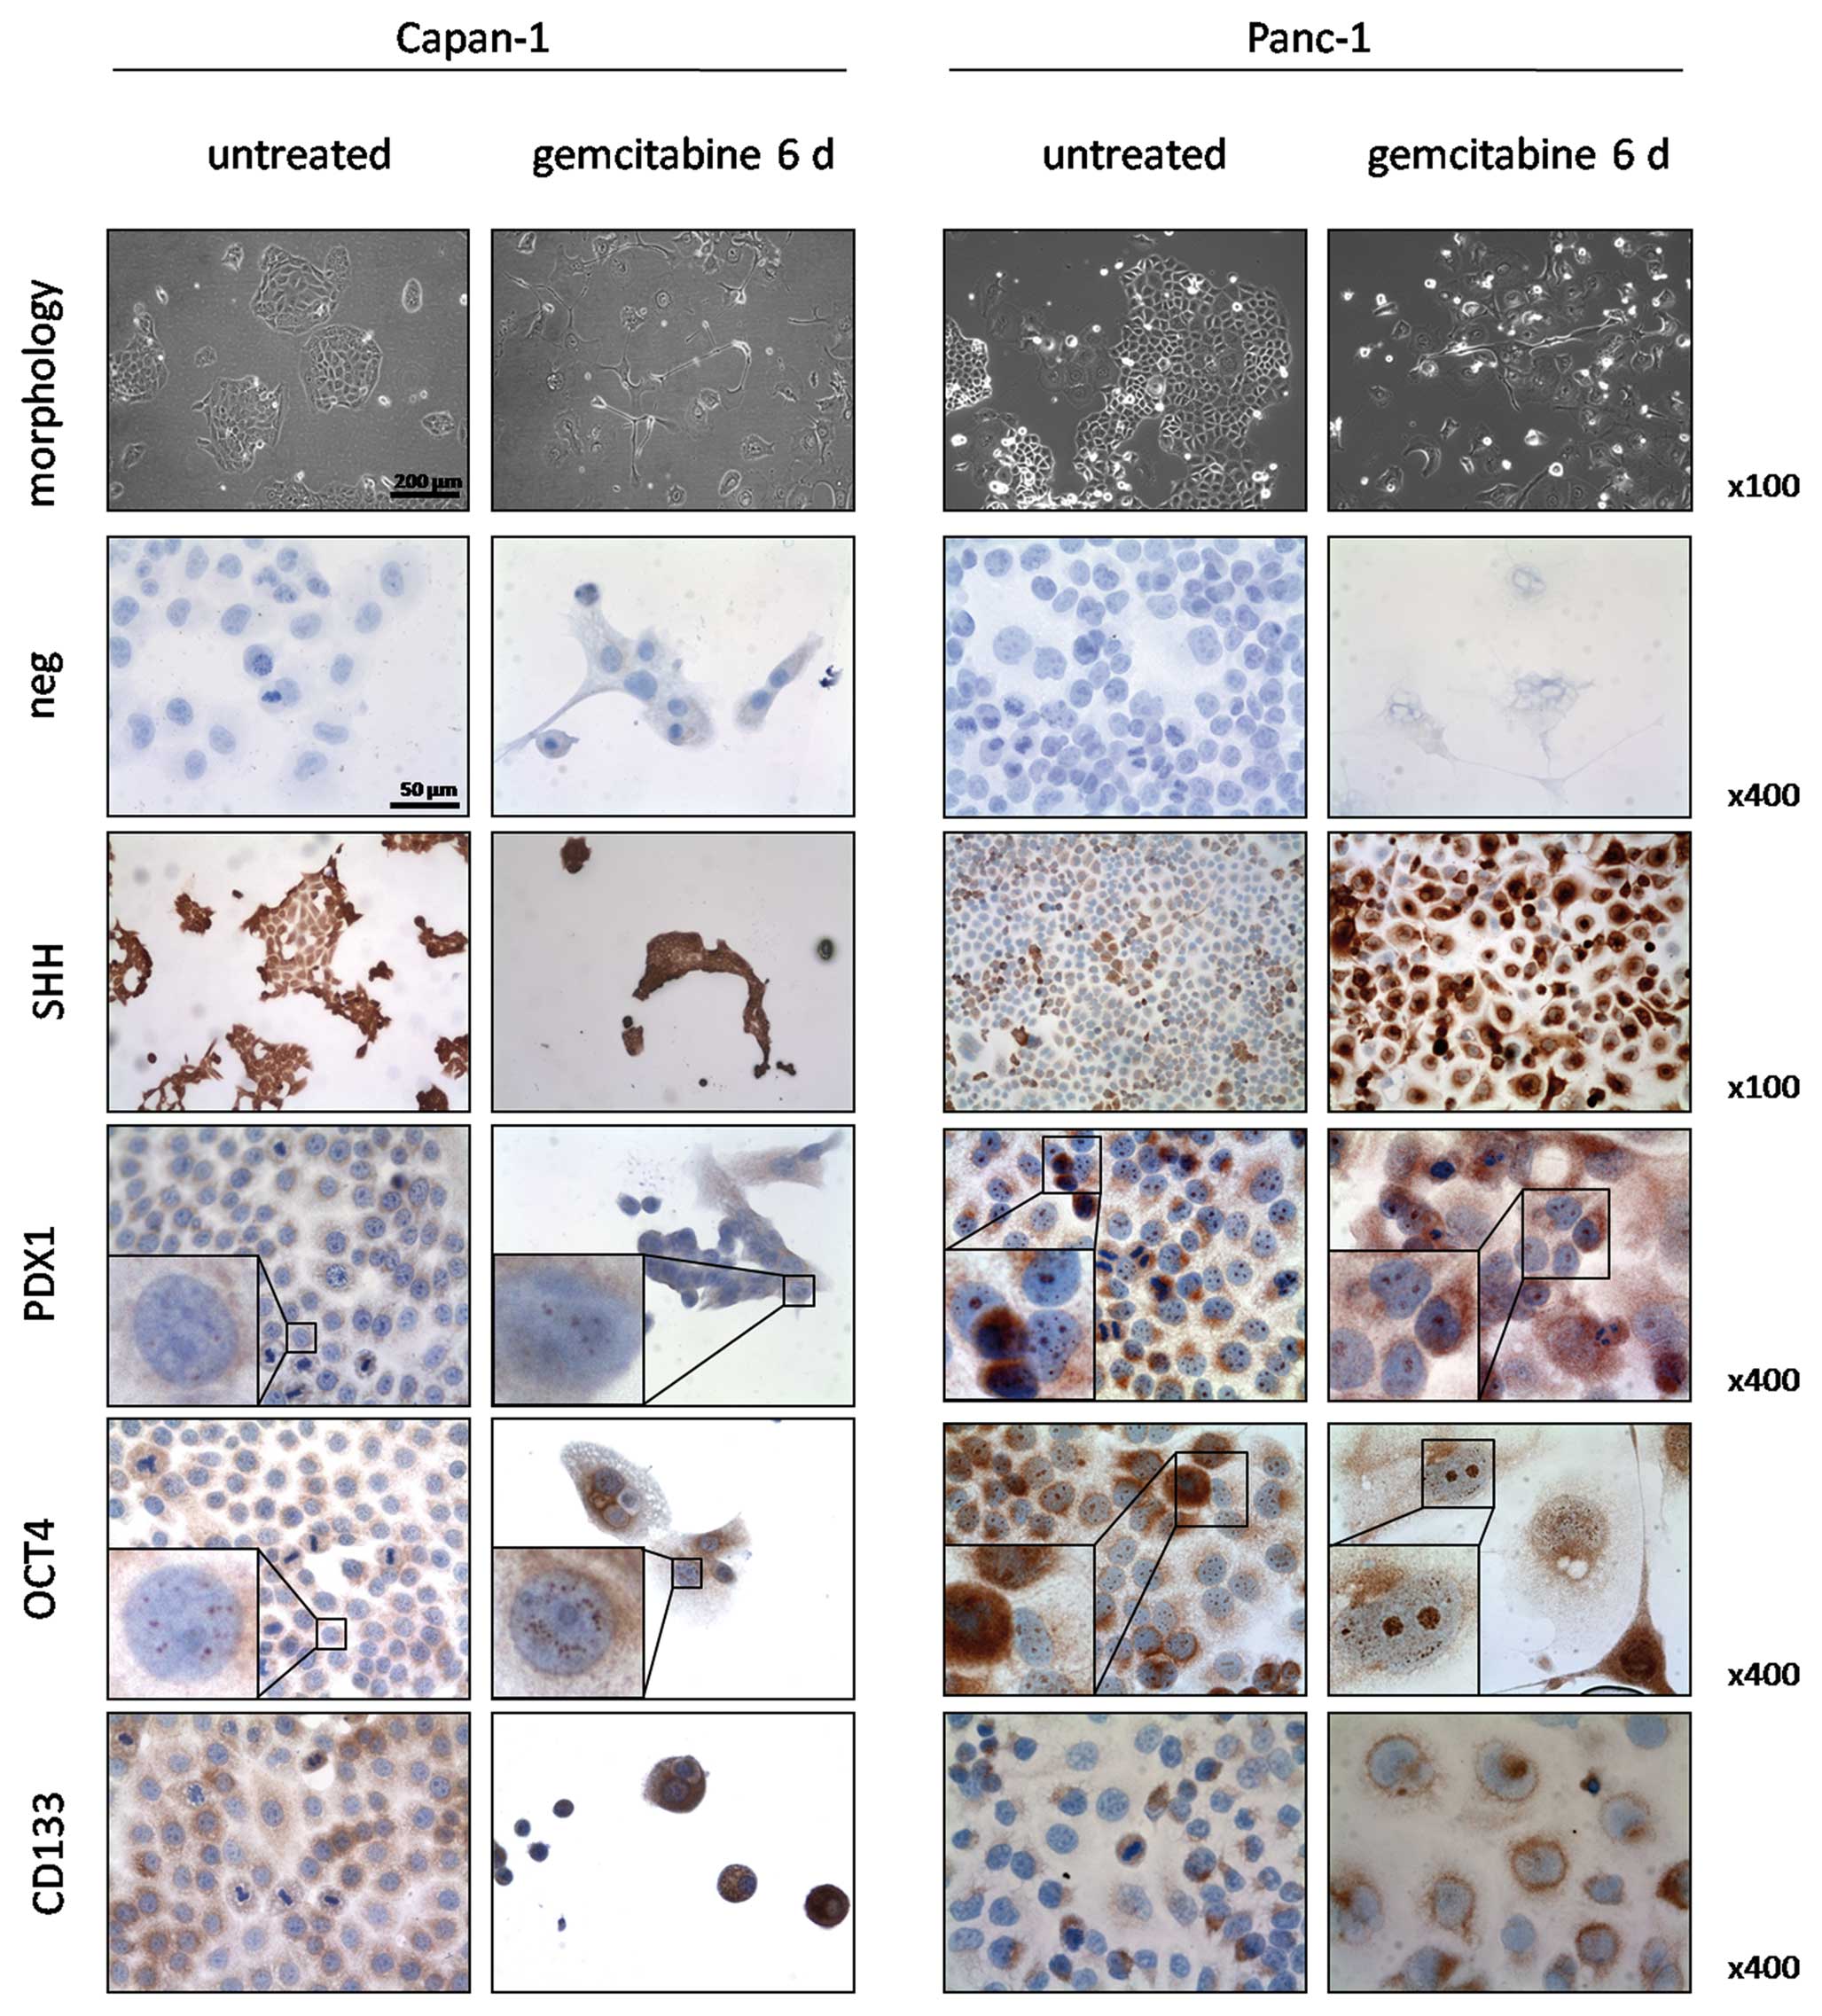
We performed immunocytochemical stainings for SHH,
OCT4, PDX1 and CD133 in untreated cells and after 6 days of
gemcitabine incubation to confirm the qPCR results (Fig. 2). Both untreated and treated
Capan-1 cells expressed SHH in 100% of the cells. However, the
gemcitabine treated cells showed a stronger staining intensity. Of
note was that small colonies and single cells showed a stronger
expression in contrast to larger colonies in both untreated and
treated cells. PDX1 was nuclearly expressed in 30% of untreated
Capan-1 cells and increased in foci number and intensity of
staining in the nuclei of treated cells. OCT4 stained positive in
granular fashion within the nuclei of 100% of untreated cells and
to a greater extent both in number of foci and intensity in the
treated cells. CD133 was expressed in 50% of the untreated Capan-1
cells at low to moderate intensities. Occasionally, strong staining
intensities were observed in singular cells or groups of 4–10
cells. In the treated group, all cells stained positive for CD133
and staining intensity reached moderate to high levels.
In untreated Panc-1 cells, SHH was expressed in 40%
of the cells in moderate to strong staining intensity and these
cells were arranged in groups. After gemcitabine incubation, 90% of
the cells showed strong staining intensity. Nuclear staining for
PDX1 was observed in 100% and cytoplasmic staining in 20% of
untreated Panc-1 cells. Treatment increased the number of nuclear
foci, accompanied by a cytoplasmic reaction in 90% of the cells.
Granular OCT4 positivity was observed in 100% of the nuclei of both
untreated and treated cells and in the cytoplasm and perinuclear
region of 30% of cells. Treatment with gemcitabine led to an
increase in nuclear foci along with stronger staining intensities.
CD133 was positive in 30% of untreated cells and expressed in a
polar pattern with weak to moderate intensities. After treatment,
70% of the cells stained positive and CD133 was localized in the
perinuclear region.
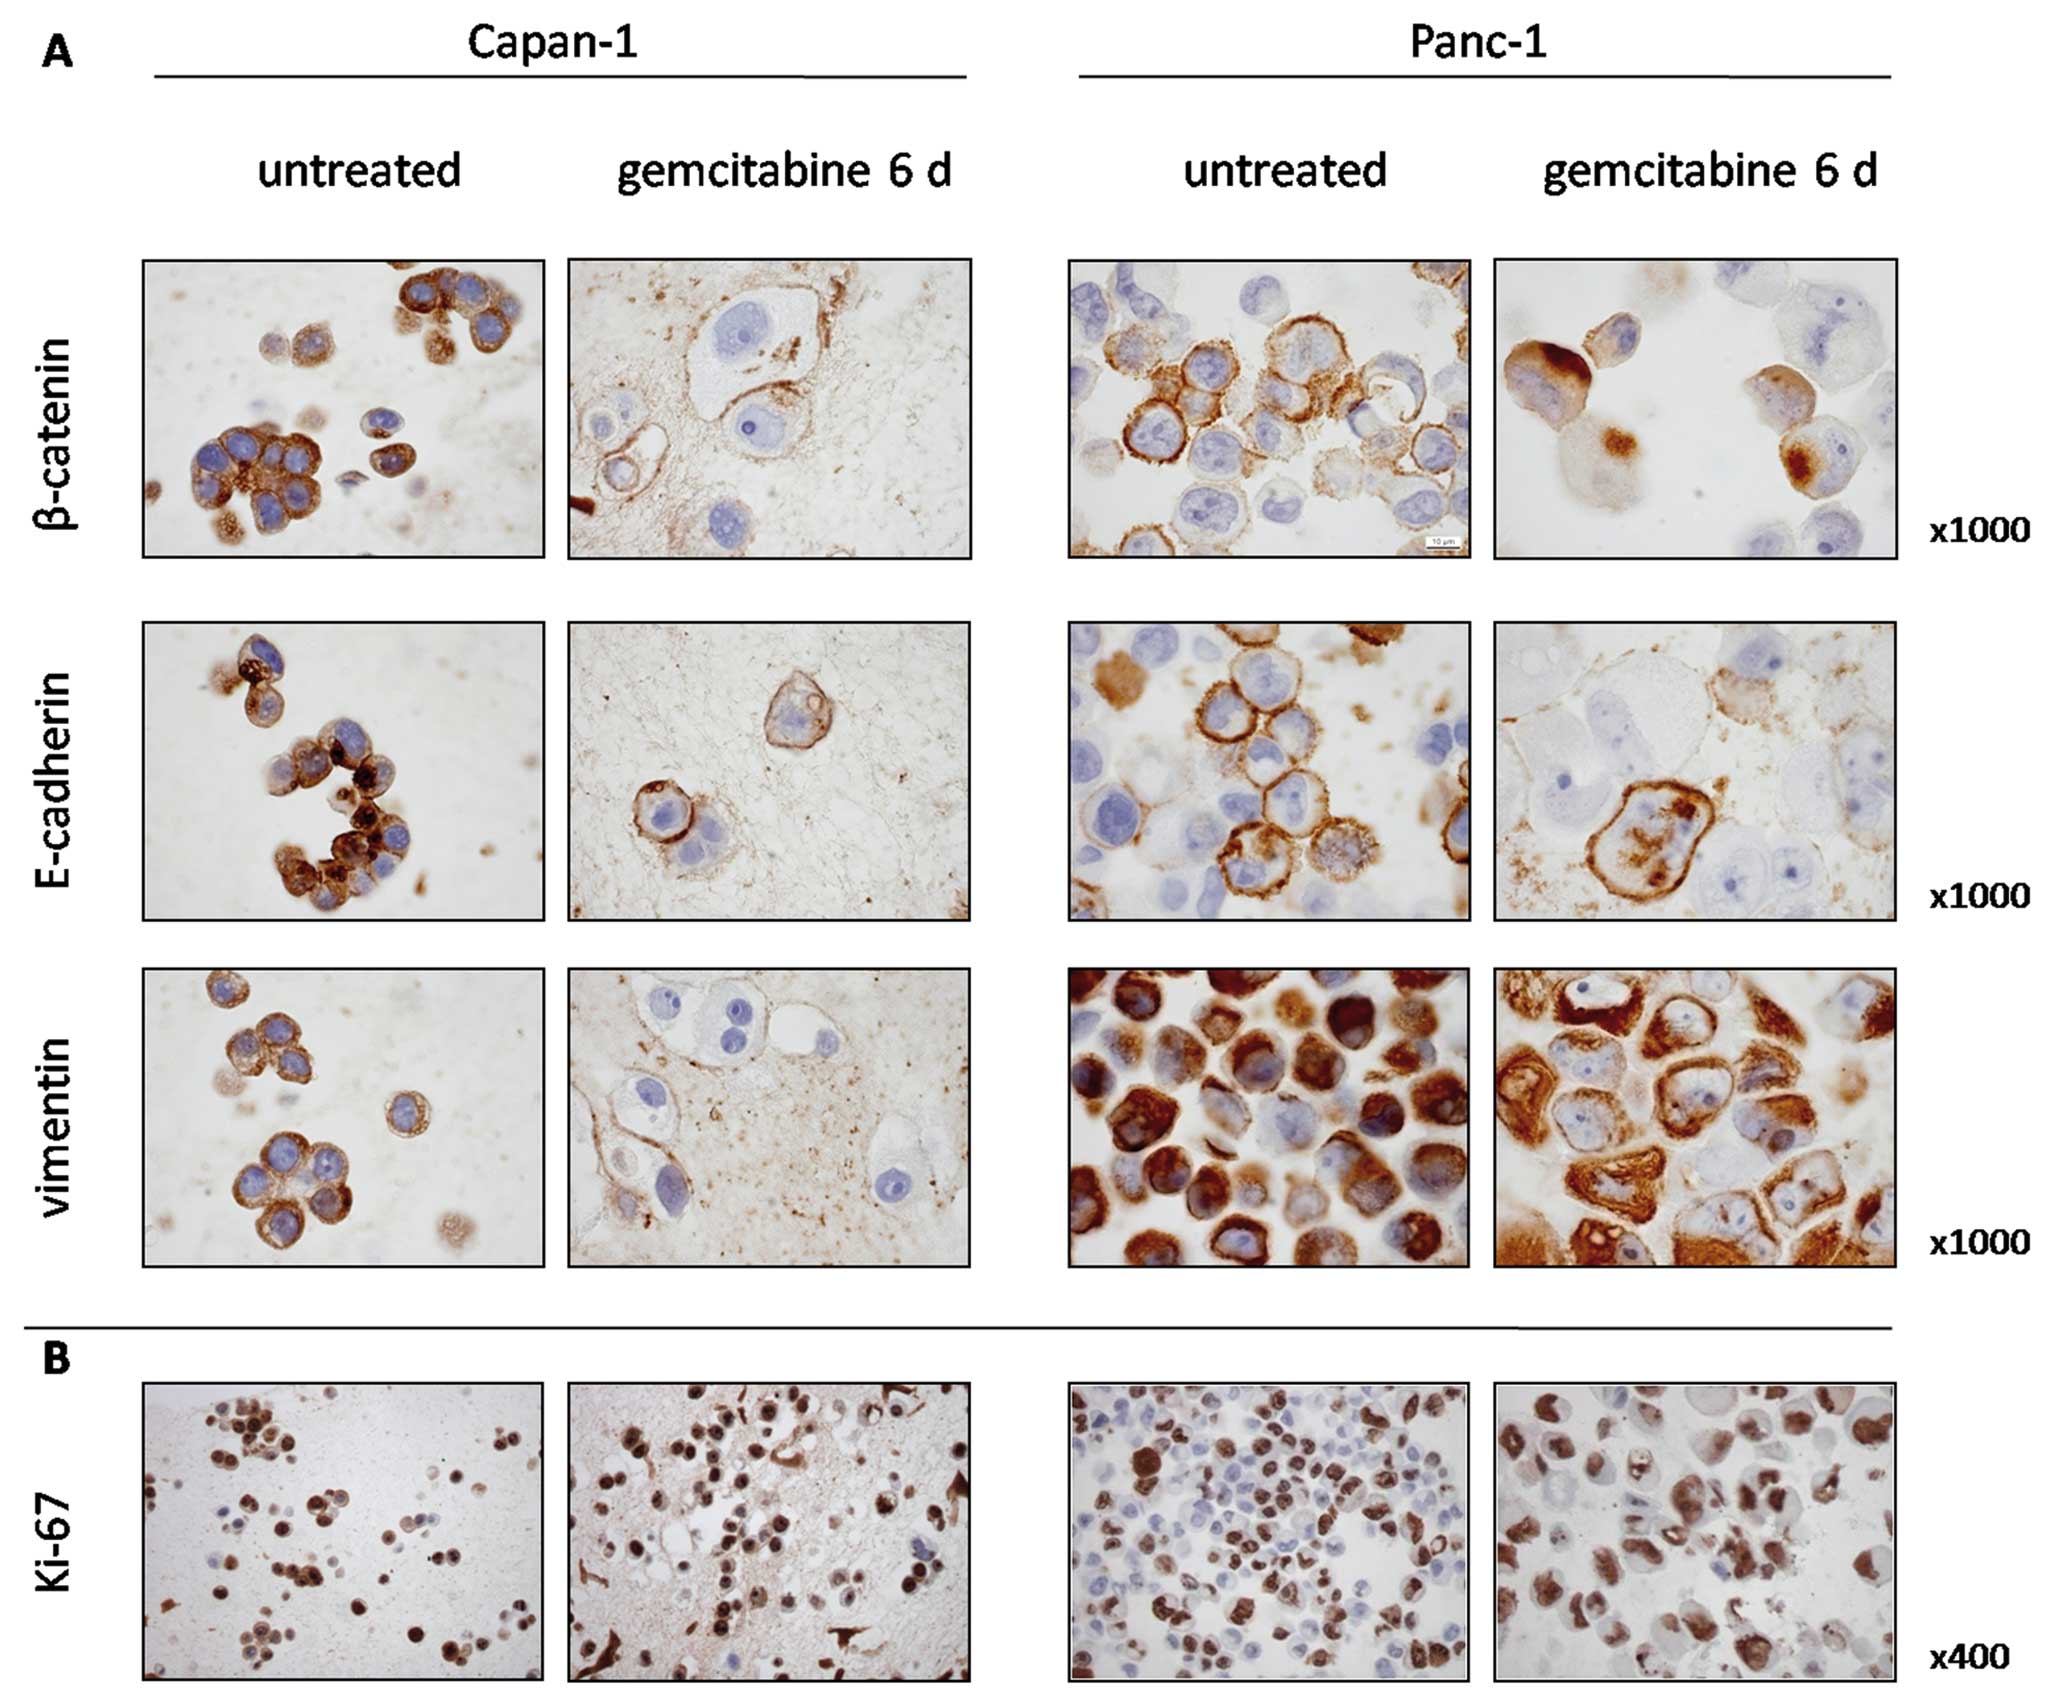
Validation of EMT
We demonstrated an induction of EMT markers by qPCR
in Panc-1 and to a lesser extent also in Capan-1 cells after 6 days
of gemcitabine treatment. We therefore investigated β-catenin and
E-cadherin expression, and 40–50% of the untreated Panc-1 cells
expressed β-catenin and E-cadherin on the cell membranes (Fig. 3A). Continuous incubation with
gemcitabine for 6 days resulted in a marked nuclear translocation
of β-catenin and repression of membranous E-cadherin. Similar but
less distinct patterns were observed in Capan-1 cells. Expression
of vimentin, considered a marker of immature and mesenchymal
phenotypes, was prominent in untreated Panc-1 cells and gemcitabine
incubation did not further increase its expression. In Capan-1
cells, vimentin was present in untreated cells, while,
interestingly, most cells showed a decrease in vimentin expression
after gemcitabine incubation.
To determine if the surviving cells retained their
proliferative capacity, Ki-67 was used to identify the cells
undergoing DNA replication. Ki-67 expression was present in 86% of
untreated Capan-1 cells and in 95% of the surviving cells after
gemcitabine incubation. In untreated Panc-1 cells, 46% were Ki-67
positive and 86% after gemcitabine incubation (Fig. 3B).
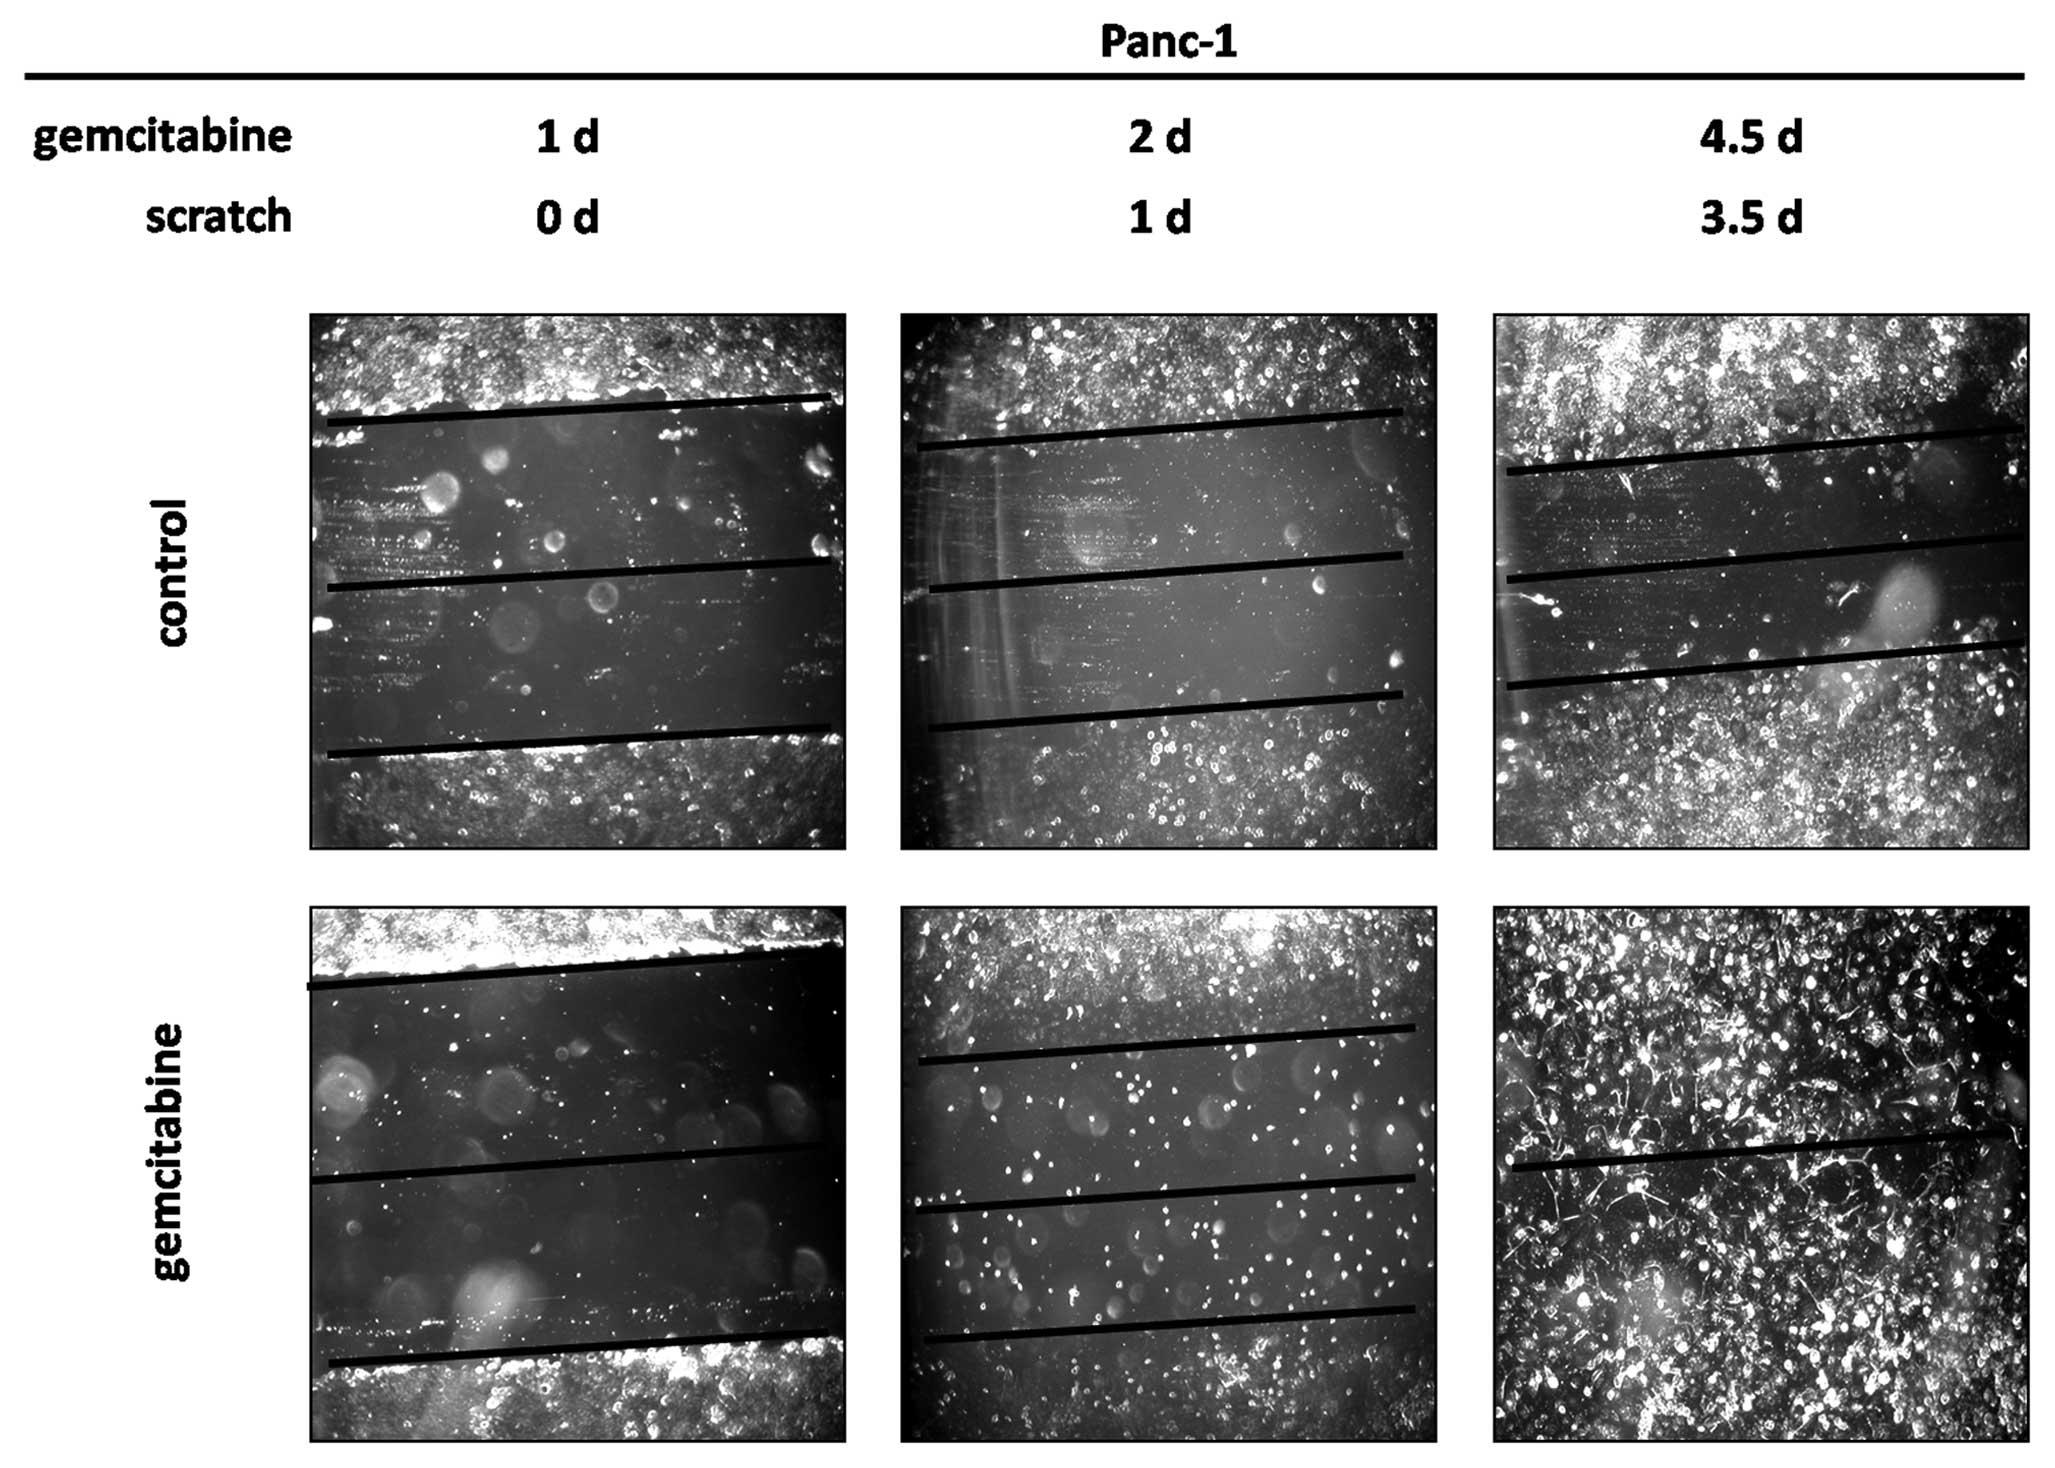
Wound healing assay
EMT is associated with loss of cell-cell adhesions
and increased cell migration. We therefore performed a wound
healing assay to assess cell migration in the gemcitabine treated
Panc-1 cells, which showed the quickest and highest induction of
Snail and Slug. Wound closure was achieved after 3.5 days after
scratch application (corresponding to day 4.5 of gemcitabine
treatment) due to an increased cell migration (Fig. 4). In contrast, the wound in the
untreated cells was still clearly visible at this time. These
findings were confirmed by time-lapse microscopy showing an
increased undirected migration in treated cells starting from day 2
of treatment, while untreated controls showed little movement
throughout the observation period (not shown).
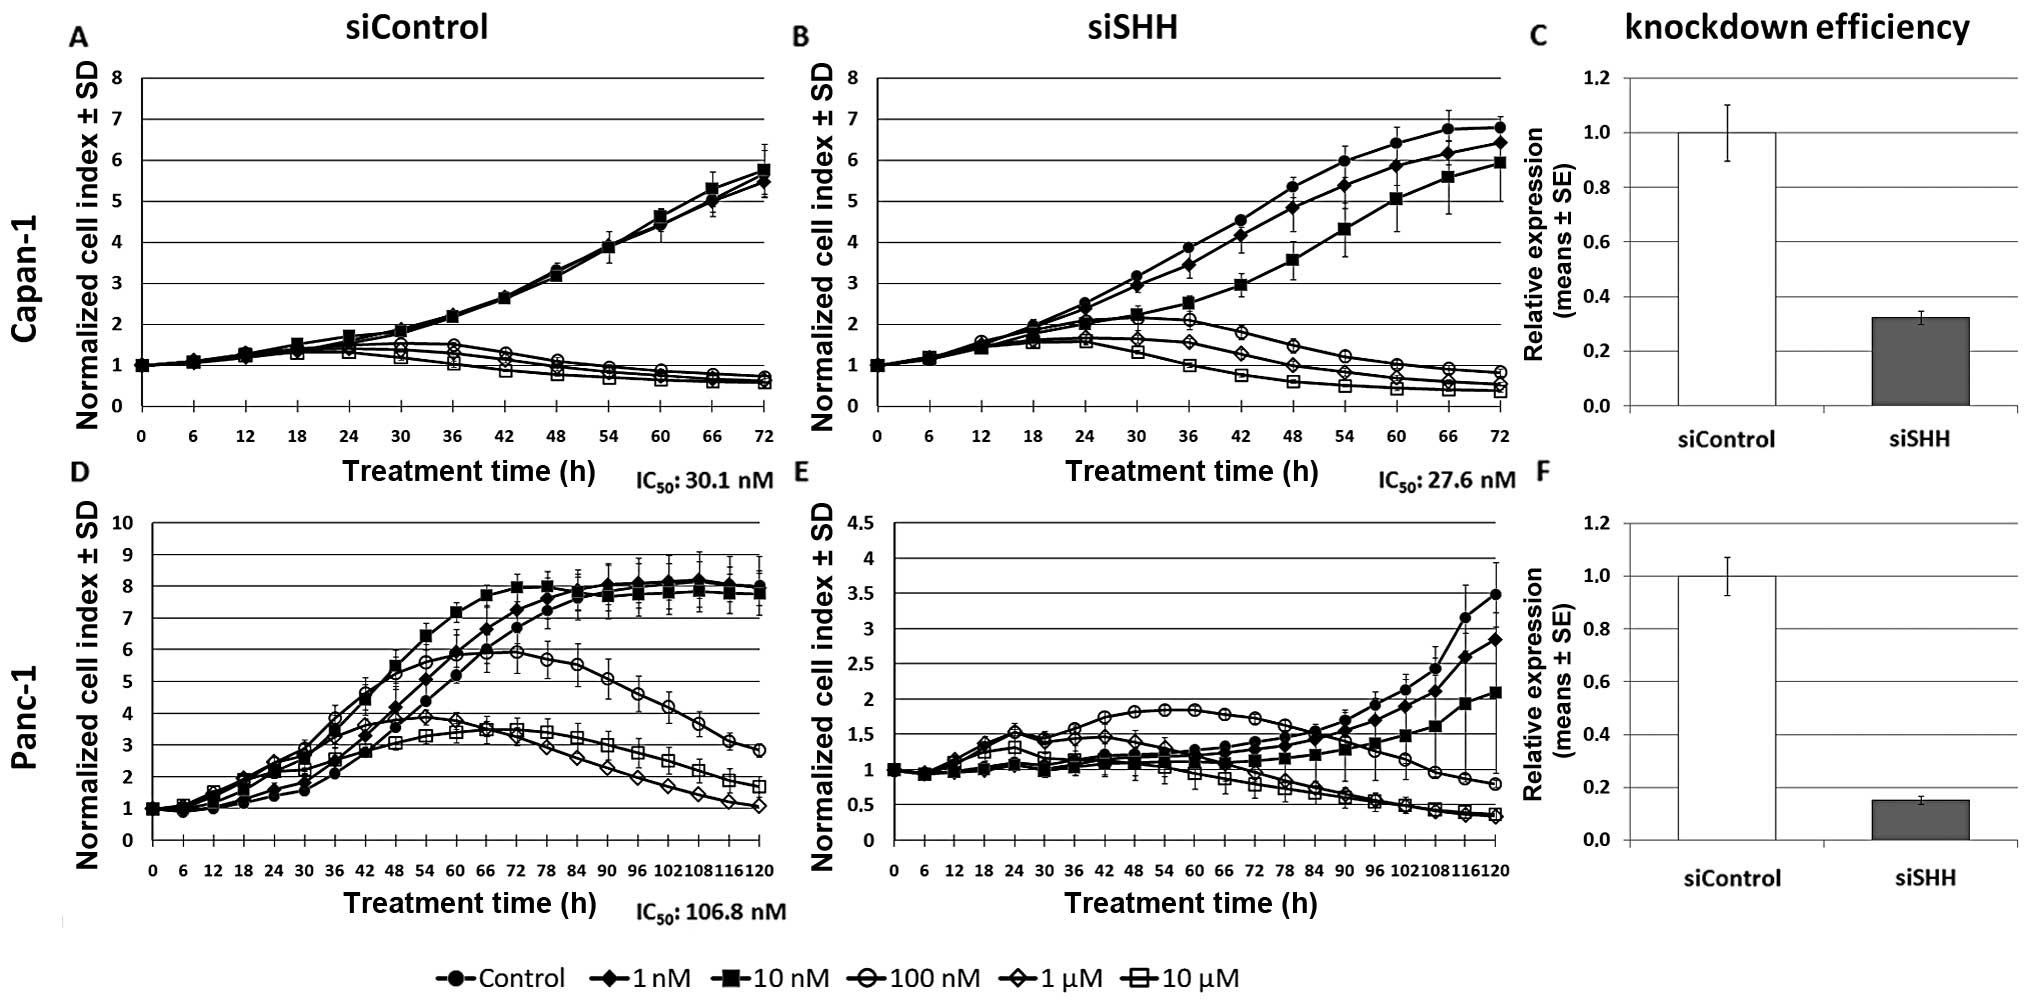
siRNA mediated downregulation of SHH
The expression of SHH after 6 days of gemcitabine
incubation showed the highest difference among the two investigated
cell lines. Therefore, siRNA mediated knockdown of SHH was
performed and its influence on IC50 values of
gemcitabine was assessed using the xCELLigence system (Fig. 5 A, B, D and E). A knockdown ratio
for siSHH below 33% was achieved in both cases (Fig. 5, C and F). IC50 of
control siRNA transfected Capan-1 cells was 30.1 nM (Fig. 5A) and siSHH transfection decreased
IC50 to 27.6 nM (Fig.
5B). In control siRNA transfected Panc-1 cells, IC50
was 106.8 nM (Fig. 5D).
Interestingly, siSHH transfection revealed that proliferation in
Panc-1 cells is dependent on SHH as the transfected cells did not
show an increase in cell index (Fig.
5E). After 72–96 h, when the transient knockdown effect
attenuated, the cells reverted to an increased proliferation rate,
indicating a reversible inhibition of proliferation through
transient SHH knockdown. Determining the IC50 in these
cells was therefore not possible.
Expression of stem cell associated genes
and EMT regulators in primary pancreatic cancer cell lines
To confirm our results in a further model which
resembles patient tumors more closely, we performed the same
treatment with 10 μM gemcitabine in five recently established
primary pancreatic cancer cell lines PaCaDD-135, -159, -161, -165
and -188 and determined gene expression by qPCR (Table IB) after 3 and 6 days. Genes
upregulated more than 2-fold compared to untreated cells were
observed in the stem cell marker group (CD24, CD44, CD144 or EpCAM)
in all 5 cell lines, in the stem cell associated gene group (PDX1,
SHH, CBX7 or OCT4) in 4 of the 5 cell lines and in the EMT
regulator group (SNAI1/Snail, SNAI2/Slug, TWIST) in all cell lines.
While the pattern of upregulated individual genes varies among the
cell lines, the only gene being upregulated in all cell lines under
gemcitabine incubation was SNAI1/Snail, indicating a central role
of EMT induction as a response to chemotherapy also in primary
pancreatic cancer cell lines.
Discussion
In our study, we investigated the molecular
alterations after 6 days of gemcitabine treatment in 2 distinct
cell lines: the well-differentiated Capan-1 (which was G1 in the
original patient and shows G1 differentiation in nude or SCID mice
xenografts) and the poorly differentiated Panc-1 cells (G3)
(31,32). We could show that cells surviving 6
days of continuous gemcitabine exposure express higher levels of
almost all investigated stem cell markers, especially of PDX1, SHH,
CD44, CD133 and Slug in Panc-1 cells and PDX1, OCT4, CD24, CD133,
EpCAM and Snail in Capan-1 cells, respectively. The high expression
of Slug in Panc-1 cells was accompanied by an increased migration
in the scratch assay and by EMT-typical changes in the expression
pattern of β-catenin and E-cadherin.
Efforts have been made to explain drug resistance
based on the intrinsic detoxifying mechanisms of cancer stem cells.
Some of the genes investigated here have been linked with
chemoresistance in various models. One study investigating
pancreatic cancer cell chemoresistance found that the repopulation
of tumor cells following high-dose gemcitabine treatment was driven
by CD44+ cells (33).
Resistant pancreatic cancer cells cultured in the presence of
gemcitabine with synchronous radiation therapy expressed increased
levels of CD24, CD133, OCT4 and ABCG2 and showed phenotypic and
molecular changes consistent with EMT (34). Consequently, their ability to
migrate, form spheres and initiate tumors in nude mice was
increased. In our study, we also show an increase in stem cell
marker expression after 6 days of gemcitabine incubation. Most
notably, even after only one day of treatment, PDX1, OCT4 and CD44
were already induced more than two-fold, indicating an induction in
gene expression rather than selection of resistant cells. During
organ development, PDX1 is expressed in epithelial cells in the
foregut that give rise to the pancreatic buds and to the whole
pancreas. Its expression is reactivated during the formation of
pancreatic intraepithelial neoplasia (PanIN) and correlates with
PanIN grade, is maintained in pancreatic cancer and affects patient
survival (35). Similarly, in a
study investigating OCT4 expression in pancreatic cancer samples,
OCT4 expression was commonly found in metaplastic ducts (strong
expression in 79.2% of cases), followed by pancreatic cancer cells
(positive in 19.4% of cases) and lowest in non-tumorous pancreatic
tissue (positive in 16.7% of cases) (36). These data indicate that stem cell
associated genes are re-activated during tumor initiation. Our data
indicate that OCT4 is induced early in tumor cell response to
chemotherapeutic stimuli.
An increasing number of studies show that there is a
link between cancer stem cells and EMT. During development, SHH
signals to the epithelial ventromedial somite wall and induces the
connective tissue mesenchyme of the sclerotome, which is a
physiological example of EMT (37), and is essential for forming
three-dimensional structures from epithelial precursors. In our
experiments, we see a strong increase of SHH accompanied by a
strong increase of Slug in treated Panc-1 cells, and a weaker
increase of SHH and Slug in Capan-1 cells. The downstream effector
of the hedgehog pathway, Gli1, has been shown to induce the
accumulation of β-catenin in the nucleus through Snail and
E-cadherin (38). Loss of
E-cadherin during EMT relocates β-catenin away from the cell
membrane allowing individual cells to separate from cell clusters.
We show that in response to gemcitabine, both Snail and Slug as
well as SHH are overexpressed. Concordantly, we show the nuclear
trans-location of β-catenin and the loss of membraneous expression
of E-cadherin, as expected in EMT. Further, EMT can also be
regulated by Notch signaling, which is also increased in our
experiments in Panc-1 cells. While Snail is equally induced in
Capan-1 and Panc-1 cells, Slug is differentially expressed between
the two cell lines. This behavior could be explained by their
respective baseline expression levels: Slug is expressed at low
levels in Panc-1 cells and could thus be induced stronger compared
Snail, which is expressed at higher baseline levels. Similar
baseline expression levels of Snail and Slug have been shown by
others both on transcript and protein levels (39). In cells surviving gemcitabine
incubation, both EMT regulators are overexpressed thus indicating a
protective role of this mechanism against the chemotherapeutic
drug.
These data link the role of cells expressing stem
cell markers to those undergoing EMT. Data obtained from
experiments in benign mammary glands and mammary carcinomas show a
direct link between EMT and the gain of epithelial stem-cell
properties (25): in immortalized
non-malignant human mammary epithelial cells, EMT was induced by
treatment with TGF-β or by ectopic expression of Snail or TWIST. As
expected, these cells acquired a mesenchymal phenotype and a mRNA
expression pattern consistent with EMT, and, most interestingly,
exhibited a CD44high/CD24low surface marker
configuration - the antigenic phenotype ascribed to neoplastic
mammary stem cells. This phenotype was also functionally associated
with properties of stem cells as shown in their ability to form
more mammospheres than untransformed cells.
Identifying a general marker or a set of markers to
pinpoint stem cells in solid tumors has proven difficult, as
exemplified by CD133, the expression of which has been used in the
identification of cancer stem cells in various tumors, such as
brain, lung, colon, kidney, prostate, liver, colon and skin cancer.
However, its importance as a general ‘stemness’ marker has been
questioned by recent studies on its expression in various normal
glandular tissues in general (40,41)
and in normal adult pancreata and pancreatic ductal adenocarcinomas
(42). In the healthy pancreas,
CD133 expression is seen to be initiated in cells at the center of
the acini soon after lumen formation, and continues along the
ductal system into the following ducts up to the larger ducts,
thereby fading in expression intensity. CD133 and CK19 (a ductal
marker) are generally co-localized in the fully differentiated
ductal epithelium. Although apical staining is seen in the majority
of epithelial cells, cells located near the luminal surface within
the acini showed strong cytoplasmic CD133 staining paired with CK19
negativity, indicating an altered differentiation. In tumor
specimens, CD133 positive cells are identified in 80% of the cases,
with mostly apical/endoluminal expression, and cytoplasmic staining
is observed in about 1% of the malignant cells. In summary, in both
normal pancreata and adenocarcinomas of the pancreas, there seem to
exist two distinct populations of CD133 expressing cells: a major
population with apical/endoluminal CD133 expression, which
represents a particular stage in cell differentiation related to
the formation of lumina and ducts, and a minor, rare, population
which expresses CD133 in the cytoplasm. In our study we show that
CD133 is enriched both on mRNA and protein levels in treated cells
and particularly the treated Panc-1 cells differ in their
subcellular localization of CD133. Similar findings were reported
from glioblastoma patients, which showed that CD133 positive cells
were enriched in recurrent glioblastoma and showed increased
resistance against a multitude of chemotherapeutic agents (43). While each of the putative stem cell
markers CD24, CD44 or CD133 was increased in our two investigated
established cell lines and partly in the primary cell lines as
well, also other stem cell associated genes were upregulated. Along
with the induction of these genes, downstream effectors of
chemoresistance, such as ATP-binding cassette transporters could
confer the resistant phenotype (33). While our experimental design does
not allow to fully differentiate between gene induction and
selection of putative cancer stem cells, based on our data we
deduct that stem cell associated genes are an important factor in
cellular response to chemotherapeutic agents such as gemcitabine.
However, the role of each gene in chemoresistance and its
downstream effectors has to be investigated carefully to elucidate
a possible key gene, which might act as a therapeutic target.
Acknowledgements
The authors thank Astrid Taut and
Isabel Zeitträger for their help in conducting the experiments.
This study was in part funded by a grant of the ‘Stiftung P. E.
Kempkes’ at the Philipps University of Marburg, Germany.
References
|
1.
|
Ellison LF and Wilkins K: An update on
cancer survival. Health Rep. 21:55–60. 2010.
|
|
2.
|
Jemal A, Siegel R, Xu J and Ward E: Cancer
statistics, 2010. CA Cancer J Clin. 60:277–300. 2010. View Article : Google Scholar
|
|
3.
|
Burris HA III, Moore MJ, Andersen J, et
al: Improvements in survival and clinical benefit with gemcitabine
as first-line therapy for patients with advanced pancreas cancer: a
randomized trial. J Clin Oncol. 15:2403–2413. 1997.PubMed/NCBI
|
|
4.
|
Moore MJ, Goldstein D, Hamm J, et al:
Erlotinib plus gemcitabine compared with gemcitabine alone in
patients with advanced pancreatic cancer: a phase III trial of the
National Cancer Institute of Canada Clinical Trials Group. J Clin
Oncol. 25:1960–1966. 2007. View Article : Google Scholar
|
|
5.
|
Conroy T, Paillot B, François E, et al:
Irinotecan plus oxaliplatin and leucovorin-modulated fluorouracil
in advanced pancreatic cancer - a Groupe Tumeurs Digestives of the
Federation Nationale des Centres de Lutte Contre le Cancer study. J
Clin Oncol. 23:1228–1236. 2005. View Article : Google Scholar
|
|
6.
|
Ducreux M, Boige V and Malka D: Treatment
of advanced pancreatic cancer. Semin Oncol. 34:S25–S30. 2007.
View Article : Google Scholar : PubMed/NCBI
|
|
7.
|
Jemal A, Bray F, Center MM, et al: Global
cancer statistics. CA Cancer J Clin. 61:69–90. 2011. View Article : Google Scholar
|
|
8.
|
Wang Z, Li Y, Ahmad A, et al: Pancreatic
cancer: understanding and overcoming chemoresistance. Nat Rev
Gastroenterol Hepatol. 8:27–33. 2011. View Article : Google Scholar : PubMed/NCBI
|
|
9.
|
Klonisch T, Wiechec E, Hombach-Klonisch S,
et al: Cancer stem cell markers in common cancers - therapeutic
implications. Trends Mol Med. 14:450–460. 2008. View Article : Google Scholar : PubMed/NCBI
|
|
10.
|
Liu QH, Zhang J, Zhao CY, et al: Surviving
cells after treatment with gemcitabine or 5-fluorouracil for the
study of de novo resistance of pancreatic cancer. Cancer Lett.
314:119–125. 2012. View Article : Google Scholar : PubMed/NCBI
|
|
11.
|
Bonner-Weir S and Sharma A: Pancreatic
stem cells. J Pathol. 197:519–526. 2002. View Article : Google Scholar
|
|
12.
|
O’Brien CA, Kreso A and Jamieson CH:
Cancer stem cells and self-renewal. Clin Cancer Res. 16:3113–3120.
2010.
|
|
13.
|
Zhang YQ, Kritzik M and Sarvetnick N:
Identification and expansion of pancreatic stem/progenitor cells. J
Cell Mol Med. 9:331–344. 2005. View Article : Google Scholar : PubMed/NCBI
|
|
14.
|
Lee CJ, Dosch J and Simeone DM: Pancreatic
cancer stem cells. J Clin Oncol. 26:2806–2812. 2008. View Article : Google Scholar : PubMed/NCBI
|
|
15.
|
Quante M and Wang TC: Stem cells in
gastroenterology and hepatology. Nat Rev Gastroenterol Hepatol.
6:724–737. 2009. View Article : Google Scholar : PubMed/NCBI
|
|
16.
|
Wang JC and Dick JE: Cancer stem cells:
lessons from leukemia. Trends Cell Biol. 15:494–501. 2005.
View Article : Google Scholar : PubMed/NCBI
|
|
17.
|
Zou GM: Cancer initiating cells or cancer
stem cells in the gastrointestinal tract and liver. J Cell Physiol.
217:598–604. 2008. View Article : Google Scholar : PubMed/NCBI
|
|
18.
|
Haraguchi N, Utsunomiya T, Inoue H, et al:
Characterization of a side population of cancer cells from human
gastrointestinal system. Stem Cells. 24:506–513. 2006. View Article : Google Scholar : PubMed/NCBI
|
|
19.
|
Haraguchi N, Inoue H, Tanaka F, et al:
Cancer stem cells in human gastrointestinal cancers. Hum Cell.
19:24–29. 2006. View Article : Google Scholar
|
|
20.
|
Hermann PC, Bhaskar S, Cioffi M and
Heeschen C: Cancer stem cells in solid tumors. Semin Cancer Biol.
20:77–84. 2010. View Article : Google Scholar : PubMed/NCBI
|
|
21.
|
Zhou J, Wang CY, Liu T, et al: Persistence
of side population cells with high drug efflux capacity in
pancreatic cancer. World J Gastroenterol. 14:925–930. 2008.
View Article : Google Scholar : PubMed/NCBI
|
|
22.
|
Wang Z, Li Y, Kong D, et al: Acquisition
of epithelial-mesenchymal transition phenotype of
gemcitabine-resistant pancreatic cancer cells is linked with
activation of the notch signaling pathway. Cancer Res.
69:2400–2407. 2009. View Article : Google Scholar
|
|
23.
|
Arumugam T, Ramachandran V, Fournier KF,
et al: Epithelial to mesenchymal transition contributes to drug
resistance in pancreatic cancer. Cancer Res. 69:5820–5828. 2009.
View Article : Google Scholar : PubMed/NCBI
|
|
24.
|
Kim MP and Gallick GE: Gemcitabine
resistance in pancreatic cancer: picking the key players. Clin
Cancer Res. 14:1284–1285. 2008. View Article : Google Scholar : PubMed/NCBI
|
|
25.
|
Mani SA, Guo W, Liao MJ, et al: The
epithelial-mesenchymal transition generates cells with properties
of stem cells. Cell. 133:704–715. 2008. View Article : Google Scholar : PubMed/NCBI
|
|
26.
|
Rückert F, Werner K, Aust D, et al:
Immunohistological analysis of six new primary pancreatic
adenocarcinoma cell lines. Global J Biochem. 3:112012.
|
|
27.
|
Rückert F, Aust D, Böhme I, et al: Five
primary human pancreatic adenocarcinoma cell lines established by
the outgrowth method. J Surg Res. 172:29–39. 2012.PubMed/NCBI
|
|
28.
|
Pfaffl MW, Horgan GW and Dempfle L:
Relative expression software tool (REST) for group-wise comparison
and statistical analysis of relative expression results in
real-time PCR. Nucleic Acids Res. 30:e362002. View Article : Google Scholar : PubMed/NCBI
|
|
29.
|
Pfaffl MW: A new mathematical model for
relative quantification in real-time RT-PCR. Nucleic Acids Res.
29:e452001. View Article : Google Scholar : PubMed/NCBI
|
|
30.
|
Ke N, Wang X, Xu X and Abassi YA: The
xCELLigence system for real-time and label-free monitoring of cell
viability. Methods Mol Biol. 740:33–43. 2011. View Article : Google Scholar : PubMed/NCBI
|
|
31.
|
Sipos B, Moser S, Kalthoff H, et al: A
comprehensive characterization of pancreatic ductal carcinoma cell
lines: towards the establishment of an in vitro research platform.
Virchows Arch. 442:444–52. 2003.PubMed/NCBI
|
|
32.
|
Neureiter D, Zopf S, Dimmler A, et al:
Different capabilities of morphological pattern formation and its
association with the expression of differentiation markers in a
xenograft model of human pancreatic cancer cell lines.
Pancreatology. 5:387–397. 2005. View Article : Google Scholar
|
|
33.
|
Hong SP, Wen J, Bang S, Park S and Song
SY: CD44-positive cells are responsible for gemcitabine resistance
in pancreatic cancer cells. Int J Cancer. 125:2323–2331. 2009.
View Article : Google Scholar : PubMed/NCBI
|
|
34.
|
Du Z, Qin R, Wei C, et al: Pancreatic
cancer cells resistant to chemoradiotherapy rich in
‘stem-cell-like’ tumor cells. Dig Dis Sci. 56:741–750.
2011.PubMed/NCBI
|
|
35.
|
Quint K, Stintzing S, Alinger B, et al:
The expression pattern of PDX-1, SHH, Patched and Gli-1 is
associated with pathological and clinical features in human
pancreatic cancer. Pancreatology. 9:116–26. 2009. View Article : Google Scholar : PubMed/NCBI
|
|
36.
|
Wen J, Park JY, Park KH, et al: Oct4 and
Nanog expression is associated with early stages of pancreatic
carcinogenesis. Pancreas. 39:622–626. 2010. View Article : Google Scholar : PubMed/NCBI
|
|
37.
|
Fan CM and Tessier-Lavigne M: Patterning
of mammalian somites by surface ectoderm and notochord: evidence
for sclerotome induction by a hedgehog homolog. Cell. 79:1175–1186.
1994. View Article : Google Scholar : PubMed/NCBI
|
|
38.
|
Li X, Deng W, Lobo-Ruppert S and Ruppert
J: Gli1 acts through Snail and E-cadherin to promote nuclear
signaling by β-catenin. Oncogene. 26:4489–4498. 2007.PubMed/NCBI
|
|
39.
|
Hotz B, Arndt M, Dullat S, et al:
Epithelial to mesenchymal transition: expression of the regulators
Snail, Slug, and Twist in pancreatic cancer. Clin Cancer Res.
13:4769–4776. 2007. View Article : Google Scholar : PubMed/NCBI
|
|
40.
|
Missol-Kolka E, Karbanová J, Janich P, et
al: Prominin-1 (CD133) is not restricted to stem cells located in
the basal compartment of murine and human prostate. Prostate.
71:254–267. 2011. View Article : Google Scholar : PubMed/NCBI
|
|
41.
|
Karbanová J, Missol-Kolka E, Fonseca AV,
et al: The stem cell marker CD133 (Prominin-1) is expressed in
various human glandular epithelia. J Histochem Cytochem.
56:977–993. 2008.PubMed/NCBI
|
|
42.
|
Immervoll H, Hoem D, Sakariassen PØ,
Steffensen OJ and Molven A: Expression of the ‘stem cell marker’
CD133 in pancreas and pancreatic ductal adenocarcinomas. BMC
Cancer. 8:482008.
|
|
43.
|
Liu G, Yuan X, Zeng Z, et al: Analysis of
gene expression and chemoresistance of CD133+ cancer
stem cells in glioblastoma. Mol Cancer. 5:672006. View Article : Google Scholar : PubMed/NCBI
|