Introduction
Kidney cancer is the third most common genitourinary
cancer with 64,770 new cases per year in the US in 2012 (1,2). The
majority (75%) are renal clear cell carcinomas (RCC), which have
the highest mortality to incidence ratios or all urologic
malignancies resulting in 13,570 deaths per year due to their
extreme insensitivity to chemo- and radiation therapy. The
incidence is twice as high in men than women and associated with
risk factors such as: advanced age, tobacco use, and obesity
(3,4). In the majority of RCC, the HIF1
complex is constitutively activated due to mutation of the Von
Hippel-Lindau tumor suppressor (VHL), gene and inactivation of the
prolyl hydro-xylation that targets the HIFs to be degraded
(5,6). As a result of HIF1 stabilization,
there is an induction of a hypoxic gene expression program (GLUT1,
VEGF, iNOS, EPO) that support proteins involved in angiogenesis and
oxygenation (5,7,8).
This had led to therapies targeting angiogenesis which have
achieved only partial responses (9,10),
and the necessity for further research into new factors involved in
RCC progression. A role for elevated tumor cell cholesterol and
altered lipid metabolism has been implicated in the etiology and
disease progression in renal clear cell cancer based on its
potential for apoptotic interference (4,11–16).
Currently favored theories propose that RCC consists of a group of
diseases of abnormal metabolism relating to oxygen, iron, energy
and nutrient sensing pathways (8,17,18).
The concept of an aberrant metabolic phenotype of RCC has been
further supported by several studies elaborating mechanisms of
defects in mitochondrial metabolism in the TCA cycle that lead to
metabolic imbalance and HIF1 stabilization (19–22).
Our current study of the role of TERE1 in RCC is based on its role
in synthesis of menaquinone (23)
that exerts profound influence on mitochondrial function, oxidative
and nitrosative stress, and regulation of lipid metabolism via
activation of SXR nuclear receptor signaling, and several other
mechanisms that lead to growth inhibition and increased apoptosis
(24).
We originally reported the cloning of the TERE1 gene
(aka UBIAD1) and showed conserved mRNA expression in urothelium and
other normal tissues; however, reduced mRNA levels were found in
muscle-invasive transitional cell carcinoma (TCC) of the bladder
and metastatic prostate cancer (25,26).
Our immunohistochemical analysis determined TERE1 protein
expression was decreased in a third of invasive TCC (25–27).
Ectopic TERE1 expression in bladder cancer and prostate cancer cell
lines resulted in dramatic inhibition of in vitro growth and
tumorigenicity (25–27). Protein interaction studies
identified APOE, TBL2, HMGR, and SOAT-1 as TERE1-interacting
proteins, strongly implicating a role in cholesterol homeostasis
(28). TERE1 gene mutations were
discovered to cause a rare disease of elevated corneal cholesterol
and lipid deposition called Schnyder’s corneal dystrophy (SCD)
(29,30), and affect interactions with APOE,
HMGR, and with TBL2 (24,27,31).
A unifying hypothesis towards understanding effects
on lipid metabolism emerged when TERE1 was identified as the
prenyltransferase required for vitamin K-2 biosynthesis: conversion
of vitamin K-1 (phylloquinone), to K-2 (menaquinone) with K-3
(menadione) as an intermediate (23). Vitamin K-2 is a potent activator of
the SXR nuclear hormone receptor that has established roles in
regulation of lipid metabolism and cholesterol efflux (32,33).
Quinone metabolism also provides a basis for understanding effects
on redox balance and mitochondrial function. There is abundant
literature describing the activity of exogenous vitamin K-2 and K-3
in the inhibition of tumor cell growth based on the redox-cycling
and alkylating properties of quinones (34–36),
which strongly suggests this may be a mechanism of TERE1 tumor
suppressor activity. A further dimension of TERE1 activity is based
on the established role of menaquinone as an electron carrier in
the electron transport chain, ETC, of anaerobic bacteria and
anaerobic mitochondria (37,38).
This function was supported by studies of the Drosophila
homolog of TERE1/UBIAD1, heix, that demonstrated a role in
vitamin K-2-mediated mitochondrial electron transport and ATP
production (39). We recently
conducted an immunoelectronmicroscopic analysis demonstrating that
TERE1 can co-localize with TBL2 in mitochondria, and increase the
mitochondrial transmembrane potential, and generate ROS/RNS
(24).
Given the altered metabolic phenotype of RCC and the
emerging view of a metabolic mode of tumor suppression attributed
to TERE1, we have conducted a preliminary investigation of TERE1 in
RCC. The principle objectives of this study were to establish a
TERE1-negative expression phenotype in a over half of the lesions
from a tumor microarray (TMA) set of human RCC tumor specimens,
demonstrate that ectopic TERE1 expression resulted in an 80%
decrease in growth of Caki-1 and Caki-2 cells and suppression of
colony forming ability in a panel of RCC cell lines, as well as an
increase in caspase 3/7 activity. We show TERE1 can activate
mitochondrial activity using extracellular flux analysis and lead
to elevations in ROS/RNS. TERE1 and TBL2 reduced Caki-1 and Caki-2
cell cholesterol by up to 40% and activated a common set of SXR
target genes with roles in cholesterol and lipid metabolism. We
discuss the hypothesis that compromise of TERE1 by reduced
expression in RCC, may represent a loss of stress, redox and SXR
signaling that affects lipid metabolism and growth.
Materials and methods
Immunohistochemistry
Five-micron sections from formalin-fixed
paraffin-embedded tissue specimens were deparaffinized in xylene
and rehydrated in graded alcohol with quenching of endogenous
peroxidase activity by treatment with 2% H2O2
in methanol. The slides were blocked in 10% normal rabbit serum and
incubated with affinity-purified anti-TERE1 (2 μg/ml) for 14
h at 4°C. After washes, the slides were incubated with
biotin-conjugated rabbit IgG for 30 min followed by
streptavidin-conjugated peroxidase and 3′3-diaminobenzidine, and
counterstained with hematoxylin.
Cell lines and antibodies
The human RCC cell lines were obtained from the
American Type Culture Collection (Manassas, VA) and grown according
to supplier’s instructions. Caki-1 (HTB-46) and Caki-2 (HTB-47)
cells are derived from clear cell carcinoma of kidney. The ACHN
(CRL-1611), 786-O (CRL-1932), A704 (CRL-7911), and A-498 (HTB-44)
are all derived from human renal cell adenocarcinomas. Goat
anti-TERE1 antibodies (Santa Cruz) and rabbit anti-TBL2 (216–309)
(Sigma) were previously characterized (24,27).
Expression vectors
All expression plasmids, adenovirus and lentivirus
used for ectopic expression by transfection and transduction were
derived in our laboratory and have been previously described
(24,27).
Nucleofection and viral transduction
Nucleofection was performed with the Nucleofector II
system according to the manufacturer’s protocol (Amaxa/Lonza
Cologne, Germany) and has been previously described (27). Infectious adenovirus was produced
and amplified in HEK293A cells following guidelines from Invitrogen
and titered via an anti-hexon staining procedure from Clontech to
>4×10⁸ IU/ml. Infections were in the presence of 6
μg/ml polybrene and monitored via AdGFP expression.
Preparation of cell extracts
Cell lines that had been transfected via Amaxa
nucleofection or transduced with Ad-LACZ, Ad-TERE1, or Ad-TBL2
adenovirus, were harvested 36–72 h later from 10 cm plates by
washing in ice cold PBS with protease inhibitors, and scraping to
freeze cell pellets. Whole cell extracts were prepared and analyzed
by methods previously described (24,27).
In detail, whole cell extracts were prepared by lysis in a mixture
of different detergent buffers: 0.5% of ASB-14, CHAPS, Octyl
glucoside, NP-40 (Calbiochem) or BRIJ 96/99, Triton X-100 (Sigma),
containing 150 mM NaCl, 10 mM Tris-HCl (pH 7.4) and protease
inhibitors: 1.0 mM EDTA, 2 μg/ml leupeptin and pepstatin, 10
μg/ml aprotinin, and 1.0 mM phenylmethylsulfonlyfluoride
(PMSF), and one complete mini protease inhibitor cocktail tablet
(Roche) per 10 ml lysis buffer. After brief sonication, lysates
were clarified at 16,000 × g for 30 min at 4°C and supernatants
were evaluated for protein concentration by BCA assay using BSA as
a standard. Equal amounts of cell lysate (50 μg of protein)
were fractionated by SDS-PAGE in 4–20% Bis-Tris gels (Invitrogen)
run with MES buffer under reducing conditions and were transferred
to nitrocellulose membranes. The non-specific protein binding sites
on blots were blocked by incubation in 5% non-fat dry milk in TBS
[150 mM NaCl, 10 mM Tris-HCl (pH 7.4)] and then blots were probed
for 2 h at room temperature with affinity purified primary
antibodies at ∼0.2 μg/ml in TBS pH 7.4 with 3% non-fat dry
milk and 0.05% Tween-20. Horseradish peroxidase-conjugated goat
anti-rabbit IgG (Bio-Rad) was used to detect immune complexes on
immunoblots. Blots were treated with Supersignal West Pico
chemiluminescence reagents (Pierce) and were visualized on X-ray
film (Kodak, Biomax-MR, or Thermo CL-X Posure film).
Cell proliferation, colony formation, and
caspase 3/7 assays
Cell growth assays were conducted in quadruplicate
wells of 96-well luminometry plates using the Cell titer-Glo
Luminescent. Cell viability kit following specifications provided
by Promega. Colony formation assays were initiated 48 h after
lentivirus transduction using blasticidin selection for 3 weeks
with selective media replacement every 4 days followed by staining
with methylene blue or cresyl violet. For selection of resistant
colonies the following Blastcidin concentrations were used: Caki-1
(5.5 μg/ml) and Caki-2 (3.0 μg/ml), ACHN (5.5
μg/ml), 786-O (7 μg/ml), A704 (5 μg/ml), and
A-498 (5 μg/ml). Caspase 3/7 assays used the Promega
Caspase-Glo luciferase assays as specified by manufacturer. Caki-1
and Caki-2 cells were plated in 96-well luminometry plates for cell
culture and quadruplicate wells infected for 60 h with Ad-LACZ,
Ad-TERE1, or Ad-miRNA TERE1 (27).
Extracellular flux analysis
All measurements of O2 consumption rate
(OCR) and proton production, expressed as the extracellular
acidification rate (ECAR), were performed with a Seahorse
Bioscience XF24 extracellular flux analyzer following procedures
from the manufacturer (Billirica, MA). Caki-1 cells were infected
for 48 h with the Ad-LACZ control or Ad-TERE1 virus and then were
plated at 1.5, 3.0, 4.5×10⁴ cells/well onto
poly-L-lysine coated Seahorse 24-well plates 18 h prior to the
assay. Data analysis showed 3.0×10⁴ cells/well to be the
optimal seeding density. Immediately following the addition of
fresh medium, OCR and proton production, expressed as the ECAR,
were quantified to obtain baseline levels of these processes. After
basal measurements cyanide p-trifluoromethoxy-phenylhydrazone,
FCCP, was injected into parallel wells to determine the maximum
responses, and 10 μM vitamin K-2 to compare with TERE1
expression.
Oxidative and nitrosative stress
assays
Oxidative stress measurements were conducted using
cell imaging of dihydrorhodamine 123 and CellROX deep red
fluorogenic probes (Molecular Probes/Invitrogen). Dihydrorhodamine
123 reacts with either hydrogen peroxide (in presence of
peroxidase, cytochrome c or Fe2+) or with peroxynitrate
(formed when nitric oxide reacts with superoxide). Once
dihydrorhodamine 123 is oxidized to rhodamine 123, it localizes to
mitochondria. CellROX deep red oxidation is specific for ROS but
not RNS Caki-1 and Caki-2 cell lines were plated in 96-well
optically clear plates (Costar 3720) and infected for 48–72 h with
Ad-LACZ, or Ad-TERE1. Cellular NO/RNS production was measured using
the fluorescent probe 4-amino-5-methylamino-2’,7’-difluorofluescein
diacetate, DAF-FM-DA (Molecular Probes/nvitrogen; D-23844); DAF-FM
reacts with NO and RNS to form a fluorescent benzotriazole. Our
procedures for loading cells with these fuorogenic probes and
visualization by laser scanning confocal microscopy (Olympus
Fluoview FV1000; 488 nm Ar laser excitation/525 nm emission; 10x,
0.3NA objective) have been previously detailed (24). Cells were loaded with DAF-FM by
incubation in DPBS containing 5 μM DAF-FM-DA and 5 μM
carboxy PTIO (Cayman Chemicals), a cell permeant NO scavenger to
prevent DAF-FM from reacting with any RNS produced during dye
loading. After 45 min loading at room temperature in the dark,
cultures were washed 4 times with warm HBSS to remove unloaded
DAF-FM-DA and cPTIO, followed by ∼10 min to allow for loaded dye
retention before imaging was performed. Care was taken to follow
the loading protocol strictly to normalize dye loading between
samples. Images were captured at 10-sec intervals (scan speed 12
μsec/pixel). Baseline DAF-FM fluorescence was determined by
averaging the first 20 frames of each experiment. NO production was
initiated by addition of modified Hank’s balanced salt solution
(HBSS, pH 7.4) containing 1X minimal essential medium (MEM) amino
acids (Gibco) to provide a source of arginine (∼0.6 mM) for NO
production and measured for 10 min. Menaquinone 30 μM was
added during imaging to assess immediate responses. Normalization
of DAF-FM fluorescence changes was made after subtraction of
off-cell background fluorescence.
Cholesterol assay
The cholesterol content of J82 cell lysates
harvested after 72 h of transduction with Ad-LACZ, Ad-TERE1,
Ad-TBL2, or treatment with vitamin K-1 (30 μM), K-2 (30
μM), K-3 (10 μM) was detected using an Amplex Red
Cholesterol Assay kit relative to a dilution series of cholesterol
standards as specified (Invitrogen). Lysates were prepared as
previously described (27).
RNA isolation, reverse transcription and
Fluidigm RT-PCR TaqMan expression assays
Caki-1 cells were grown to 80% confluency,
transduced with Ad-LACZ, Ad-TERE1, Ad-TBL2 and ∼5×10⁶
cells were lysed in 2 ml TRIzol after 72 h. Total RNA was isolated
from TRIzol cell lysates (Invitrogen, Carlsbad, CA), using the
Ambion Pure-Link RNA Mini kit according to the procedures specified
by the manufacturer (Catalog 12183-081A). RNA quantity was
determined using a Nanodrop ND-1000 spectrophotometer (Thermo
Scientific, Waltham, MA) and quality was assessed using an Agilent
2100 Bioanalyzer (Agilent Technologies, Santa Clara, CA). The cDNA
synthesis, specific target pre-amplification, and Fluidigm RT-PCR
TaqMan expression assays were performed using procedures
recommended by ABI Biosciences and Fluidigm (40) and were performed at the UPENN
Molecular Profiling Facility as previously described (24). Data were analyzed using the
Fluidigm BioMark Gene Expression Data Analysis software to obtain
ΔΔCt values and expressed as a ratio to the Ad-vector control to
determine the fold change in gene expression. The TaqMan probes
were purchased from Applied Biosystems/Invirogen. In detail, all
TaqMan gene expression assays for RT-PCR were as 5’ FAM™ reporter
dye/3’ MGB/nonfluorescent quencher (NFQ) from Applied
Biosystems/Invitrogen. Probes were inventoried assays selected to
span an exon junction and are listed: human β-actin 4333762F, GUSB
4333767F, human PPIA 4333763F, HIF1a ID: Hs00153153_m1, HMOX ID:
Hs01110250_m1, TSC2 ID: Hs01020387_m1, VKOR ID: Hs01653025_m1, NQO2
ID: Hs01061270_m1, NQO1 ID: Hs01045994_m1, GAS6 ID: Hs00181323_m1,
AXL ID: Hs00242357_m1, HMGCS ID: Hs00266810_m1, CD36, SCARB3 ID:
Hs00169627_m1, CYP7A1 ID: Hs00167982_m1, APOE ID: Hs00171168_m1,
CPT1A ID: Hs00912671_m1, FBXW7 Hs00217794_m1, INSIG1 made to order
255 Hs04186616_m1, CYP11A1 ID: Hs00167984_ m1, STAR ID:
Hs00264912_m1, TSPO ID: Hs00559362_m1, SREBF1 ID: Hs01088691_m1,
SREBF2 ID: Hs01081784_m1, FASN ID: Hs01005622_m1, SCD2 ID:
Hs00227692_m1, SCD1 ID: Hs01682761_m1ST2A1 Hs00234219_m1, FDPS ID:
Hs00266635_m1, SXR ID: Hs00243666_m1, TBL2 ID: Hs00202878_m1,
UBIAD1 ID: Hs00203343_m1, ABCG1 ID: Hs00245154_m1, ABCA1 ID:
Hs01059118_m1, ABCB1 ID: Hs01067802_m1, CYP3A4 ID: Hs00604506_m1,
AKR1C3 ID: Hs00366267_m1, AKR1C2 ID: Hs00912742_m1, AKR1C1 ID:
Hs00413886_m1, SRD5A1 ID: Hs00602694_mH, HSD3B1 ID: Hs00426435_m1,
OATP1B1 ID: Hs00272374_m1, 3-hydroxy-3-methylglutaryl-CoA reductase
ID: Hs00168352_m1, CYP27A1 ID: Hs01026016_m1, CYP24A1 ID:
Hs00167999_m1, CYP17A1 ID: Hs01124136_m1, MRP2 ID: Hs01091188_m1,
UGT2B15 ID Hs03008769_g1, UGT2B17 ID: Hs00854486_sH.
Results
Features of TERE1 (UBIAD1) and
interacting proteins
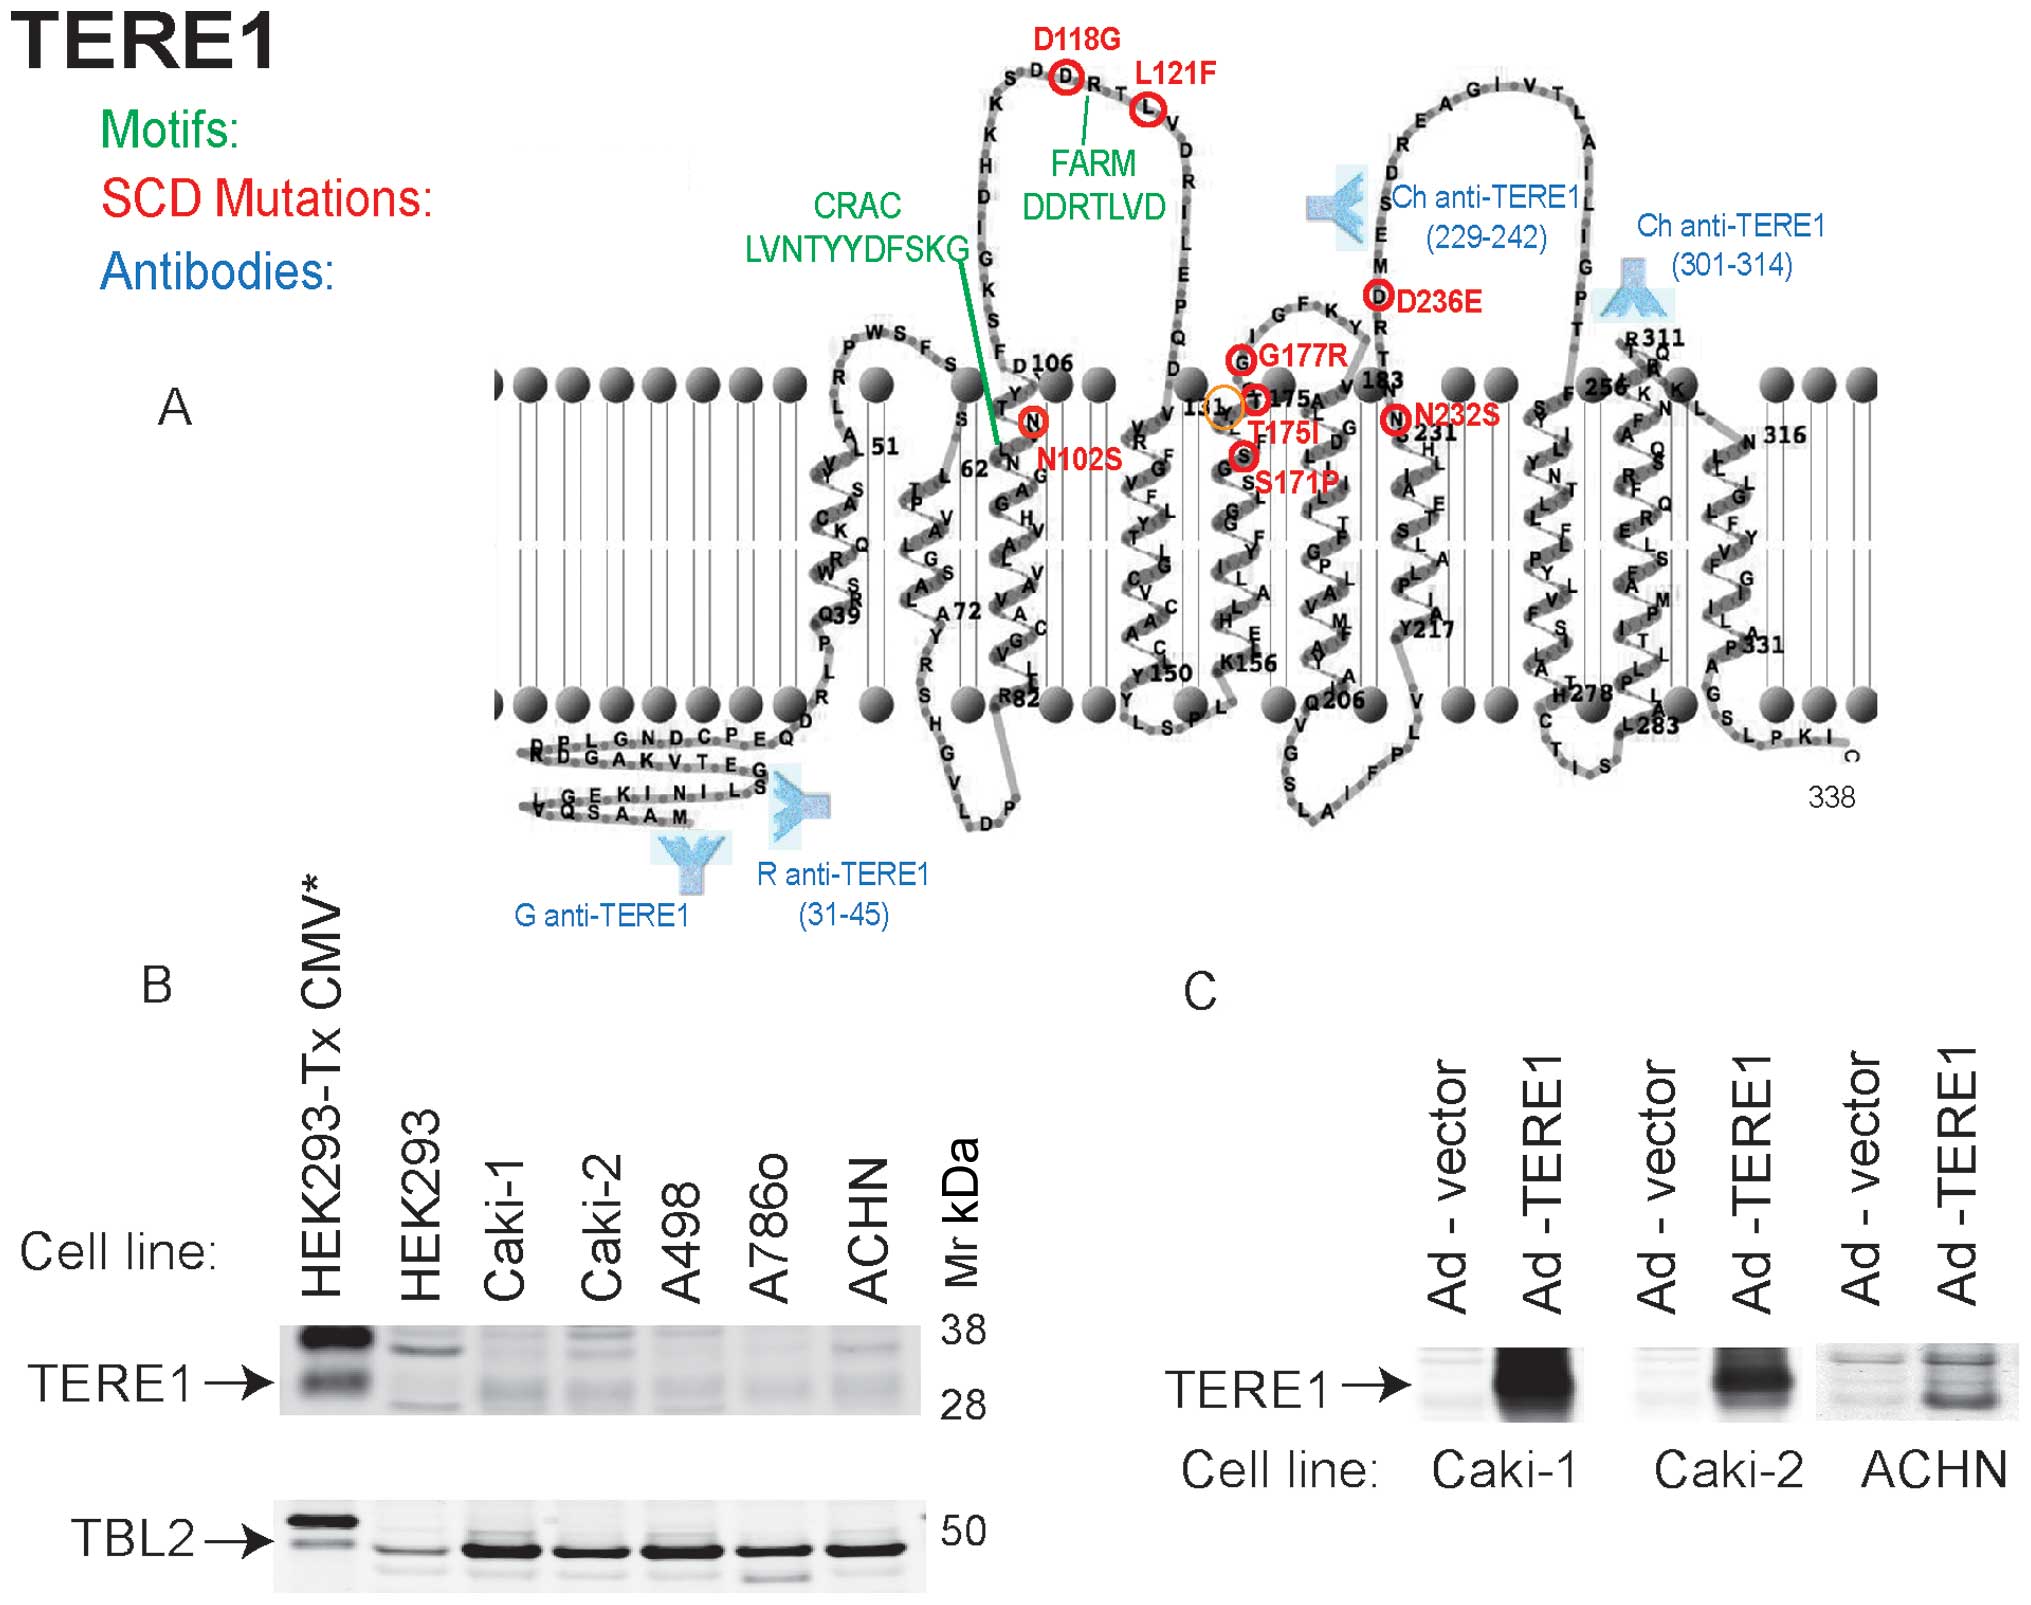
TERE1 is a ten α-helical transmembrane domain
protein of 338 amino acid residues that localizes to ER, golgi and
mitochondria (23,24,41).
As depicted in Fig. 1, the
mutations (in red) associated with SCD occur in residues on one
side of the membrane, either in aqueous loops or close to one
bilayer surface (29). These loops
may constitute a binding interface for interacting proteins, APOE,
TBL2, HMGR, and SOAT-1 (24,27,31).
Also featured is a well-conserved CRAC motif
[L/V(X1–5)Y(X1–5) R/K] involved in binding
cholesterol (27,42,43),
and an adjacent FARM motif DDXXXXD (farnesyl binding aspartate-rich
motif), a putative ligand/polyprenyldiphosphate binding site
(29). The presence of a heme
regulatory motif and oxidoreductase motif, not shown, suggests that
TERE1 activity may be affected by cellular redox state (29). The approximate polyclonal antibody
binding sites used in this study are also shown. We evaluated TERE1
and TBL2 expression in a panel of RCC cell lines. Fig. 1B shows a very low level of
endogenous TERE1 levels in several RCC cell lines (top) yet
conserved expression of TBL2 (bottom). Reduced TERE1 expression may
be a feature in common among RCC cell lines and some RCC cancer
specimens. We ectopically expressed the TERE1 protein in Caki-1,
Caki-2, and ACHN cells by introducing cDNAs via infection with
adenoviral vectors and confirmed expression of the ∼37 kDa TERE1
protein via immunoblots (Fig.
1C).
TERE1 expression in renal clear cell
carcinoma
Based on a view of TERE1 as a modulator of lipid
metabolism, and RCC as disease of altered metabolism, we have
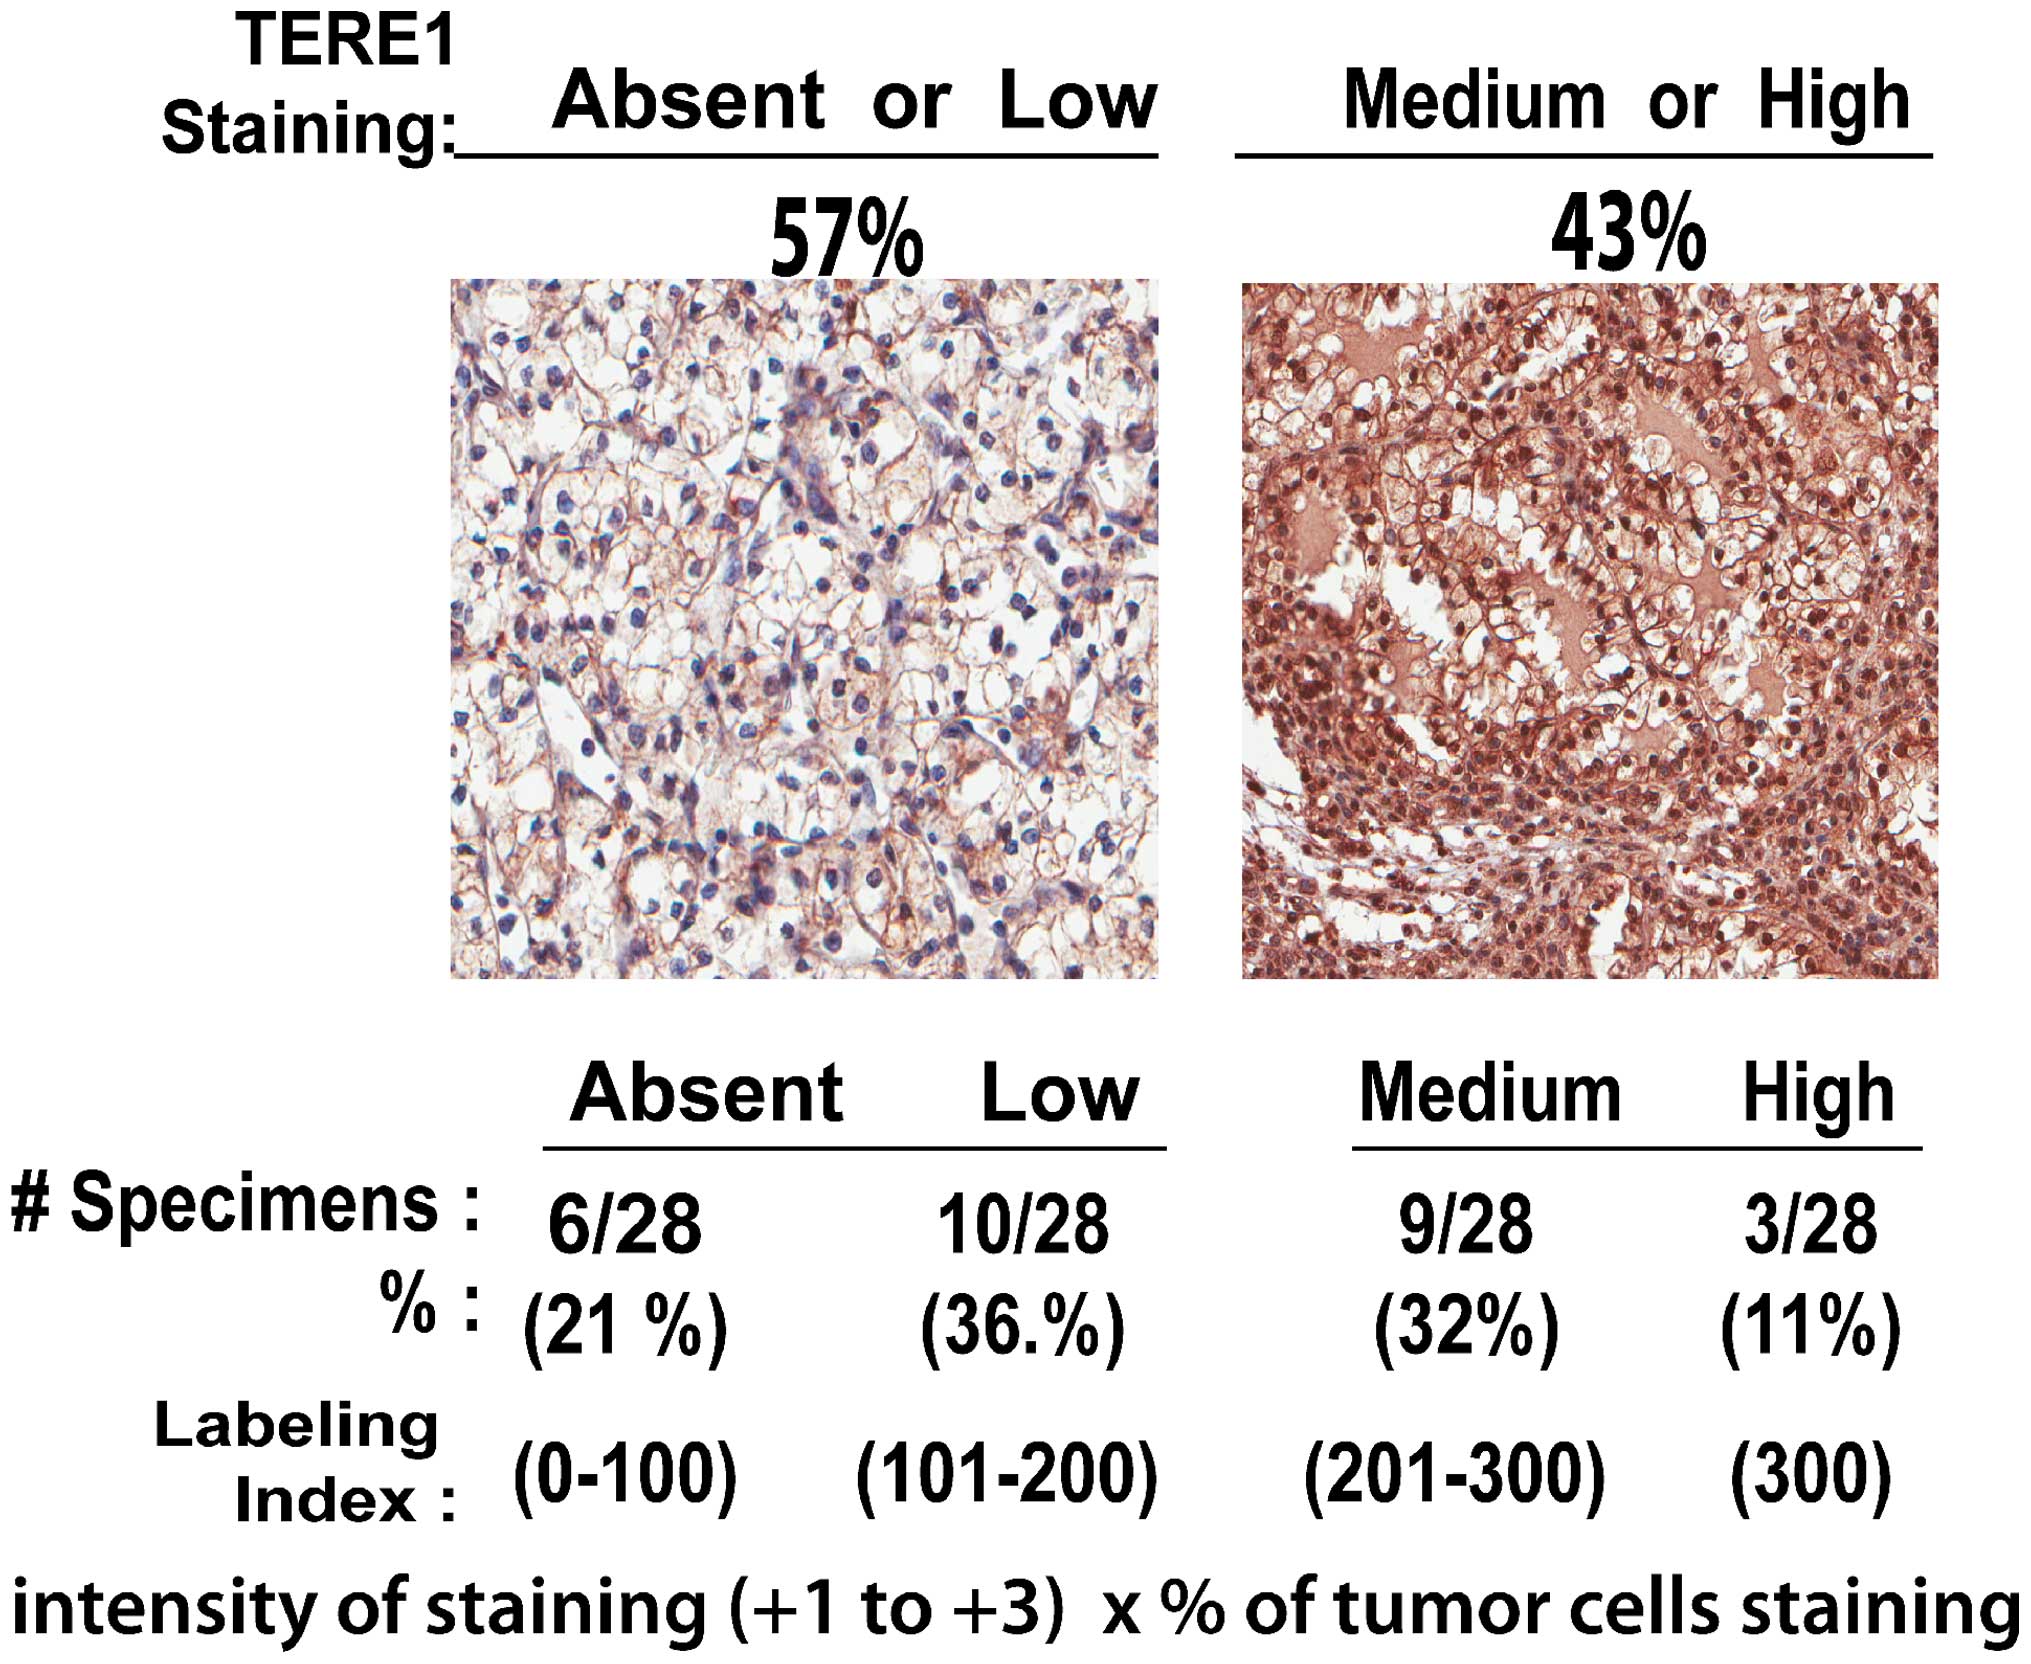
conducted a preliminary investigation of TERE1 in RCC. We examined
TERE1 expression in a human tumor microarray (TMA) of renal clear
cell carcinoma specimens via an immunohistochemical analysis using
a chicken anti-TERE1 (229–242) antibody (Fig. 2). The representative anti-TERE1
staining levels were sorted into the four groups (absent, low,
medium, and high) based on the assigned labeling index. The average
value obtained from three cores was assigned as the score for that
particular case. Overall, TERE1 staining was heterogeneous in 28
specimens. TERE1 staining was absent or low in almost 60% of RCC
specimens, hence may represent a significant phenotype in renal
cancer.
Ectopic TERE1 expression inhibits growth
and colony formation of RCC cell lines
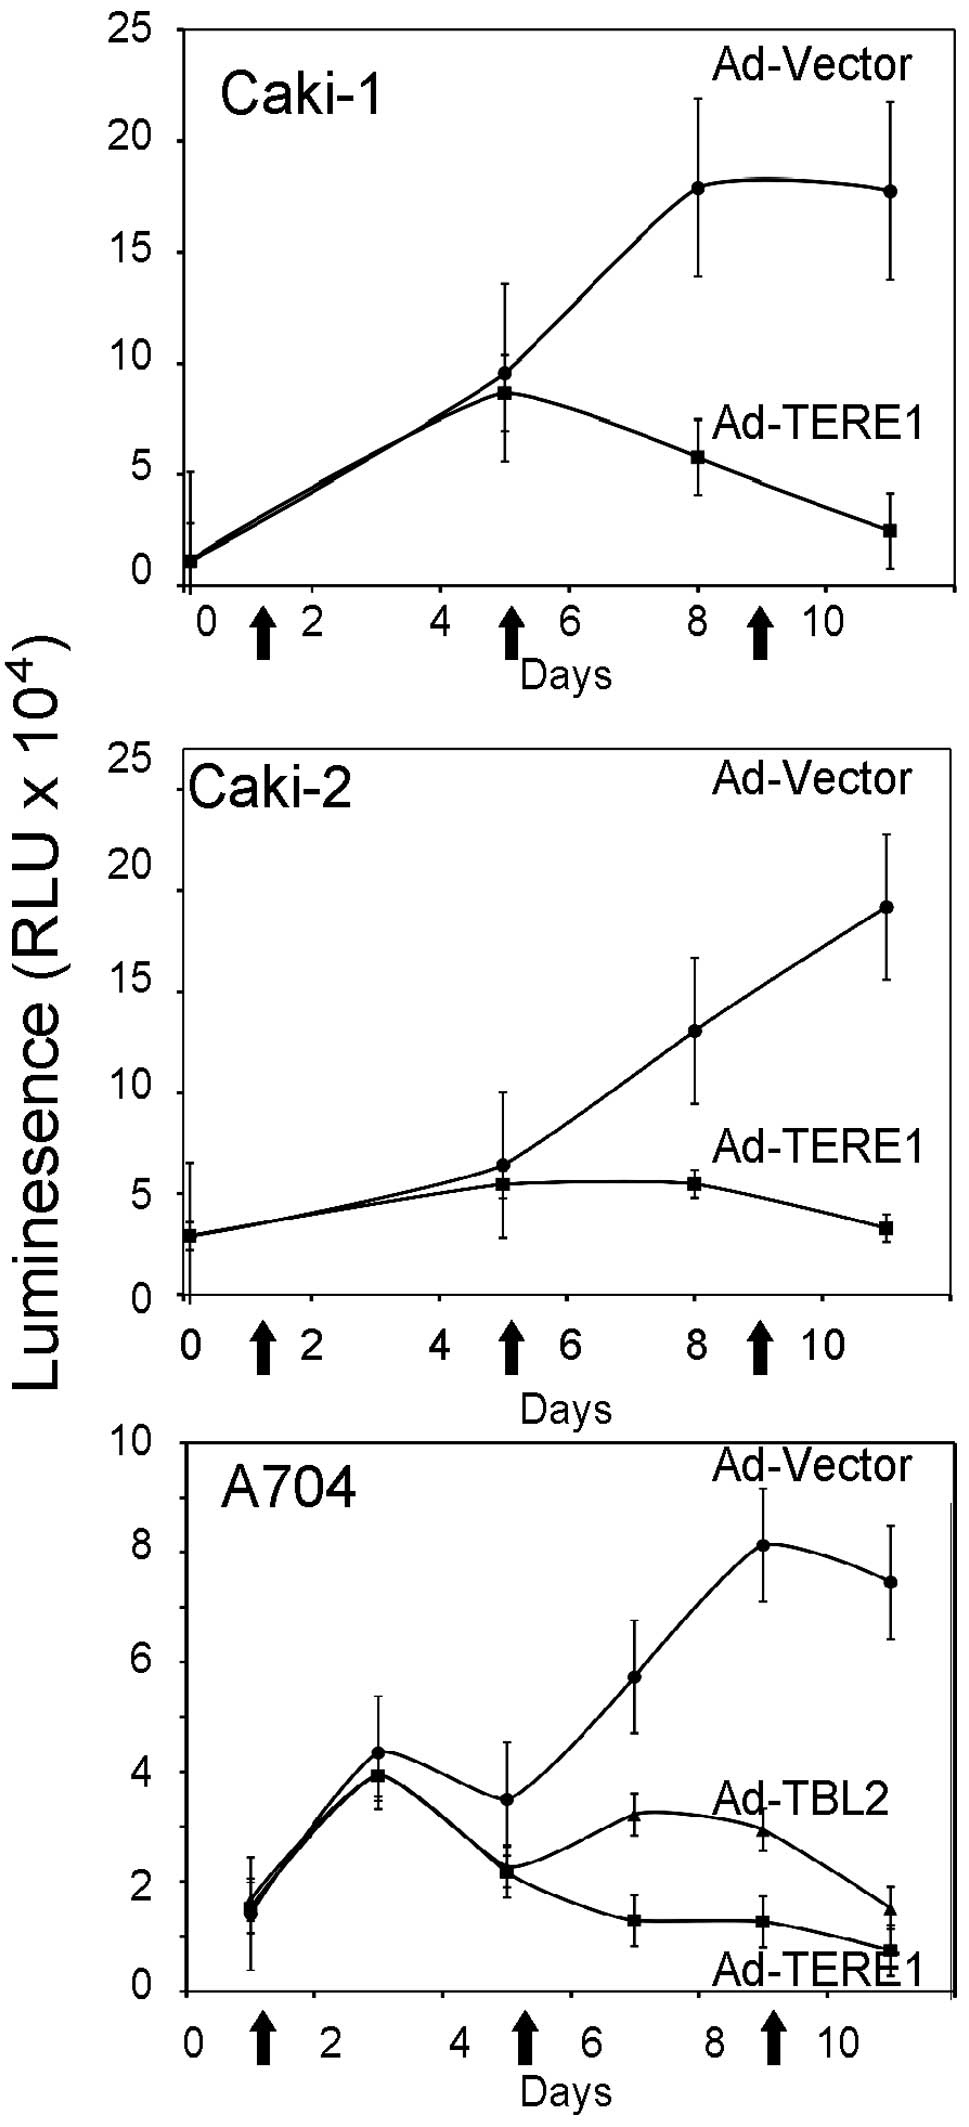
We evaluated the growth of Caki-1, Caki-2 and A704
renal carcinoma cell lines upon TERE1 expression to determine its
potential for growth inhibition as we had observed with TERE1 in
bladder and prostate cancer cells (25–27).
Caki-1, Caki-2 and A704 renal carcinoma cell lines were transduced
with Ad-TERE1 or Ad-LACZ virus (arrows) over 10 days, and
proliferation determined via the Cell titer-Glo Luminescent Cell
viability kit from Promega. Ectopic TERE1 expression inhibited cell
growth up to 80% in all three of the cell lines after 10 days
(Fig. 3). Ectopic TBL2 also
inhibited A704 cell growth. TERE1 also caused significant decreases
in stable colony formation (Fig.
4B) in Caki-1 (80%), A498 (45%), ACHN (38%), and 786-O (57%)
renal cancer cell lines after lentiviral transduction and selection
in blasticidin for 3 weeks, but only a slight decrease in A704
colonies (6%). Methylene blue stained colonies shown for some cell
lines in Fig. 4A. Conversely,
TERE1 knockdown increased colony formation: in Caki-1 (1.9-fold),
A704 (1.8-fold), A498 (1.5-fold), ACHN (1.7-fold), and 786-O
(1.3-fold). A TERE1-mediated increase in caspase 3/7 activity was
observed in Caki-1 (40% increase), 786-O (60% increase), and ACHN
(20% increase) cell lines 4 days after Ad-TERE1 transduction. This
suggests that a delayed apoptosis plays a role in the
TERE1-mediated growth suppression in some of the RCC cells, though
may not account for all the growth inhibition. Based on the
importance of mitochondrial metabolism in the metabolic phenotype
of RCC (19–22), we turned our focus to looking at
effects of TERE1 on additional aspects of mitochondrial
function.
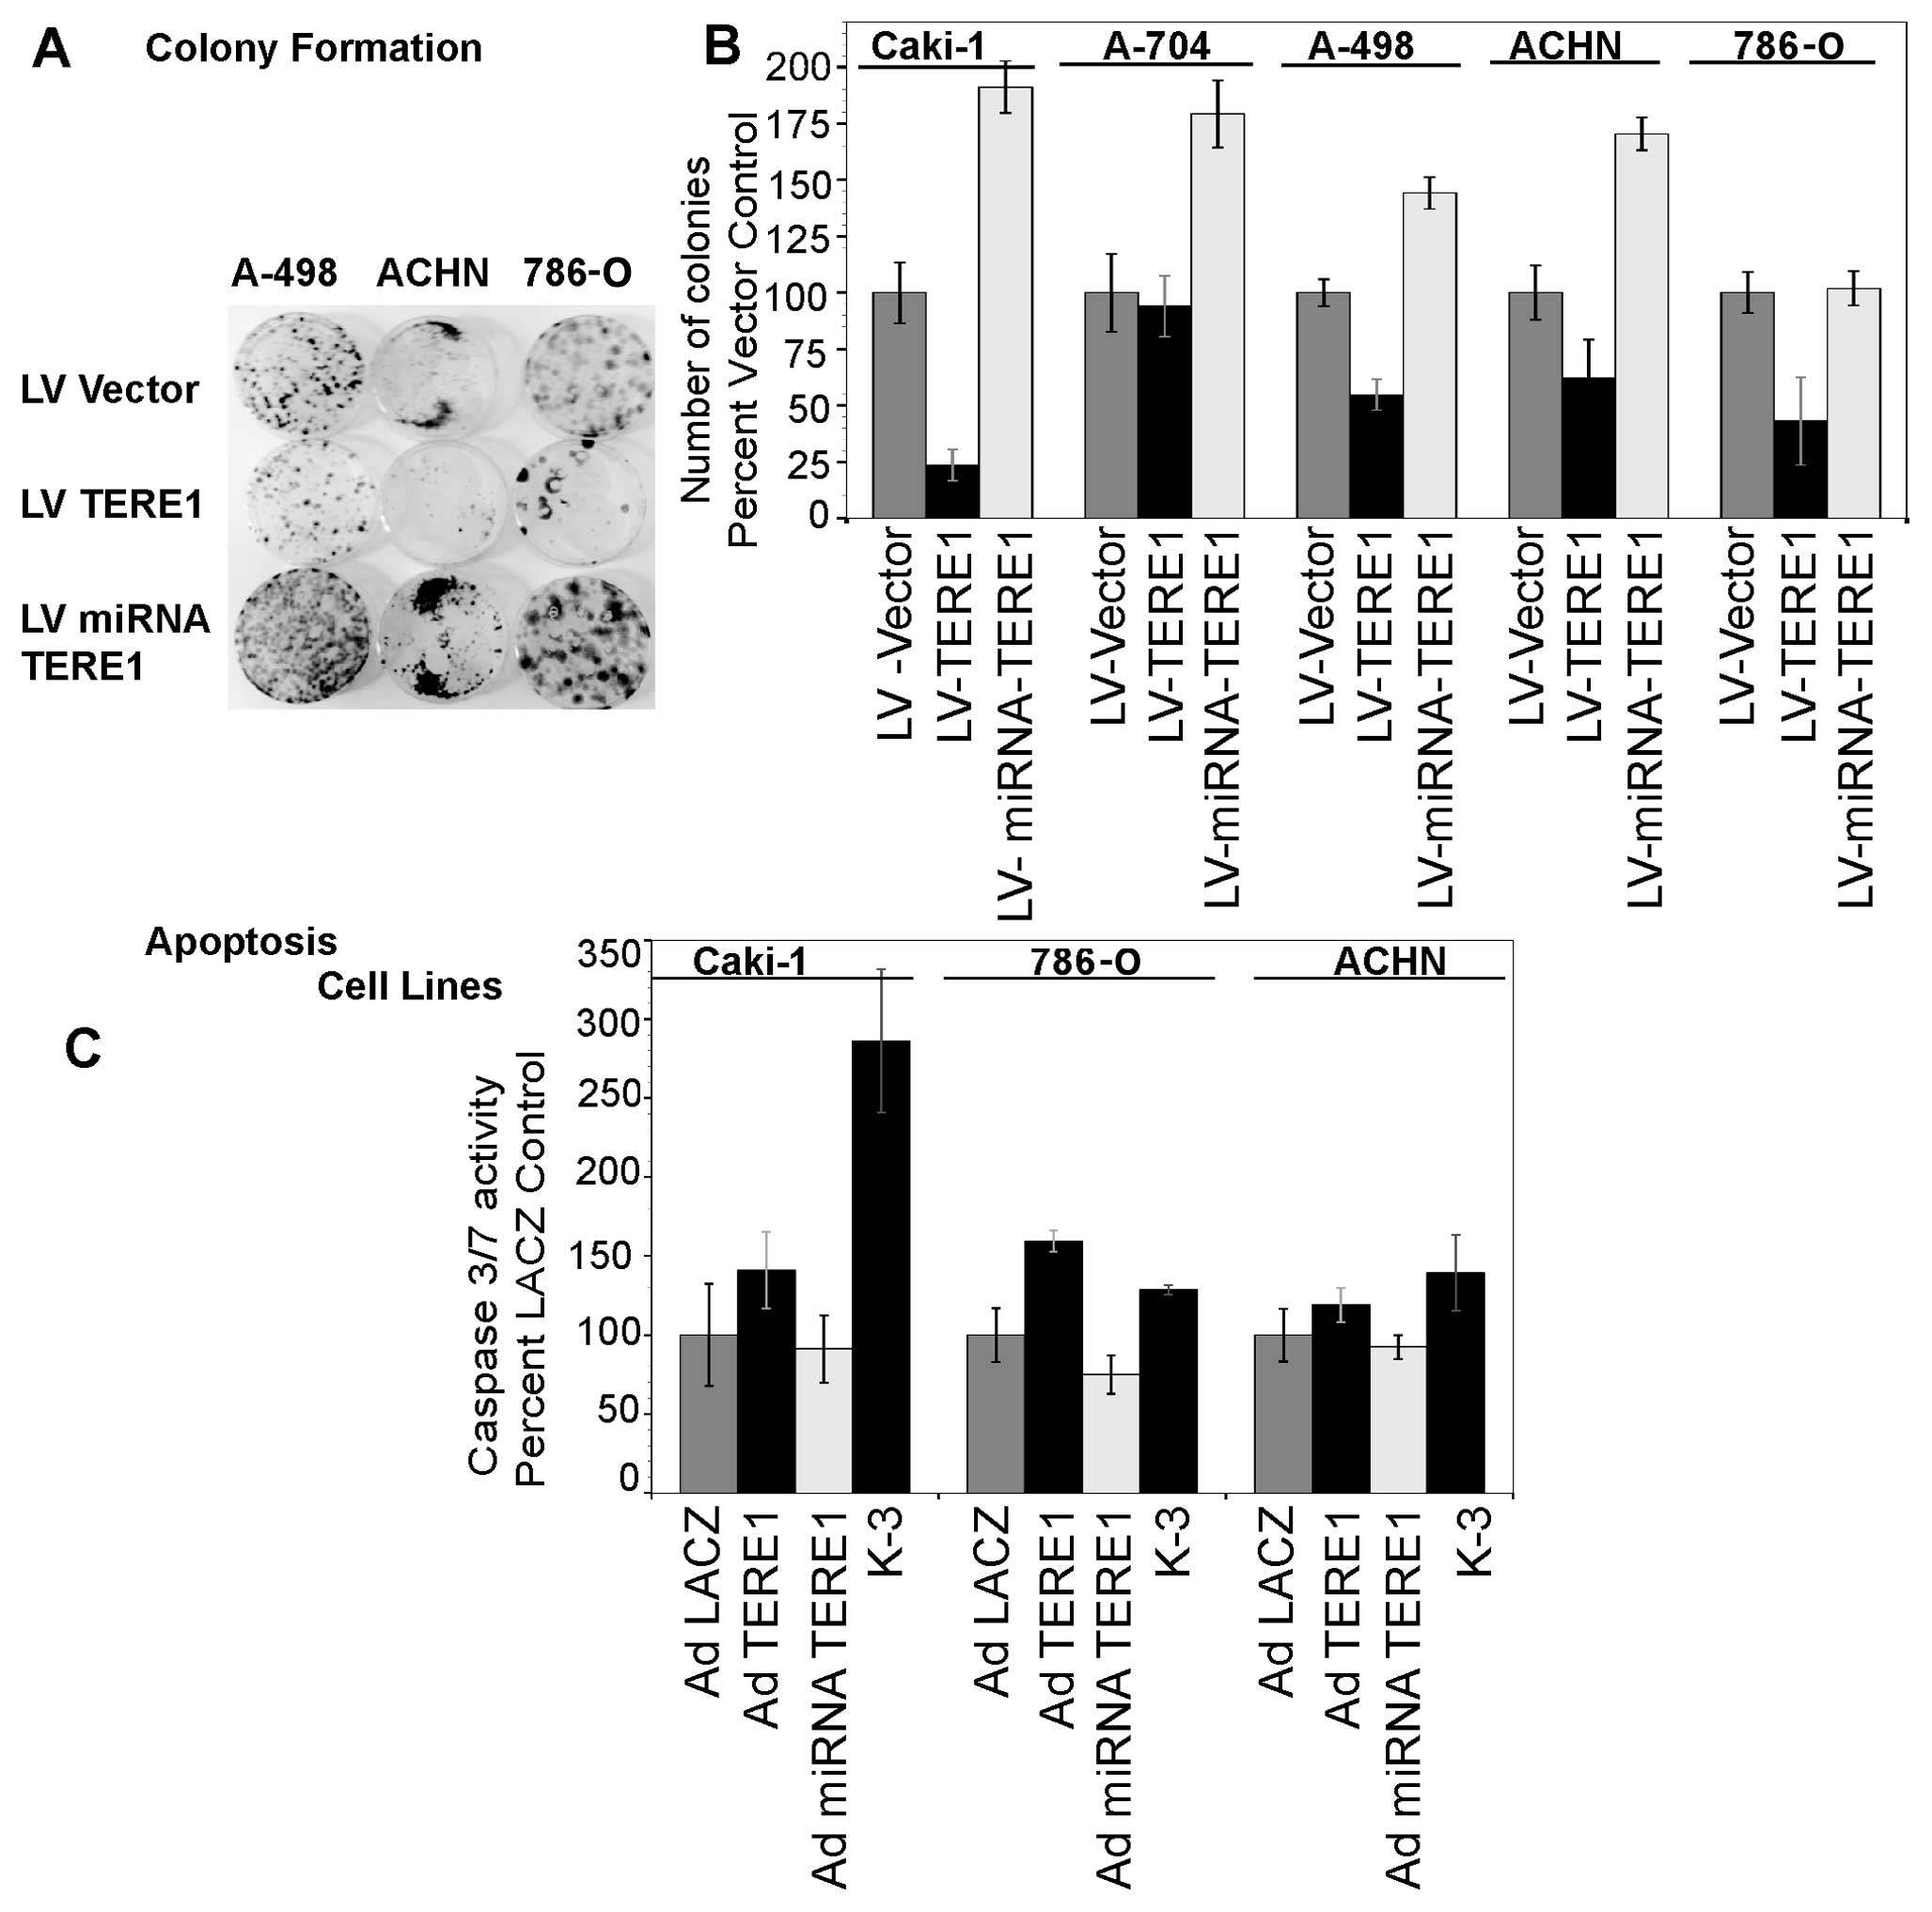 | Figure 4.A, TERE1 inhibits colony formation in
renal cancer cell lines. RCC cell lines: Caki-1, ACHN, 786-O, and
A498 were transduced with either lentiviral, LV: -Vector, -TERE1
cDNA for overexpression, or - miRNA-TERE1 for TERE1-knockdown.
Stable colonies were selected in blasticidin for 3 weeks and
stained with metheylene blue. B, TERE1 expression inhibits colony
formation. TERE1-knockdown increases colony formation. C, Ectopic
TERE1 increases caspase 3/7 activity in Caki-1, 786-O, and ACHN
cell lines 4 days after Ad-TERE1 transduction. |
Extracellular flux analysis
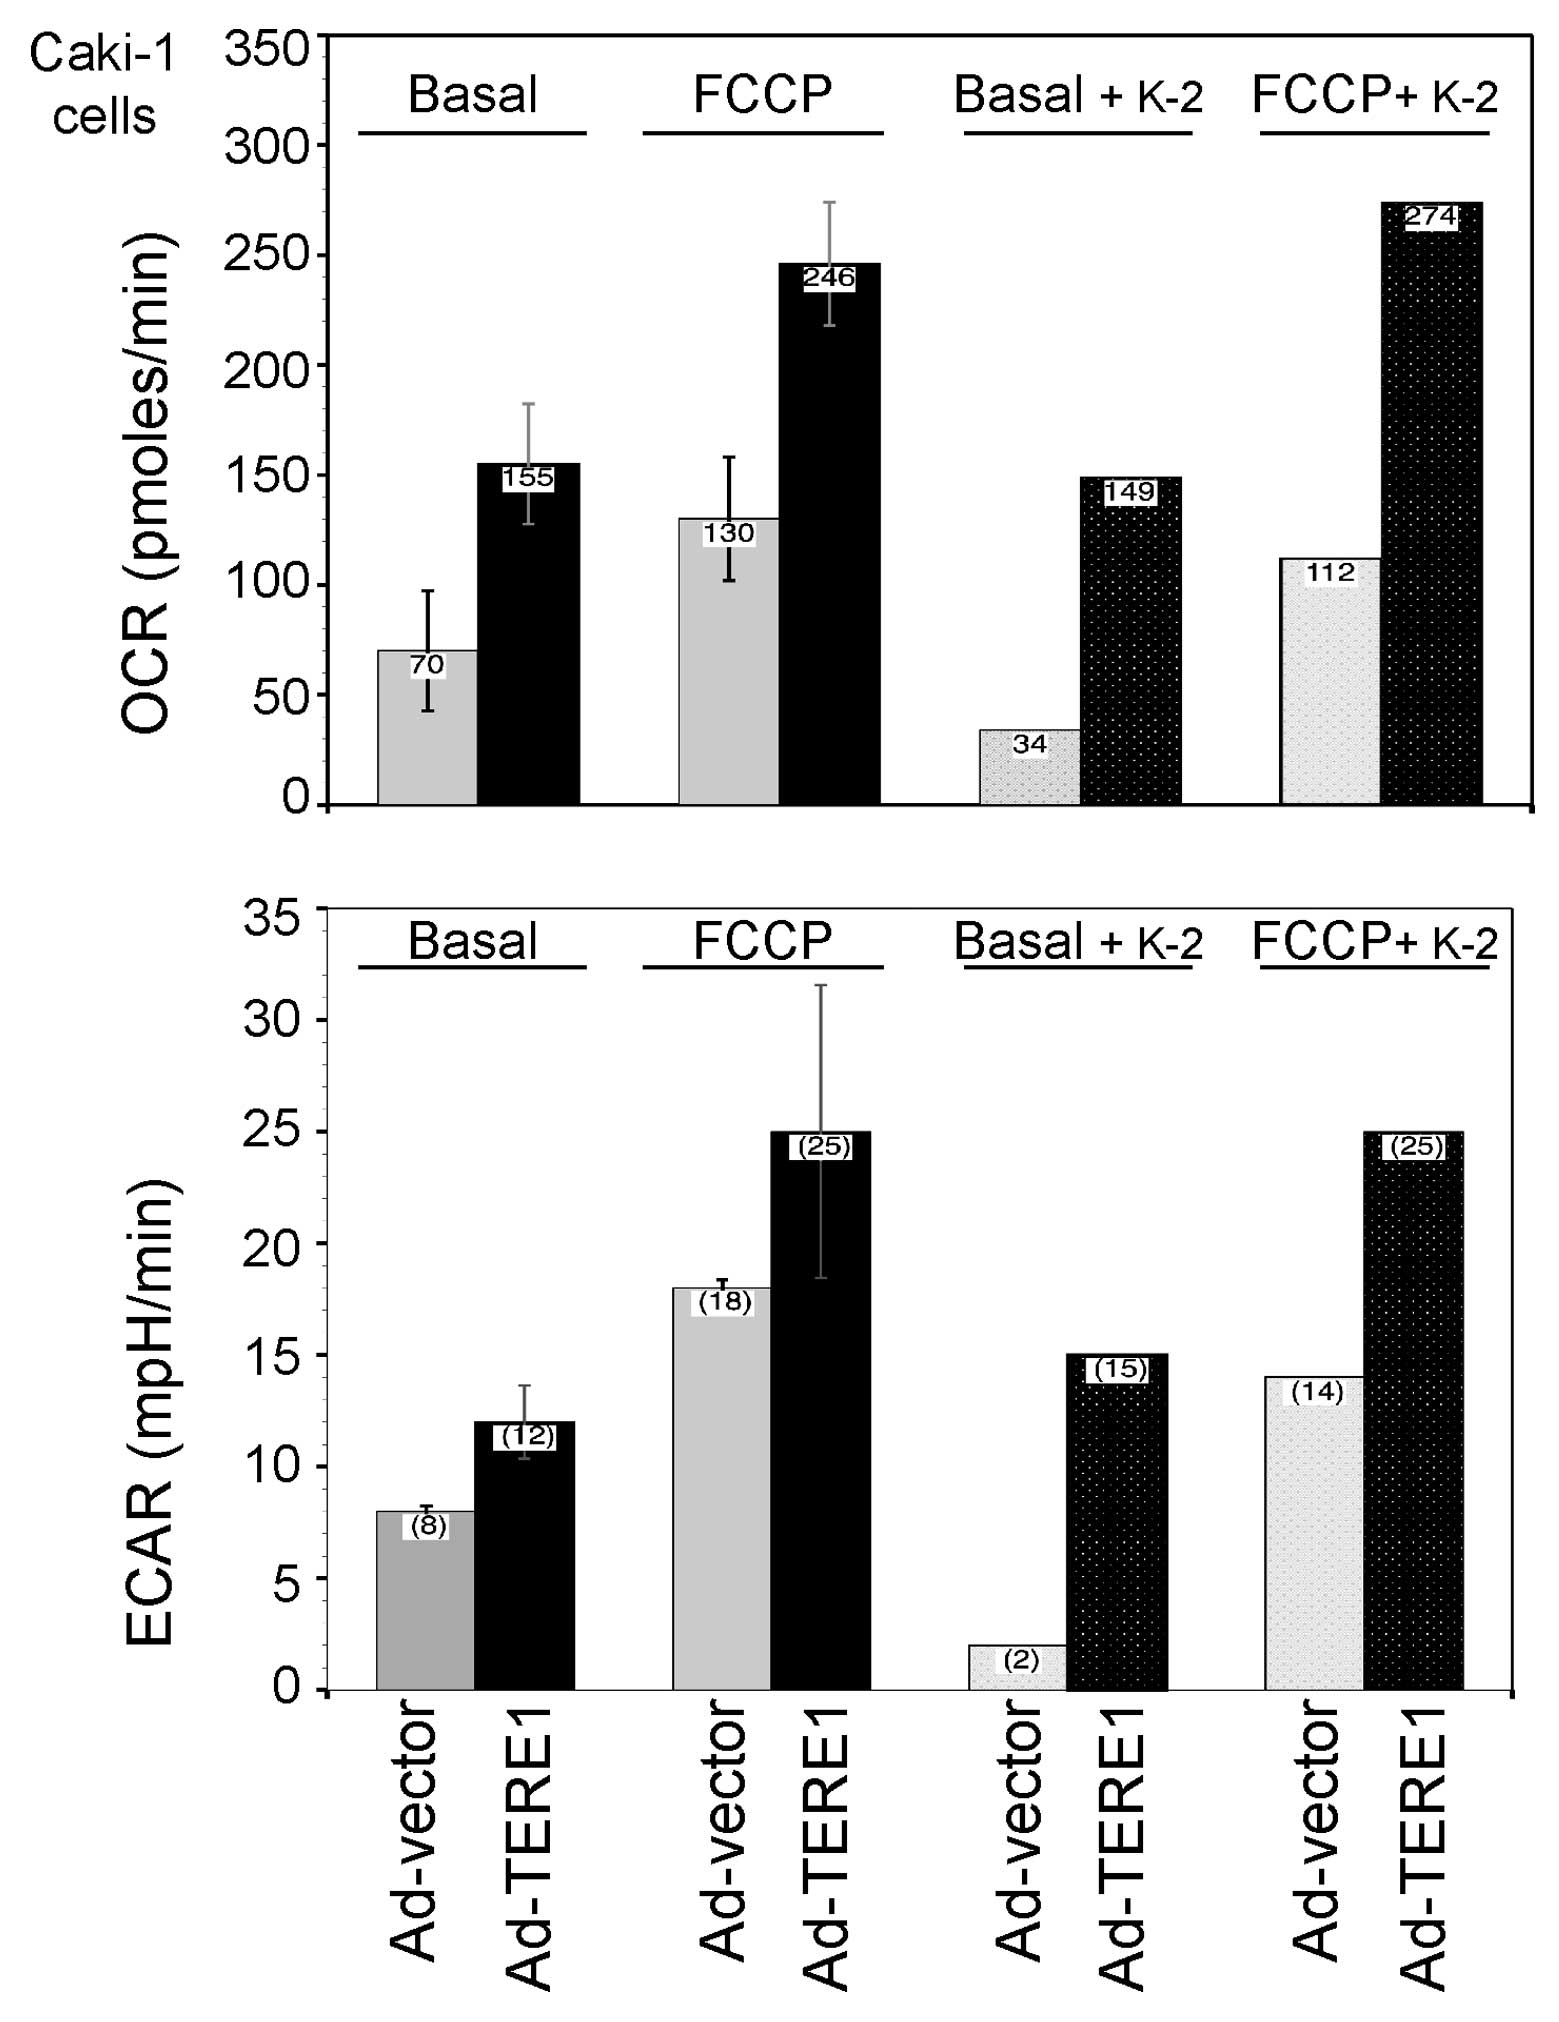
We extended our inquiry into the effects of TERE1 on
mitochondrial function via measurements of OCR and proton
production, expressed as the ECAR in Caki-1 RCC cells, using a
Seahorse Bioscience XF24 extracellular flux analyzer (ECF)
(Fig. 5). Comparing the basal OCR
responses of Ad-TERE1 and Ad-vector cells, TERE1 increased the OCR
over 2-fold (155/70=2.2) (left side of top plots in Fig. 5). Next, we injected the proton
iontophore FCCP to estimate the maximal potential respiration
sustainable by the cells. By disrupting the proton gradient and ATP
synthesis, FCCP leads to a rapid consumption of oxygen as cells
attempt to use glycolysis to make ATP. FCCP increased the OCR of
Ad-vector cells almost 2-fold (130/70=1.86) and Ad-TERE1 cells by
1.6-fold (246/155=1.58). Comparing the FCCP-treated Ad-TERE1 to the
Ad-vector cells, shows an almost 2-fold increase (246/130=1.9).
Vitamin K-2 reduced the basal OCR of Ad-vector cells (34/70=0.49),
but had a negligible effect with Ad-TERE1 cells (149/155=0.96).
Similar effects of K-2 were observed in presence of FCCP,
suggesting that K-2 treatment exerts some immediate anti-oxidant
effects in vector-transduced cells but not TERE1-transduced cells,
as if TERE1 expression saturates some component of the maximal
potential respiration.
Next, we compared the proton production, ECAR
responses of Ad-TERE1 and Ad-vector cells (left side of bottom
plots in Fig. 5). TERE1 increased
the basal ECAR 1.5-fold (12/8=1.5) and the FCCP-induced ECAR
1.4-fold (25/18=1.4), relative to Ad-vector cells. ECAR
measurements are generally indicative of lactic acid production
formed during glycolytic energy metabolism (44), thus the TERE1-induced 1.5-fold ECAR
increase suggests that only a portion of the 2-fold TERE1-induced
OCR is due to increase in metabolic flux due to glycolysis, the
remainder likely is due to other components of OCR. Measurements of
OCR represent several concurrent factors including changes in
oxidative phosphorylation, non-mitochondrial respiration including
oxidative stress, and mitochondrial proton leak, thus we examined
whether TERE1 would elevate the level of oxidative stress in RCC
cells.
TERE1-modulation of oxidative stress
Based on redox-cycling properties of K-2 (45), we evaluated whether TERE1
expression might affect the cellular levels of oxidative stress in
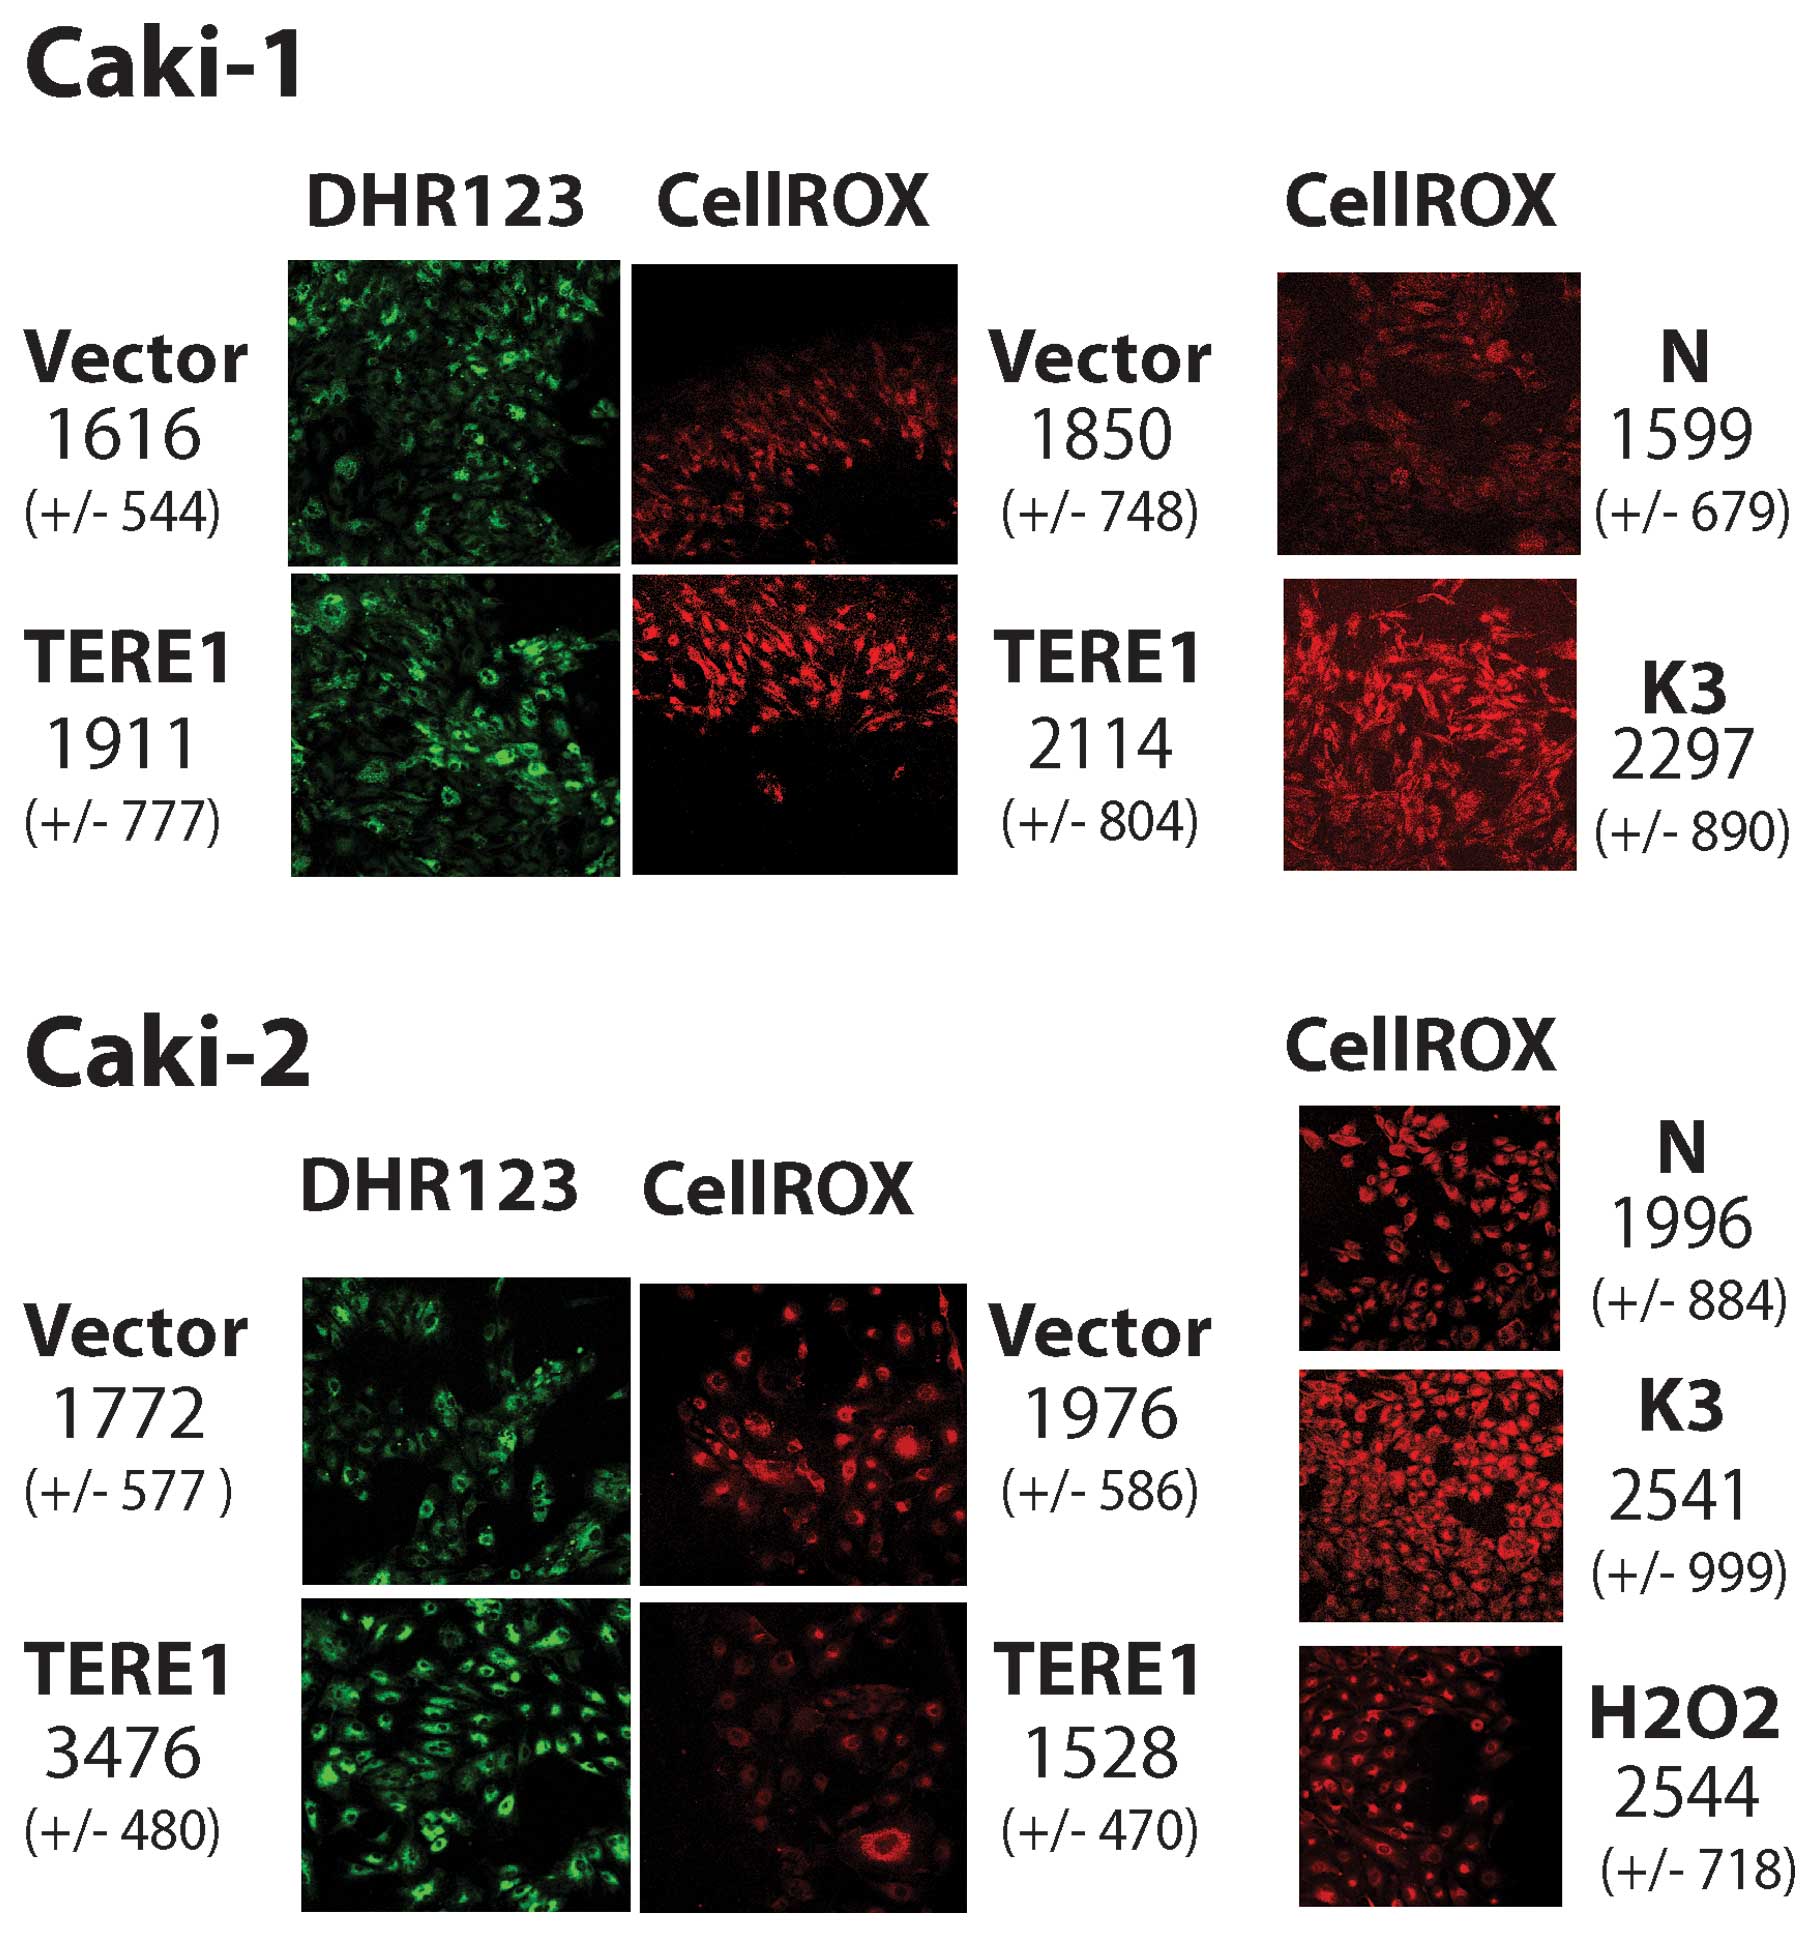
Caki-1 and Caki-2 cells. We conducted imaging of Caki-1 and Caki-2
cells that had been loaded with dihydrorhodamine 123 or CellROX
deep red fluorogenic probes after infection with Ad-LACZ, Ad-TERE1,
or pre-incubation with menadione (K-3). Fig. 6 (left side, top green), shows that
Ad-TERE1 (1911 FUs) infected Caki-1 cells show an increase of over
18% in dihydrorhoda-mine 123 oxidation compared to the control
vector, Ad-LACZ infected cells [1616 fluorescence units (FUs)]. In
Caki-2 cells dihydrorhodamine 123 oxidation was increased almost
2-fold (3476/1772). Next, we evaluated the effects of TERE1 on
CellROX deep red oxidation (Fig.
6, right side, red). Using pre-treatments of vitamin K-3 at 30
μM or H2O2 at 100 μM for 1 h,
as positive controls, we observed significant increases, 44% and
27%, in Caki-1 and Caki-2 cells, respectively. TERE1 expression
caused a modest increase in CellROX oxidation of 14% in Caki-1, but
was decreased by 23% in Caki-2 cells. Apparently there are
differences in the response to ectopic TERE1 between the two cell
lines. Oxidation of both probes increased in Ad-TERE1 infected
Caki-1 cells. Caki-2 cells showed increase only with the
dihydrorhodamine 123 probe but not CellROX deep red. Since
dihydrorhodamine 123 oxidizes in response to both ROS and RNS, and
CellROX deep red oxidation is specific for ROS but not RNS, this
suggested the possibility that Caki-2 cells may produce NO in
response to TERE1 expression.
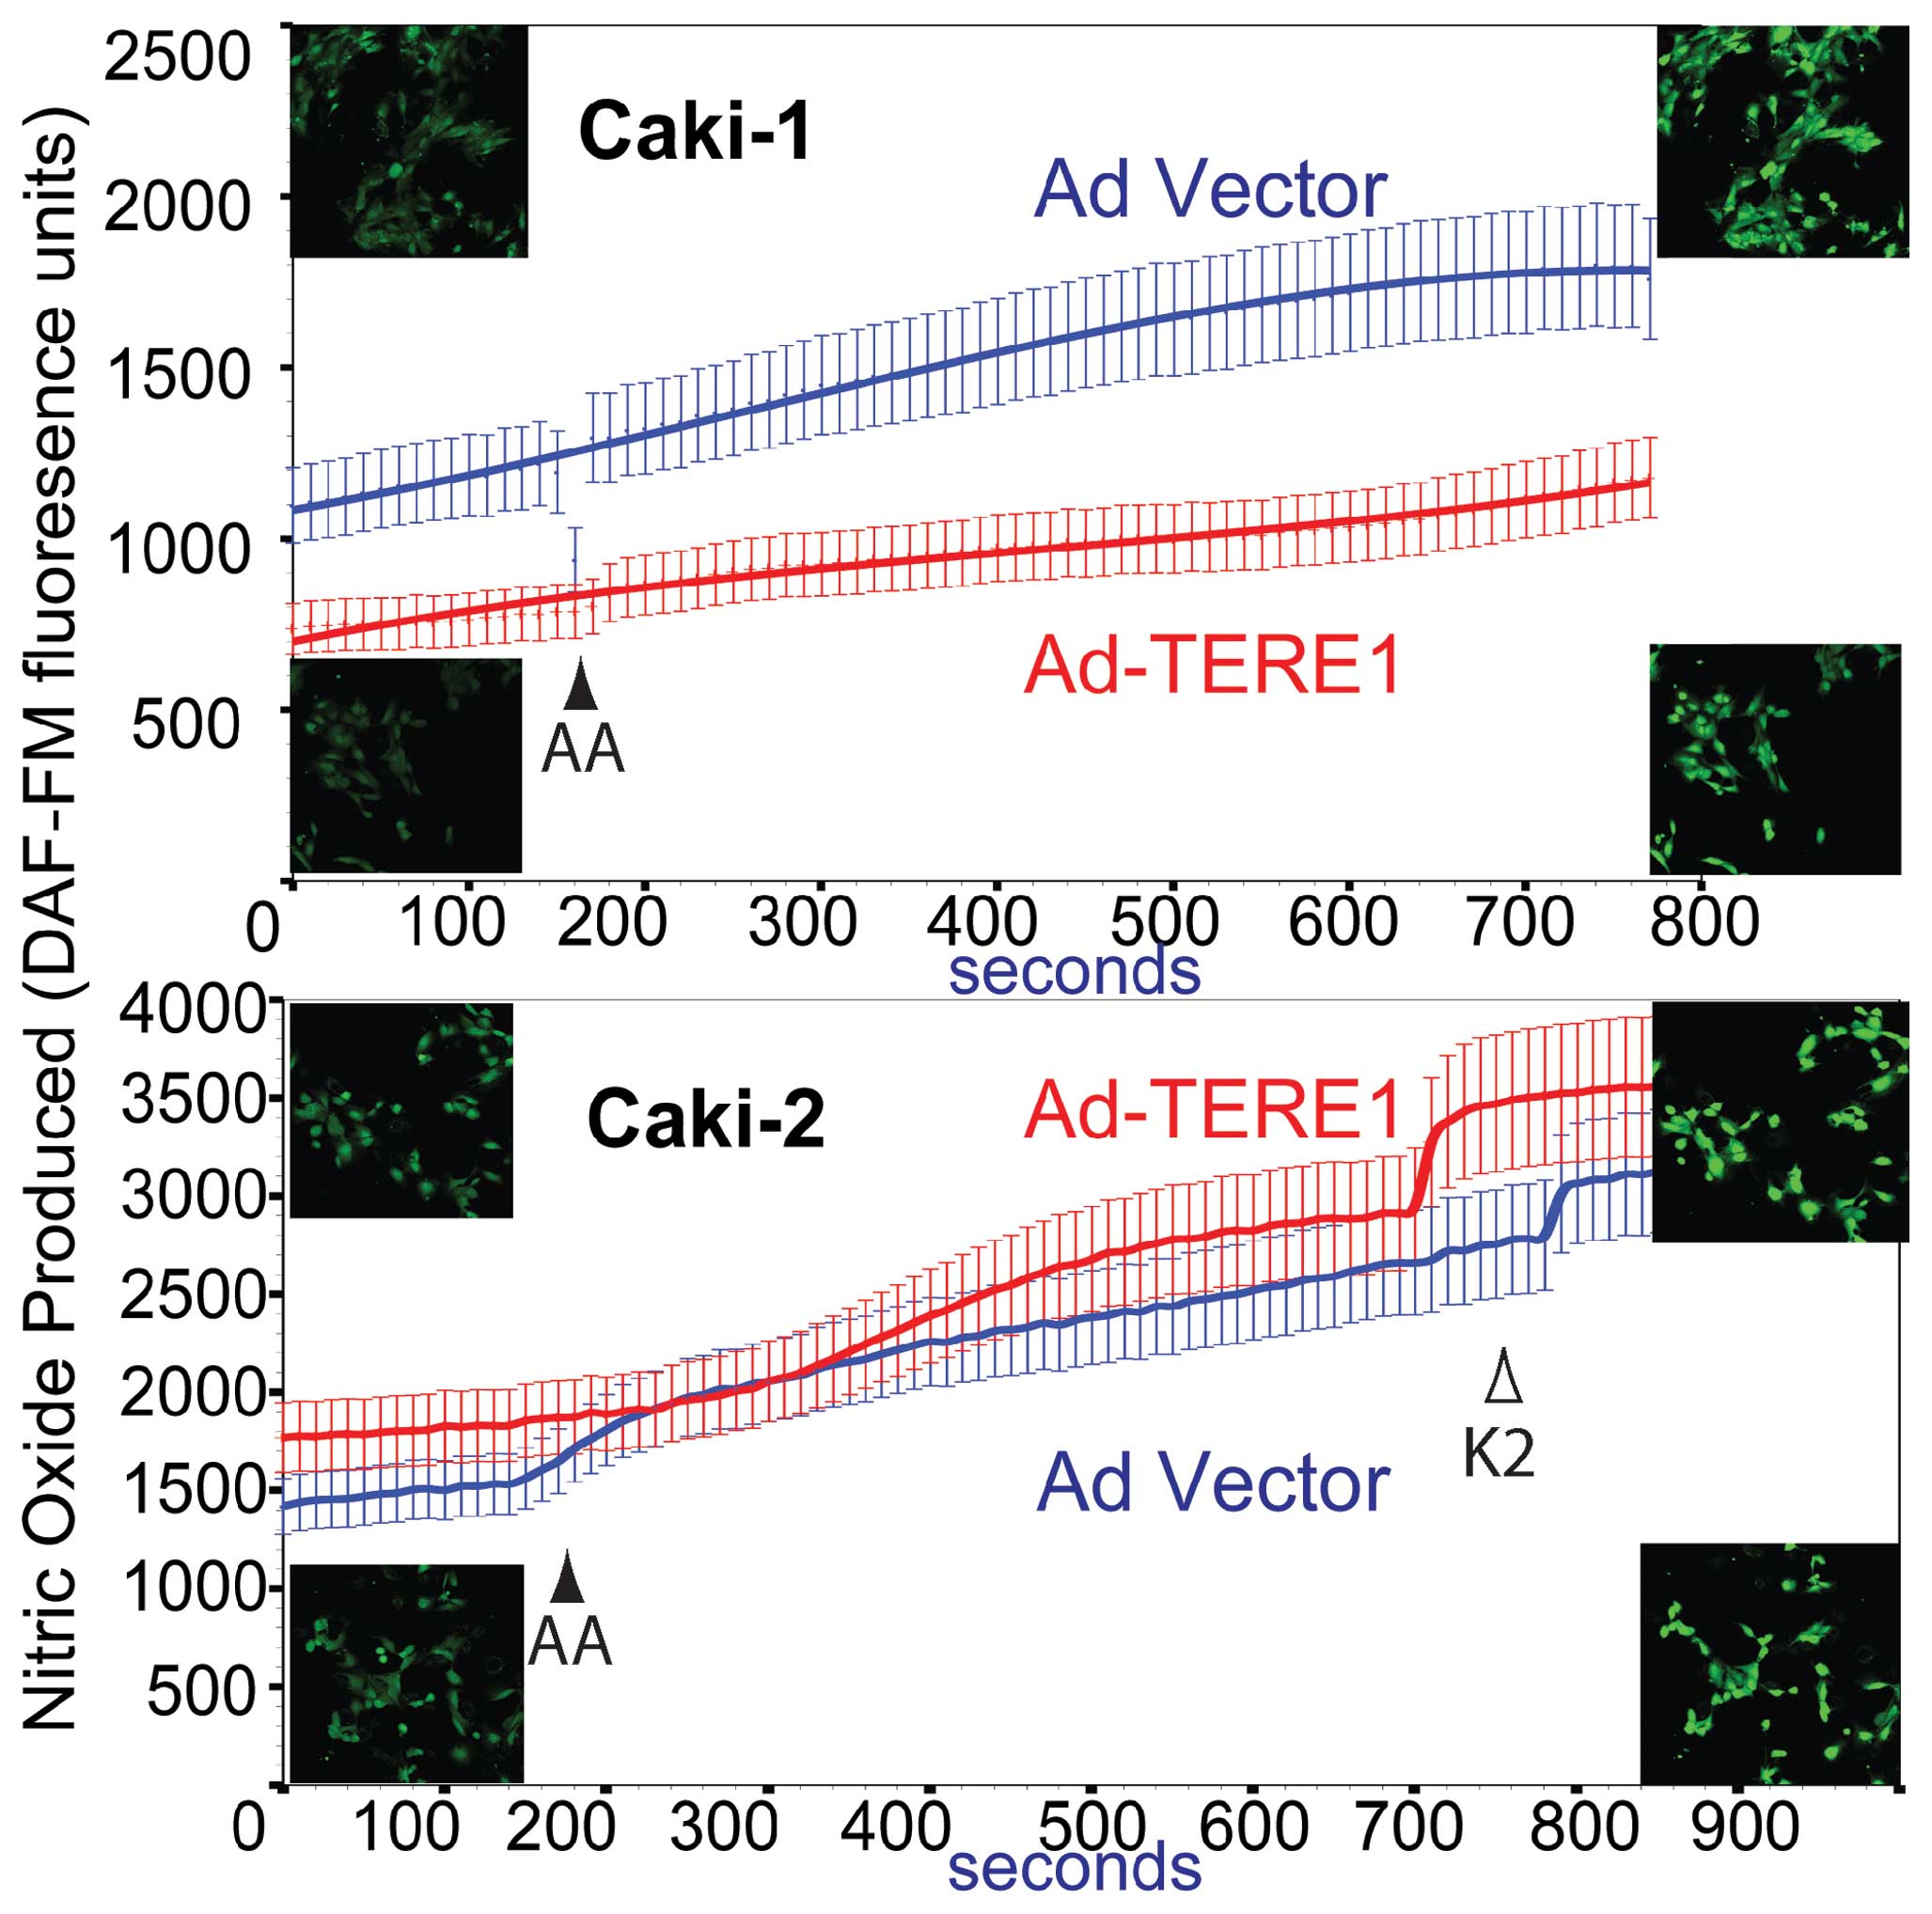
Nitric oxide production
We examined whether ectopic TERE1 expression would
affect cellular levels of nitric oxide in Caki-1 and Caki-2 RCC
cells based on reports that vitamin K-2 could induce iNOS and
increase NO production in endothelial cells (46), and NO production in zebrafish
models for UBIAD1 (41). We
conducted live cell imaging of Caki-1 and Caki-2 cells that had
been loaded with the DAF-FM-DA fluorogenic probe after infection
with Ad-LACZ or Ad-TERE1. We also tested the effects of addition of
menaquinone (K-2). DAF FM reacts with NO and RNS to form a
fluorescent benzotriazole. The graph in Fig. 7 compares NO production in Caki-1
(top panel) and Caki-2 (bottom panel) cells. TERE1 reduced the
basal cellular NO level in Caki-1 cells, but increased NO in Caki-2
cells. Supplementing with vitamin K-2 increased NO production in
Ad-vector and Ad-TERE1 in both cell lines (not shown for Caki-1).
Further studies will be needed to determine the basis for the
difference in basal NO production between Caki-1 and Caki-2 cells,
e.g., whether there may be differences in INOS expression, or NO
secretion. Overall, the effects of TERE1 on NO in Caki-2 cells are
consistent with a TERE1-mediated K-2 enhancement of mitochondrial
respiratory chain to produce NO and other RNS (24,39,47).
Next, we turned our focus from mitochondria, to a mechanism of
retrograde signaling to the nucleus that is predicted by
TERE1-mediated synthesis of K-2 and the activation of SXR nuclear
receptor target genes that play a role in lipid metabolism, and
cholesterol efflux (32,33).
TERE1, TBL2 and vitamin K-induced changes
in cellular cholesterol
Based on the reports of an elevated cholesterol
phenotype in RCC cells (11), and
its potential to contribute to apoptotic escape during tumor
progression (12–16), we evaluated the effect of ectopic
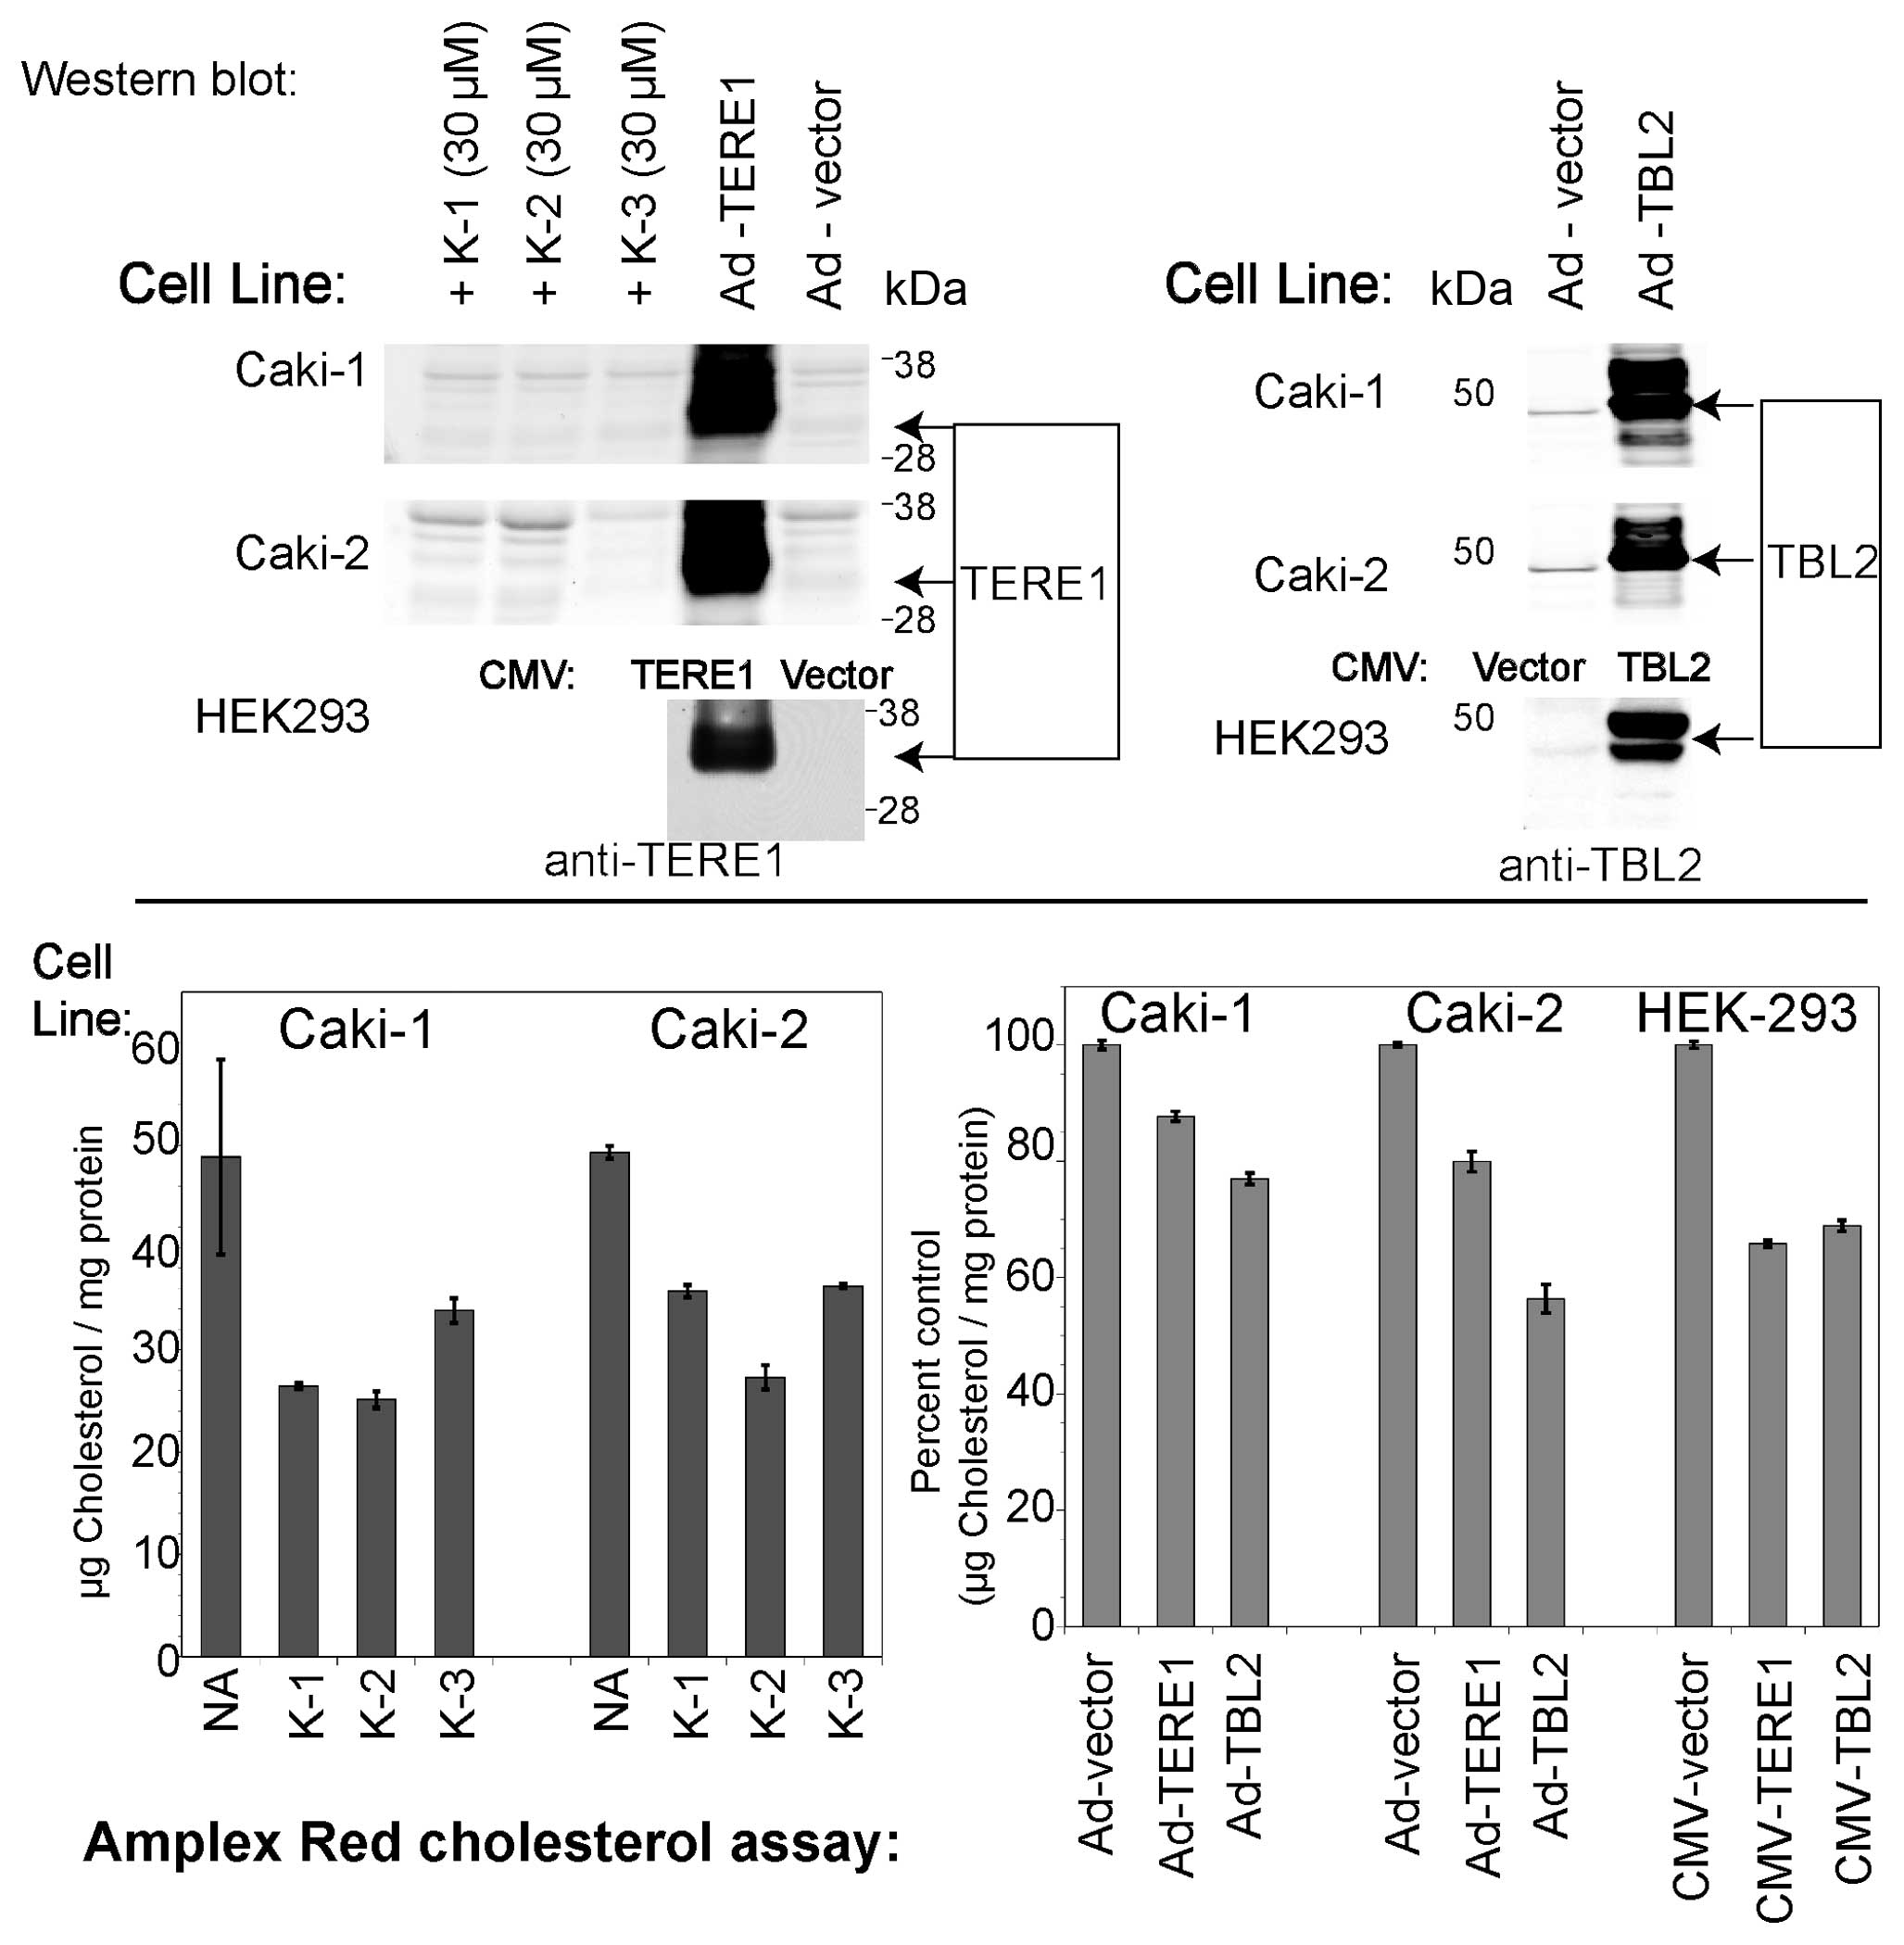
TERE1 and TBL2 expression on levels of cholesterol in the Caki-1,
Caki-2, and HEK293 embryonic kidney cell lines. Furthermore, given
the role of TERE1 in vitamin K-2 synthesis, we tested whether
pre-incubation with vitamin K derivatives would also reduce
cellular cholesterol levels. We ectopically expressed TERE1 and
TBL2 proteins in Caki-1 and Caki-2 cells via infection with
adenoviral vectors, and via plasmid transfection with HEK293 cells.
We confirmed expression of the ∼37 kDa TERE1 and the ∼49 kDa TBL2
protein via immunoblots (Fig. 8).
Samples with elevated expression of TERE1 or TBL2 proteins had
significantly reduced intracellular cholesterol levels compared to
those with the control vector. We also found that that a 72-h
treatment of Caki-1 and Caki-2 cells with vitamin K-1 (30
μM), K-2 (30 μM), or K-3 (10 μM) can reduce
cellular cholesterol by at least 50%. This is consistent with a
mechanism of K-2 mediated SXR activation of cholesterol efflux
(48,49).
TERE1, TBL2-induced changes in SXR target
gene expression
Next we explored whether ectopic TERE1 or TBL2 would
induce changes in expression of SXR target genes in Caki-1 and
Caki-2 cells. SXR has roles in regulation of endobiotic
homeostasis, and regulation of transporters involved in xeno biotic
clearance (32,49). We selected established target genes
of SXR, of LXR (which can be cross-regulated) and several genes
involved in cholesterol synthesis and catabolism (49–56).
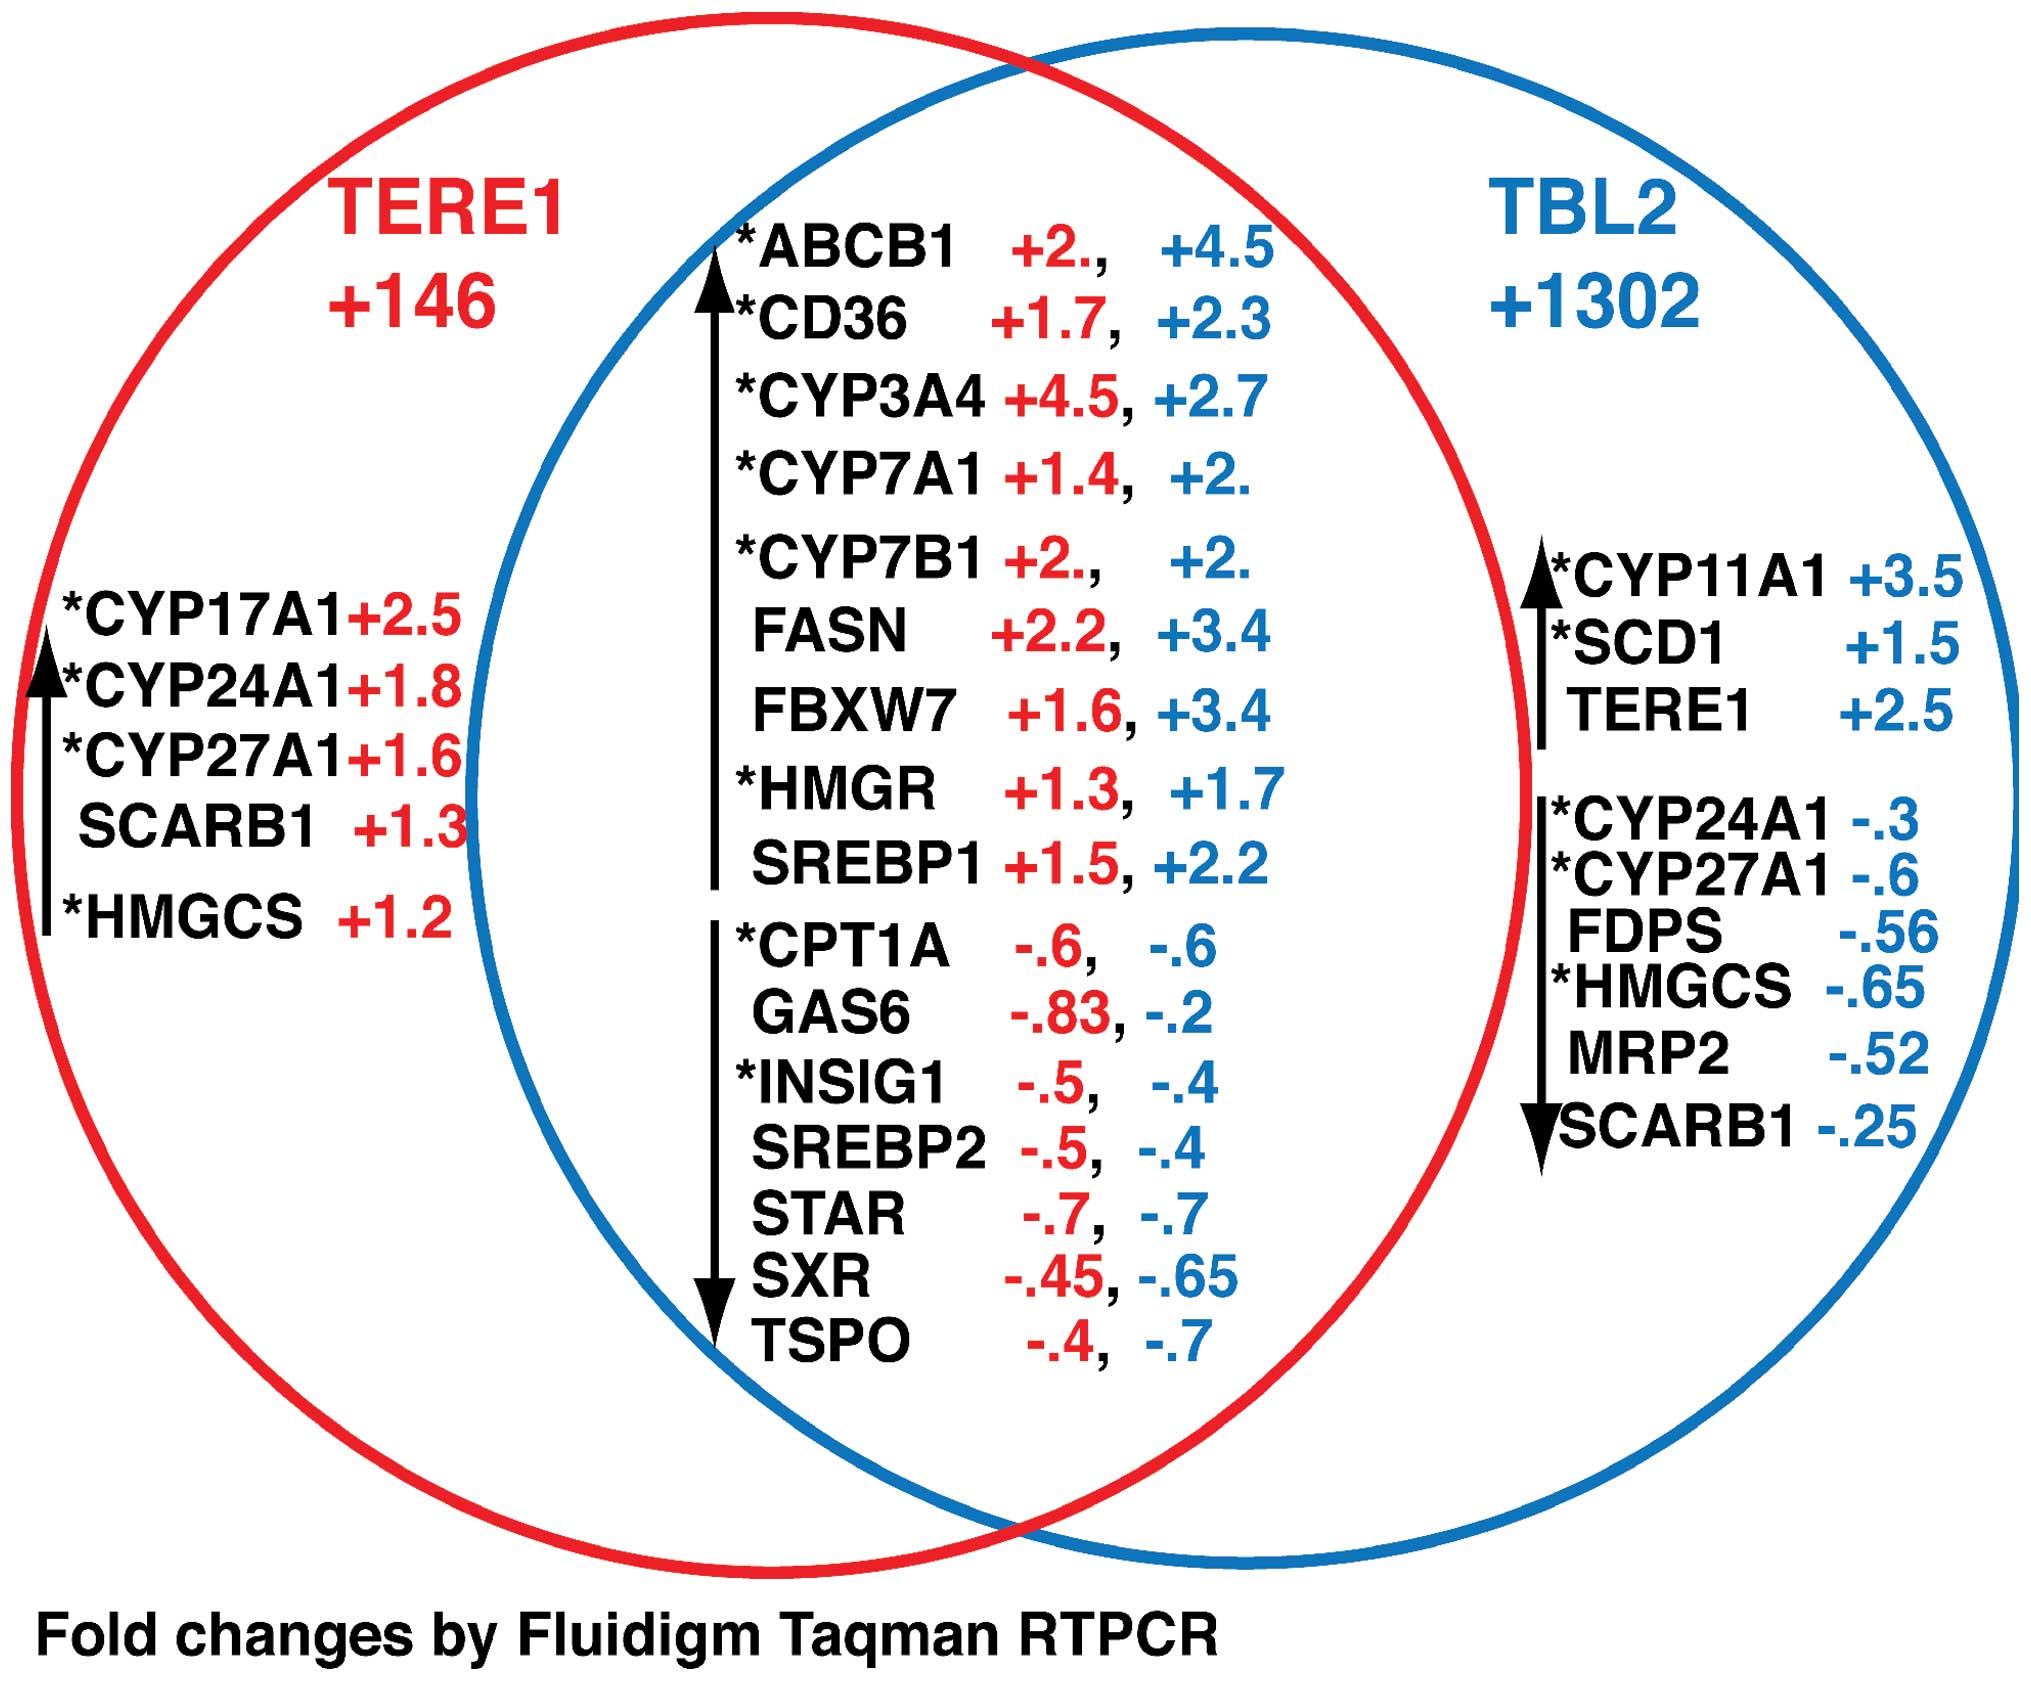
The Venn diagram in Fig. 9
summarizes our findings and depicts the fold-change in gene
expression after TERE1 overexpression (red), or TBL2 overexpression
(blue) relative to AD-LACZ and normalized as described in Materials
and methods. We have grouped the changes common to both induction
treatments, and those found only with each inducer. The main result
is that, as predicted, a number of changes were observed in
established target genes of SXR (indicated by the asterisk). These
include genes involved in transport, synthesis and catabolism of
fatty acids: *FASN, *CPT1A,
*SCARB1, *SCD1; or cholesterol:
*CD36, SREBP1, HMGCS, *HMGR, FBXW7; or sterol
metabolism: *CYP17A1, *CYP24A1,
*CYP7B1, CYP11A1. We also observed similar changes in
some SXR targets after TERE1 expression (+361) in Caki-2 cells.
These include *ABCB1 (+23.4), *CD36 (+1.9),
*CPT1A (+1.4), *CYP11A1 (+1.6),
*CYP24A1 (+2), *CYP3A4 (+2),
*CYP7A1 (+1.8), FBXW7 (+7.1), FDPS (+2),
*INSIG1 (+21.7), *SCARB1 (+2.0),
*SCD1 (+1.7), SREBP1 (+2.4), SREBP2 (+3.9), STAR (+9.9),
and TSPO (+53). Notably several of these targets in Caki-2 play a
role in cholesterol transport to mitochondria (CYP11A1, STAR, TSPO)
and may be involved in cholesterol mobilization for oxysterol
formation (57). It is interesting
that TERE1 increases expression of CYP24A1 whose expression is
typically lost in RCC and is required for transformation of vitamin
D3. Overall, these data demonstrate that TERE1 expression can lead
to regulation of SXR target genes involved in lipid metabolism and
are consistent with the hypothesis that this is due to activation
of SXR by TERE1-mediated synthesis of K-2 (23,48,49).
Discussion
TERE1 expression in RCC and suppression
of growth in vitro
Our objectives with this study were to explore a
possible role for TERE1 in RCC. Given our previous demonstration of
TERE1-mediated cholesterol modulation in bladder cancer cells
(24,27) our interest was driven by the
emerging understanding of RCC as a disease of elevated cholesterol
and an altered metabolic phenotype (4,8,11).
We first examined TERE1 expression in a TMA panel of RCC specimens
and found that TERE1 staining was absent or low in almost 60% of
RCC specimens; hence, may represent a significant phenotype in
renal cancer. Next we evaluated growth upon ectopic TERE1
expression and found cell growth inhibited by up to 80% in Caki-1,
Caki-2, and A704 renal carcinoma cell lines after 10 days.
Furthermore, TERE1 expression caused significant reduction in
stable colony formation in several renal cancer cell lines. It is
significant that miRNA-mediated-TERE1 knockdown generally increased
the number of colonies, further supporting the idea that a reduced
TERE1 level may contribute to RCC progression. We then proceeded to
evaluate effects of TERE1 related to mitochondrial function:
apoptosis, O2 consumption, and ROS/RNS production, and
also examine predicted effects on SXR target gene expression and
cholesterol levels based on K-2 functioning as a ligand for SXR
nuclear receptor signaling. The schematic in Fig. 10 outlines some of the mechanisms
described in the literature by which TERE1 and K-2 may affect RCC
growth or tumor progression for this discussion.
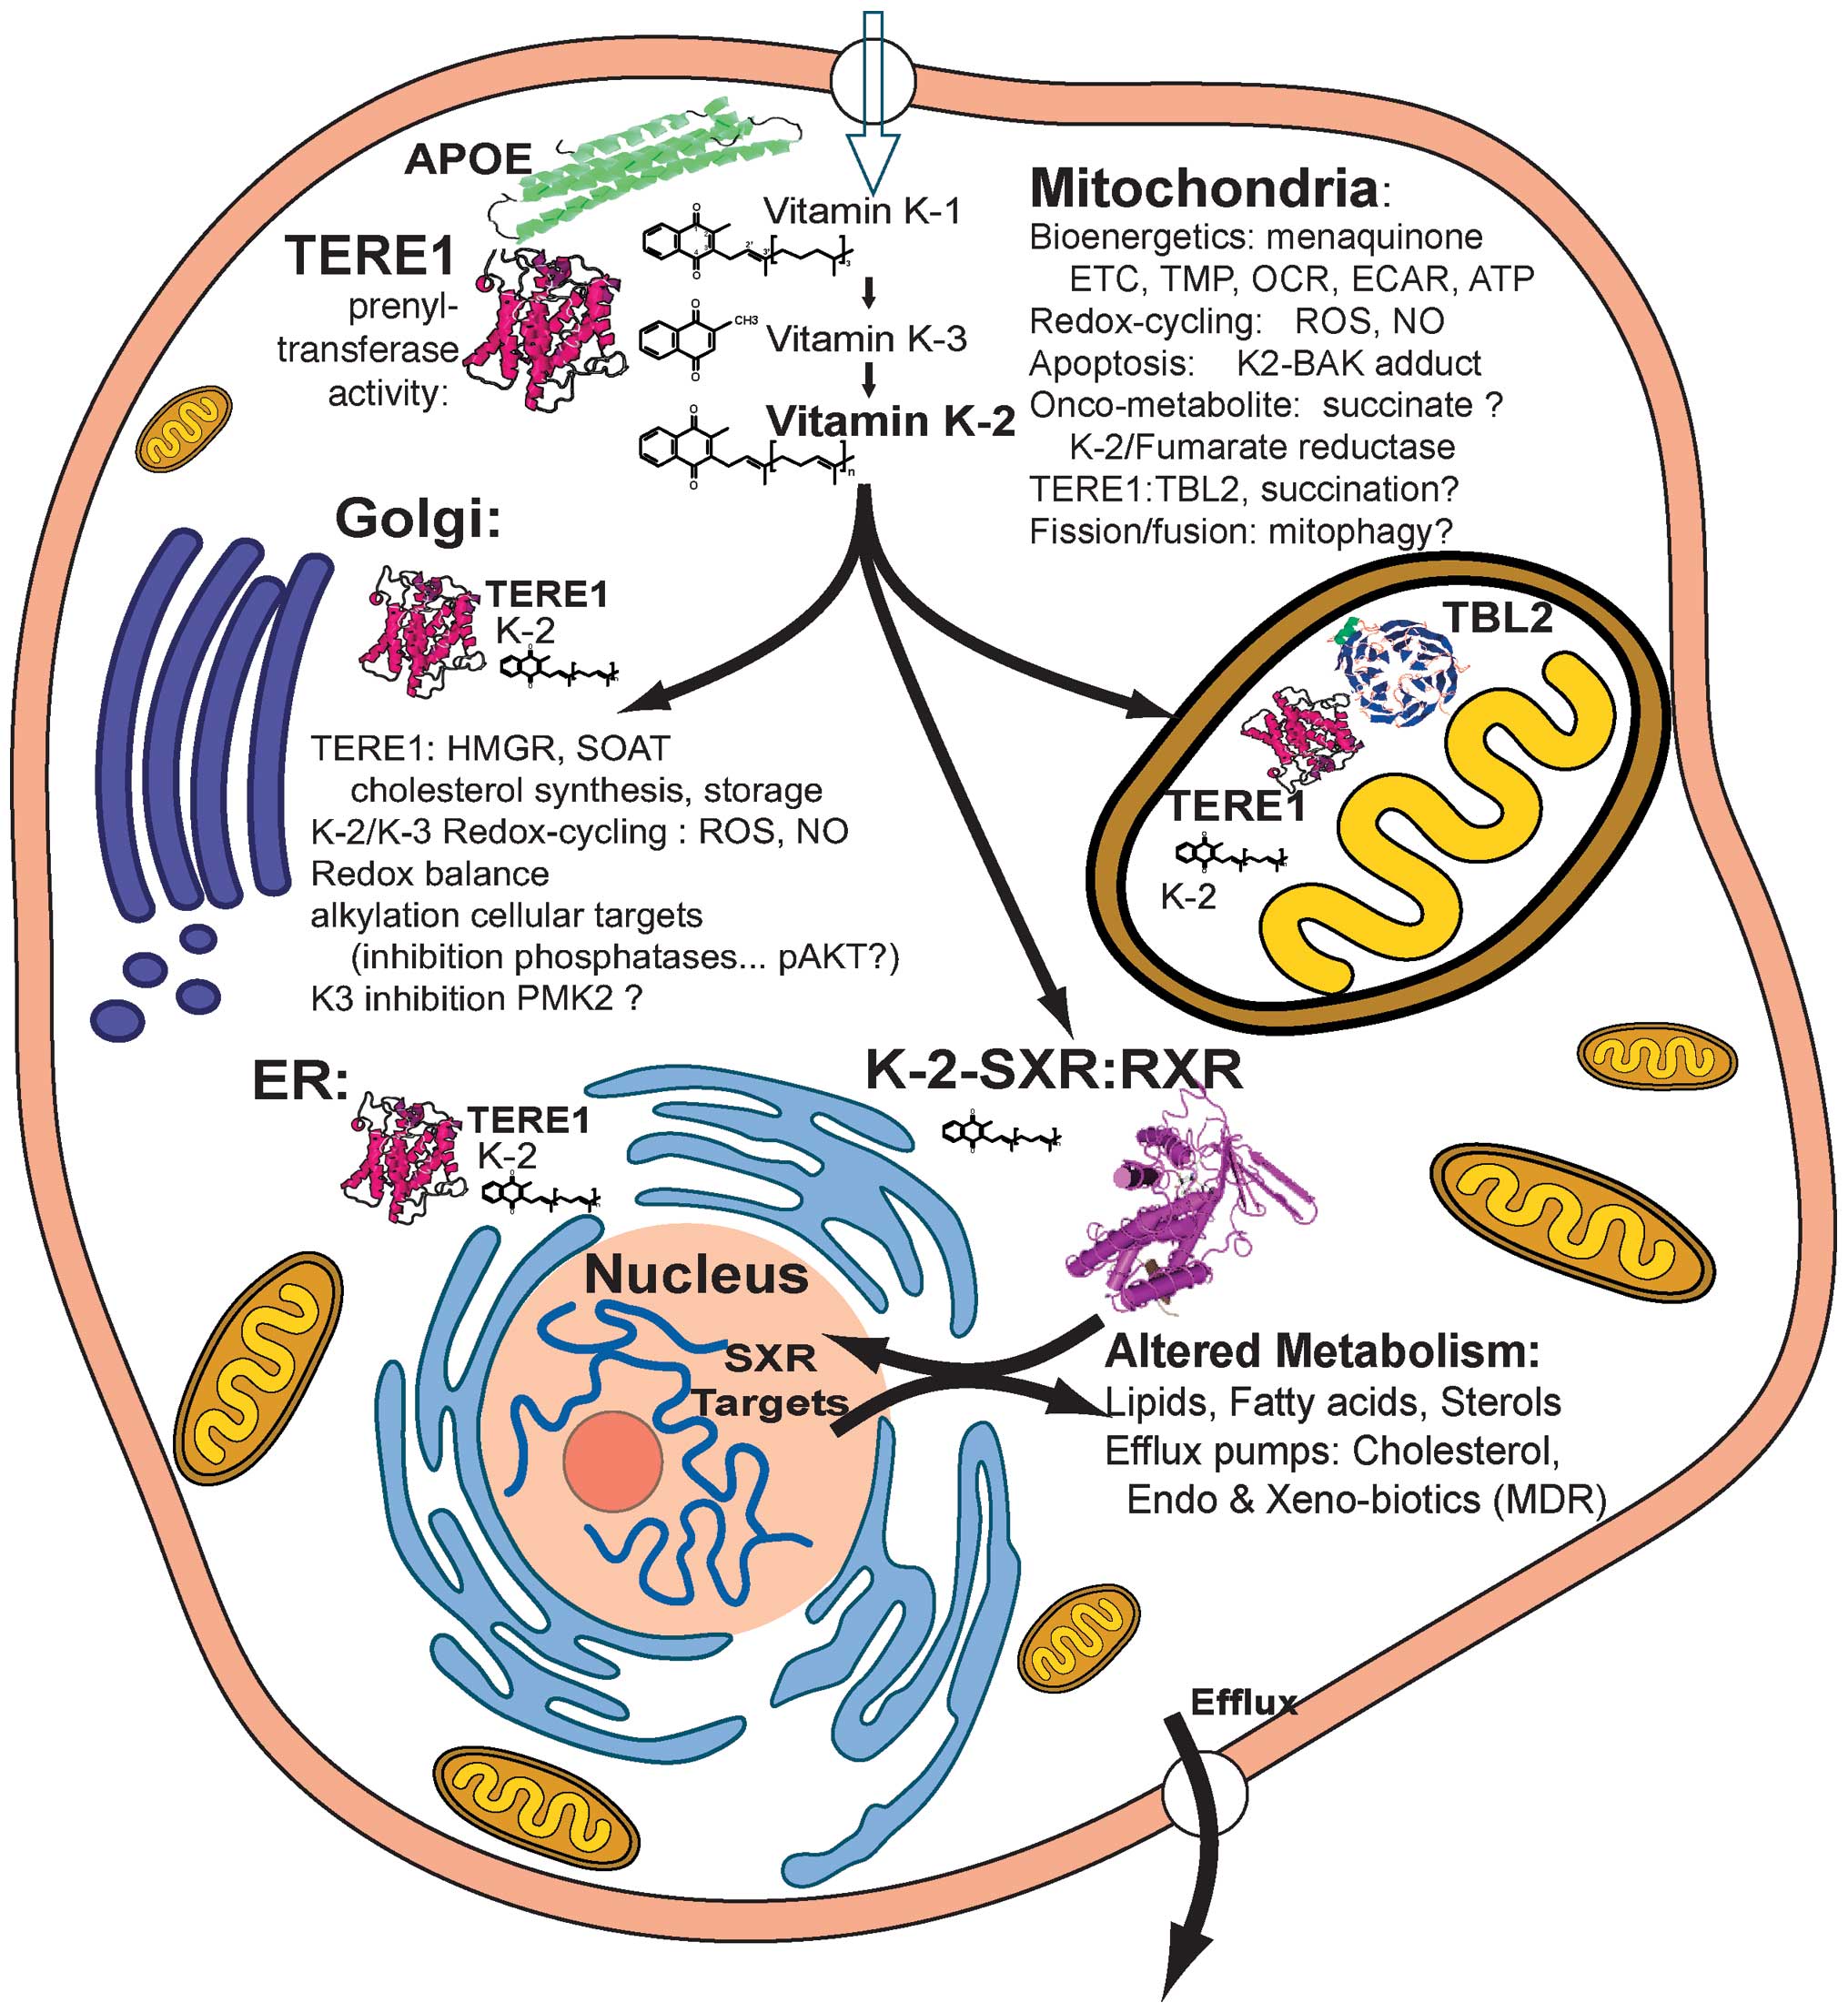 | Figure 10.Overview of TERE1, vitamin
K-2/K-3-mediated effects on cellular metabolism. APOE is a carrier
of vitamin K-1, cholesterol, and triglycerides that interacts with
TERE1 and is involved in K-1 delivery as well as lipid recycling.
TERE1 converts K-1 to K-2 at multiple locations: golgi, ER, and
mitochondria. In ER and golgi TERE1 may interact with HMGR and
SOAT1 thus affect cholesterol synthesis and storage. Based on
redox-cyling K-2 and K-3 create reactive oxygen species, ROS, and
nitic oxide, NO. Depending on the cellular anti-oxidant milieu,
TERE1 may serve as a pro- or anti-oxidant. In mitochondria K-2
plays a role in the electron transport chain, ETC, and can elevate
the transmembrane potential, TMP, increase O2
consumption and H+ production rates, OCR and ECAR, and ATP. TERE1
can increase apoptosis, which may involve K-2 adduction with BAK.
K-2 may drive fumarate reductase and lead to succinate elevation.
Elevated succinate is an onco-metabolite that leads to succination
of proteins such as the TERE1 interacting protein, TBL2. K-2 is a
potent activator of the SXR nuclear receptor, which traverses to
the nucleus with RXR and is a master regulator of lipid and fatty
acid homeostasis, energy metabolism, and phase I and II enzymes and
transporters involved in drug metabolism/clearance, and efflux of
cholesterol. Overall, these findings highlight the potential
relevance of TERE1 expression in tumor cell bioenergetics,
oxidative and nitrosative stress, and suggest a possible role for
TERE1 in the adaptation to hypoxic microenvironments and
invasiveness. |
Ectopic TERE1 increases apoptosis in RCC
cell lines
As an indicator of apoptosis, we examined caspase
3/7 activity after Ad-TERE1 transduction and found increases in RCC
cell lines: Caki-1 (by 40%), 786-O (by 60%), and ACHN (by 20%).
This is consistent with reports of growth inhibition, autoschizis,
necrosis, or a delayed apoptosis in different tumor cell lines in
response to vitamin K-2 and K-3 (34,58–60).
Recently K-2 was found to form covalent adducts with the Bcl-2
homologous antagonist killer protein, BAK, and induce BAK-mediated
apoptosis (61). This facilitation
of BAK activity by K-2 adduction is in contrast to thiol arylation
adducts of K-3 that inactivate phosphatases. K-2 adduction suggests
a possible mechanism for the TERE1-mediated apoptosis we observed
in RCC cell lines, and raises the possibility of K-2 adduct
formation with other targets, especially, TERE1-interacting
proteins. Overall, TERE1-mediated K-2 synthesis has multiple
possible mechanisms capable of affecting cell growth, which may
account for some of the differences observed between the cell
lines. Although ectopic expression likely exaggerates
TERE1-mediated effects, the apparent liability TERE1 poses to RCC
cell growth, may account for its low level or absence in over half
of the RCC tumor specimens and cell lines.É
TERE1 effects on mitochondrial oxygen and
hydrogen flux
Based on the paradigm of altered mitochondrial
metabolism in RCC, we analyzed two parameters of mitochondrial
activity in Caki-1 and Caki-2 RCC cells: oxygen consumption, OCR,
and hydrogen production, ECAR. We found that TERE1 significantly
increased the basal and maximal rates of oxygen consumption and
hydrogen production. Our findings are consistent with the reported
role of vitamin K-2 in mitochondrial electron transport and ATP
production and the mitochondrial functionality of TERE1 we inferred
via co-localization with mitochondrial TBL2 (39). Changes in OCR measurements may
reflect changes in oxidative phosphorylation, non-mitochondrial
respiration including oxidative stress, and mitochondrial proton
leak (62). Based on the fact that
the electron transport chain is an abundant source of mitochondrial
superoxide radicals (34,37,45,63),
we examined ROS and RNS effects of TERE1.
TERE1 effects on ROS/RNS
To evaluate whether TERE1 would elevate the level of
oxidative stress in Caki-1 and Caki-2 RCC cells, we compared
oxidation of CellROX deep red, specific for ROS, and
dihydrorhodamine 123, affected by either ROS or RNS. TERE1
increased oxidation of both fluorogenic probes in Caki-1 cells,
implying an increase in ROS. Caki-2 cells showed an increase in
dihydrorhodamine 123 oxidation, but a 23% decrease in CellROX
oxidation, implying RNS, but not ROS. We then confirmed that Caki-2
cells do increase NO production in response to ectopic TERE1
expression, but in Caki-1 cells, TERE1 reduced basal NO levels.
Given that many variables may influence the levels and cellular
consequences of ROS and RNS: TERE1 expression level and activity,
substrate availability, subcellular location, prevailing oxygen
tension, activity of cellular antioxidants, and reducing enzymes
(37,64,65),
it is not surprising to observe differences between cell lines.
ROS/RNS signaling cross-talks with many critical cellular
functions, including autophagy, mitophagy, fatty acid metabolism
and the dosage/activity of TERE1 that may trigger different types
of signaling is uncharacterized (66–68).
One implication of TERE1 effects on oxidative stress is that the
heterogeneous expression of TERE1 in RCC specimens may be a
contributing factor to heterogeneous O2 tension and
inflammatory cytokine production that has been reported to be
associated with invasion potential of RCC (69,70).
TERE1 undoubtedly has complex effects on tumor cell
populations.
Metabolic implications of TERE1 and
K-2/K-3 in tumor cells
There is important incentive to understand the
mechanisms by which TERE1 dosage affects metabolism, growth
signaling and tumor progression. Numerous reports describe K-2 and
K-3 mediated inhibition of tumor cell growth and the basis of the
differences in some of their effects; e.g., it has been reported
that K-3 but not K-2 can arylate thiols (34–36,63,71).
Research is focused on designing vitamin K analogs that may
distinguish the different mechanisms and offer therapeutic
advantage. Interestingly, more highly prenylated forms of K-2 were
found to be better SXR activators (72,73).
These studies should guide the clarification of which activities
contribute to the tumor suppressor activity of TERE1 in RCC. One
relevant possibility concerns the proposed two-step mechanism of
TERE1-mediated conversion of phylloquinone, K-1, to menaquinone,
K-2, with menadione, K-3, as an intermediate (23). The presence of K-3 presents a
possible mechanism for TERE1 to affect the glycolytic pyruvate
kinase isoenzyme PKM2, which is highly relevant to the altered
metabolic phenotype of RCC. PMK2 has an emerging role as a dominant
regulator of tumor cell glycolysis and is the major pyruvate kinase
isoform in RCC (20,74,75).
PKM2 catalyzes the dephosphorylation of phosphoenolpyruvate to
pyruvate, hence, is responsible for oxygen-independent net ATP
production that allows survival of the cells under hypoxic
conditions as are often found in solid tumors. PMK2 can be
inhibited by vitamin K-3, and to a lesser degree by K-2, as well as
by ROS (76,77). This implies that a reduction in
TERE1 levels in RCC could reduce the generation of the inhibitory
K-3 intermediate and may lead to a greater activity of PKM2,
enhancing glycolytic flux and tumor growth. Considering the role of
menaquinone in anaerobic organisms, an alternate possibility is
that tumor cells with low levels of TERE1 and menaquinone may be
selected against in hypoxic environments and driven to invade.
TERE1 and mitochondrial ETC
Given the predominant role of ubiquinone in
oxidative respiration, the role that menaquinone plays in
mitochondrial electron transfer is not well understood. However,
menaquinone has an established electron carrier role in the ETC of
anaerobic bacteria and anaerobic mitochondria, and there is
increasing evidence regarding its possible role in tumor
mitochondria (37,38,78,79).
In addition to the well known NADH-ubiquinone reductase activity of
mitochondrial complex I typical of aerobic respiration, there is
also a NADH-fumarate reductase anaerobic electron transport system
in mitochondria which is capable of using menaquinone to donate
electrons to run a reverse TCA conversion of fumarate to succinate
(80,81). Elevation of TCA intermediates,
fumarate and succinate, due to inactivation or deficiency of
fumarate hydratase in RCC serves as a prototypical onco-metabolic
mechanism leading to HIFα stabilization that is a major driving
force of RCC (22,82,83).
Elevated succinate can also lead to a novel post-translational
modification called succination (84), and the TERE1-interacting
mitochondrial protein, TBL2, has been identified as a substrate for
succination in RCC cells, although the consequence of this
alteration is unknown.
TBL2
Except for the interaction with TERE1, little is
known about the role of TBL2 except it has appeared in protein
interaction databases as a partner with SMURF1 or PDK1 suggesting a
possible role in TGFβ, and/or AKT signaling, respectively (85,86).
The TBL2 gene was originally indentified within a region of
chromosome 7q11.23 deleted in Williams-Beuren syndrome (87). There are numerous studies
evaluating the relationship between mitochondrial WD repeat
proteins involved in mitochondrial fission/fusion (88,89)
and oxidative stress and mitophagy (67,90).
It is interesting to speculate that the WD repeats of TBL2, may be
involved in similar functions. We have found that ectopic TBL2
expression, like TERE1, can increase mitochondrial transmembrane
potential, elevate oxidative and nitrosative stress in bladder
cancer cells (24,27) and have now confirmed its potential
for modulation of cholesterol in RCC cell lines.
TERE1, TBL2, and modulation of
cholesterol and SXR target genes
In this study, we confirmed that ectopic expression
of TERE1 or TBL2 can reduce cellular cholesterol levels in Caki-1,
Caki-2, and HEK293 cell lines. Similar cholesterol reductions were
observed with application of vitamin K-1, K-2, and K-3. Recently,
cholesterol-binding and cholesterol regulatory functions were
described for both TERE1 and TBL2, supporting our earlier
conclusions pointing to their role as modulators of lipid
metabolism (43,91). We analyzed TERE1-induced changes in
expression of established SXR target genes in Caki-1 and Caki-2
cells and confirmed that SXR target genes involved in cholesterol
efflux and fatty acid metabolism are modulated by TERE1 and TBL2.
Several of these genes play a role in mobilization or efflux of
cholesterol thus may contribute to the TERE1- or TBL2-mediated
cholesterol reduction: CD36, ABCB1, and SCARB1 (92–95).
CYP27A1 and CYP7A1 oxidize cholesterol for cellular export
(96). The ubiquitin ligase FBXW7
is known to degrade SREBP (97,98),
which may also lower cholesterol synthesis. SCD1 is an SXR target
gene that is known to regulate biosynthesis of unsaturated fatty
acids that are used in a variety of phospholipids, triglycerides,
and cholesterol esters and can affect fatty acid oxidation
(99). The elevation of SCD1 by
ectopic TBL2 may be relevant to the proposed role of TBL2 as a
candidate gene in triglyceride disorders (100,101). The mechanisms that govern TBL2 in
these activities are undefined, however; by virtue of its inner
mitochondrial membrane localization and association with TERE1, a
role in retrograde signaling should be explored, especially since
succinated-TBL2 has been found in the nucleus. Overall these
changes in expression of SXR target genes support the hypothesis of
SXR activation by TERE1 and modulation of lipid homeostasis via
cholesterol efflux and catabolism. This analysis will serve to
guide further study of protein expression and signaling in RCC
(33,48,102).
In conclusion, our aim was to establish links
between the altered metabolic phenotype of RCC and functionality of
the TERE1 prenyltransferase. We have reported a TERE1-negative
expression phenotype in a over half of the lesions from a tumor
microarray (TMA) set of human RCC tumor specimens, and demonstrated
that ectopic TERE1 expression profoundly decreased growth,
suppressed colony forming ability, and increased caspase 3/7
activity in a panel of RCC cell lines. We show TERE1 activates
mitochondrial activity using extra-cellular flux analysis and leads
to elevations in ROS/RNS. TERE1 and TBL2 reduced Caki-1 and Caki-2
cell cholesterol and activated a common set of SXR target genes
with roles in cholesterol and lipid metabolism. We discuss several
hypotheses to relate possible TERE1/K-2/K-3 mediated mechanisms of
tumor suppression to the altered metabolic phenotype of RCC. Tumor
progression depends on adaptations to maintain an elevated
oxidative stress level; however, tumor cells must manage oxidative
stress levels below the apoptotic threshold (103). In this regard, subversion of
apoptotic signaling by elevated mitochondrial cholesterol is highly
relevant (104–110). The natural TERE1-mediated
targeting of vitamin K-2 synthesis to mitochondria may represent a
form of oxidative stress liability to tumor cell metabolism during
progression. The loss of TERE1 expression in RCC may be a defect in
mitochondrial to nuclear SXR signaling that tumors use to uncouple
vitamin K-mediated oxidative stress signaling from apoptosis or
negative growth signaling by elevation of cholesterol.
Acknowledgements
We thank the Veterans Administration
Merit Review and the Veterans Affairs Medical Center Philadelphia
for the grant support to S.B.M. We thank the Nicolo Family Renal
Cancer Research Fund Foundation for their generous support to
S.B.M. and WJ.F.
References
|
1.
|
Li L and Kaelin WG Jr: New insights into
the biology of renal cell carcinoma. Hematol Oncol Clin North Am.
25:667–686. 2011. View Article : Google Scholar : PubMed/NCBI
|
|
2.
|
Messer J, Drabick J and Kaag M: Rational
therapy for renal cell carcinoma based on its genetic targets. Adv
Exp Med Biol. 779:291–308. 2013. View Article : Google Scholar : PubMed/NCBI
|
|
3.
|
Pischon T, Nöthlings U and Boeing H:
Obesity and cancer. Proc Nutr Soc. 67:128–145. 2008. View Article : Google Scholar
|
|
4.
|
Drabkin HA and Gemmill RM: Obesity,
cholesterol, and clear-cell renal cell carcinoma (RCC). Adv Cancer
Res. 107:39–56. 2010. View Article : Google Scholar : PubMed/NCBI
|
|
5.
|
Baldewijns MM, van Vlodrop IJ, Vermeulen
PB, Soetekouw PM, van Engeland M and De Bruine AP: VHL and HIF
signalling in renal cell carcinogenesis. J Pathol. 221:125–138.
2010. View Article : Google Scholar : PubMed/NCBI
|
|
6.
|
Keith B, Johnson RS and Simon MC:
HIF1alpha and HIF2alpha: sibling rivalry in hypoxic tumour growth
and progression. Nat Rev Cancer. 12:9–22. 2012.PubMed/NCBI
|
|
7.
|
Banumathy G and Cairns P: Signaling
pathways in renal cell carcinoma. Cancer Biol Ther. 10:658–664.
2010. View Article : Google Scholar : PubMed/NCBI
|
|
8.
|
Linehan WM, Bratslavsky G, Pinto PA, et
al: Molecular diagnosis and therapy of kidney cancer. Annu Rev Med.
61:329–343. 2010. View Article : Google Scholar : PubMed/NCBI
|
|
9.
|
Mihaly Z, Sztupinszki Z, Surowiak P and
Gyorffy B: A comprehensive overview of targeted therapy in
metastatic renal cell carcinoma. Curr Cancer Drug Targets.
12:857–872. 2012. View Article : Google Scholar : PubMed/NCBI
|
|
10.
|
Pal SK, Williams S, Josephson DY,
Carmichael C, Vogelzang NJ and Quinn DI: Novel therapies for
metastatic renal cell carcinoma: efforts to expand beyond the
VEGF/mTOR signaling paradigm. Mol Cancer Ther. 11:526–537. 2012.
View Article : Google Scholar : PubMed/NCBI
|
|
11.
|
Gebhard RL, Clayman RV, Prigge WF, et al:
Abnormal cholesterol metabolism in renal clear cell carcinoma. J
Lipid Res. 28:1177–1184. 1987.PubMed/NCBI
|
|
12.
|
Christenson E, Merlin S, Saito M and
Schlesinger P: Cholesterol effects on BAX pore activation. J Mol
Biol. 381:1168–1183. 2008. View Article : Google Scholar : PubMed/NCBI
|
|
13.
|
Li YC, Park MJ, Ye SK, Kim CW and Kim YN:
Elevated levels of cholesterol-rich lipid rafts in cancer cells are
correlated with apoptosis sensitivity induced by
cholesterol-depleting agents. Am J Pathol. 168:1107–1118. 2006.
View Article : Google Scholar : PubMed/NCBI
|
|
14.
|
Martinez-Abundis E, Garcia N, Correa F,
Franco M and Zazueta C: Changes in specific lipids regulate
BAX-induced mitochondrial permeability transition. FEBS J.
274:6500–6510. 2007. View Article : Google Scholar : PubMed/NCBI
|
|
15.
|
Oh HY, Lee EJ, Yoon S, Chung BH, Cho KS
and Hong SJ: Cholesterol level of lipid raft microdomains regulates
apoptotic cell death in prostate cancer cells through EGFR-mediated
Akt and ERK signal transduction. Prostate. 67:1061–1069. 2007.
View Article : Google Scholar : PubMed/NCBI
|
|
16.
|
Swinnen JV, Brusselmans K and Verhoeven G:
Increased lipogenesis in cancer cells: new players, novel targets.
Curr Opin Clin Nutr Metab Care. 9:358–365. 2006. View Article : Google Scholar : PubMed/NCBI
|
|
17.
|
Prenen H, Gil T and Awada A: New
therapeutic developments in renal cell cancer. Crit Rev Oncol
Hematol. 69:56–63. 2009. View Article : Google Scholar : PubMed/NCBI
|
|
18.
|
Srinivasan R, Armstrong AJ, Dahut W and
George DJ: Anti-angiogenic therapy in renal cell cancer. BJU Int.
99:1296–1300. 2007. View Article : Google Scholar : PubMed/NCBI
|
|
19.
|
Selak MA, Armour SM, MacKenzie ED, et al:
Succinate links TCA cycle dysfunction to oncogenesis by inhibiting
HIF-alpha prolyl hydroxylase. Cancer Cell. 7:77–85. 2005.
View Article : Google Scholar : PubMed/NCBI
|
|
20.
|
Ashrafian H, O’Flaherty L, Adam J, et al:
Expression profiling in progressive stages of fumarate-hydratase
deficiency: the contribution of metabolic changes to tumorigenesis.
Cancer Res. 70:9153–9165. 2010. View Article : Google Scholar : PubMed/NCBI
|
|
21.
|
O’Flaherty L, Adam J, Heather LC, et al:
Dysregulation of hypoxia pathways in fumarate hydratase-deficient
cells is independent of defective mitochondrial metabolism. Hum Mol
Genet. 19:3844–3851. 2010.PubMed/NCBI
|
|
22.
|
Yang Y, Valera VA, Padilla-Nash HM, et al:
UOK 262 cell line, fumarate hydratase deficient (FH-/FH-)
hereditary leiomyomatosis renal cell carcinoma: in vitro and in
vivo model of an aberrant energy metabolic pathway in human cancer.
Cancer Genet Cytogenet. 196:45–55. 2010. View Article : Google Scholar
|
|
23.
|
Nakagawa K, Hirota Y, Sawada N, et al:
Identification of UBIAD1 as a novel human menaquinone-4
biosynthetic enzyme. Nature. 468:117–121. 2010. View Article : Google Scholar : PubMed/NCBI
|
|
24.
|
Fredericks WJ, McGarvey T, Wang H, et al:
The TERE1 (UBIAD1) bladder tumor suppressor protein interacts with
mitochondrial TBL2: regulation of trans-membrane potential,
oxidative stress and SXR signaling to the nucleus. J Cell Biochem.
View Article : Google Scholar : 2013.[Epub ahead
of print].
|
|
25.
|
McGarvey TW, Nguyen T, Tomaszewski JE,
Monson FC and Malkowicz SB: Isolation and characterization of the
TERE1 gene, a gene down-regulated in transitional cell carcinoma of
the bladder. Oncogene. 20:1042–1051. 2001. View Article : Google Scholar : PubMed/NCBI
|
|
26.
|
McGarvey TW, Nguyen T, Puthiyaveettil R,
Tomaszewski JE and Malkowicz SB: TERE1, a novel gene affecting
growth regulation in prostate carcinoma. Prostate. 54:144–155.
2003. View Article : Google Scholar : PubMed/NCBI
|
|
27.
|
Fredericks WJ, McGarvey T, Wang H, et al:
The bladder tumor suppressor protein TERE1 (UBIAD1) modulates cell
cholesterol: implications for tumor progression. DNA Cell Biol.
30:851–864. 2011. View Article : Google Scholar : PubMed/NCBI
|
|
28.
|
McGarvey TW, Nguyen TB and Malkowicz SB:
An interaction between apolipoprotein E and TERE1 with a possible
association with bladder tumor formation. J Cell Biochem.
95:419–428. 2005. View Article : Google Scholar : PubMed/NCBI
|
|
29.
|
Weiss JS, Kruth HS, Kuivaniemi H, et al:
Mutations in the UBIAD1 gene on chromosome short arm 1, region 36,
cause Schnyder crystalline corneal dystrophy. Invest Ophthalmol Vis
Sci. 48:5007–5012. 2007. View Article : Google Scholar : PubMed/NCBI
|
|
30.
|
Nickerson ML, Kostiha BN, Brandt W, et al:
UBIAD1 mutation alters a mitochondrial prenyltransferase to cause
Schnyder corneal dystrophy. PLoS One. 5:e107602010. View Article : Google Scholar : PubMed/NCBI
|
|
31.
|
Nickerson ML, Bosley AD, Weiss JS, et al:
The UBIAD1 prenyltransferase links menaquione-4 synthesis to
cholesterol metabolic enzymes. Hum Mutat. 34:317–329. 2013.
View Article : Google Scholar : PubMed/NCBI
|
|
32.
|
Ihunnah CA, Jiang M and Xie W: Nuclear
receptor PXR, transcriptional circuits and metabolic relevance.
Biochim Biophys Acta. 1812:956–963. 2011. View Article : Google Scholar : PubMed/NCBI
|
|
33.
|
Zhou C, Verma S and Blumberg B: The
steroid and xenobiotic receptor (SXR), beyond xenobiotic
metabolism. Nucl Recept Signal. 7:e0012009.PubMed/NCBI
|
|
34.
|
Lamson DW and Plaza SM: The anticancer
effects of vitamin K. Altern Med Rev. 8:303–318. 2003.PubMed/NCBI
|
|
35.
|
Nishikawa Y, Wang Z, Kerns J, Wilcox CS
and Carr BI: Inhibition of hepatoma cell growth in vitro by
arylating and non-arylating K vitamin analogs. Significance of
protein tyrosine phosphatase inhibition. J Biol Chem.
274:34803–34810. 1999. View Article : Google Scholar : PubMed/NCBI
|
|
36.
|
Gilloteaux J, Jamison JM, Neal DR, Loukas
M, Doberzstyn T and Summers JL: Cell damage and death by
autoschizis in human bladder (RT4) carcinoma cells resulting from
treatment with ascorbate and menadione. Ultrastruct Pathol.
34:140–160. 2010. View Article : Google Scholar : PubMed/NCBI
|
|
37.
|
Nowicka B and Kruk J: Occurrence,
biosynthesis and function of isoprenoid quinones. Biochim Biophys
Acta. 1797:1587–1605. 2010. View Article : Google Scholar : PubMed/NCBI
|
|
38.
|
Tielens AG, Rotte C, van Hellemond JJ and
Martin W: Mitochondria as we don’t know them. Trends Biochem Sci.
27:564–572. 2002.
|
|
39.
|
Vos M, Esposito G, Edirisinghe JN, et al:
Vitamin K2 is a mitochondrial electron carrier that rescues pink1
deficiency. Science. 336:1306–1310. 2012. View Article : Google Scholar : PubMed/NCBI
|
|
40.
|
Spurgeon SL, Jones RC and Ramakrishnan R:
High throughput gene expression measurement with real time PCR in a
microfluidic dynamic array. PLoS One. 3:e16622008. View Article : Google Scholar : PubMed/NCBI
|
|
41.
|
Mugoni V, Postel R, Catanzaro V, et al:
Ubiad1 is an antioxidant enzyme that regulates eNOS activity by
CoQ10 synthesis. Cell. 152:504–518. 2013. View Article : Google Scholar : PubMed/NCBI
|
|
42.
|
Jamin N, Neumann JM, Ostuni MA, et al:
Characterization of the cholesterol recognition amino acid
consensus sequence of the peripheral-type benzodiazepine receptor.
Mol Endocrinol. 19:588–594. 2005. View Article : Google Scholar : PubMed/NCBI
|
|
43.
|
Hulce JJ, Cognetta AB, Niphakis MJ, Tully
SE and Cravatt BF: Proteome-wide mapping of cholesterol-interacting
proteins in mammalian cells. Nat Methods. 10:259–264. 2013.
View Article : Google Scholar : PubMed/NCBI
|
|
44.
|
Wu M, Neilson A, Swift AL, et al:
Multiparameter metabolic analysis reveals a close l link between
attenuated mitochondrial bioenergetic function and enhanced
glycolysis dependency in human tumor cells. Am J Physiol Cell
Physiol. 292:C125–C136. 2007. View Article : Google Scholar
|
|
45.
|
Klaus V, Hartmann T, Gambini J, et al:
1,4-Naphthoquinones as inducers of oxidative damage and stress
signaling in HaCaT human keratinocytes. Arch Biochem Biophys.
496:93–100. 2010. View Article : Google Scholar : PubMed/NCBI
|
|
46.
|
Sano M, Fujita H, Morita I, Uematsu H and
Murota S: Vitamin K2 (menatetrenone) induces iNOS in bovine
vascular smooth muscle cells: no relationship between nitric oxide
production and gamma-carboxylation. J Nutr Sci Vitaminol (Tokyo).
45:711–723. 1999. View Article : Google Scholar
|
|
47.
|
Bhalerao S and Clandinin TR: Cell biology.
Vitamin K2 takes charge. Science. 336:1241–1242. 2012. View Article : Google Scholar : PubMed/NCBI
|
|
48.
|
Shearer MJ and Newman P: Metabolism and
cell biology of vitamin K. Thromb Haemost. 100:530–547. 2008.
|
|
49.
|
Zhou C, King N, Chen KY and Breslow JL:
Activation of PXR induces hypercholesterolemia in wild-type and
accelerates atherosclerosis in apoE deficient mice. J Lipid Res.
50:2004–2013. 2009. View Article : Google Scholar : PubMed/NCBI
|
|
50.
|
Landes N: Homologous metabolic and gene
activating routes for vitamins E and K. Mol Aspects Med.
24:337–344. 2003. View Article : Google Scholar : PubMed/NCBI
|
|
51.
|
Lim YP and Huang JD: Interplay of pregnane
X receptor with other nuclear receptors on gene regulation. Drug
Metab Pharmacokinet. 23:14–21. 2008. View Article : Google Scholar : PubMed/NCBI
|
|
52.
|
Brown AJ and Jessup W: Oxysterols:
sources, cellular storage and metabolism, and new insights into
their roles in cholesterol homeostasis. Mol Aspects Med.
30:111–122. 2009.PubMed/NCBI
|
|
53.
|
Sonoda J, Chong LW, Downes M, et al:
Pregnane X receptor prevents hepatorenal toxicity from cholesterol
metabolites. Proc Natl Acad Sci USA. 102:2198–2203. 2005.
View Article : Google Scholar : PubMed/NCBI
|
|
54.
|
Wang Y, Rogers PM, Su C, Varga G, Stayrook
KR and Burris TP: Regulation of cholesterologenesis by the
oxysterol receptor, LXRalpha. J Biol Chem. 283:26332–26339. 2008.
View Article : Google Scholar : PubMed/NCBI
|
|
55.
|
Wang X and Rader DJ: Molecular regulation
of macrophage reverse cholesterol transport. Curr Opin Cardiol.
22:368–372. 2007. View Article : Google Scholar : PubMed/NCBI
|
|
56.
|
Wang X, Collins HL, Ranalletta M, et al:
Macrophage ABCA1 and ABCG1, but not SR-BI, promote macrophage
reverse cholesterol transport in vivo. J Clin Invest.
117:2216–2224. 2007. View Article : Google Scholar : PubMed/NCBI
|
|
57.
|
Lordan S, Mackrill JJ and O’Brien NM:
Oxysterols and mechanisms of apoptotic signaling: implications in
the pathology of degenerative diseases. J Nutr Biochem. 20:321–336.
2009. View Article : Google Scholar : PubMed/NCBI
|
|
58.
|
Shibayama-Imazu T, Aiuchi T and Nakaya K:
Vitamin K2-mediated apoptosis in cancer cells: role of
mitochondrial trans-membrane potential. Vitam Horm. 78:211–226.
2008. View Article : Google Scholar : PubMed/NCBI
|
|
59.
|
Jamison JM, Gilloteaux J, Nassiri MR,
Venugopal M, Neal DR and Summers JL: Cell cycle arrest and
autoschizis in a human bladder carcinoma cell line following
Vitamin C and Vitamin K3 treatment. Biochem Pharmacol. 67:337–351.
2004. View Article : Google Scholar : PubMed/NCBI
|
|
60.
|
Jamison JM, Gilloteaux J, Perlaky L, et
al: Nucleolar changes and fibrillarin redistribution following
apatone treatment of human bladder carcinoma cells. J Histochem
Cytochem. 58:635–651. 2010. View Article : Google Scholar : PubMed/NCBI
|
|
61.
|
Karasawa S, Azuma M, Kasama T, et al:
Vitamin K2 covalently binds to Bak and induces Bak-mediated
apoptosis. Mol Pharmacol. 83:613–620. 2013. View Article : Google Scholar : PubMed/NCBI
|
|
62.
|
Dranka BP, Hill BG and Darley-Usmar VM:
Mitochondrial reserve capacity in endothelial cells: the impact of
nitric oxide and reactive oxygen species. Free Radic Biol Med.
48:905–914. 2010. View Article : Google Scholar : PubMed/NCBI
|
|
63.
|
Benz CC, Atsriku C, Yau C, et al: Novel
pathways associated with quinone-induced stress in breast cancer
cells. Drug Metab Rev. 38:601–613. 2006. View Article : Google Scholar : PubMed/NCBI
|
|
64.
|
Bolton JL, Trush MA, Penning TM, Dryhurst
G and Monks TJ: Role of quinones in toxicology. Chem Res Toxicol.
13:135–160. 2000. View Article : Google Scholar : PubMed/NCBI
|
|
65.
|
Lamson DW, Gu YH, Plaza SM, Brignall MS,
Brinton CA and Sadlon AE: The vitamin C: vitamin K3 system -
enhancers and inhibitors of the anticancer effect. Altern Med Rev.
15:345–351. 2010.PubMed/NCBI
|
|
66.
|
Ambs S and Glynn SA: Candidate pathways
linking inducible nitric oxide synthase to a basal-like
transcription pattern and tumor progression in human breast cancer.
Cell Cycle. 10:619–624. 2011. View Article : Google Scholar
|
|
67.
|
Lee J, Giordano S and Zhang J: Autophagy,
mitochondria and oxidative stress: cross-talk and redox signalling.
Biochem J. 441:523–540. 2012. View Article : Google Scholar : PubMed/NCBI
|
|
68.
|
Doulias PT, Tenopoulou M, Greene JL, Raju
K and Ischiropoulos H: Nitric oxide regulates mitochondrial fatty
acid metabolism through reversible protein S-nitrosylation. Sci
Signal. 6:rs12013. View Article : Google Scholar : PubMed/NCBI
|
|
69.
|
Lusini L, Tripodi SA, Rossi R, et al:
Altered glutathione anti-oxidant metabolism during tumor
progression in human renal-cell carcinoma. Int J Cancer. 91:55–59.
2001. View Article : Google Scholar : PubMed/NCBI
|
|
70.
|
Fitzgerald JP, Nayak B, Shanmugasundaram
K, et al: Nox4 mediates renal cell carcinoma cell invasion through
hypoxia-induced interleukin 6- and 8- production. PLoS One.
7:e307122012. View Article : Google Scholar : PubMed/NCBI
|
|
71.
|
Abdelmohsen K: Epidermal growth factor
receptor is a common mediator of quinone-induced signaling leading
to phosphorylation of connexin-43: Role of glutathione and tyrosine
phosphatases. J Biol Chem. 278:38360–38367. 2003. View Article : Google Scholar
|
|
72.
|
Suhara Y, Hanada N, Okitsu T, et al:
Structure-activity relationship of novel menaquinone-4 analogues:
modification of the side chain affects their biological activities.
J Med Chem. 55:1553–1558. 2012. View Article : Google Scholar
|
|
73.
|
Suhara Y, Watanabe M, Motoyoshi S, et al:
Synthesis of new vitamin K analogues as steroid and xenobiotic
receptor (SXR) agonists: insights into the biological role of the
side chain part of vitamin K. J Med Chem. 54:4918–4922. 2011.
View Article : Google Scholar : PubMed/NCBI
|
|
74.
|
Mazurek S: Pyruvate kinase type M2: a key
regulator of the metabolic budget system in tumor cells. Int J
Biochem Cell Biol. 43:969–980. 2011. View Article : Google Scholar : PubMed/NCBI
|
|
75.
|
Wong N, De Melo J and Tang D: PKM2, a
central point of regulation in cancer metabolism. Int J Cell Biol.
2013:2425132013. View Article : Google Scholar : PubMed/NCBI
|
|
76.
|
Chen J, Jiang Z, Wang B, Wang Y and Hu X:
Vitamin K(3) and K(5) are inhibitors of tumor pyruvate kinase M2.
Cancer Lett. 316:204–210. 2012. View Article : Google Scholar : PubMed/NCBI
|
|
77.
|
Anastasiou D, Poulogiannis G, Asara JM, et
al: Inhibition of pyruvate kinase M2 by reactive oxygen species
contributes to cellular antioxidant responses. Science.
334:1278–1283. 2011. View Article : Google Scholar : PubMed/NCBI
|
|
78.
|
Zaunmuller T, Kelly DJ, Glockner FO and
Unden G: Succinate dehydrogenase functioning by a reverse redox
loop mechanism and fumarate reductase in sulphate-reducing
bacteria. Microbiology. 152:2443–2453. 2006. View Article : Google Scholar : PubMed/NCBI
|
|
79.
|
Sakai C, Tomitsuka E, Esumi H, Harada S
and Kita K: Mitochondrial fumarate reductase as a target of
chemotherapy: from parasites to cancer cells. Biochim Biophys Acta.
1820:643–651. 2012. View Article : Google Scholar : PubMed/NCBI
|
|
80.
|
Tomitsuka E, Kita K and Esumi H: The
NADH-fumarate reductase system, a novel mitochondrial energy
metabolism, is a new target for anticancer therapy in tumor
microenvironments. Ann NY Acad Sci. 1201:44–49. 2010. View Article : Google Scholar
|
|
81.
|
Tomitsuka E, Kita K and Esumi H: An
anticancer agent, pyrvinium pamoate inhibits the NADH-fumarate
reductase system - a unique mitochondrial energy metabolism in
tumour microenvironments. J Biochem. 152:171–183. 2012. View Article : Google Scholar
|
|
82.
|
Tomlinson IP, Alam NA, Rowan AJ, et al:
Germline mutations in FH predispose to dominantly inherited uterine
fibroids, skin leiomyomata and papillary renal cell cancer. Nat
Genet. 30:406–410. 2002. View
Article : Google Scholar : PubMed/NCBI
|
|
83.
|
Yang Y, Valera V, Sourbier C, et al: A
novel fumarate hydratase-deficient HLRCC kidney cancer cell line,
UOK268: a model of the Warburg effect in cancer. Cancer Genet.
205:377–390. 2012. View Article : Google Scholar : PubMed/NCBI
|
|
84.
|
Ternette N, Yang M, Laroyia M, et al:
Inhibition of mitochondrial aconitase by succination in fumarate
hydratase deficiency. Cell Rep. 3:689–700. 2013. View Article : Google Scholar : PubMed/NCBI
|
|
85.
|
Barrios-Rodiles M, Brown KR, Ozdamar B, et
al: High-throughput mapping of a dynamic signaling network in
mammalian cells. Science. 307:1621–1625. 2005. View Article : Google Scholar : PubMed/NCBI
|
|
86.
|
Behrends C, Sowa ME, Gygi SP and Harper
JW: Network organization of the human autophagy system. Nature.
466:68–76. 2010. View Article : Google Scholar : PubMed/NCBI
|
|
87.
|
Perez Jurado LA, Wang YK, Francke U and
Cruces J: TBL2, a novel transducin family member in the WBS
deletion: characterization of the complete sequence, genomic
structure, transcriptional variants and the mouse ortholog.
Cytogenet Cell Genet. 86:277–284. 1999.
|
|
88.
|
Tieu Q and Nunnari J: Mdv1p is a WD repeat
protein that interacts with the dynamin-related GTPase, Dnm1p, to
trigger mitochondrial division. J Cell Biol. 151:353–366. 2000.
View Article : Google Scholar : PubMed/NCBI
|
|
89.
|
Tieu Q, Okreglak V, Naylor K and Nunnari
J: The WD repeat protein, Mdv1p, functions as a molecular adaptor
by interacting with Dnm1p and Fis1p during mitochondrial fission. J
Cell Biol. 158:445–452. 2002. View Article : Google Scholar : PubMed/NCBI
|
|
90.
|
Feng Y, Zhang C, Luo Q, et al: A novel
WD-repeat protein, WDR26, inhibits apoptosis of cardiomyocytes
induced by oxidative stress. Free Radic Res. 46:777–784. 2012.
View Article : Google Scholar : PubMed/NCBI
|
|
91.
|
Blattmann P, Schuberth C, Pepperkok R and
Runz H: RNAi-based functional profiling of loci from blood lipid
genome-wide association studies identifies genes with
cholesterol-regulatory function. PLoS Genet. 9:e10033382013.
View Article : Google Scholar
|
|
92.
|
Rothblat GH, De la Llera-Moya M, Atger V,
Kellner-Weibel G, Williams DL and Phillips MC: Cell cholesterol
efflux: integration of old and new observations provides new
insights. J Lipid Res. 40:781–796. 1999.PubMed/NCBI
|
|
93.
|
Hoekstra M, van Berkel TJ and van Eck M:
Scavenger receptor BI: a multi-purpose player in cholesterol and
steroid metabolism. World J Gastroenterol. 16:5916–5924.
2010.PubMed/NCBI
|
|
94.
|
Maitra U and Li L: Molecular mechanisms
responsible for the reduced expression of cholesterol transporters
from macrophages by low-dose endotoxin. Arterioscler Thromb Vasc
Biol. 33:24–33. 2013. View Article : Google Scholar : PubMed/NCBI
|
|
95.
|
Saddar S, Carriere V, Lee WR, et al:
Scavenger receptor class B type I is a plasma membrane cholesterol
sensor. Circ Res. 112:140–151. 2013. View Article : Google Scholar : PubMed/NCBI
|
|
96.
|
Crestani M, De Fabiani E, Caruso D, et al:
LXR (liver X receptor) and HNF-4 (hepatocyte nuclear factor-4): key
regulators in reverse cholesterol transport. Biochem Soc Trans.
32:92–96. 2004. View Article : Google Scholar : PubMed/NCBI
|
|
97.
|
Tu K, Zheng X, Yin G, Zan X, Yao Y and Liu
Q: Evaluation of Fbxw7 expression and its correlation with
expression of SREBP-1 in a mouse model of NAFLD. Mol Med Rep.
6:525–530. 2012.PubMed/NCBI
|
|
98.
|
Kumadaki S, Karasawa T, Matsuzaka T, et
al: Inhibition of ubiquitin ligase F-box and WD repeat
domain-containing 7alpha (Fbw7alpha) causes hepatosteatosis through
Kruppel-like factor 5 (KLF5)/peroxisome proliferator-activated
receptor gamma2 (PPARgamma2) pathway but not SREBP-1c protein in
mice. J Biol Chem. 286:40835–40846. 2011. View Article : Google Scholar
|
|
99.
|
Ntambi JM, Miyazaki M and Dobrzyn A:
Regulation of stearoyl-CoA desaturase expression. Lipids.
39:1061–1065. 2004. View Article : Google Scholar : PubMed/NCBI
|
|
100.
|
Wang J, Ban MR, Zou GY, et al: Polygenic
determinants of severe hypertriglyceridemia. Hum Mol Genet.
17:2894–2899. 2008. View Article : Google Scholar : PubMed/NCBI
|
|
101.
|
Kathiresan S, Melander O, Guiducci C, et
al: Six new loci associated with blood low-density lipoprotein
cholesterol, high-density lipoprotein cholesterol or triglycerides
in humans. Nat Genet. 40:189–197. 2008. View Article : Google Scholar : PubMed/NCBI
|
|
102.
|
Verma S, Tabb MM and Blumberg B:
Activation of the steroid and xenobiotic receptor, SXR, induces
apoptosis in breast cancer cells. BMC Cancer. 9:32009. View Article : Google Scholar : PubMed/NCBI
|
|
103.
|
Pani G, Galeotti T and Chiarugi P:
Metastasis: cancer cell’s escape from oxidative stress. Cancer
Metastasis Rev. 29:351–378. 2010.
|
|
104.
|
Montero J, Morales A, Llacuna L, et al:
Mitochondrial cholesterol contributes to chemotherapy resistance in
hepatocellular carcinoma. Cancer Res. 68:5246–5256. 2008.
View Article : Google Scholar : PubMed/NCBI
|
|
105.
|
Garcia-Ruiz C, Mari M, Colell A, et al:
Mitochondrial cholesterol in health and disease. Histol
Histopathol. 24:117–132. 2009.
|
|
106.
|
Bonuccelli G, Tsirigos A, Whitaker-Menezes
D, et al: Ketones and lactate ‘fuel’ tumor growth and metastasis:
evidence that epithelial cancer cells use oxidative mitochondrial
metabolism. Cell Cycle. 9:3506–3514. 2010.
|
|
107.
|
Bonuccelli G, Whitaker-Menezes D,
Castello-Cros R, et al: The reverse Warburg effect: glycolysis
inhibitors prevent the tumor promoting effects of caveolin-1
deficient cancer associated fibroblasts. Cell Cycle. 9:1960–1971.
2010. View Article : Google Scholar
|
|
108.
|
Behrend L, Henderson G and Zwacka RM:
Reactive oxygen species in oncogenic transformation. Biochem Soc
Trans. 31:1441–1444. 2003. View Article : Google Scholar : PubMed/NCBI
|
|
109.
|
Ralph SJ, Rodríguez-Enríquez S, Neuzil J,
Saavedra E and Moreno-Sánchez R: The causes of cancer revisited:
‘Mitochondrial malignancy’ and ROS-induced oncogenic transformation
- why mitochondria are targets for cancer therapy. Mol Aspects Med.
31:145–170. 2010.
|
|
110.
|
Sone H, Akanuma H and Fukuda T:
Oxygenomics in environmental stress. Redox Rep. 15:98–114. 2010.
View Article : Google Scholar
|