Introduction
Carcinogenesis of breast cancer is a complicated
process that is initiated from a limited number of cancer cells and
proceeds to malignancy (1).
Genetic as well as epigenetic changes of tumor suppressors and/or
oncogenes have been known to contribute to the process (2). Promoter methylation change leads to
epigenetic modification which also includes ones by histone change
and miRNA (3,4). Well known tumor suppressors, such as
p53, RASSF1A and BRCA1, are inactivated by hypermethylation of
their promoters in breast cancer (5–7). So
far, examination of methylation has been focused on comparison of
the methylation level between normal and cancer cells, or before
and after the administration of chemical treatments to cultured
cells and tissue. Genome-wide methylation screen in normal vs.
tumor tissue identified epigenetically modified biomarkers,
including BCAB, HOXD1 and POU4F1, revealing an over-representation
of homeobox genes and genes involved in the regulation of
transcription (8). It has been
further claimed that aberrant methylation occurs at an early stage
in breast tumorigenesis (9,10).
In accordance with this hypothesis, TLX1, HOXB13 and Caveolin-1
showed early onset of methylation in stage I breast tumors
(11).
Methylation change can be associated with tumor
stage or site of tumor (12). For
example, trends of increasing RASSF1 methylation were observed to
occur in association with increasing tumor size and advancement of
the stage of breast cancer (13).
In another study, ADAM33 was determined to be silenced by promoter
methylation, showing hypermethylation in invasive lobular carcinoma
(76.2%) compared to invasive ductal carcinoma (25.5%) (14).
Even though the number of genes which are associated
with methylation change in carcinogenesis are being increased, the
methylation trend has been observed in only a few cases. A
functional hypermethylome screen identified genes such as CKM and
TAC1 which show a stage-dependent methylation frequency pattern, as
candidates to help delineate breast cancer prognostic signatures
(15). An in vitro model of
human breast epithelial cell transformation with MCF-10F normal
cell line and its transformed derivatives at transformed stage,
invasive stage, and tumor stage showed increased DNA methylation
during the invasive and tumor stages (16). In the study, NRG1 was unmethylated
in normal cells and transformed cells, becoming hypermethylated in
the invasive and tumor stage. Few systemic trials have been carried
out in a way which identifies genes showing linearity between
promoter methylation and tumor progression (17).
In this study, we analyzed the Illumina methylation
array data that were registered on the GEO database, representing
genome-wide methylation at a normal breast cell line and at tumor
cell lines of cancer stages I–IV. Comparison analysis revealed a
close relationship between the genome-wide methylation and cancer
stage. In addition, NEFL was identified as a novel epigenetic
marker, which was hypermethylated and downregulated in breast
cancer.
Materials and methods
Study subjects
All patients provided written informed consent to
donate removed tissue to the National Cancer Center (NCC, Seoul) in
Korea and samples were obtained according to protocols approved by
the Research Ethics Board of NCC. Forty pairs of breast cancer
(BrCa) and their corresponding adjacent normal tissue specimens
were obtained from patients who had undergone surgery between 2011
and 2012 at NCC. BrCa specimens were subjected to histological
examination by an expert pathologist for independent confirmation
of the cancer stage.
Cell culture
A normal breast cell line, MCF 10A, and breast
cancer cell lines, HCC1395 (stage I) and MDA-MB-231 (stage IV) were
purchased from American Type Culture Collection (ATCC; Manassas,
VA). HCC38 (stage II) was purchased from Korea Cell Line Bank
(KCLB; Seoul, Korea). HCC38, HCC1395 and MDA-MB-231 were cultured
in RPMI-1640 supplemented with 10% fetal bovine serum (FBS). MCF
10A was grown in MEBM supplemented with MEGM Single Quots (Lonza,
Basel, Switzerland). All cell types were cultured on the surface of
a 75 cm2 culture flask.
Methylation-specific PCR (MSP)
Chromosomal DNA from approximately 100 mg of tissue
samples was isolated using a genomic DNA purification kit (Promega,
Madison, WI) according to the manufacturer’s protocol, with a 60
μl elution volume. Chromosomal DNA from cultures in a 75
cm2 flask was isolated using an AllPrep DNA/RNA Mini Kit
(Qiagen, Valencia, CA) with 100 μl elution volume. Sodium
bisulfite modification of genomic DNA and PCR was carried out as
previously described (18).
Briefly, 0.1 mg of DNA was treated with sodium bisulfite and then
PCR was carried out using primers (Table I) and a Kapa SYBR Fast qPCR kit
(Kapa Biosystems, Woburn, MA). A methylation index was calculated
for each sample using the following formula: methylation index =
1/[1+2−(CTu−CTme)] × 100%, where CTu is the cycle
threshold (CT) obtained using the unmethylated primer pair and CTme
is the average CT obtained using the methylated primer pair.
 | Table I.Sequences of primers employed in this
study. |
Table I.
Sequences of primers employed in this
study.
| Genes | Forward primer
(5′→3′) | Reverse primer
(5′→3′) |
|---|
| MSP | | |
| NEFL M |
TTGTTGAGGTAGTCGCGcgT |
AAATCAACCAACTACAAAACTTAT |
| NEFL U |
TTGTTGAGGTAGTTGTGtgT |
AAATCAACCAACTACAAAACTTAT |
| Real-time RT-PCR | | |
| NEFL |
CAAAGAGTGAAATGGCACGAT |
TCCAAGAGTTTCCTGCCTGT |
| GAPDH |
CAGGAGGCATTGCTGATGAT |
GAAGGCTGGGGCTCATTT |
Real-time RT-PCR
Total RNA from approximately 100 mg of tissues was
prepared using TRIzol reagent according to the manufacturer’s
protocols (Gibco-BRL, Carlsbad, CA), and was finally suspended in
30 μl of distilled water. Total RNA from a 75 cm2
culture flask was prepared using the RNeasy Plus mini kit (Qiagen)
and was finally eluted with 30 μl of distilled water.
Reverse transcription was conducted using 5 μg of total RNA
with a reverse transcription kit (Promega). Expression levels of
selected genes were measured by real-time quantitative RT-PCR
analysis using a Kapa SYBR Fast qPCR kit (Kapa Biosystems) on an
ABI 7300 instrument (Applied Biosystems). One microliter of cDNA
was used for PCR, which was performed in duplicate. Primers used
for the RT-PCR are listed in Table
I. RNA quantity was normalized to GAPDH content, and gene
expression was quantified according to the 2−ΔCt
method.
Databases and statistical analysis
The Infinium Methylation Chip data for a breast
normal cell line and cancer cell lines were obtained from the GEO
database (http://www.ncbi.nlm.nih.gov/geo/). The selected cell
lines are: normal, MCF 10A; breast cancer stage I, HCC1395; stage
II, HCC1008, HCC1143, HCC1954, HCC1937, HCC38; stage III, HCC1599,
HCC2218; stage IV, HCC1569, MDA-MB-231. Observations with adjusted
p-values ≥0.05 were removed, and thus excluded from further
analysis. Following adjustment, the remaining genes were defined as
differentially methylated if they displayed increased methylation
levels when compared to that of the previous stage of the cell
line. A hierarchical clustering dendrogram was generated by Gene
Cluster 3.0 (http://bonsai.hgc.jp/∼mdehoon/software/cluster/software.htm)
to determine the relationship between the methylation profile and
developmental stage of the tumor. Student’s t-test was used to
detect differences in mean levels of methylation and the expression
level between the normal and cancer tissues using SPSS for Windows,
version 17.0 (SPSS Inc., Chicago, IL). P-values <0.05 were
considered to be statistically significant.
Results
In silico methylome analysis revealed
that genome-wide methylation is closely linked with cancer
development
A group of genome-wide methylation databases was
collected and analyzed for genes for which the methylation level
consistently increased or decreased with the progress of breast
tumor stage. The data were obtained by carrying out Illumina
methylation array covering 14,495 genes and 27,578 CpG sites, and
databases were available for cell lines and tissues at the GEO
database (http://www.ncbi.nlm.nih.gov/geo/). As it is well known
that the estrogen receptor (ER) status of cancer cells affects the
methylation and expression of many genes in breast cancer (19,20),
databases were first screened so that they were derived from the
same ER status. Of the databases, only ER-negative (ER−)
cell lines were available with a full set, which included at least
one database at both normal and all the cancer developmental
stages, I–IV. Therefore an ER− normal cell line, MCF
10A, and ten ER− cancer cell lines were selected and
analyzed. To examine the correlation between the methylation change
and tumor progression, the genes from the microarray were first
filtered so that false-negative genes (p<0.05) were excluded. In
total, 12,787 CpG sites remained common to all normal and cancer
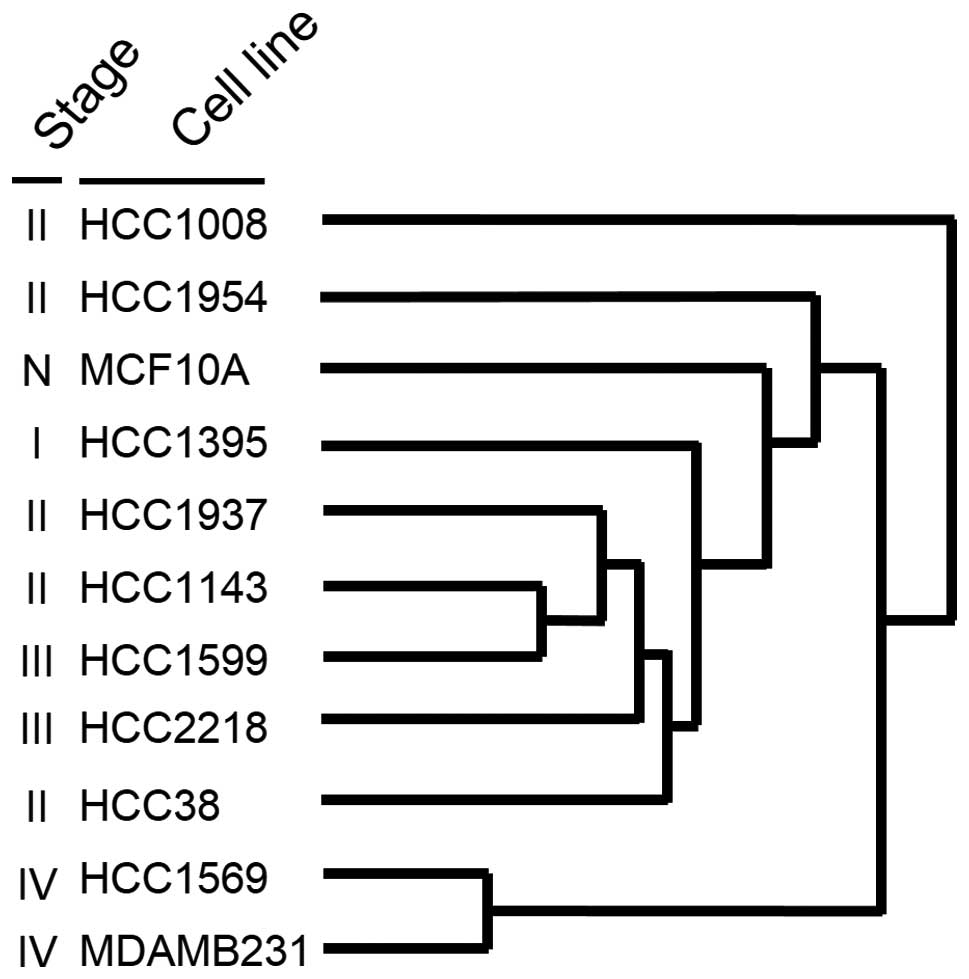
cells. Class comparison and heatmap analysis were carried out based
on the methylation index of the genes. Interestingly, the cell
lines were arranged in the dendrogram in such a way that normal
cells and early stage cells were linked closer together, and
likewise, late stage cells were located closer to each other
(Fig. 1). Notably, the two cell
lines at stage IV, HCC1569 and MDA-MB-231, were most closely
related, showing the shortest distance. This result indicates that
the genome-wide methylation change from benign to advanced
cancerous cell occurs with a trend during carcinogenesis.
Identification of hypermethylated genes
with consistent change of methylation according to cancer
stages
Genes showing a gradual increase or decrease
alongside tumor development were identified by comparing their
methylation levels after screening statistically significant genes
(Table II). First, observations
with adjusted p-values ≥0.05 were removed, and thus excluded from
further analysis. Then, using an MS Excel-based filtering
procedure, genes of which methylation level consistently increases
or decreases as the tumor cell lines develops into the higher
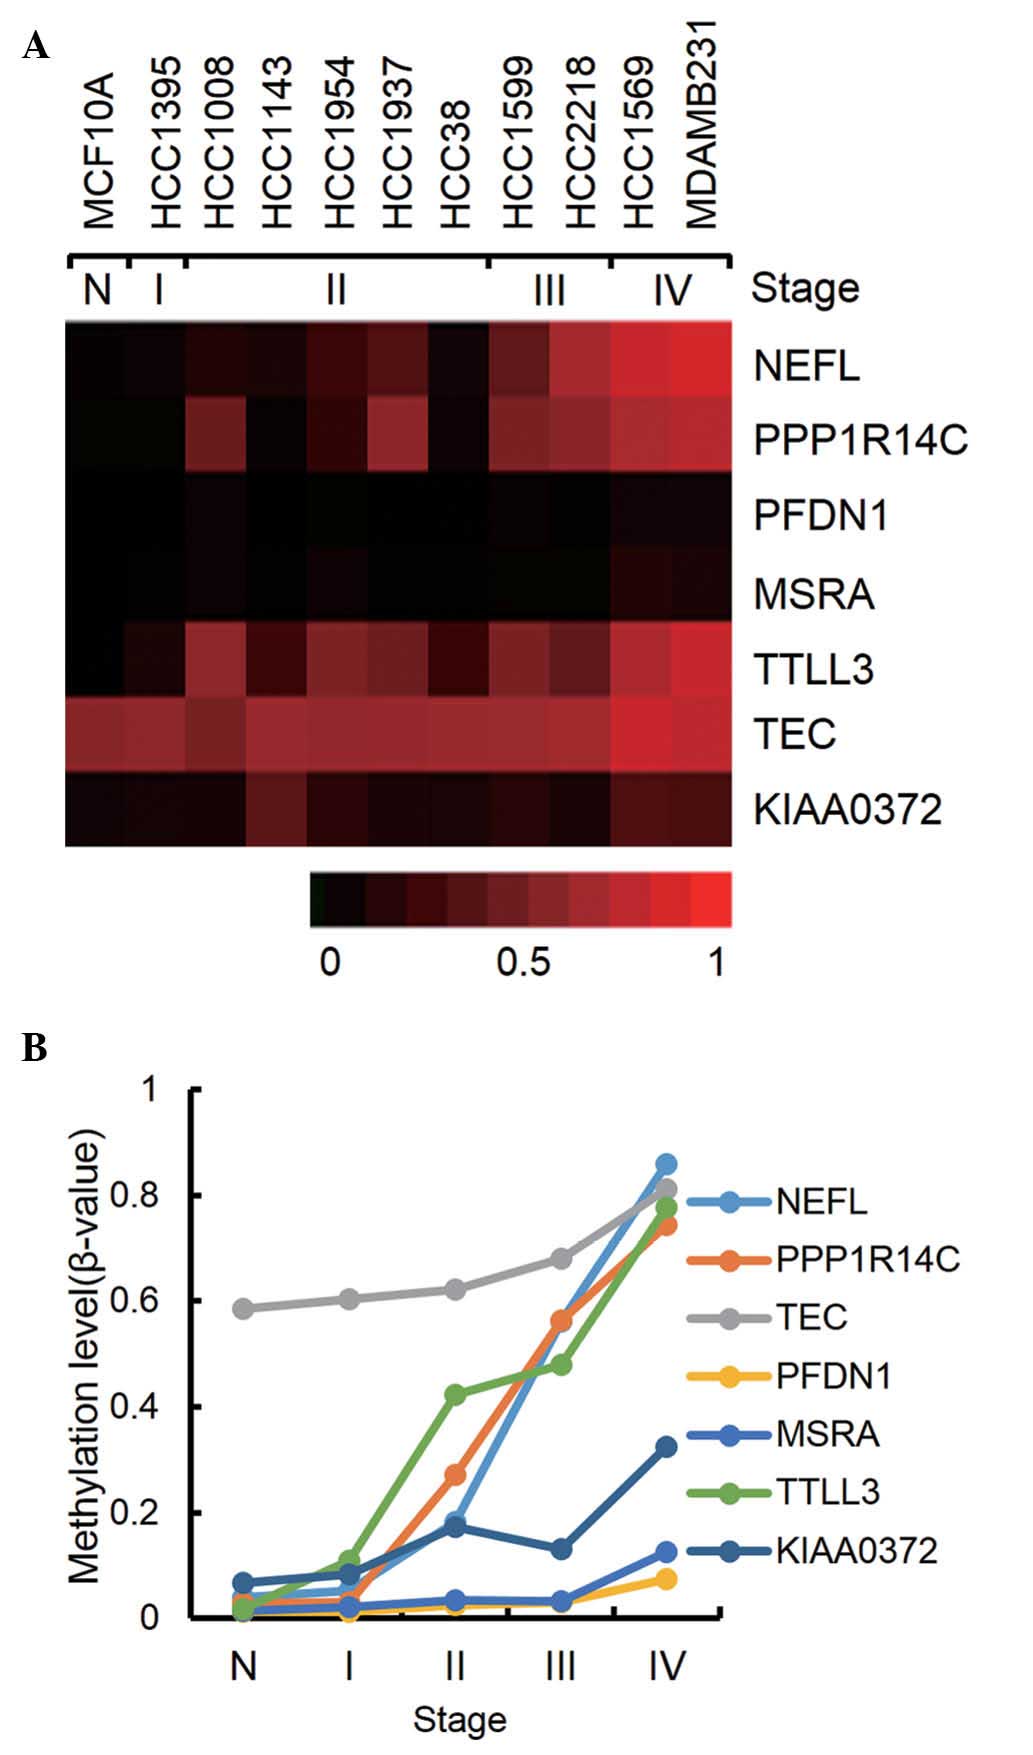
cancer stage were selected. As shown in Fig. 2, seven genes were revealed to be
consistently hypermethylated. It is notable that NEFL, PPP1R14C and
TTLL3 showed a step-wise increase of methylation through all the
stage from 3.0–17% methylation at stage I to 74–86% methylation at
stage IV. For the hypomethylated genes in cancer, no remarkable
genes were found, which showed a consistent decrease of methylation
from normal cells to stage IV cancer cells (data not shown).
PPP1R14C is a protein phosphatase 1 inhibitor, and has been
previously identified as an upregulating gene after induction of
demethylation in melanoma cell lines (21). TTLL3 is a tubulin glycine ligase
which regulates the assembly of microtubules, of which the
relevance with cancer has yet to be elucidated (22).
| Table II.Genes displaying consistently
increasing methylation pattern according to cancer development in
breast cancer cell lines. |
Table II.
Genes displaying consistently
increasing methylation pattern according to cancer development in
breast cancer cell lines.
| | | Stage |
|---|
|
|---|
| Gene | Accession no. | Description | Normal | I | II | III | IV |
|---|
| NEFL | NM_006158.1 | Neurofilament;
light polypeptide 68 kDa | 0.04a | 0.05 | 0.18 | 0.56 | 0.86 |
| PPP1R14C | NM_030949.1 | Protein phosphatase
1; regulatory (inhibitor) subunit 14C; serologically defined breast
cancer antigen NY-BR-81 | 0.03 | 0.03 | 0.27 | 0.56 | 0.74 |
| TEC | NM_003215.1 | Tec protein
tyrosine kinase | 0.59 | 0.60 | 0.62 | 0.68 | 0.81 |
| PFDN1 | NM_002622.3 | Prefoldin 1 | 0.01 | 0.01 | 0.03 | 0.03 | 0.07 |
| MSRA | NM_012331.2 | Methionine
sulfoxide reductase A | 0.01 | 0.02 | 0.04 | 0.03 | 0.13 |
| TTLL3 | NM_015644.2 | Tubulin tyrosine
ligase-like family; tubulin-tyrosine ligase activity | 0.02 | 0.11 | 0.42 | 0.48 | 0.78 |
| KIAA0372 | NM_014639.2 | Hypothetical
protein LOC9652; structural constituent of ribosome | 0.07 | 0.08 | 0.17 | 0.13 | 0.33 |
NEFL is downregulated by hypermethylation
in breast cancer
To reveal the effect of methylation on gene
expression for the in silico identified genes, and thereby
to develop potential epigenetic breast cancer markers, NEFL,
which has shown a consistent increase of methylation, was selected
and examined for its promoter methylation and expression in both
cell lines and tissues. NEFL is a component of the three-subunit
protein, neuronal intermediate filament (23). In addition to its influence on the
nervous system, NEFL has been shown to act as a tumor suppressor in
several types of cancer (24).
However, the epigenetic mechanism of the downregulation has not
been elucidated.
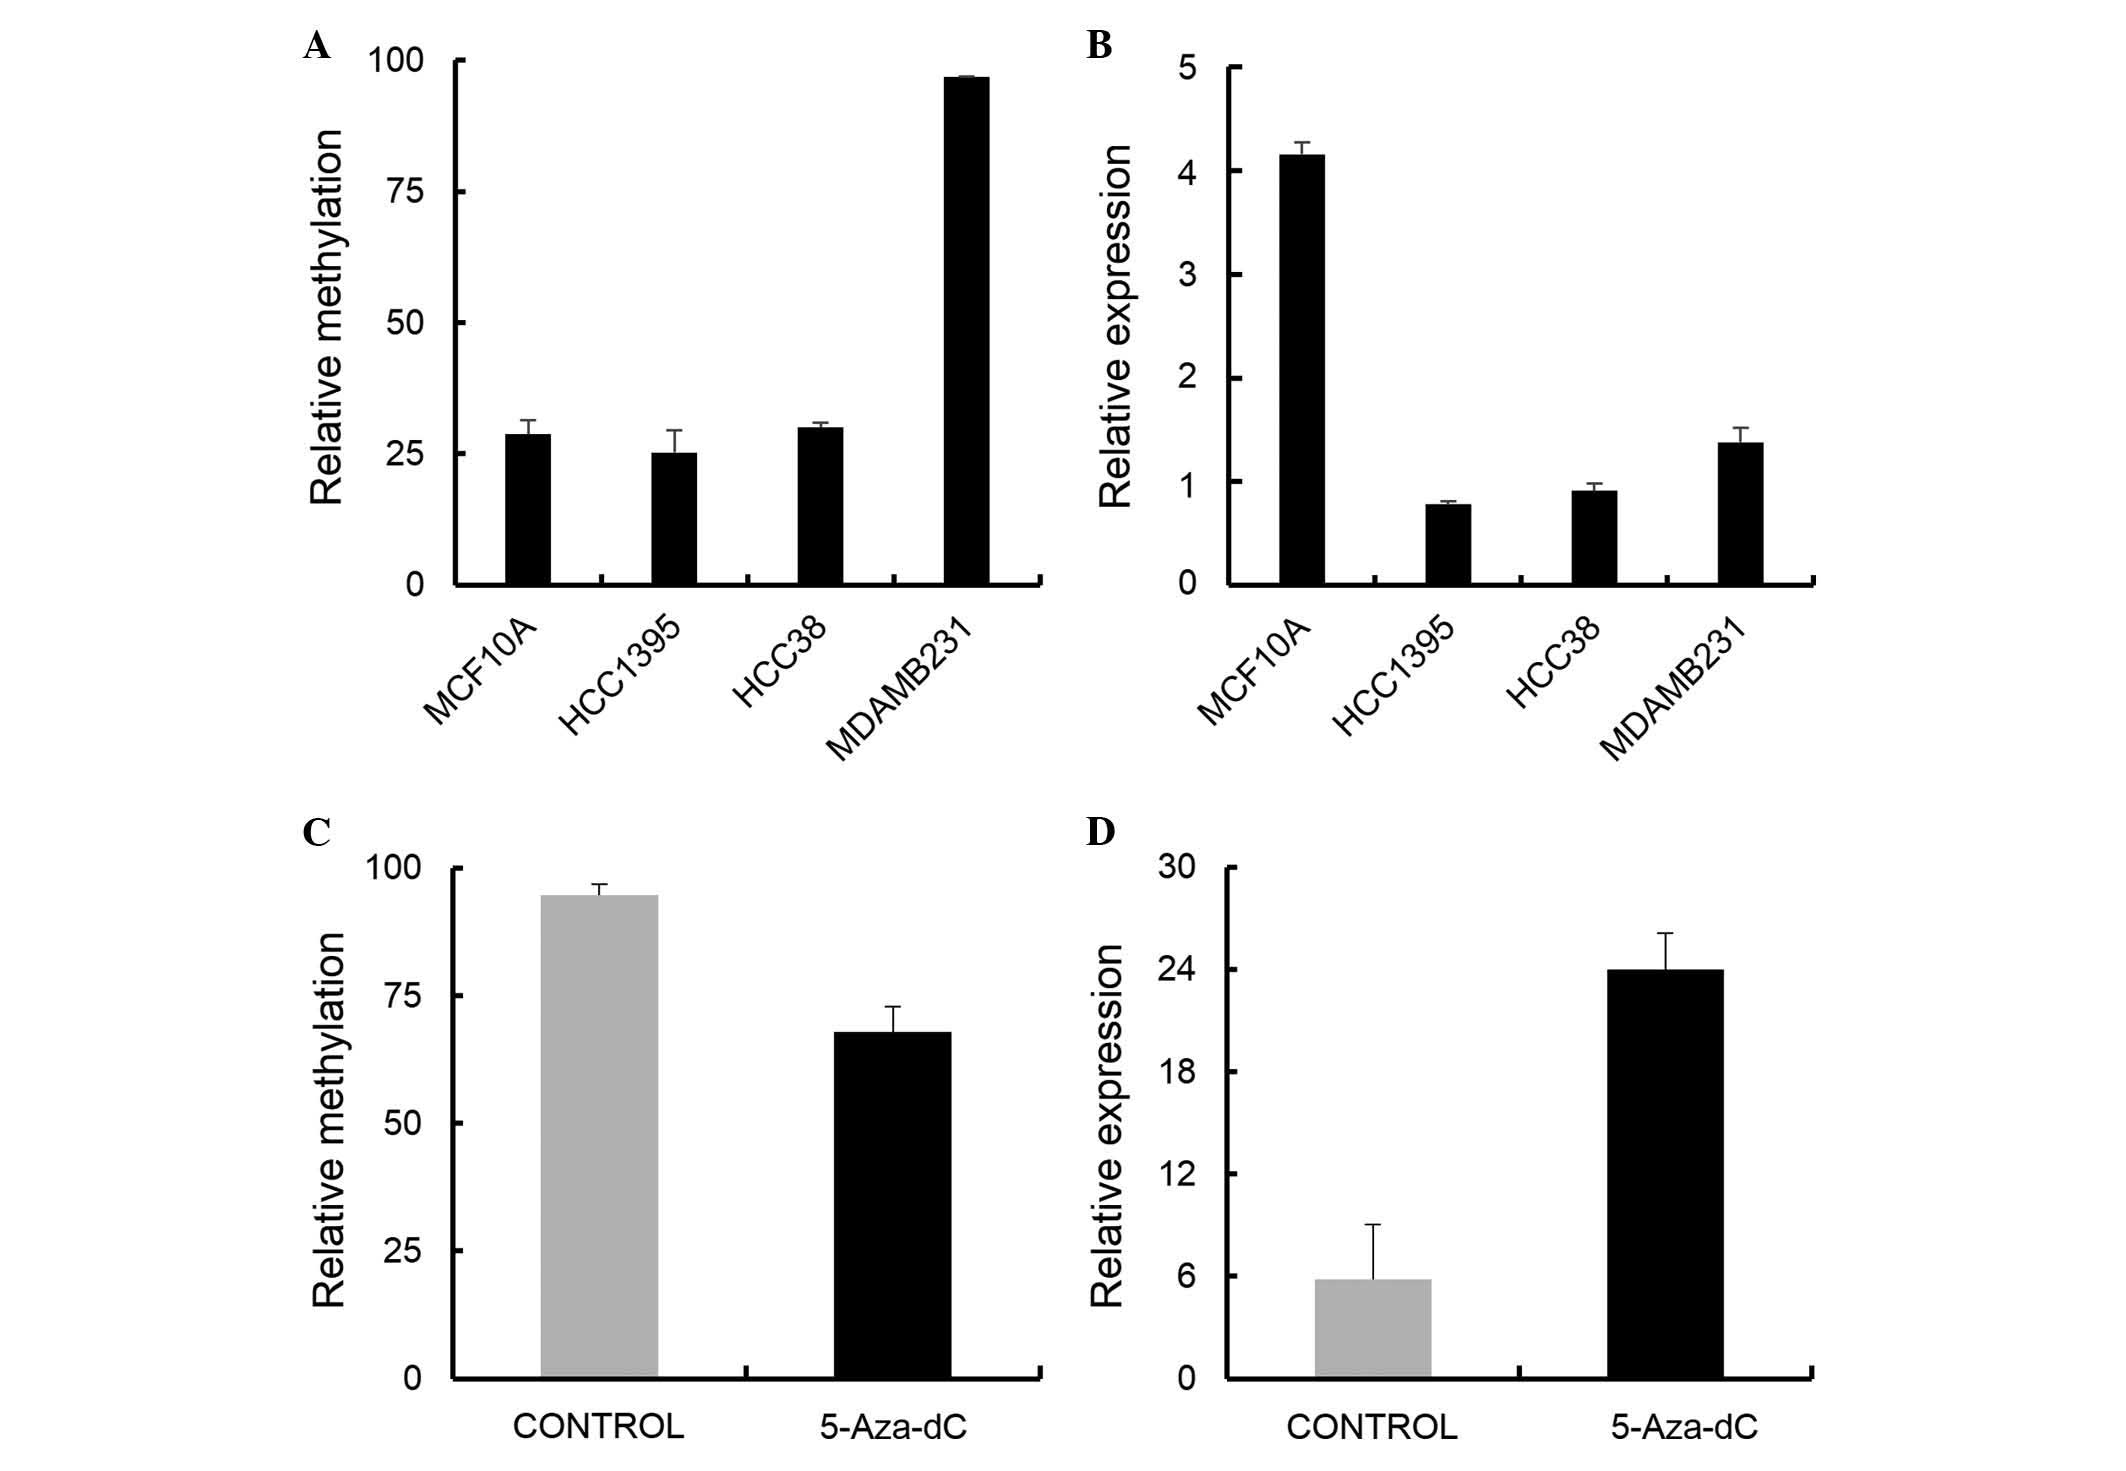
It was found that NEFL was downregulated in all
examined cancer cell lines of stages I, II, and IV, compared to the
normal cell line (Fig. 3B).
Induction of demethylation by 5-Aza-dC in the MDA-MB-231 cells
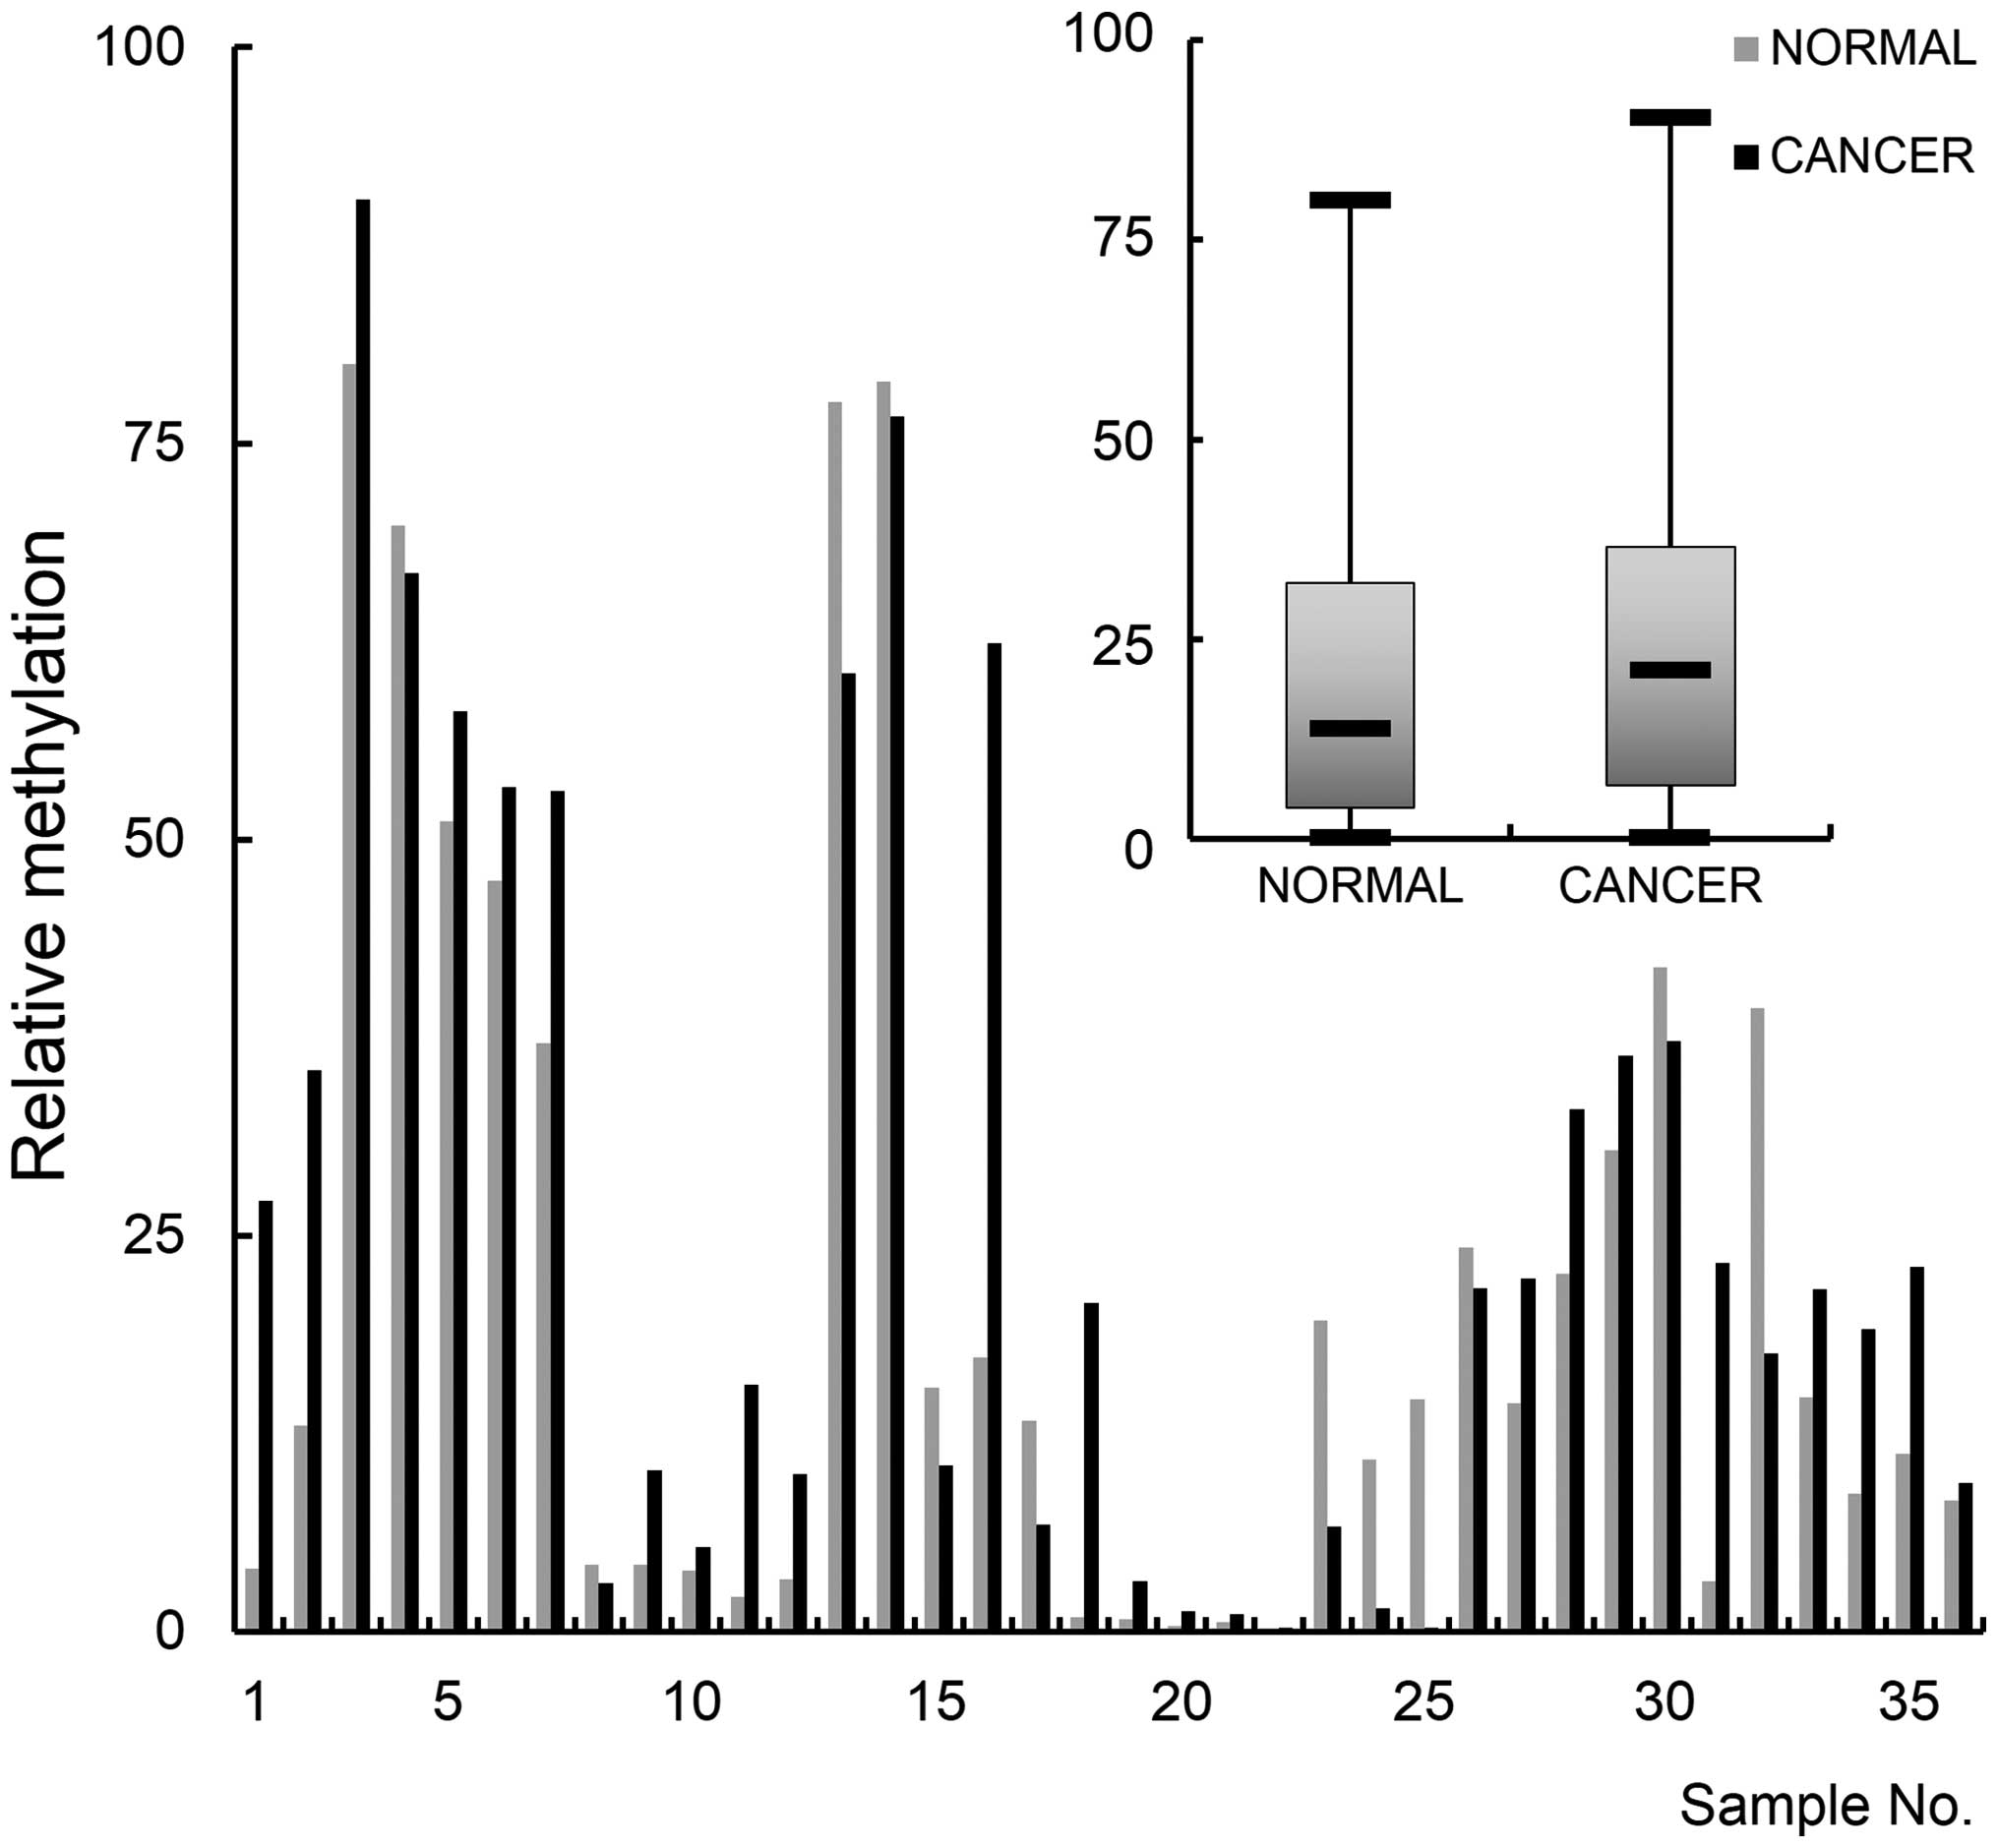
recovered the expression with a 4-fold increase (Fig. 3D). Next, NEFL was examined for its
methylation and expression in breast cancer tissues. Thirty-six
pairs of cancer tissue and normal tissues from the same area were
examined for promoter methylation by MSP analysis. The result
indicated that the gene is hypermethylated in cancer tissues
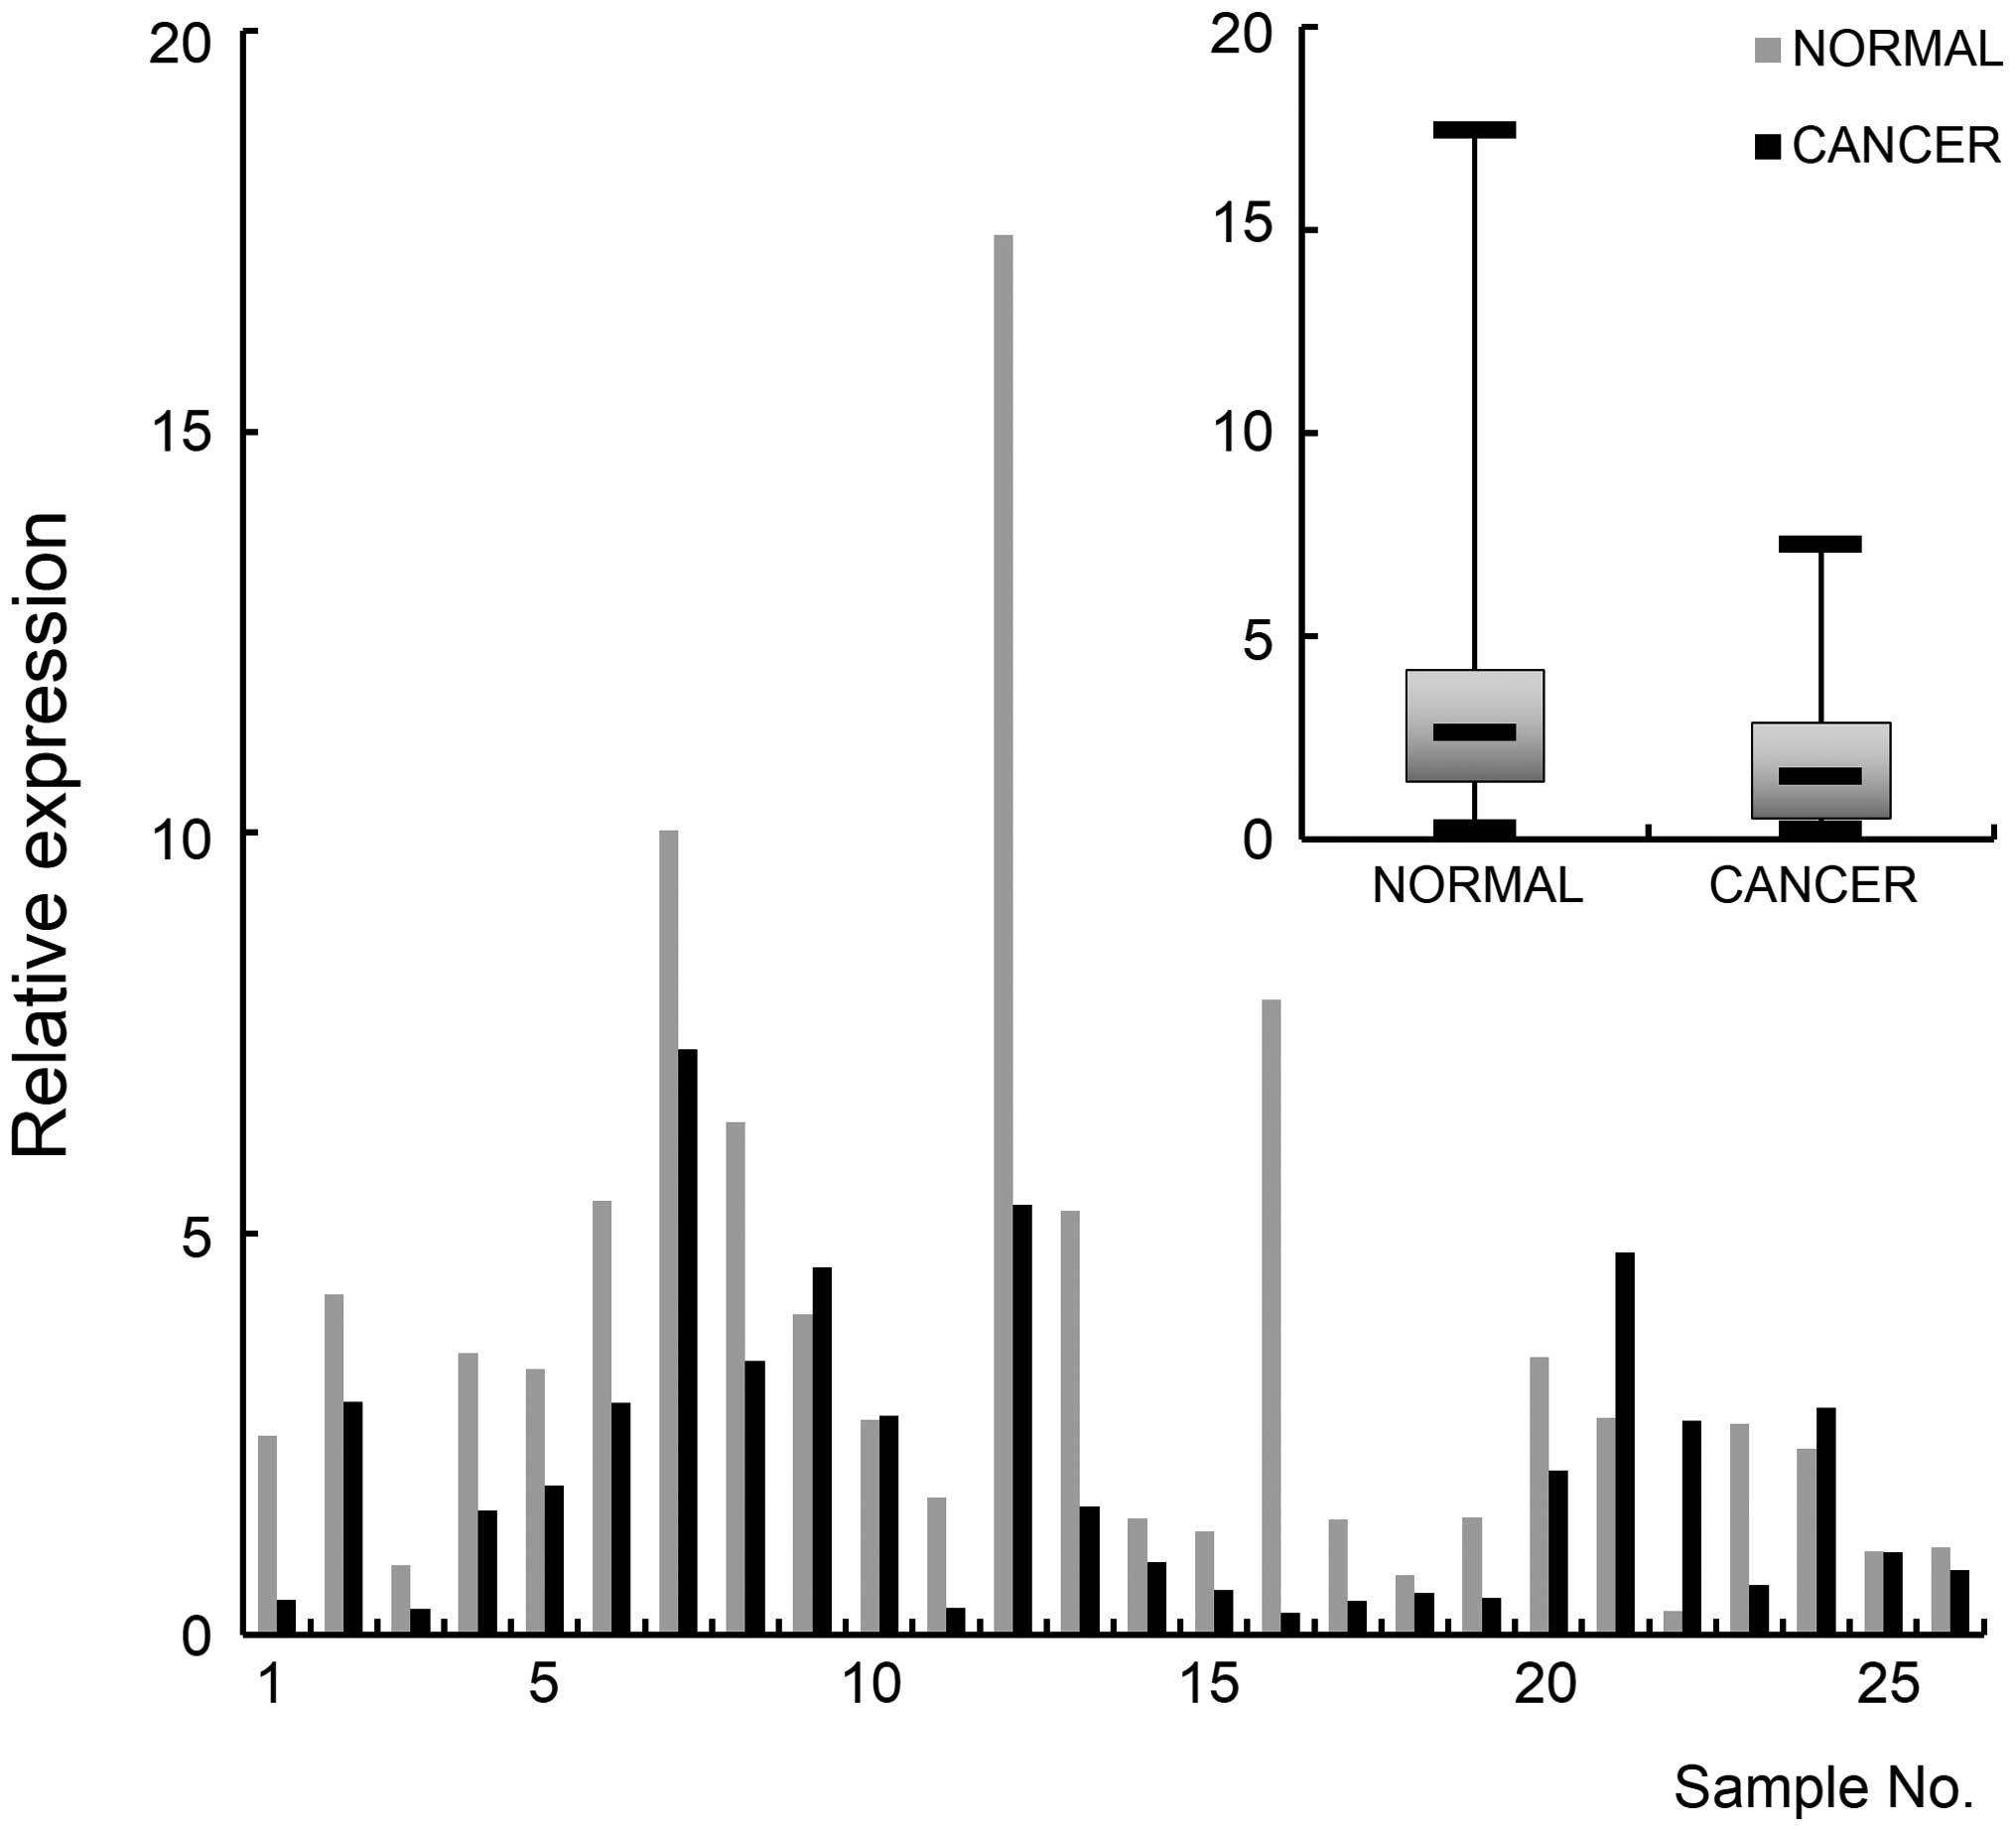
compared to normal tissues (p<0.05) (Fig. 4). Real-time RT-PCR was carried out
to monitor NEFL expression and the result indicated that the gene
is downregulated in cancer tissues (p<0.01) (Fig. 5). These molecular experimental
results together with the in silico data suggest that NEFL
could be developed as an epigenetic marker for breast cancer.
Discussion
This study was carried out with the aim of
identifying breast cancer stage-specific markers which are
regulated by promoter methylation, and which show a consistent
increase or decrease of methylation level during carcinogenesis.
Cluster analysis determined that there was a significant
correlation between genome-wide methylation and cancer stage,
possibly implying that genome-wide methylation at each cancer stage
poses its unique pattern and also changes following the cancer
stages.
In terms of DNA methylation, cancer cells show
global hypomethylation and site-specific promoter hypermethylation
(25,26). When the methylation level of the
26,250 filtered genes from the database were summed up, there was
no significant difference between the normal cell lines and various
cancer stages. Furthermore, only a few genes showed a consistent
increase of methylation as the cancer cell line stage increased.
These facts may indicate that the genome-wide methylation at the
promoters undergo dynamic hypermethylation as well as
hypomethylation depending on specific genes. However, it should be
mentioned that the data from the database did not cover the whole
CpG sites of the genome.
Genome-wide analysis identified candidate genes
showing a consistently increasing methylation pattern. It still
remains controversial when cancer-related genes are methylated
during carcinogenesis. Early onset of methylation helps make DNA
methylation biomarkers attractive predictors for the development of
effective diagnostic tests for the early detection of neoplasia
(27). The late stage onset of
methylation may be difficult to detect at the early stages of
carcinogenesis. Nonetheless, there appeared gene sets which showed
the highest methylation at a specific cancer stage. These results
imply that the specific cancer stage is predictable using the
stage-specific methylation markers. To do this, however, the
methylation data for candidate genes should be accumulated from a
larger collection of cancer tissues.
In previous studies, loss of heterozygosity pattern
on the human chromosomal region 8p12-p21 harboring the NEFL
gene was frequently observed in breast carcinoma, suggesting its
role as a tumor suppressor (28).
This is in accordance with another study where NEFL expression was
downregulated in malignant breast cancer (24). The relationship between promoter
methylation and expression is known only in head and neck cancer
(29). In the study, NEFL was
identified as a hypermethylated gene associated with resistance to
cisplatin-based chemotherapy in head and neck cancer. However, no
analysis of the relationship between promoter methylation and
expression has been carried out in cancer.
The database adopted in this study contains only
methylation data from ER− cancer cell lines due to the
incompleteness of ER+ cell lines, and due to the lack of
ER status information for cancer tissues. It is known that ER
affects the promoter methylation as well as the expression of
specific genes. In general, ER-positive tumors displayed more
hypermethylated loci than ER-negative tumors. However, the
hypermethylated loci in ER-negative tumors were clustered closer to
the transcriptional start site compared with ER-positive tumors
(20). At the gene level,
ER+ and ER− cancer displayed different sets
of hypermethylated or hypomethylated genes. MGMT, involved in
direct DNA repair, was frequently hypermethylated in the
triple-negative (ER/PgR/Her3 negative) breast cancer (30). Meanwhile, FAM124B and ST6GALNAC1
were hypermethylated in ER+/PR+ breast cancer
(31). In addition, methylation of
miRNAs also showed association with ER status. The promoter of the
hsa-mir-200b cluster is hyper-methylated in breast cancer and its
methylation is associated with the loss of either estrogen receptor
or progesterone receptor (19).
Taken together, we found that genome-wide
methylation status is closely related with the specific stage of
breast cancer development, implying a gradual change of global
methylation during carcinogenesis. In addition, a subset of genes
showed a gradual increase or decrease of methylation in accordance
with breast cancer development in cell lines with a sudden change
from stage II to stage IV. NEFL, identified in silico
as a gene showing a gradual increase of methylation level, was
proven to be upregulated in breast cancer tissue as well as cell
lines. Further investigation into the mechanisms leading to
differential methylation status with breast tumor stage and
progression may provide additional insights, which could prove
useful in estimating prognosis and determining treatment
options.
Abbreviations:
|
5-Aza-dC
|
5-aza-2′-deoxycytidine;
|
|
CpG
|
cytosine guanine dinucleotide;
|
|
ER
|
estrogen receptor;
|
|
MSP
|
methylation-specific PCR;
|
|
RT-PCR
|
reverse transcription-polymerase chain
reaction
|
Acknowledgements
The authors thank S.H. Kang for his
contribution to preparation of the manuscript. This study was
supported by the Basic Science Research Program
(NRF-2012R1A1A2040830) and Korea-China Joint Program
(NRF-2011-616-C00056) through the National Research Foundation of
Korea (NRF), funded by the Ministry of Education, Science and
Technology, and by a National Science Foundation of China (NSFC)
Grant (nos. 81172747 and 81111140396).
References
|
1.
|
Pare R, Yang T, Shin JS and Lee CS: The
significance of the senescence pathway in breast cancer
progression. J Clin Pathol. 66:491–495. 2013. View Article : Google Scholar : PubMed/NCBI
|
|
2.
|
Harburg GC and Hinck L: Navigating breast
cancer: axon guidance molecules as breast cancer tumor suppressors
and oncogenes. J Mammary Gland Biol Neoplasia. 16:257–270. 2011.
View Article : Google Scholar : PubMed/NCBI
|
|
3.
|
Shi L, Sun L, Li Q, et al: Histone
demethylase JMJD2B coordinates H3K4/H3K9 methylation and promotes
hormonally responsive breast carcinogenesis. Proc Natl Acad Sci
USA. 108:7541–7546. 2011. View Article : Google Scholar : PubMed/NCBI
|
|
4.
|
Krell J, Frampton AE, Jacob J, Castellano
L and Stebbing J: miRNAs in breast cancer: ready for real time?
Pharmacogenomics. 13:709–719. 2012. View Article : Google Scholar : PubMed/NCBI
|
|
5.
|
Kang JH, Kim SJ, Noh DY, et al:
Methylation in the p53 promoter is a supplementary route to breast
carcinogenesis: correlation between CpG methylation in the p53
promoter and the mutation of the p53 gene in the progression from
ductal carcinoma in situ to invasive ductal carcinoma. Lab Invest.
81:573–579. 2001. View Article : Google Scholar
|
|
6.
|
Yan PS, Shi H, Rahmatpanah F, et al:
Differential distribution of DNA methylation within the RASSF1A CpG
island in breast cancer. Cancer Res. 63:6178–6186. 2003.PubMed/NCBI
|
|
7.
|
Matros E, Wang ZC, Lodeiro G, Miron A,
Iglehart JD and Richardson AL: BRCA1 promoter methylation in
sporadic breast tumors: relationship to gene expression profiles.
Breast Cancer Res Treat. 91:179–186. 2005. View Article : Google Scholar : PubMed/NCBI
|
|
8.
|
Faryna M, Konermann C, Aulmann S, et al:
Genome-wide methylation screen in low-grade breast cancer
identifies novel epigenetically altered genes as potential
biomarkers for tumor diagnosis. FASEB J. 26:4937–4950. 2012.
View Article : Google Scholar
|
|
9.
|
Van Hoesel AQ, Sato Y, Elashoff DA, et al:
Assessment of DNA methylation status in early stages of breast
cancer development. Br J Cancer. 108:2033–2038. 2013.PubMed/NCBI
|
|
10.
|
Miyamoto K, Fukutomi T, Akashi-Tanaka S,
et al: Identification of 20 genes aberrantly methylated in human
breast cancers. Int J Cancer. 116:407–414. 2005. View Article : Google Scholar : PubMed/NCBI
|
|
11.
|
Chen ST, Lin SY, Yeh KT, et al:
Mutational, epigenetic and expressional analyses of caveolin-1 gene
in breast cancers. Int J Mol Med. 14:577–582. 2004.PubMed/NCBI
|
|
12.
|
Hu M, Yao J, Cai L, et al: Distinct
epigenetic changes in the stromal cells of breast cancers. Nat
Genet. 37:899–905. 2005. View
Article : Google Scholar : PubMed/NCBI
|
|
13.
|
Sebova K, Zmetakova I, Bella V, et al:
RASSF1A and CDH1 hypermethylation as potential epimarkers in breast
cancer. Cancer Biomark. 10:13–26. 2011.PubMed/NCBI
|
|
14.
|
Mohammad J, Zeerak A and Hjerten S:
Dye-ligand affinity chromatography on continuous beds. Biomed
Chromatogr. 9:80–84. 1995. View Article : Google Scholar : PubMed/NCBI
|
|
15.
|
Jeschke J, Van Neste L, Glockner SC, et
al: Biomarkers for detection and prognosis of breast cancer
identified by a functional hypermethylome screen. Epigenetics.
7:701–709. 2012. View Article : Google Scholar : PubMed/NCBI
|
|
16.
|
Fernandez SV, Snider KE, Wu YZ, Russo IH,
Plass C and Russo J: DNA methylation changes in a human cell model
of breast cancer progression. Mutat Res. 688:28–35. 2010.
View Article : Google Scholar : PubMed/NCBI
|
|
17.
|
Loss LA, Sadanandam A, Durinck S, et al:
Prediction of epigenetically regulated genes in breast cancer cell
lines. BMC Bioinformatics. 11:3052010. View Article : Google Scholar : PubMed/NCBI
|
|
18.
|
Kim JH, Kang HS, Kim TW and Kim SJ:
Differential methylation hybridization profiling identifies
involvement of STAT1-mediated pathways in breast cancer. Int J
Oncol. 39:955–963. 2011.PubMed/NCBI
|
|
19.
|
Wee EJ, Peters K, Nair SS, et al: Mapping
the regulatory sequences controlling 93 breast cancer-associated
miRNA genes leads to the identification of two functional promoters
of the Hsa-mir-200b cluster, methylation of which is associated
with metastasis or hormone receptor status in advanced breast
cancer. Oncogene. 31:4182–4195. 2012.
|
|
20.
|
Fackler MJ, Umbricht CB, Williams D, et
al: Genome-wide methylation analysis identifies genes specific to
breast cancer hormone receptor status and risk of recurrence.
Cancer Res. 71:6195–6207. 2011. View Article : Google Scholar : PubMed/NCBI
|
|
21.
|
Bonazzi VF, Irwin D and Hayward NK:
Identification of candidate tumor suppressor genes inactivated by
promoter methylation in melanoma. Genes Chromosomes Cancer.
48:10–21. 2009. View Article : Google Scholar : PubMed/NCBI
|
|
22.
|
Wloga D, Webster DM, Rogowski K, et al:
TTLL3 is a tubulin glycine ligase that regulates the assembly of
cilia. Dev Cell. 16:867–876. 2009. View Article : Google Scholar : PubMed/NCBI
|
|
23.
|
Abe A, Numakura C, Saito K, et al:
Neurofilament light chain polypeptide gene mutations in
Charcot-Marie-Tooth disease: nonsense mutation probably causes a
recessive phenotype. J Hum Genet. 54:94–97. 2009. View Article : Google Scholar
|
|
24.
|
Li XQ, Li L, Xiao CH and Feng YM: NEFL
mRNA expression level is a prognostic factor for early-stage breast
cancer patients. PLoS One. 7:e311462012. View Article : Google Scholar : PubMed/NCBI
|
|
25.
|
Shen L, Kondo Y, Guo Y, et al: Genome-wide
profiling of DNA methylation reveals a class of normally methylated
CpG island promoters. PLoS Genet. 3:2023–2036. 2007. View Article : Google Scholar : PubMed/NCBI
|
|
26.
|
Sincic N and Herceg Z: DNA methylation and
cancer: ghosts and angels above the genes. Curr Opin Oncol.
23:69–76. 2011. View Article : Google Scholar : PubMed/NCBI
|
|
27.
|
Carmona FJ and Esteller M: DNA methylation
in early neoplasia. Cancer Biomark. 9:101–111. 2010.PubMed/NCBI
|
|
28.
|
Seitz S, Werner S, Fischer J, Nothnagel A,
Schlag PM and Scherneck S: Refined deletion mapping in sporadic
breast cancer at chromosomal region 8p12-p21 and association with
clinicopathological parameters. Eur J Cancer. 36:1507–1513. 2000.
View Article : Google Scholar : PubMed/NCBI
|
|
29.
|
Chen B, Chen J, House MG, Cullen KJ,
Nephew KP and Guo Z: Role of neurofilament light polypeptide in
head and neck cancer chemoresistance. Mol Cancer Res. 10:305–315.
2012. View Article : Google Scholar : PubMed/NCBI
|
|
30.
|
Fumagalli C, Pruneri G, Possanzini P, et
al: Methylation of O6-methylguanine-DNA methyltransferase (MGMT)
promoter gene in triple-negative breast cancer patients. Breast
Cancer Res Treat. 134:131–137. 2012. View Article : Google Scholar : PubMed/NCBI
|
|
31.
|
Li L, Lee KM, Han W, et al: Estrogen and
progesterone receptor status affect genome-wide DNA methylation
profile in breast cancer. Hum Mol Genet. 19:4273–4277. 2010.
View Article : Google Scholar : PubMed/NCBI
|