Introduction
Hepatocellular carcinoma (HCC) is the fifth most
common solid cancer and the third most common cancer-related death
in the world (1). HCC is of
multifactorial origin. The three most frequent causes are chronic
hepatitis B virus (HBV) infection, chronic hepatitis C virus (HCV)
infection and alcoholic liver disease (2,3).
Other important risk factors include old age, male gender, chronic
liver diseases of other etiologies, aflatoxin exposure, diabetes
and liver cirrhosis (4–6). Because of the complex etiologies, the
major molecular pathways responsible for liver cancer development
remain elusive. Recent molecular and genomic studies have led to
the concept that hepatocarcinogenesis involves not only multiple
steps of molecular events but also heterogeneous cellular pathways
(7).
One important approach for the researchers to
understand the molecular processes linking to liver cancer cell
growth is to identify prognostic molecular markers in patients
receiving total resection of HCC. After standard procedure of
surgical resection, no grossly detectable tumor should remain.
These patients form a relatively homogeneous group in clinical
aspects and the periods of time to subsequent cancer recurrence
should reflect the growth behavior of the HCC cells. Thus, the
molecule with its expression level capable of predicting
postoperative survival is considered tightly associated with
hepatocarginogenesis and is believed to be a candidate of
anti-cancer targets. Based on this principle, many molecules have
been identified, such as proline-directed protein kinase F(A),
MKP-1 (a mitogen-activated protein kinase), vascular endothelial
growth factor, proliferating cell nuclear antigen, p53, TA (tissue
factor), cytokeratin-19, telomerase activity and interleukin-10
(8–16).
In almost all of these studies, HCC recurrence was
defined as development of either local recurrence (LR) or
extrahepatic metastasis (EHM). Thus, no clear distinction was made
between these two clinical conditions when calculating the
recurrence-free survival. However, in our clinical experience, LR
and EHM could occur in independent time sequence. In many patients,
LR could progress to a very advanced stage characterized by a huge
tumor involving both lobes of liver, portal vein thrombosis,
invasion to large vessels, and decompensated liver function, yet
EHM was still undetectable. On the other hand, in some patients,
EHM developed during postoperative follow-up in the absence of LR.
Recent studies indicated that development of EHM involved
particular molecular events linked to epithelial to mesenchymal
transition (17,18). Therefore, in this study, we aimed
to investigate whether LR and EHM involved different and separable
molecular and clinical predictors.
Patients and methods
Patients
This study was conducted under the approval of the
institutional review board, Chang Gung Medical Council, Taiwan. In
total, 289 pairs of cancer (denoted as ‘−T’) and non-cancer
(denoted as ‘−N’) liver tissues were retrieved from Tissue Bank,
Chang Gung Medical Cancer for our study. Of these tissues, 160
pairs were obtained from January, 2002 to December, 2005 (as the
training cohort) and 129 pairs were obtained from January, 2006 to
December, 2007 (as the verification cohort). All tissues were
frozen to −70°C immediately after surgical resection until used.
Clinicopathological data were reviewed including gender, age,
presence of liver cirrhosis, alcohol usage, Edmondson's histologic
grade, microvascular invasion, macrovascular invasion, presence of
tumor capsule, number of tumors, largest tumor size, presence of
ascites upon surgery, α-fetoprotein (AFP), albumin, bilirubin,
prothrombin time, creatinine, aspartate aminotransferase (AST),
alanine aminotransferase (ALT), date of surgical resection, date of
LR, date of EHM and date of last follow-up or HCC related death.
Patients with main portal vein thrombosis were excluded from
surgical management in this medical center. Minor portal vein
invasion discovered during or after surgery was categorized as
macrovascular invasion.
Diagnosis of HCC was made by one of the following
criteria: echo-guided liver biopsy, fine needle aspiration
cytology, high AFP level (>200 ng/ml) plus at least one dynamic
imaging study (dynamic computed tomography or magnetic resonance
imaging), or one dynamic imaging study plus angiography (if AFP
<200 ng/ml). Tumors were completely removed during surgical
procedure, with a safety-margin of >1 cm. The patients were
followed postoperatively by ultrasonography, chest X-ray, AFP, and
blood biochemistry every 1–3 months in the first year and every 3–6
months thereafter. Suspicious tumors were further studied by
computed tomography or magnetic resonance imaging. LR was
established by use of the aforementioned criteria for HCC
diagnosis. EHM was confirmed by tumor biopsy, aspiration cytology,
computed tomography or magnetic resonance imaging. The choice of
study was dependent upon the tumor locations and the condition of
patients.
HBV surface antigen (HBsAg) was measured by
radioimmunoassay (Ausria-II, HBsAg-RIA; Abbott Laboratories, North
Chicago, IL, USA). Anti-HCV antibody was measured by a
third-generation enzyme immunoassay (HCV EIA III; Abbott
Laboratories).
Western blot analysis
To assess the expression levels of a growth
regulatory signaling molecule in liver tissues, western blot
analysis was performed. The following antibodies were used: rabbit
anti-phosphatase and tension homolog (PTEN) antibody (Cell
Signaling Technology, Inc., Beverly, MA, USA); rabbit
anti-phospho-PTEN (ser380) antibody (Cell Signaling Technology);
rabbit anti-AKT antibody (Abcam Inc., Cambridge, UK); rabbit
anti-phospho-AKT (Ser473) antibody (Cell Signaling Technology);
rabbit anti-glycogen synthase kinase GSK)-3β antibody (Imgenex
Corp., San Diego, CA, USA); rabbit anti-phospho-GSK-3β (Ser9)
antibody (Cell Signaling Technology); rabbit anti-extracellular
signal-related kinase (ERK) 1/2 antibody (Cell Signaling
Technology); rabbit anti-phospho-ERK 1/2 (Thr202/Tyr204) antibody
(Cell Signaling Technology); rabbit anti-mammalian target of
rapamycin (mTOR) antibody (Abcam); rabbit anti-phospho-mTOR
(ser2448) antibody (Cell Signaling Technology). Following western
blotting, the expression levels were assessed by a densitometer.
The abundance of a protein expressed in HepG2 cells was assigned as
1 HepG2 unit (HU). The expression level of a protein in liver
tissue was calculated as its relative abundance compared to the
corresponding level in HepG2 cells.
Cell culture
HepG2 cells were maintained in minimal essential
medium containing 10% fetal bovine serum. The cells were grown to
90% confluence and harvested for western blot analysis. The
expression levels of signaling proteins detected in HepG2 cells
were used as a reference for comparison.
Protein clustering and heatmap
presentation
The protein levels assessed by western blotting and
normalized against their corresponding levels in HepG2 cells were
subjected for log10 transformation. A comparison of the means of
the log10-transformed values across groups was done by two sample
t-test with unequal variance. All P-values were two tailed. Protein
values were clustered by a bottom-up hierarchical clustering method
performed by the Cluster 3.0 software (19). Similarities of protein profiles
across the clinical samples were gauged by their Euclidean
distances of the normalized protein levels. Heatmaps were used to
visualize the result of clustering, where protein biomarkers are
sorted by their similarity in normalized levels. A spectrum of red
to green was used to visualize the relative ups and downs to the
average levels of the good-prognosis group of patients. The
heatmaps were generated by the Treeview software (20).
Statistical analysis
LR-free survival was calculated from the date of
surgery to the date of LR or last follow-up. EHM-free survival was
calculated from the date of surgery to the date of EHM or last
follow-up. Overall survival was calculated from the date of surgery
to the date of death or last follow-up. Univariate analysis was
performed by the Kaplan-Meier method and the log-rank test was used
to compare the survival curves between groups. To obtain a suitable
cutoff value for clinical application, the principle of minimal
P-value approach was adopted (21). Accordingly, experimental univariate
analysis was performed to assess the difference of LR-free survival
using a series of 5 cutoff values for each protein expression
level. The cutoff resulting in the smallest P-value was used for
further calculation. The 5 experimental cutoffs were calculated
using the following equation: The smallest value + n/6 x (The
largest value − The smallest value); n = 1–5.
The Cox proportional hazard model was used to
identify independent clinicopathological and signaling molecular
factors associated with postoperative survival. Statistical
analysis was conducted by the use of SPSS (version 13.0).
Results
Basic clinicopathological data for the
two cohorts of HCC patients
In this study 289 pairs of HCC tissues were
included. Of them, 160 pairs were assigned as the training cohort
to identify significant predictors, while 129 pairs were designated
as the verification cohort to examine the usefulness of the
candidate predictors. These two cohorts of patients were collected
from different periods of time (see Materials and methods) so that
the verified predictors could be more reliable when used in the
future. The basic clinicopathological data of the training cohort
of patients are listed in Table I.
In these HCC patients, more males were included. More HBV infected
patients (P=0.026) and more alcoholic patients (P=0.005) were found
in males, while more HCV infected patients (P=0.003) were found in
females. The basic clinicopathological data of the verification
cohort of patients are given in Table
II. Interestingly, the male preference for HBV infection and
female preference for HCV infection disappeared in the verification
cohort, while more male alcoholic patients (P<0.001) were still
observed. Additionally, a borderline (P= 0.043) significantly
higher AFP level was found in the female HCC patients in the
verification cohort. The differential etiology distribution between
the two cohorts suggested a likely change of HCC epidemiology over
time, since the two cohorts were collected in different periods of
time.
 | Table I.Basic clinical characterization of HCC
patients included. |
Table I.
Basic clinical characterization of HCC
patients included.
| Gender
| |
|---|
| Clinical
parameters | Female (n=41) | Male (n=119) | P-value |
|---|
| Age (years) | 57.6±13.1 | 55.3±15.5 | 0.360 |
| Cirrhosis | 20 (48.8%) | 57 (47.9%) | 0.933 |
| HBsAg-positive | 22 (53.7 %) | 88 (73.9 %) | 0.026 |
|
Anti-HCV-positive | 19 (46.3 %) | 25 (21.0%) | 0.003 |
| Tumor number | | | |
| 1 | 29 (70.7%) | 75 (63.0%) | 0.482a |
| 2 | 6 | 18 | |
| 3 | 5 | 19 | |
| 4 | 1 | 7 | |
| Size (diameter,
cm) | 6.9±4.8 | 6.8±4.7 | 0.906 |
| Ascites | 1 (2.4%) | 13 (10.9%) | 0.119 |
| α-fetoprotein
(ng/ml) | 45 (3–327500)b | 52 (0–286980)b | 0.717c |
| Albumin (g/dl) | 3.6±0.6 | 3.8±0.6 | 0.058 |
| Bilirubin
(mg/dl) | 1.1±1.0 | 1.3±1.8 | 0.265 |
| Prothrombin time
(sec) | 12.4±1.9 | 12.4±1.3 | 0.992 |
| Creatinine
(mg/dl) | 1.0±0.8 | 1.2±0.9 | 0.163 |
| AST (U/l) | 101.7±109.6 | 87.5±117.5 | 0.483 |
| ALT (U/l) | 68.8±67.0 | 81.9±109.6 | 0.367 |
| Alcoholism | 4 (9.8%) | 41 (34.5%) | 0.005 |
| Table II.Basic clinical characterization of
HCC patients included for verification. |
Table II.
Basic clinical characterization of
HCC patients included for verification.
| Gender
| |
|---|
| Clinical
parameters | Female (n=22) | Male (n=107) | P-value |
|---|
| Age (years) | 56.1±13.8 | 55.9±13.1 | 0.660 |
| Cirrhosis | 16 (72.7%) | 75 (70.1%) | 0.999 |
| HBsAg-positive | 15 (68.2%) | 86 (80.4%) | 0.327 |
|
Anti-HCV-positive | 11 (50.0%) | 31 (29.0%) | 0.096 |
| Tumor number | | | |
| 1 | 6 (27.3%) | 33 (30.8%) | 0.938a |
| 2 | 9 | 43 | |
| 3 | 5 | 20 | |
| 4 | 2 | 11 | |
| Size (diameter,
cm) | 4.9±4.4 | 5.9±4.0 | 0.296 |
| Ascites | 3 (13.6%) | 12 (11.2%) | 0.964 |
| α-fetoprotein
(ng/ml) | 231.5
(3.5–443209)b | 33.2
(2.0–45164)b | 0.043c |
| Albumin (g/dl) | 4.2±0.4 | 3.9±0.6 | 0.213 |
| Bilirubin
(mg/dl) | 0.9±0.3 | 1.5±1.9 | 0.089 |
| Prothrombin time
(sec) | 11.5±0.9 | 12.5±1.7 | 0.126 |
| Creatinine
(mg/dl) | 1.0±0.4 | 1.1±0.3 | 0.745 |
| AST (U/l) | 54.6±39.9 | 68.7±105.9 | 0.312 |
| ALT (U/l) | 59.7±54.7 | 89.9±165.2 | 0.217 |
| Alcoholism | 0 (0%) | 42 (39.3%) | <0.001 |
Clustering analysis revealed similar
expression profiles between the cancer and non-cancer tissues from
the same HCC patients
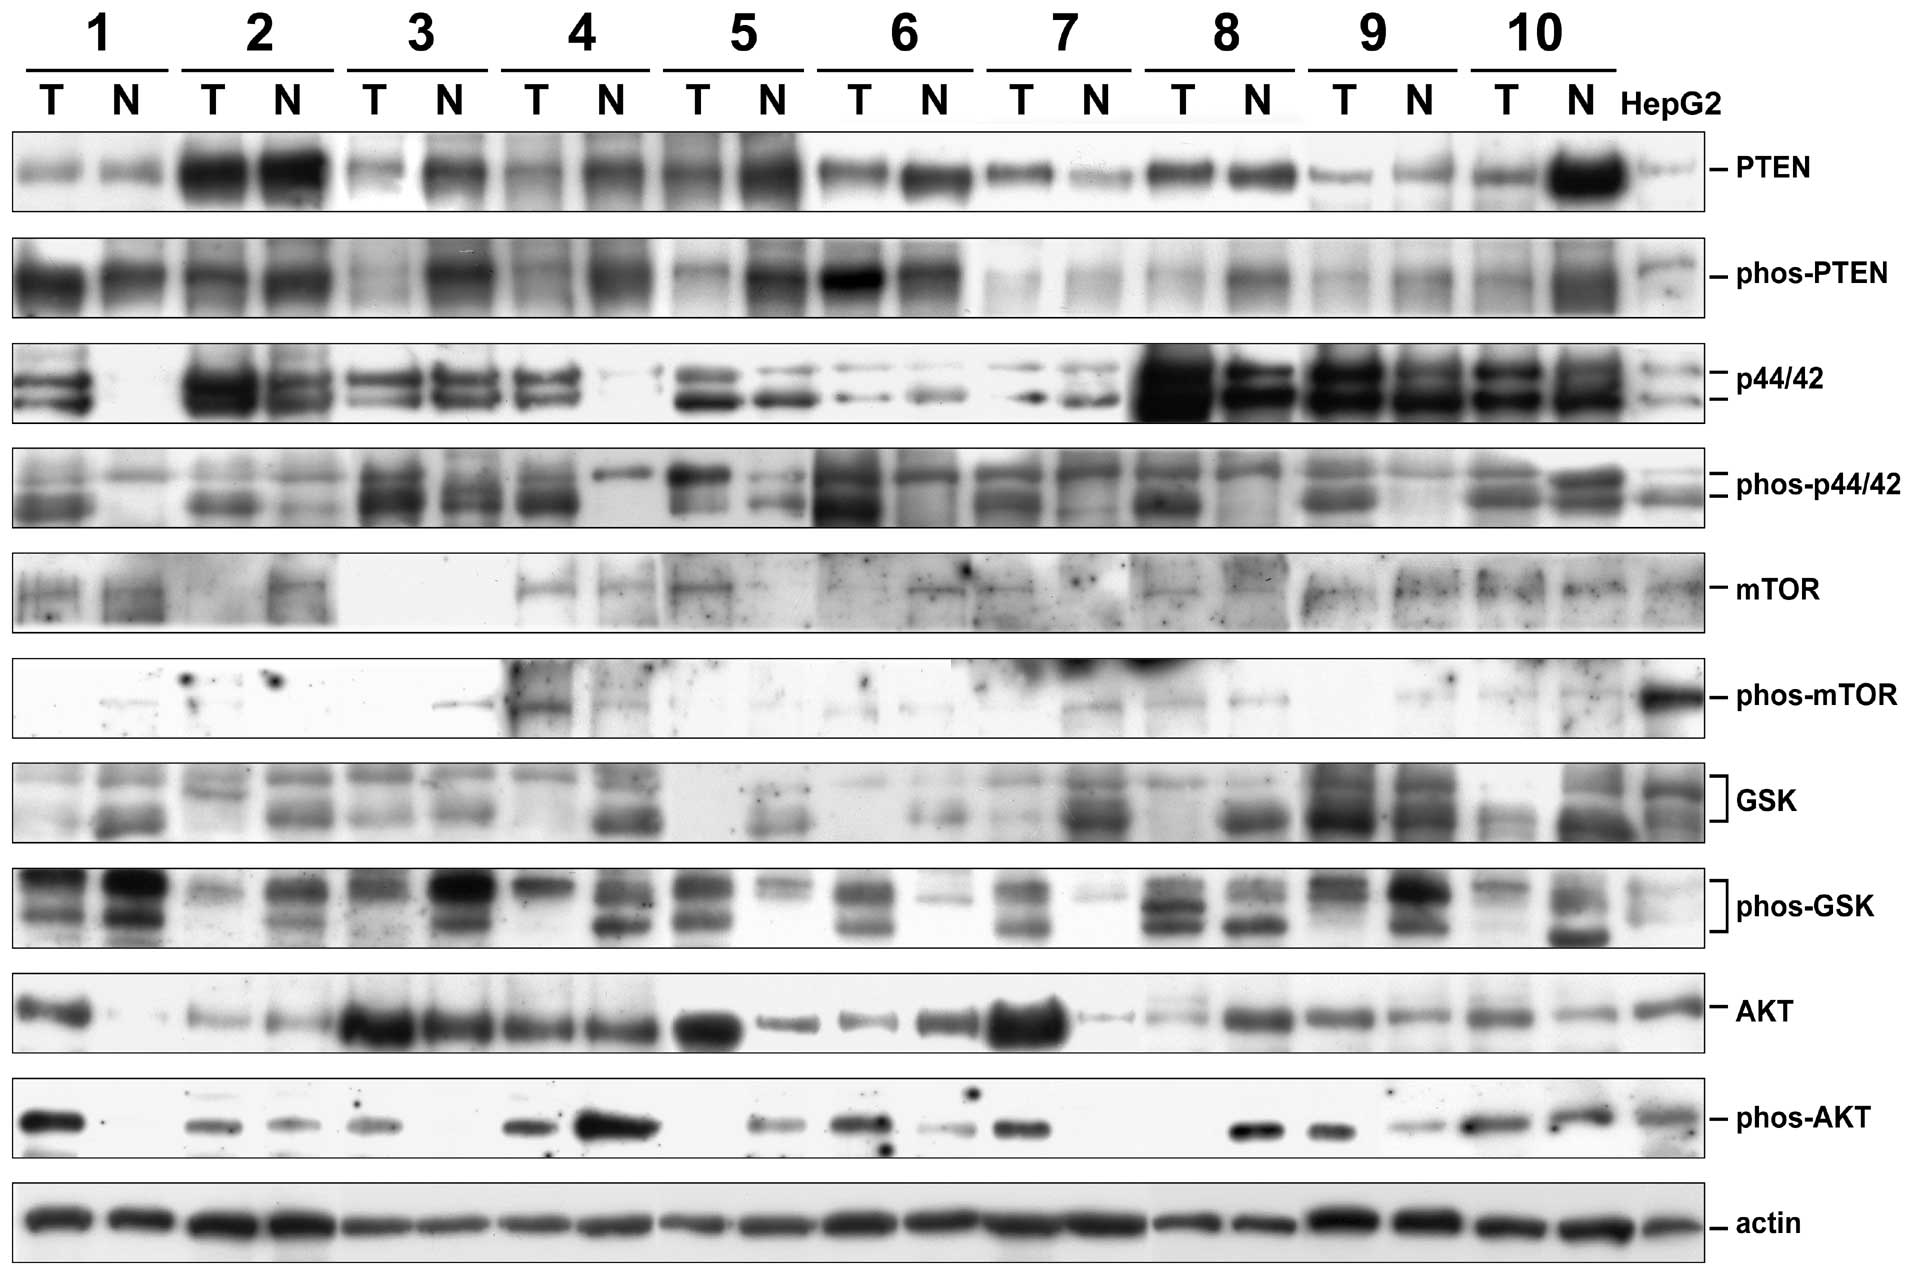
All cancer and non-cancer tissues were submitted for
western blot analysis to assess the expression levels of the total
and phosphorylated forms of six signaling proteins (Fig. 1). The loading amounts were
monitored by use of actin levels. All expression levels were
calculated as the HepG2 unit (HU) by assigning the expression level
in HepG2 cells as 1 HU. The ERK1 (p44) and ERK2 (p42) levels were
calculated separately because they were well-distinguishable. On
the other hand, the GSK-3α and β could not be well separated using
the anti-GSK-3β and the anti-phospho-GSK-3β antibodies. Two to
three bands migrating between the two expected positions in
different HCC tissues were observed. In this study, we thus
calculated the total GSK-3 (α plus β) levels. The phosporylated
ratios (PR) of the signaling proteins were calculated by dividing
the relative abundance of phosphorylated forms by the relative
abundance of the total forms. The cancer/non-cancer (denoted as
‘T/N’) ratios of all forms for all proteins were also
calculated.
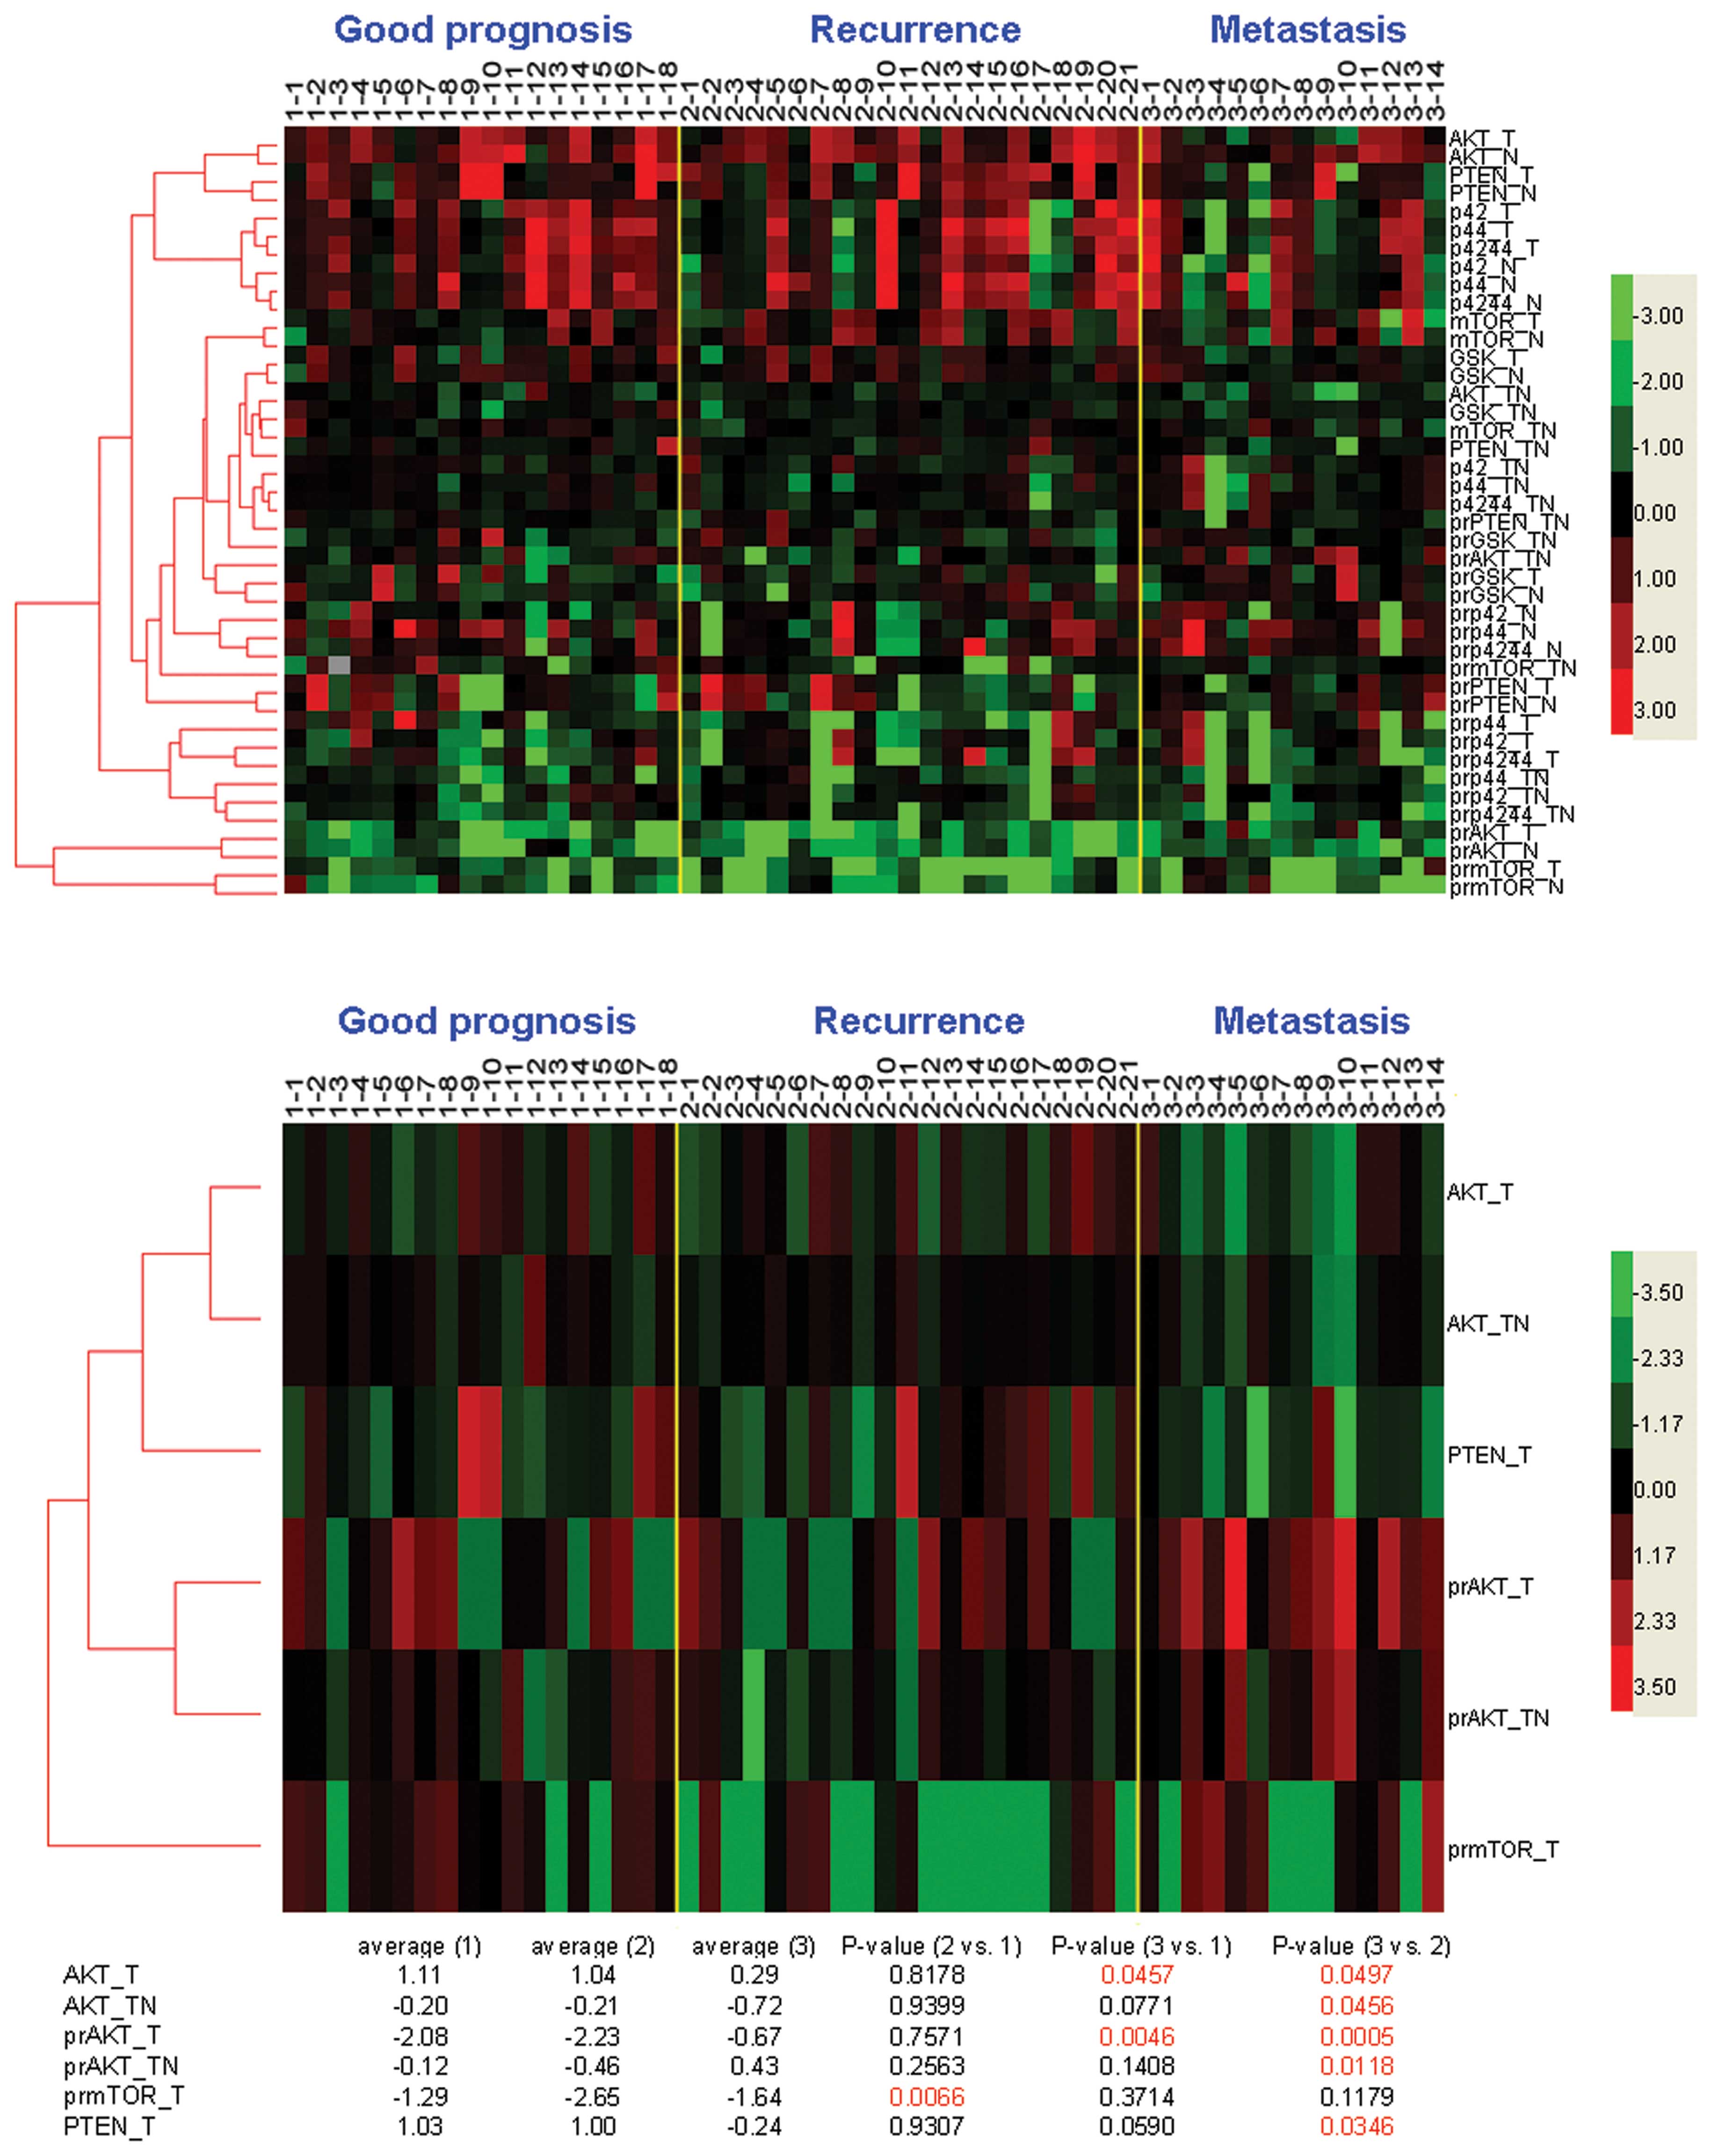
In terms of HCC recurrence, three groups of patients
with representative clinical courses could be identified. Of the
160 patients, 18 patients who had no tumor recurrence throughout
the follow-up periods (≥3 years) were considered the good prognosis
group, 21 patients who had LR within 1 year (but not EHM) were
assigned as the LR group, and 14 patients who had EHM within 1 year
were assigned as the metastasis group. A heatmap was constructed
for assessment (Fig. 2, upper
panel). Clustering analysis showed that the expression profiles
between the cancer (−T) and non-cancer (−N) tissues were similar
(clustered together) in most of the markers, while the expression
profiles between different signaling proteins were distantly
related (Fig. 2, upper panel). To
understand whether difference of protein expression existed between
the three types of HCC patients, the mean expression levels after
log10 transformation were compared (Fig. 2, bottom). Statistical analysis
showed that the means of the log10-transformed PR-mTOR-T values
were significantly different between the good prognosis and LR
group but not between the good prognosis and metastasis group
(Fig. 2, bottom). On the other
hand, the means of the log10-transformed AKT-T and PR-AKT-T values
were significantly different between the good prognosis and
metastasis group but not between the good prognosis and LR group.
Furthermore, significant differences were observed for the means of
the log10-transformed AKT-T, AKT-T/N, PR-AKT-T, PR-AKT-T/N, and
PTEN-T values between the LR and metastasis groups.
Univariate analysis of the signaling
proteins as predictors of LR and EHM
By use of the principle of minimal P-value method
(see Materials and methods), the best cutoffs for all expression
levels were used in calculating the LR-free survival association
(Table III). After corrected by
the Bonferroni method, borderline significance of the LR-free
survival difference was found in ERK1-T, ERK2-T, ERK(1+2)-T,
GSK-T/N, PR-ERK1-N, PR-PTEN-T/N and PR-ERK2-T/N levels. Only higher
PR-mTOR-T level (≥0.50) was considered significantly associated
with a better LR-free survival.
| Table III.Univariate analysis of signaling
molecule expression levels as predictors for LR-free survival in
postoperative HCC patients. |
Table III.
Univariate analysis of signaling
molecule expression levels as predictors for LR-free survival in
postoperative HCC patients.
| A, Protein
expression levels in HCC tissues |
|---|
|
|---|
| Parameter | Expression
levels | No. of
patients | Mean disease-free
survival (95% CI) | Log-rank
P-value |
|---|
| 1. Non-cancer
partsa | | | | |
| GSK | <16.5 HU | 135 | 40.5
(30.9–50.2) | |
| ≥16.5 HU | 21 | 27.2
(11.8–42.7) | 0.401 |
| PTEN | <3.85 HU | 82 | 38.6
(25.9–51.3) | |
| ≥3.85 HU | 73 | 37.2
(26.7–47.8) | 0.791 |
| mTOR | <0.40 HU | 36 | 31.4
(22.1–40.8) | |
| ≥0.40 HU | 120 | 38.8
(28.5–49.0) | 0.985 |
| p44 (ERK1) | <10.0 HU | 87 | 40.9
(28.6–53.1) | |
| ≥10.0 HU | 68 | 34.3
(23.3–45.3) | 0.400 |
| p42 (ERK2) | <45.5 HU | 130 | 40.4
(30.7–50.0) | |
| ≥45.5 HU | 25 | 23.4
(14.2–32.6) | 0.382 |
| ERK (1+2) | <16.0 HU | 102 | 40.9
(29.4–52.4) | |
| ≥16.0 HU | 53 | 33.6
(21.8–45.4) | 0.480 |
| AKT | <200 HU | 133 | 36.4
(27.2–45.6) | |
| ≥200 HU | 23 | 49.3
(28.8–69.8) | 0.336 |
| 2. Cancer
partsa | | | | |
| GSK | <8.50 HU | 126 | 37.9
(28.9–46.9) | |
| ≥8.50 HU | 30 | 35.6
(17.2–54.0) | 0.661 |
| PTEN | <3.00 HU | 87 | 35.3
(24.4–46.2) | |
| ≥3.00 HU | 68 | 40.0
(27.7–52.3) | 0.778 |
| mTOR | <0.33 HU | 38 | 23.3
(14.4–32.2) | |
| ≥0.33 HU | 118 | 41.4
(31.2–51.5) | 0.075 |
| p44 (ERK1) | <148.5 HU | 131 | 41.1
(31.7–50.5) | |
| ≥148.5 HU | 24 | 15.8
(6.4–25.1) | 0.027e |
| p42 (ERK2) | <0.60 HU | 40 | 20.8
(12.3–29.3) | |
| ≥0.60 HU | 115 | 42.3
(32.2–52.4) | 0.025e |
| ERK (1+2) | <48.0 HU | 128 | 42.9
(32.8–52.9) | |
| ≥48.0 HU | 27 | 17.5
(10.0–25.1) | 0.011e |
| AKT | <1.0 HU | 142 | 38.5
(29.7–47.3) | |
| ≥1.0 HU | 11 | 28.0
(10.4–45.6) | 0.951 |
| 3. Cancer
parts/non-cancer partsb | | | | |
| GSK | <0.65 | 61 | 25.0
(16.4–33.5) | |
| ≥0.65 | 95 | 47.8
(35.4–60.1) | 0.035e |
| PTEN | <0.52 | 33 | 37.6
(21.4–53.8) | |
| ≥0.52 | 122 | 38.7
(28.9–48.6) | 0.907 |
| mTOR | <1.04 | 87 | 35.8
(23.9–47.8) | |
| ≥1.04 | 69 | 39.6
(28.9–50.2) | 0.194 |
| p44 (ERK1) | <2.50 | 114 | 38.6
(28.1–49.1) | |
| ≥2.50 | 41 | 36.8
(22.3–51.2) | 0.877 |
| p42 (ERK2) | <1.80 | 120 | 41.7
(31.6–51.8) | |
| ≥1.80 | 35 | 25.8
(12.9–38.8) | 0.223 |
| ERK (1+2) | <1.34 | 111 | 41.7
(31.1–52.4) | |
| ≥1.34 | 44 | 29.4
(16.9–41.0) | 0.306 |
| AKT | <0.88 | 94 | 34.7
(24.8–44.6) | |
| ≥0.88 | 62 | 40.9
(27.3–54.5) | 0.333 |
| B, Relative ratios
of phosphorylated protein expression levels in HCC tissues |
|---|
|
|---|
| Parameter | Expression
levels | No. of
patients | Mean disease-free
survival (95% CI) | Log-rank
P-value |
|---|
| 1. Non-cancer
partsc | | | | |
| PR-GSK | <0.50 | 77 | 39.1
(26.9–51.3) | |
| ≥0.50 | 76 | 36.6
(25.0–48.2) | 0.824 |
| PR-PTEN | <1.87 | 101 | 40.1
(29.9–50.3) | |
| ≥1.87 | 59 | 33.0
(20.4–45.7) | 0.284 |
| PR-mTOR | <0.20 | 94 | 36.2
(25.9–46.4) | |
| ≥0.20 | 59 | 43.9
(28.8–59.1) | 0.550 |
| PR-p44 (ERK1) | <0.10 | 20 | 16.2
(5.5–26.8) | |
| ≥0.10 | 134 | 40.3
(31.1–49.5) | 0.031e |
| PR-p42 (ERK2) | <2.30 | 104 | 43.0
(32.0–53.9) | |
| ≥2.30 | 46 | 26.8
(14.8–38.8) | 0.215 |
| PR-ERK (1+2) | <3.50 | 92 | 40.7
(28.9–52.4) | |
| ≥3.50 | 62 | 33.7
(22.5–45.0) | 0.720 |
| PR-AKT | <0.01 | 34 | 57.2
(36.5–77.8) | |
| ≥0.01 | 119 | 33.3
(24.7–42.0) | 0.140 |
| 2. Cancer
partsc | | | | |
| PR-GSK | <0.60 | 84 | 38.9
(27.4–50.3) | |
| ≥0.60 | 68 | 36.7
(24.4–48.9) | 0.814 |
| PR-PTEN | <0.20 | 50 | 41.1
(27.3–54.8) | |
| ≥0.20 | 102 | 37.2
(26.6–47.8) | 0.595 |
| PR-mTOR | <0.50 | 58 | 24.0
(15.2–32.7) | |
| ≥0.50 | 102 | 49.8
(37.3–62.2) | 0.002f |
| PR-p44 (ERK1) | <0.89 | 76 | 43.2
(30.4–56.1) | |
| ≥0.89 | 72 | 31.2
(22.4–40.1) | 0.720 |
| PR-p42 (ERK2) | <2.40 | 111 | 42.4
(31.8–53.0) | |
| ≥2.40 | 38 | 32.2
(17.3–47.0) | 0.455 |
| PR-ERK (1+2) | <2.50 | 102 | 41.6
(31.2–52.0) | |
| ≥2.50 | 42 | 28.4
(14.7–42.1) | 0.341 |
| PR-AKT | <0.63 | 129 | 37.5
(28.0–46.9) | |
| ≥0.63 | 27 | 41.7
(23.1–60.2) | 0.854 |
| 3. Cancer
parts/non-cancer partsd | | | | |
| PR-GSK | <0.95 | 74 | 45.4
(32.2–58.5) | |
| ≥0.95 | 78 | 31.8
(21.5–42.1) | 0.189 |
| PR-PTEN | <1.16 | 104 | 44.2
(33.6–54.9) | |
| ≥1.16 | 47 | 21.1
(13.1–29.0) | 0.012e |
| PR-mTOR | <2.48 | 97 | 35.6
(26.3–44.9) | |
| ≥2.48 | 36 | 54.2
(27.8–80.5) | 0.228 |
| PR-p44 (ERK1) | <0.61 | 96 | 33.5
(24.7–42.4) | |
| ≥0.61 | 50 | 52.3
(33.6–71.1) | 0.190 |
| PR-p42 (ERK2) | <1.50 | 114 | 32.2
(23.7–40.7) | |
| ≥1.50 | 29 | 62.1
(40.5–83.6) | 0.027e |
| PR-ERK (1+2) | <0.84 | 111 | 34.3
(25.3–42.2) | |
| ≥0.84 | 35 | 52.3
(32.7–71.9) | 0.170 |
| PR-AKT | <1.10 | 101 | 33.4
(24.9–42.0) | |
| ≥1.10 | 49 | 45.4
(28.1–62.7) | 0.322 |
On the other hand, borderline significance of the
EHM-free survival difference was found in GSK-T, PTEN-T, PTEN-T/N,
ERK1-T/N, ERK(1+2)-T/N, and PR-AKT-N levels (Table IV), whereas a higher ERK2-T level
(≥0.6 HU), a lower AKT-T (<1.0 HU) level, and a higher GSK-T/N
(≥0.65) level significantly predicted a favorable EHM-free survival
(P= 0.005, 0.001 and 0.008, respectively).
| Table IV.Univariate analysis of signaling
molecule expression levels as predictors for EHM-free survival in
postoperative HCC patients. |
Table IV.
Univariate analysis of signaling
molecule expression levels as predictors for EHM-free survival in
postoperative HCC patients.
| A, Protein
expression levels in HCC tissues |
|---|
|
|---|
| Parameter | Expression
levels | No. of
patients | Mean disease-free
survival (95% CI) | Log-rank
P-value |
|---|
| 1. Non-cancer
partsa | | | | |
| GSK | <16.5 HU | 135 | 91.2
(78.4–104.0) | |
| ≥16.5 HU | 21 | 118.7
(98.6–138.7) | 0.062 |
| PTEN | <3.85 HU | 82 | 87.3
(69.4–105.3) | |
| ≥3.85 HU | 73 | 102.3
(89.4–115.1) | 0.064 |
| mTOR | <0.40 HU | 36 | 84.0
(65.4–102.6) | |
| ≥0.40 HU | 120 | 100.8
(87.3–114.3) | 0.548 |
| p44 (ERK1) | <10.0 HU | 87 | 96.6
(79.1–114.2) | |
| ≥10.0 HU | 68 | 93.3
(78.9–107.6) | 0.924 |
| p42 (ERK2) | <45.5 HU | 130 | 96.6
(83.8–109.4) | |
| ≥45.5 HU | 25 | 64.6
(50.1–79.0) | 0.960 |
| ERK (1+2) | <16.0 HU | 102 | 95.7
(79.2–112.1) | |
| ≥16.0 HU | 53 | 95.9
(80.0–106.9) | 0.582 |
| AKT | <200 HU | 133 | 93.6
(80.4–106.9) | |
| ≥200 HU | 23 | 108.7
(90.7–126.7) | 0.205 |
| 2. Cancer
partsa | | | | |
| GSK | <8.50 HU | 126 | 85.7
(73.9–97.6) | |
| ≥8.50 HU | 30 | 129.0 (110.9
∼147.2) | 0.016e |
| PTEN | <3.00 HU | 87 | 80.5
(63.6–97.4) | |
| ≥3.00 HU | 68 | 110.2
(95.6–124.7) | 0.025e |
| mTOR | <0.33 HU | 38 | 77.1
(57.2–97.0) | |
| ≥0.33 HU | 118 | 100.6
(87.3–114.0) | 0.118 |
| p44 (ERK1) | <148.5 HU | 131 | 100.0
(87.5–122.4) | |
| ≥148.5 HU | 24 | 47.8
(32.3–63.3) | 0.082 |
| p42 (ERK2) | <0.60 HU | 40 | 44.6
(33.9–55.2) | |
| ≥0.60 HU | 115 | 103.8
(91.2–116.4) | 0.005f |
| ERK (1+2) | <48.0 HU | 128 | 101.3
(88.3–114.3) | |
| ≥48.0 HU | 27 | 71.1
(46.3–95.9) | 0.099 |
| AKT | <1.0 HU | 142 | 98.8
(86.6–111.1) | |
| ≥1.0 HU | 11 | 25.9
(10.2–41.6) | 0.001f |
| 3. Cancer
parts/non-cancer partsb | | | | |
| GSK | <0.65 | 61 | 76.5
(59.8–93.1) | |
| ≥0.65 | 95 | 107.1
(92.4–121.7) | 0.008f |
| PTEN | <0.52 | 33 | 71.1
(48.8–93.4) | |
| ≥0.52 | 122 | 103.2
(89.9–116.5) | 0.022e |
| mTOR | <1.04 | 87 | 92.0
(75.4–108.6) | |
| ≥1.04 | 69 | 97.0
(82.7–111.3) | 0.289 |
| p44 (ERK1) | <2.50 | 114 | 101.4
(86.7–116.0) | |
| ≥2.50 | 41 | 77.5
(57.4–97.6) | 0.039e |
| p42 (ERK2) | <1.80 | 120 | 100.5
(87.6–113.4) | |
| ≥1.80 | 35 | 80.4
(56.4–104.4) | 0.119 |
| ERK (1+2) | <1.34 | 111 | 104.2
(91.0–117.4) | |
| ≥1.34 | 44 | 79.4
(54.1–95.8) | 0.014e |
| AKT | <0.88 | 94 | 90.1
(76.7–103.5) | |
| ≥0.88 | 62 | 98.9
(78.7–119.1) | 0.689 |
| B, Relative ratios
of phosphorylated protein expression levels in HCC tissues |
|---|
|
|---|
| Parameter | Expression
levels | No. of
patients | Mean disease-free
survival (95% CI) | Log-rank
P-value |
|---|
| 1. Non-cancer
partsc | | | | |
| PR-GSK | <0.50 | 77 | 95.3
(77.3–113.3) | |
| ≥0.50 | 76 | 91.3
(76.7–106.0) | 0.529 |
| PR-PTEN | <1.87 | 101 | 91.5
(78.7–104.3) | |
| ≥1.87 | 59 | 103.8
(85.8–121.8) | 0.569 |
| PR-mTOR | <0.20 | 94 | 101.9
(86.8–117.1) | |
| ≥0.20 | 59 | 84.7
(68.3–101.1) | 0.235 |
| PR-p44 (ERK1) | <0.10 | 20 | 53.4
(38.6–68.2) | |
| ≥0.10 | 134 | 98.4
(85.9–110.8) | 0.425 |
| PR-p42 (ERK2) | <2.30 | 104 | 101.8
(87.8–115.7) | |
| ≥2.30 | 46 | 79.4
(56.2–102.5) | 0.187 |
| PR-ERK (1+2) | <3.50 | 92 | 101.8
(87.1–116.5) | |
| ≥3.50 | 62 | 85
(67.3–102.6) | 0.354 |
| PR-AKT | <0.01 | 34 | 118.7
(100.8–136.6) | |
| ≥0.01 | 119 | 86.7
(74.2–99.1) | 0.039e |
| 2. Cancer
partsc | | | | |
| PR-GSK | <0.60 | 84 | 100.9
(84.5–117.4) | |
| ≥0.60 | 68 | 87.2
(72.3–102.0) | 0.172 |
| PR-PTEN | <0.20 | 50 | 105.5
(90.8–120.3) | |
| ≥0.20 | 102 | 90.7
(74.4–107.1) | 0.188 |
| PR-mTOR | <0.50 | 58 | 96.3
(78.9–113.6) | |
| ≥0.50 | 102 | 92.9
(78.2–107.6) | 0.501 |
| PR-p44 (ERK1) | <0.89 | 76 | 98.0
(82.2–113.7) | |
| ≥0.89 | 72 | 90.8
(74.4–107.3) | 0.938 |
| PR-p42 (ERK2) | <2.40 | 111 | 98.9
(84.4–113.4) | |
| ≥2.40 | 38 | 90.7
(68.5–112.9) | 0.747 |
| PR-ERK (1+2) | <2.50 | 107 | 96.0
(82.0–110.1) | |
| ≥2.50 | 42 | 98.2
(78.9–117.5) | 0.794 |
| PR-AKT | <0.63 | 129 | 94.2
(80.9–107.5) | |
| ≥0.63 | 27 | 105.3
(87.0–123.6) | 0.346 |
| 3. Cancer
parts/non-cancer partsd | | | | |
| PR-GSK | <0.95 | 74 | 105.2
(89.7–120.8) | |
| ≥0.95 | 78 | 86.9
(72.3–101.6) | 0.392 |
| PR-PTEN | <1.16 | 104 | 98.3
(84.9–111.6) | |
| ≥1.16 | 47 | 91.3
(72.1–110.5) | 0.670 |
| PR-mTOR | <2.48 | 97 | 87.0
(74.4–99.6) | |
| ≥2.48 | 36 | 117.8
(94.5–141.2) | 0.080 |
| PR-p44 (ERK1) | <0.61 | 96 | 86.4
(73.1–99.7) | |
| ≥0.61 | 50 | 115.1
(96.0–134.2) | 0.070 |
| PR-p42 (ERK2) | <1.50 | 114 | 90.4
(77.5–103.2) | |
| ≥1.50 | 29 | 111.0
(89.9–132.1) | 0.239 |
| PR-ERK (1+2) | <0.84 | 111 | 85.4
(71.9–99.0) | |
| ≥0.84 | 35 | 123.6
(109.4–137.8) | 0.017e |
| PR-AKT | <1.10 | 101 | 92.2
(79.1–105.4) | |
| ≥1.10 | 49 | 93.9
(73.6–114.1) | 0.771 |
No significant difference could be found when
assessing the overall survival using these expression levels of
signaling proteins (data not shown).
Multivariate analysis combining both
clinical and molecular predictors
To understand whether the identified molecular
predictors were helpful in survival prediction using
clinicopathological factors, we combined the four identified
molecular predictors (PR-mTOR-T, ERK2-T, AKT-T and GSK-T/N) and all
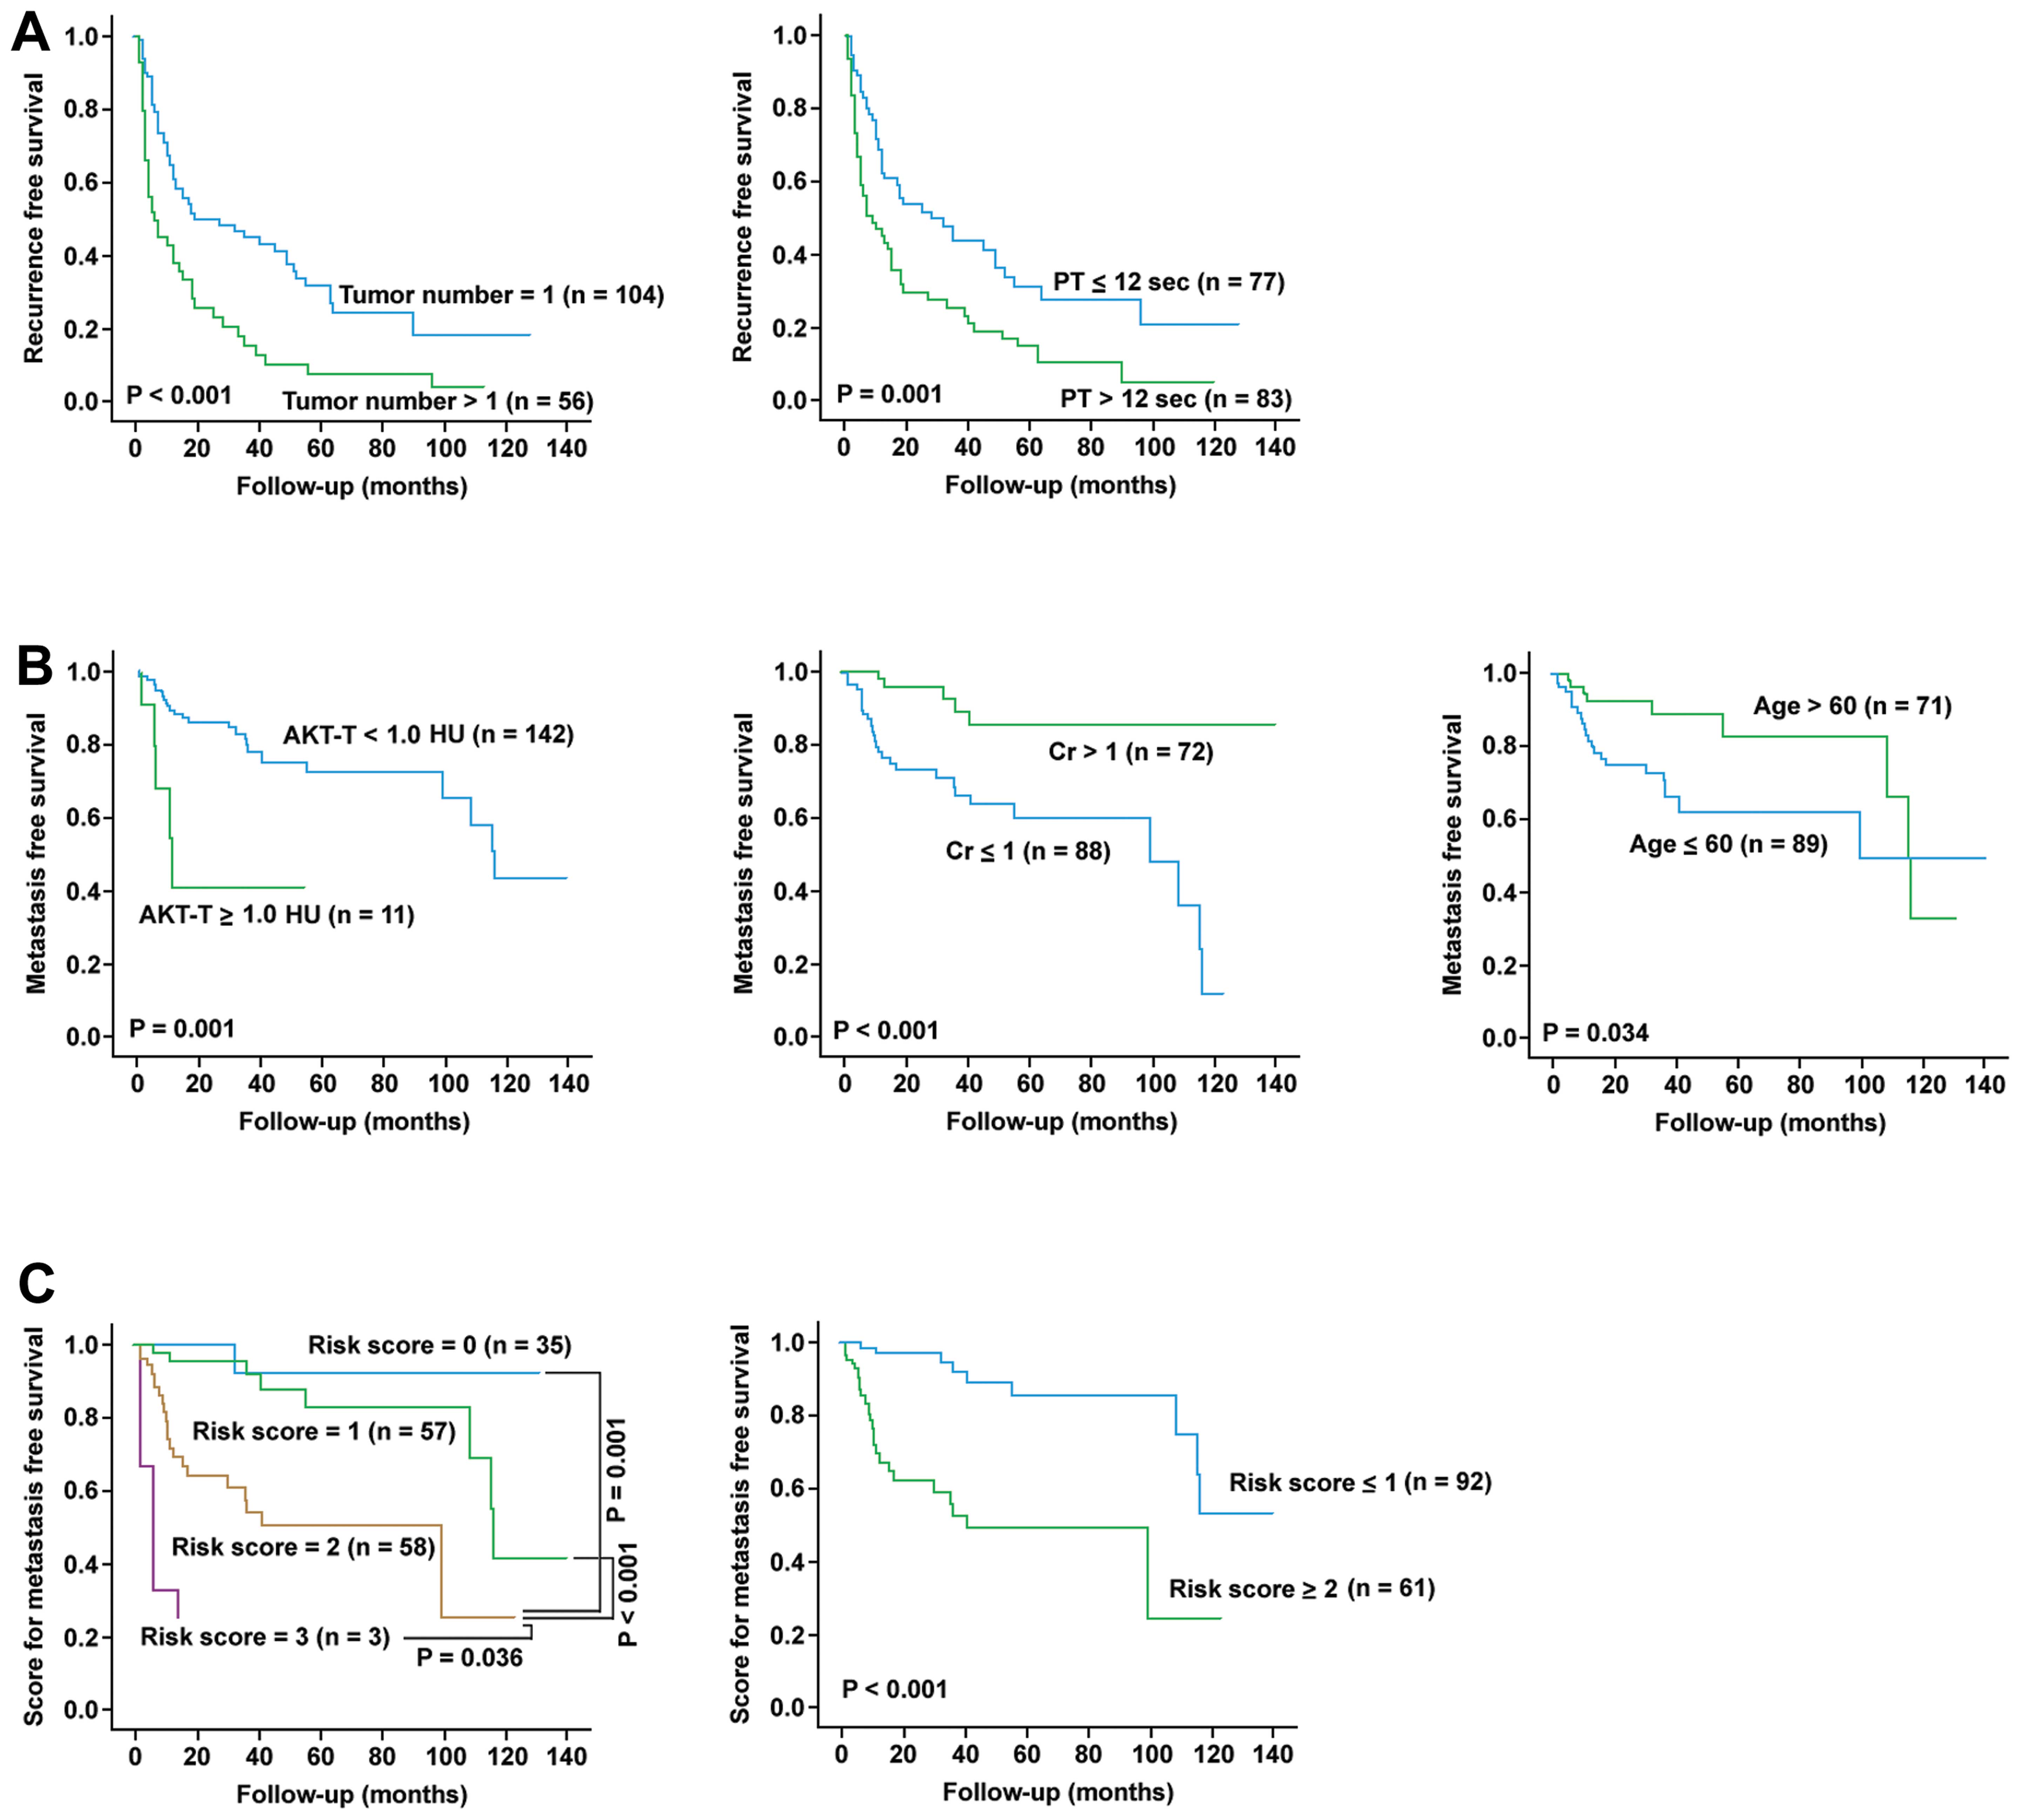
clinicopathological factors for multivariate analysis (Table V). Cox proportional hazard model
was used in this analysis. Univariate analysis revealed that
microvascular invasion, tumor number, AFP, bilirubin, prothrombin
time, AST, PR-mTOR-T, and ERK2-T significantly associated with the
LR-free survival. After adjusted for other confounding factors,
only tumor number (P=0.031) and prothrombin time (P= 0.003)
remained as independent predictors for LR-free survival.
Kaplan-Meier analysis was performed for these two factors for
verification (Fig. 3A).
| Table V.Univariate and multivariate analysis
of clinicopathologial parameters and signaling molecule expression
levels for IRFS and EMFS in HCC patients. |
Table V.
Univariate and multivariate analysis
of clinicopathologial parameters and signaling molecule expression
levels for IRFS and EMFS in HCC patients.
| | IRFS
| EMFS
|
|---|
| Parameter | No. of
patients | HR (95% CI) | Adjusted HR (95%
CI) | HR (95% CI) | Adjusted HR(95%
CI) |
|---|
| Age (years) | | | | | |
| ≤60 | 89 | | | | |
| >60 | 71 | 0.955
(0.643–1.417) | | 0.446
(0.207–0.961)a | 0.382
(0.171–0.851)a |
| Gender | | | | | |
| Female | 41 | | | | |
| Male | 119 | 1.109
(0.705–1.7430 | | 1.096
(0.509–2.360) | |
| Cirrhosis | | | | | |
| No | 83 | | | | |
| Yes | 77 | 1.165
(0.787–1.726) | | 1.098
(0.550–2.191) | |
| Alcoholism | | | | | |
| No | 115 | | | | |
| Yes | 45 | 0.906
(0.583–1.410) | | 0.861
(0.397–1.865) | |
| Tumor
characteristics | | | | | |
| Microvascular
invasion | | | | | |
| No | 113 | | | | |
| Yes | 47 | 1.548
(1.017–2.356)a | 1.032
(0.534–1.679) | 1.581
(0.766–3.265) | |
| Edmondson's
grading | | | | | |
| I–II | 59 | | | | |
| III–IV | 101 | 1.022
(0.675–1.546) | | 1.480
(0.687–3.187) | |
| Encapsulation | | | | | |
| No | 39 | | | | |
| Yes | 120 | 0.706
(0.455–1.095) | | 0.751
(0.348–1.620) | |
| Tumor number | | | | | |
| 1 | 104 | | | | |
| >1 | 56 | 2.195
(1.476–3.264)b | 1.735
(1.052–2.861)a | 1.378
(0.684–2.774) | |
| Largest tumor size
(diameter, cm) | | | | | |
| ≤3 | 40 | | | | |
| >3 | 120 | 1.468
(0.926–2.329) | | 1.357
(0.610–3.018) | |
| Macrovascular
invasion | | | | | |
| No | 147 | | | | |
| Yes | 13 | 1.420
(0.737–2.735) | | 2.621
(0.993–6.919) | |
| Ascites | | | | | |
| No | 146 | | | | |
| Yes | 14 | 1.613
(0.835–3.116) | | 0.934
(0.222–3.928) | |
Serology
AFP (ng/ml) | | | | | |
| ≤25 | 51 | | | | |
| >25 | 109 | 1.663
(1.044–2.650)a | 1.611
(0.950–2.729) | 2.141
(0.824–5.565) | |
| Albumin (g/dl) | | | | | |
| ≤4.0 | 106 | | | | |
| >4.0 | 54 | 0.777
(0.513–1.176) | | 0.557
(0.258–1.202) | |
| Bilirubin
(mg/dl) | | | | | |
| ≤1.2 | 121 | | | | |
| >1.2 | 39 | 1.657
(1.069–2.571)a | 1.152
(0.700–1.896) | 1.844
(0.846–4.016) | |
| Prothrombin time
(sec) | | | | | |
| ≤12 | 77 | | | | |
| >12 | 83 | 1.975
(1.325–2.944)b | 1.940
(1.246–3.012)b | 2.488
(1.204–5.141)a | 1.976
(0.878–4.451) |
| Creatinine
(mg/dl) | | | | | |
| ≤1.0 | 88 | | | | |
| >1.0 | 72 | 0.872
(0.585–1.299) | | 0.187
(0.972–0.486)b | 0.171
(0.059–0.493)b |
| AST (U/l) | | | | | |
| ≤36 | 62 | | | | |
| >36 | 98 | 1.601
(1.061–2.416)a | 1.295
(0.835–2.009) | | 1.957
(0.908–4.217) |
| ALT (U/l) | | | | | |
| ≤40 | 72 | | | | |
| >40 | 88 | 1.372
(0.924–2.037) | | | 1.339
(0.665–2.694) |
| Anti-HCV | | | | | |
| Negative | 116 | | | | |
| Positive | 44 | 1.298
(0.839–2.008) | | | 1.022
(0.474–2.203) |
| HBsAg | | | | | |
| Negative | 50 | | | | |
| Positive | 110 | 0.882
(0.579–1.346) | | | 0.990
(0.471–2.084) |
| Signalling
molecules PR-mTOR-T | | | | | |
| <0.50 | 58 | | | | |
| ≥0.50 | 102 | 0.777
(0.638–0.945)b | 0.758
(0.497–1.158) | 1.290
(0.613–2.713) | |
| AKT-T | | | | | |
| <1.0 HU | 142 | | | | |
| ≥1.0 HU | 11 | 1.140
(0.460–2.825) | | 4.529
(1.702–12.050)b | 5.000
(1.693–14.770)b |
| ERK2-T | | | | | |
| <0.60 HU | 40 | | | | |
| ≥0.60 HU | 115 | 0.770
(0.614–0.966)a | 0.654
(0.407–1.050) | 0.356
(0.167–0.758)b | 0.516
(0.231–1.1530) |
| GSK-T/N | | | | | |
| <0.65 | 126 | | | | |
| ≥0.65 | 30 | 1.024
(0.797–1.317) | | 0.127
(0.017–0.930)a | 0.171
(0.023–1.287) |
On the other hand, univariate analysis revealed that
age, prothrombin time, creatinine, AKT-T, ERK2-T and GSK-T/N
significantly associated with EHM-free survival. After adjusted for
other confounding predictors, only AKT-T (P=0.004), creatinine
(P=0.001), and age (P=0.019) remained to be independent predictors
for EHM-free survival. Kaplan-Meier analysis was performed for
these three factors for verification (Fig. 3B). These three factors were then
combined to estimate EHM-free survival using a risk score method
(Fig. 3C). In this method, the
presence of each unfavorable factor was given 1 risk-point. It was
found that patients with risk score ≤1 had significantly longer
EHM-free survival (P<0.001).
Finally, to understand whether the differential sets
of predictors for LR and EHM remained effective over time, we use
the verification cohort which was collected in a later period of
time for confirmation. It was found that prolonged prothrombin time
(P= 0.016) remained to be significantly associated with LR-free but
not the EHM-free survival, whereas higher creatinine level
(P=0.007) and higher AKT-T level (P=0.025) remained to be
significantly associated with EHM-free but not LR-free
survival.
Discussion
This study aimed to investigate whether
postoperative LR and EHM in HCCs were governed by different sets of
clinicopathological and molecular predictors. During the study,
several interesting observations were made. Clustering analysis
showed that in fact, the expression profiles of many protein
factors in the cancer and non-cancer parts were generally
concordant. This is consistent with the view that the
para-neoplastic liver tissues (non-cancer parts) were already
harboring adequate precancer changes, waiting for only a few final
steps of molecular alterations to develop cancer (22).
Another interesting finding was that most of the
effective predictors in this study were uncovered by comparing the
levels of the cancer parts (−T) between patients. A number of
predictors were generated by calculating the T/N ratios and very
few were found by comparing just the levels in the non-cancer parts
(−N). Since the cancer parts under analysis were the parts already
being surgically removed, this observation suggested that HCC
recurrence most likely developed through the same or similar
oncogenic pathways used by the original (surgically removed)
cancers. Therefore, the signaling protein levels in the removed
cancer parts could serve as predictors for the next tumor
development. On the other hand, the fact that the protein levels in
the non-cancer parts could rarely serve as effective predictors
implied that the accumulated molecular changes in the
para-neoplastic/non-cancer tissues were not representative enough
to illustrate the oncogenic pathways.
The most striking finding in the present study was
that the LR and EHM were associated with different sets of
predictors, clinicopathological or molecular. After adjusted for
confounding factors, it was found that prothombin time prolongation
and tumor number were the only two significant predictors for LR.
Prothombin time prolongation remained effective as a predictor when
tested in another cohort of patients collected from a different
time-period. This result suggested that the functional reserve and
thus the severity of long-standing liver damage was likely the
major determinant for LR. On the other hand, EHM seemed to require
activation of particular cellular pathways in the cancer tissues,
in our study, the AKT mediated pathways. This was clearly
demonstrated in the first part of the study when the mean
expression levels were compared between the three presented
prognostic groups (Fig. 2) and was
also shown in the subsequent univariate and multivariate analysis.
The most relevant interpretation of this result could be made
according to the recently discovered association between the AKT
mediated pathways and the epithelial to mesenchymal transition in
various cancers including HCC (23–29).
Thus, our present data supported the view that the epithelial to
mesenchymal transition was needed for effective EHM of HCC cells.
Another novel and striking finding was that a lower creatinine
level was also needed for EHM, which was confirmed in the
verification cohort. Additionally, in the training cohort, a
younger age was a favorable factor for EHM. We speculated that a
healthy host environment was needed for HCC metastasis, whereas the
accumulation of body wastes, normally excreted by kidneys, could
inhibit the metastasis process. This hypothesis could be verified
using animal models in the future.
Of the significant signaling molecule predictors,
increased PR-mTOR-T and ERK2-T levels were associated with a better
postoperative prognosis, suggesting that ERK2 and phosphorylated
mTOR played an inhibitory role for HCC tumor growth. This is
against the general belief that mTOR and ERK2 play a growth
promoting role in cancer cells. However, recent studies indicated
that the TRAIL-mediated apoptosis in hepatoma and lung cancer cells
was mediated by ERK2 activation (30,31).
On the other hand, although phosphorylated mTOR has been found to
associate with poor prognosis in other cancers, its prognostic role
in HCC has not been defined (32–36).
Interestingly, in two of these reports (34,36),
only nuclear (but not cytoplasmic) phosphorylated mTOR was
associated with poor prognosis of cancers. In the present study, we
assayed the total expression levels of phosphorylated mTOR but did
not differentiate the nuclear from cytoplasmic form. Because the
relative volume of cytoplasm was much larger than that of nucleus,
it could be speculated that the total amount of phosphorylated mTOR
reversely correlated with the percentage of nuclear phosphorylated
mTOR in HCC. If this hypothesis could be confirmed, the nuclear
phosphorylated mTOR could also be associated with poor prognosis in
HCC. Further study using immunohistochemistry analysis is needed to
clarify this point.
In conclusion, this study revealed that
postoperative LR and EHM of HCC were governed by two different sets
of clinicopathological and molecular predictors, indicating the
involvement of differential molecular pathways. LR preferentially
arose from a liver of poorer functional reserve. On the other hand,
EHM required participation of AKT-mediated signaling pathways,
presumably associated with the endothelial to mesenchymal
transition. In addition, a host environment with lower creatinine
level, implying lower concentrations of kidney-excreting wastes,
was also favorable for EHM.
Acknowledgements
We are indebted to numerous members of
the Liver Research Center of Chang Gung Memorial Hospital for their
help and encouragement. This study was supported by grants from
Taiwan National Science Council (101-2325-B-182-010 and
101-2314-B-182-017-MY3).
References
|
1.
|
Parkin DM, Bray F, Ferlay J and Pisani P:
Estimating the world cancer burden: Globocan 2000. Int J Cancer.
94:153–156. 2001. View
Article : Google Scholar : PubMed/NCBI
|
|
2.
|
Perz JF, Armstrong GL, Farrington LA,
Hutin YJ and Bell BP: The contributions of hepatitis B virus and
hepatitis C virus infections to cirrhosis and primary liver cancer
worldwide. J Hepatol. 45:529–538. 2006. View Article : Google Scholar : PubMed/NCBI
|
|
3.
|
Tanaka K, Hirohata T, Takeshita S,
Hirohata I, Koga S, Sugimachi K, Kanematsu T, Ohryohji F and
Ishibashi H: Hepatitis B virus, cigarette smoking and alcohol
consumption in the development of hepatocellular carcinoma: a
case-control study in Fukuoka, Japan. Int J Cancer. 51:509–514.
1992. View Article : Google Scholar : PubMed/NCBI
|
|
4.
|
Bosch FX, Ribes J, Cleries R and Diaz M:
Epidemiology of hepatocellular carcinoma. Clin Liver Dis.
9:191–211. 2005. View Article : Google Scholar : PubMed/NCBI
|
|
5.
|
El-Serag HB: Hepatocellular carcinoma:
recent trends in the United States. Gastroenterology. 127:S27–S34.
2004. View Article : Google Scholar : PubMed/NCBI
|
|
6.
|
Sherman M: Hepatocellular carcinoma:
epidemiology, risk factors, and screening. Semin Liver Dis.
25:143–154. 2005. View Article : Google Scholar : PubMed/NCBI
|
|
7.
|
Park NH, Song IH and Chung YH: Chronic
hepatitis B in hepatocarcinogenesis. Postgrad Med J. 82:507–515.
2006. View Article : Google Scholar : PubMed/NCBI
|
|
8.
|
Chau GY, Wu CW, Lui WY, Chang TJ, Kao HL,
Wu LH, King KL, Loong CC, Hsia CY and Chi CW: Serum interleukin-10
but not interleukin-6 is related to clinical outcome in patients
with resectable hepatocellular carcinoma. Ann Surg. 231:552–558.
2000. View Article : Google Scholar : PubMed/NCBI
|
|
9.
|
Hsu YC, Fu HH, Jeng YM, Lee PH and Yang
SD: Proline-directed protein kinase FA is a powerful and
independent prognostic predictor for progression and patient
survival of hepatocellular carcinoma. J Clin Oncol. 24:3780–3788.
2006. View Article : Google Scholar : PubMed/NCBI
|
|
10.
|
Kitamoto M, Nakanishi T, Kira S, Kawaguchi
M, Nakashio R, Suemori S, Kajiyama G, Asahara T and Dohi K: The
assessment of proliferating cell nuclear antigen
immunohistochemical staining in small hepatocellular carcinoma and
its relationship to histologic characteristics and prognosis.
Cancer. 72:1859–1865. 1993. View Article : Google Scholar
|
|
11.
|
Kobayashi T, Kubota K, Takayama T and
Makuuchi M: Telomerase activity as a predictive marker for
recurrence of hepatocellular carcinoma after hepatectomy. Am J
Surg. 181:284–288. 2001. View Article : Google Scholar : PubMed/NCBI
|
|
12.
|
Poon RT, Lau CP, Ho JW, Yu WC, Fan ST and
Wong J: Tissue factor expression correlates with tumor angiogenesis
and invasiveness in human hepatocellular carcinoma. Clin Cancer
Res. 9:5339–5345. 2003.PubMed/NCBI
|
|
13.
|
Poon RT, Ng IO, Lau C, Zhu LX, Yu WC, Lo
CM, Fan ST and Wong J: Serum vascular endothelial growth factor
predicts venous invasion in hepatocellular carcinoma: a prospective
study. Ann Surg. 233:227–235. 2001. View Article : Google Scholar : PubMed/NCBI
|
|
14.
|
Shen HM and Ong CN: Mutations of the p53
tumor suppressor gene and ras oncogenes in aflatoxin
hepatocarcinogenesis. Mutat Res. 366:23–44. 1996. View Article : Google Scholar : PubMed/NCBI
|
|
15.
|
Tsujita E, Taketomi A, Gion T, Kuroda Y,
Endo K, Watanabe A, Nakashima H, Aishima S, Kohnoe S and Maehara Y:
Suppressed MKP-1 is an independent predictor of outcome in patients
with hepatocellular carcinoma. Oncology. 69:342–347. 2005.
View Article : Google Scholar : PubMed/NCBI
|
|
16.
|
Uenishi T, Kubo S, Yamamoto T, Shuto T,
Ogawa M, Tanaka H, Tanaka S, Kaneda K and Hirohashi K: Cytokeratin
19 expression in hepatocellular carcinoma predicts early
postoperative recurrence. Cancer Sci. 94:851–857. 2003. View Article : Google Scholar : PubMed/NCBI
|
|
17.
|
Lee TK, Poon RT, Yuen AP, Ling MT, Kwok
WK, Wang XH, Wong YC, Guan XY, Man K, Chau KL and Fan ST: Twist
over-expression correlates with hepatocellular carcinoma metastasis
through induction of epithelial-mesenchymal transition. Clin Cancer
Res. 12:5369–5376. 2006. View Article : Google Scholar
|
|
18.
|
Zhu K, Dai Z, Pan Q, Wang Z, Yang GH, Yu
L, Ding ZB, Shi GM, Ke AW, Yang XR, Tao ZH, Zhao YM, Qin Y, Zeng
HY, Tang ZY, Fan J and Zhou J: Metadherin promotes hepatocellular
carcinoma metastasis through induction of epithelial-mesenchymal
transition. Clin Cancer Res. 17:7294–7302. 2011. View Article : Google Scholar
|
|
19.
|
Eisen MB, Spellman PT, Brown PO and
Botstein D: Cluster analysis and display of genome-wide expression
patterns. Proc Natl Acad Sci USA. 95:14863–14868. 1998. View Article : Google Scholar : PubMed/NCBI
|
|
20.
|
Saldanha AJ: Java Treeview - extensible
visualization of micro-array data. Bioinformatics. 20:3246–3248.
2004. View Article : Google Scholar : PubMed/NCBI
|
|
21.
|
Mazumdar M and Glassman JR: Categorizing a
prognostic variable: review of methods, code for easy
implementation and applications to decision-making about cancer
treatments. Stat Med. 19:113–132. 2000. View Article : Google Scholar : PubMed/NCBI
|
|
22.
|
Trevisani F, Cantarini MC, Wands JR and
Bernardi M: Recent advances in the natural history of
hepatocellular carcinoma. Carcinogenesis. 29:1299–1305. 2008.
View Article : Google Scholar : PubMed/NCBI
|
|
23.
|
Chen R, Yang Q and Lee JD: BMK1 kinase
suppresses epithelialmesenchymal transition through the
Akt/GSK3beta signaling pathway. Cancer Res. 72:1579–1587. 2012.
View Article : Google Scholar : PubMed/NCBI
|
|
24.
|
Fenouille N, Tichet M, Dufies M, Pottier
A, Mogha A, Soo JK, Rocchi S, Mallavialle A, Galibert MD, Khammari
A, Lacour JP, Ballotti R, Deckert M and Tartare-Deckert S: The
epithelialmesenchymal transition (EMT) regulatory factor SLUG
(SNAI2) is a downstream target of SPARC and AKT in promoting
melanoma cell invasion. PLoS One. 7:e403782012. View Article : Google Scholar : PubMed/NCBI
|
|
25.
|
Jiao M and Nan KJ: Activation of PI3
kinase/Akt/HIF-1alpha pathway contributes to hypoxia-induced
epithelial-mesenchymal transition and chemoresistance in
hepatocellular carcinoma. Int J Oncol. 40:461–468. 2012.PubMed/NCBI
|
|
26.
|
Maseki S, Ijichi K, Tanaka H, Fujii M,
Hasegawa Y, Ogawa T, Murakami S, Kondo E and Nakanishi H:
Acquisition of EMT phenotype in the gefitinib-resistant cells of a
head and neck squamous cell carcinoma cell line through
Akt/GSK-3beta/snail signalling pathway. Br J Cancer. 106:1196–1204.
2012. View Article : Google Scholar : PubMed/NCBI
|
|
27.
|
Ogunwobi OO and Liu C: Hepatocyte growth
factor upregulation promotes carcinogenesis and
epithelial-mesenchymal transition in hepatocellular carcinoma via
Akt and COX-2 pathways. Clin Exp Metastasis. 28:721–731. 2011.
View Article : Google Scholar
|
|
28.
|
Ogunwobi OO, Wang T, Zhang L and Liu C:
Cyclooxygenase-2 and Akt mediate multiple growth-factor-induced
epithelialmesenchymal transition in human hepatocellular carcinoma.
J Gastroenterol Hepatol. 27:566–578. 2012. View Article : Google Scholar
|
|
29.
|
Wen W, Ding J, Sun W, Fu J, Chen Y, Wu K,
Ning B, Han T, Huang L, Chen C, Xie D, Li Z, Feng G, Wu M, Xie W
and Wang H: Cyclin G1-mediated epithelial-mesenchymal transition
via phosphoinositide 3-kinase/Akt signaling facilitates liver
cancer progression. Hepatology. 55:1787–1798. 2012. View Article : Google Scholar : PubMed/NCBI
|
|
30.
|
Frese S, Pirnia F, Miescher D, Krajewski
S, Borner MM, Reed JC and Schmid RA: PG490-mediated sensitization
of lung cancer cells to Apo2L/TRAIL-induced apoptosis requires
activation of ERK2. Oncogene. 22:5427–5435. 2003. View Article : Google Scholar : PubMed/NCBI
|
|
31.
|
Liang X, Du J, Liu Y, Cui M, Ma C, Han L,
Qu Z, Zhang Z, Sun Z, Zhang L, Chen YH and Sun W: The hepatitis B
virus protein MHBs(t) sensitizes hepatoma cells to TRAIL-induced
apoptosis through ERK2. Apoptosis. 12:1827–1836. 2007. View Article : Google Scholar : PubMed/NCBI
|
|
32.
|
Bakarakos P, Theohari I, Nomikos A, Mylona
E, Papadimitriou C, Dimopoulos AM and Nakopoulou L:
Immunohistochemical study of PTEN and phosphorylated mTOR proteins
in familial and sporadic invasive breast carcinomas.
Histopathology. 56:876–882. 2010. View Article : Google Scholar : PubMed/NCBI
|
|
33.
|
Hirashima K, Baba Y, Watanabe M, Karashima
R, Sato N, Imamura Y, Hiyoshi Y, Nagai Y, Hayashi N, Iyama K and
Baba H: Phosphorylated mTOR expression is associated with poor
prognosis for patients with esophageal squamous cell carcinoma. Ann
Surg Oncol. 17:2486–2493. 2010. View Article : Google Scholar : PubMed/NCBI
|
|
34.
|
Li N, Zhong M and Song M: Expression of
phosphorylated mTOR and its regulatory protein is related to
biological behaviors of ameloblastoma. Int J Clin Exp Pathol.
5:660–667. 2012.PubMed/NCBI
|
|
35.
|
Ueng SH, Chen SC, Chang YS, Hsueh S, Lin
YC, Chien HP, Lo YF, Shen SC and Hsueh C: Phosphorylated mTOR
expression correlates with poor outcome in early-stage triple
negative breast carcinomas. Int J Clin Exp Pathol. 5:806–813.
2012.PubMed/NCBI
|
|
36.
|
Yoshida Y, Kurokawa T, Horiuchi Y,
Sawamura Y, Shinagawa A and Kotsuji F: Localisation of
phosphorylated mTOR expression is critical to tumour progression
and outcomes in patients with endometrial cancer. Eur J Cancer.
46:3445–3452. 2010. View Article : Google Scholar : PubMed/NCBI
|