Introduction
Colorectal cancer (CRC) is one of the most prevalent
cancers and the fourth leading cause of cancer death worldwide
(1,2). Approximately 70% of all CRC is
sporadic, i.e. non-familial, non-hereditary and unrelated to
inflammatory bowel diseases (3,4). The
etiology of CRC has not been elucidated, so far, but there are
strong indication of the significance of dietary as well as
microbiological factors (5,6). In
contrast, the pathogenesis of sporadic CRC is well established.
Thus, malignant transformation of colorectal epithelial cells is
achieved according to the adenoma-carcinoma sequence in which
sequential mutations of growth controlling genes, along with
epigenetic events occur at a time-course of probably 10–15 years
(7,8). Although there is a deep understanding
of the genetic basis of CRC, the importance of contributing factors
to CRC progression in the tumor stroma is still unclear.
Solid cancers consist of tumor cells that are
supported by a scaffold of connective tissue (i.e. the stroma),
together with a variety of stromal cells, like fibroblasts,
myofibroblasts, endothelial cells, lymphocytes, mast cells and
macrophages (9,10). The stroma interacts with the tumor
cells, e.g. via cytokines, integrins and proteases, to influence
functions such as proliferation, apoptosis, migration and
angiogenesis (11–14).
Among the stromal cells, the macrophages are of
particular significance for carcinogenesis. Tumor-associated
macrophages (TAMs) are experts in changing their functional
profiles in response to environmental changes and display a
phenotypic plasticity with two main types of macrophages, M1 and
M2, with usually contrasting effects on tumor cells (15–18).
M1 macrophages are the classically activated
macrophages that respond to signals such as bacterial stimuli with
a strong inflammatory response that includes pro-inflammatory
cytokines such as interleukin 1β (IL1β), IL6 and tumor necrosis
factor α (TNFα), other released factors such as reactive
nitrogen/oxygen species and various chemokines that recruits new
inflammatory cells to the site (19,20).
M2 macrophages are a collection of alternatively activated
macrophages that are important in processes such as suppression or
regulation of inflammation, wound healing and angiogenesis and
release anti-inflammatory cytokines such as IL10 and transforming
growth factor β (TGFβ) (21,22).
When human macrophages are exposed to
lipopolysaccharides (LPS) and interferon γ (IFNγ), they are
polarized to M1 macrophages with potential antitumor activities.
When they are exposed to Th2 cytokines, such as IL4 and IL13, they
are polarized to M2 macrophages that have been suggested to support
tumor growth and development (18,23).
TAMs are in most cases regarded as being of an M2 phenotype, but
the TAM-picture is probably more complex, and the tumor
microenvironment, depending on tissue and cancer type, can affect
the polarization of TAMs within the tumor (24–28).
The significance of macrophages in CRC is debated since conflicting
data regarding extent of macrophage infiltration in correlation to
prognosis have been put forward and this may be attributed to
differences in macrophage phenotype and localization within the
tumor (28–35).
In the current study we have investigated the effect
of conditioned media (CM) from human blood monocyte derived M1 and
M2 macrophages and THP-1 monocytic cell line derived macrophages on
the proliferation of the colon cancer cell lines HT-29 and
CACO-2.
Materials and methods
Cell culture
The colon cancer cell lines HT-29 and CACO-2 and the
acute monocytic leukemia cell line THP-1 were purchased from DSMZ
(Braunschweig, Germany). HT-29 cells and THP-1 cells were cultured
in RPMI-1640 (RPMI) (Life Technologies, Carlsbad, CA, USA)
supplemented with 2 mM L-glutamine (Life Technologies), 100 U/ml
penicillin and 100 μg/ml streptomycin (Life Technologies)
with 10% heat-inactivated fetal calf serum (FCS) (Thermo
Scientific, Waltham, MA, USA) and 10 mM HEPES (Life Technologies).
CACO-2 cells were cultured in DMEM supplemented with 2 mM
L-glutamine and 100 U/ml of penicillin and streptomycin with 10%
FCS. All cell lines were grown at 37°C in a humidified atmosphere
and 5% CO2.
For the experimental assessment of proliferation,
apoptosis and cell cycle, HT-29 cells were seeded at a density of
15,000 cells/cm2 in RPMI 10% FCS plus 10 mM HEPES onto
tissue culture plates (Greiner Bio-One, Frickenhausen, Germany) and
allowed to grow for 3 days. After 3 days, the culture media was
replaced with macrophage CM, control media (RPMI 5% FCS) or other
factors, and treated, usually for 24 h. CACO-2 cells were seeded at
a density of 10,000 cells/cm2 and grown for 2 days in
DMEM 10% FCS before a 48-h treatment and subsequent assessment of
proliferation.
Differentiation of THP-1 monocytes to
macrophages
THP-1 monocytes were seeded at a density of 40,000
cells/cm2 onto 6-well cell culture plates (BD
Biosciences, Franklin Lakes, NJ, USA) in RPMI 10% FCS plus 10 mM
HEPES. Cells were induced to differentiate into macrophages with
160 nM phorbol 12-myristate 13-acetate (Sigma-Aldrich, St. Louis,
MO, USA). After 24 h, differentiated cells were thoroughly washed 5
times with RPMI 10% FCS and then cultured 48 h in 3 ml RPMI 10% FCS
plus 10 mM HEPES to obtain THP-1 macrophage (THP-1 M) CM. The THP-1
M CM was centrifuged to remove cell debris and stored in aliquots
at −20°C.
Isolation of human monocytes and
differentiation to macrophages
Buffy coats from healthy blood donors were obtained
from the division of Clinical Immunology and Transfusion Medicine,
Uppsala University Hospital (Uppsala, Sweden), and monocytes were
isolated by gradient centrifugation using Ficoll paque PLUS (GE
Healthcare, Little Chalfont, UK). In short, about 50 ml buffy coat
was diluted with an equal volume of PBS containing 3 mM EDTA
(PBS/EDTA), carefully loaded on Ficoll-Paque PLUS and centrifuged
at 900 × g for 30 min at 20°C. The separated mononuclear fraction
was collected and diluted with PBS/EDTA followed by centrifugation
at 500 × g for 10 min. The pelleted cells were resuspended in
PBS/EDTA and washed four times with PBS/EDTA by repeated
centrifugations at 200 × g for 10 min. After washing, the cells
were resuspended in 100 ml RPMI without FCS and 2 ml of cell
suspension was seeded onto 6-well cell culture plates (BD
Biosciences) and allowed to adhere for 1.5 h. Non-adherent cells
were removed by three washes with PBS and fresh RPMI 5% FCS was
added to the wells and cultured overnight. Macrophages were
obtained by culturing monocytes for 6 days in RPMI 20% FCS and 20
ng/ml macrophage colony-stimulating factor (M-CSF) (R&D
Systems, Minneapolis, MN, USA). After 6 days of culture (with media
and M-CSF renewal at day 3) macrophages were washed with PBS and
cultured an additional 48 h in RPMI 5% FCS with either no addition
generating M0 macrophages, addition of 100 ng/ml LPS
(Sigma-Aldrich) plus 20 ng/ml IFNγ (R&D Systems) for M1
differentiation or 20 ng/ml IL4 (R&D Systems) plus 20 ng/ml
IL13 (R&D Systems) for M2 differentiation. CM were collected
and named M0, M1/M2 differentiation CM (M1DIFF or
M2DIFF). The differentiated macrophages were washed
twice with PBS and cultured for another 48 h in RPMI 5% FCS
(without IFNγ/LPS or IL4/IL13) and CM were collected and named M1
and M2 CM, respectively. The collected media were centrifuged to
remove cell debris and stored in aliquots at −20°C.
Proliferation studies of HT-29 and
CACO-2
HT-29 and CACO-2 were cultured as described above in
the cell culture section before assessment of cell growth after
treatment with CM from macrophages, LPS, IFNγ, TNFα (Sigma-Aldrich)
or CXCL9 (Prospec-Tany Technogene, East Brunswick, NJ, USA). Cells
were loosened by trypsinization using a 0.05% trypsin, 0.02% EDTA
solution (Sigma-Aldrich), mixed with an equal volume of trypan blue
and counted in a hemacytometer. For the assessment of recovery of
cell growth after treatment, cells were washed and then allowed to
grow in RPMI 5% FCS for an additional 48 h prior to counting in a
hemacytometer.
Cytokine detection
Cytokines were analyzed in M1DIFF and
M2DIFF CM with the RayBio Human Cytokine Antibody Array
3 (Ray Biotech, Norcoss, GA, USA) according to manufacturer’s
instructions. Light intensities were detected by exposure to X-ray
film. IL10 and IL12p70 content of M1DIFF and
M2DIFF CM was analyzed with ELISA (eBioscience, San
Diego, CA, USA) according to manufacturer’s instructions and
signals detected at 450 nm (570 nm used as reference) with the
Infinite M200 pro plate reader (Tecan, Männedorf, Switzerland).
Apoptosis measurement
HT-29 cells were seeded as described above in the
cell culture section and treated for 24 h with CM. Cells were
loosened by trypsinization and pooled with their corresponding cell
culture media containing eventual floating cells, centrifuged at
300 × g for 5 min and resuspended in 1% paraformaldehyde in PBS.
Cell suspensions were incubated on ice for 45 min. Next, cells were
washed twice with 5 ml PBS and resuspended in 450 μl
ice-cold PBS prior to cell fixation in 5 ml ice-cold 70% ethanol.
Fixed cells were stored at −20°C until apoptosis measurements were
done using a terminal deoxynucleotidyl transferase dUTP nick end
labeling (TUNEL) kit (Phoenix Flow Systems, San Diego, CA, USA)
according to manufacturer’s instructions. Cell apoptosis was
analyzed on a FACSCalibur (BD Biosciences) flow cytometer and
acquired data analyzed with Cell Quest v.3.3 (BD Biosciences).
Cell cycle analysis
HT-29 cells were cultured as described above in the
cell culture section and treated with conditioned macrophage media
for 24 h. In some experiments the cells were washed after treatment
and allowed to grow for an additional 24, 48 or 72 h in RPMI 5% FCS
prior to cell fixation. At the chosen time point, cells were
loosened by trypsinization (see above) and pooled with their
corresponding cell culture media containing possible loose cells,
centrifuged at 200 × g for 5 min and resuspended in PBS with 1%
bovine serum albumin (PBS/BSA). Cells were centrifuged again and
resuspended in 450 μl ice-cold PBS/BSA prior to fixation in
5 ml ice-cold 70% ethanol. Cells were stored at −20°C until
analysis.
Prior to analysis, Triton X-100 was added to a final
concentration of 0.1% and cells incubated 10 min at 6°C. Next,
cells were centrifuged at 200 × g for 10 min and resuspended in
PBS/BSA. Cells were washed an additional time and then resuspended
in PBS/BSA and added 0.1% Triton X-100, 50 μg/ml propidium
iodide (Sigma-Aldrich) and 200 μg/ml RNase A
(Sigma-Aldrich). Samples were incubated at room temperature for 45
min in the dark prior to analysis on a FACSCalibur (BD Biosciences)
flow cytometer. Cell cycle distribution was calculated using the
ModFit LT software v.3.1 (Verity Software House, Topsham, ME,
USA).
Immunocytochemistry
Human monocyte-derived macrophages of M0, M1 and M2
phenotype were loosened by trypsinization (see above) after 48 h of
differentiation and THP-1 macrophages after 24 h. About
50,000–100,000 cells were spun onto a positively charged microscope
glass slide (Thermo Scientific) and analyzed using monoclonal
antibodies against CD68 (clone KP1, Dako, Glostrup, Denmark) and
CD163 (clone 10D6, Novocastra, Leica microsystems, Newcastle, UK).
The epitope retrieval procedure for the commercial antibodies was
performed as described by the manufacturer. The immunocytochemistry
was performed in a Dako autostainer with the EnVision systems
reagents (Dako). After immunostaining, the nuclei were
counterstained with Mayer’s haematoxylin, dehydrated and mounted
using Tissue-Tek coverslipping film (Sakura Finetek, Torrence, CA,
USA). Analysis of CD68 and CD163 was performed on at least three
separate macrophage batches from different donors. Manual
calculations of the percentage of positively stained cells within
an area of 450 × 600 μm with approximately 200–400 cells
were performed.
Statistics
Two-sided Student’s t-test was used for all
statistical analysis. Paired Student’s t-test was used for all cell
counting experiments comparing treated samples vs. untreated
controls. The unpaired t-test was used for statistical analysis of
apoptosis and cell cycle experiments comparing treated samples vs.
untreated controls. Values are presented as mean ± standard
deviation (SD) unless otherwise stated. All experiments with
macrophages and CM from macrophages were performed with at least 3
different macrophage batches generated from different donors.
Results
Characterization of M1 and M2 macrophage
phenotypes and THP-1 macrophages
CM was generated from THP-1 macrophages (denoted
THP-1 M) as well as from human blood monocyte derived macrophages.
The monocyte derived macrophages were either not further
differentiated (denoted M0), differentiated with LPS plus INFγ or
IL4 plus IL13 to generate M1 and M2 macrophages, respectively. CM
were collected both during the differentiation of macrophages
(denoted M1DIFF and M2DIFF) and after
differentiation (denoted M1 and M2). THP-1 macrophages as well as
M0, M1 and M2 macrophages all stained positive for CD68 as
determined by immunocytochemistry. Regarding CD163 staining, M0
macrophages showed 80±5% positive cells (n=3 macrophage batches)
and M2 macrophages 70±10% (n=7 macrophage batches) while M1
macrophages showed only 5±5% positive cells (n=5 macrophage
batches) and THP-1 macrophages were negative. M1 macrophages
released IL12 (27±27 pg/ml, n=3 macrophage batches) while M0 and M2
macrophages released no detectable IL12 (less than 2 pg/ml). IL10
was released by both M1 macrophages (2,082±472 pg/ml, n=4
macrophage batches) and M2 macrophages (151±95 pg/ml, n=4
macrophage batches).
Differential effects of conditioned media
from macrophages of different phenotypes on HT-29 and CACO-2
proliferation
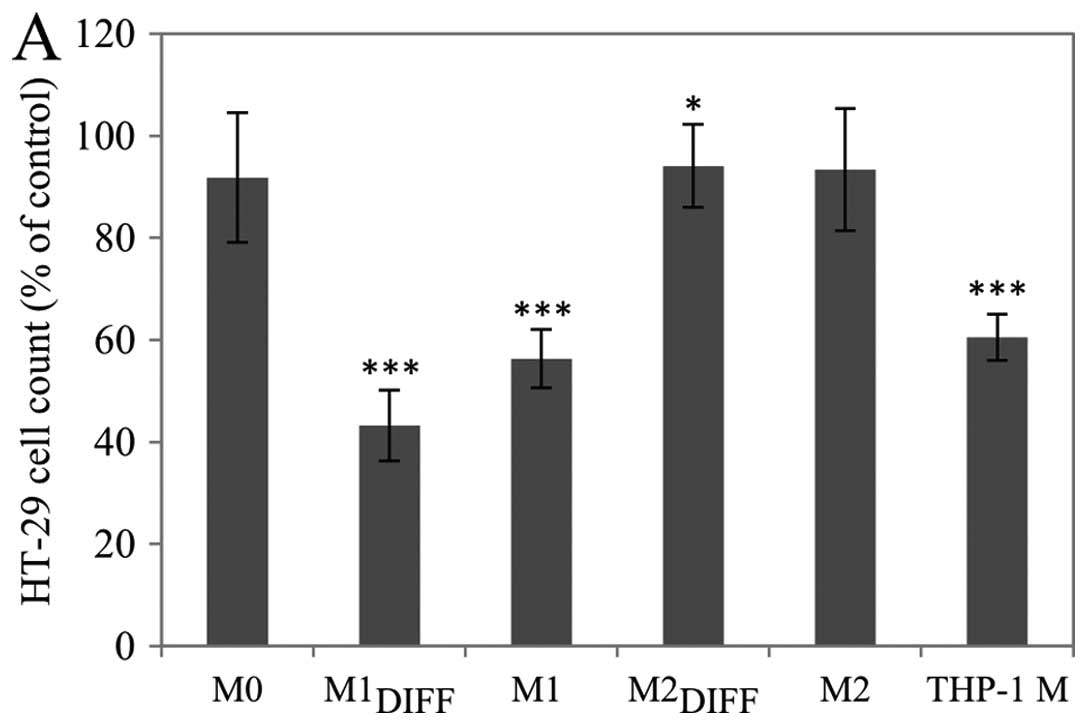
The effect of CM from different macrophage
phenotypes on the proliferation of the colon cancer cell lines
HT-29 and CACO-2 were investigated. Treatment with either
M1DIFF or M1 CM strongly inhibited the proliferation of
HT-29 cells, while treatment with M2DIFF, M2 or M0 CM
had no major effect on the proliferation (Fig. 1A). CM from THP-1 macrophages
inhibited proliferation of HT-29 cells by a similar extent as M1
CM. These effects were also seen when the CACO-2 colon cancer cell
line was investigated (Fig. 1B).
The inhibition of HT-29 proliferation in response to
M1DIFF, M1 and THP-1 M CM was dose-dependent with
M1DIFF CM being the most potent with a significant
(p<0.05) inhibition of proliferation already at 1/8th of full
dose (Fig. 1C).
In addition to the proliferative inhibition,
treatment with M1DIFF, but not M1 or THP-1 M CM, also
resulted in detachment of HT-29 cells from the culture dishes. The
detachment of HT-29 cells varied using different batches of
M1DIFF CM and amounted to 17±14% (n=6 macrophage
batches) of the total number of cells when treated with full dose
of CM.
Control experiments on HT-29 cells with LPS and IFNγ
were performed in order to ascertain that the effect of
M1DIFF CM was an effect of macrophage released
substances and not of the presence of residual LPS/IFNγ. Treatment
of HT-29 cells for 24 h with either LPS (100 ng/ml) or INFγ (20
ng/ml) did not suppress proliferation (results not shown). However,
the combined treatment with both LPS and INFγ caused a slight
reduction in cell numbers compared to control (92.5±7.6%,
p<0.05, n=7) and also to some extent generated detachment of
cells that amounted to 3±1% of the total number of cells.
M1DIFF CM was more potent than M1 CM
regarding inhibition of HT-29 cell proliferation and this was most
obvious using 1/2 and 1/4 doses (Fig.
1C). To assess if the more potent anti-proliferative effect of
M1DIFF was a synergistic effect between M1 released
products and exogenous LPS/IFNγ we added 50 ng/ml LPS + 10 ng/ml
IFNγ to 1/2 dose of M1 CM to evaluate if this would increase the
potency of M1 CM to that of M1DIFF. The addition of LPS
plus IFNγ to 1/2 dose of M1 CM only caused a minor (not
significant) decrease in cell numbers (81.5±1.5%, n=3) compared to
1/2 dose M1 CM alone (90.5±9.8%, n=3).
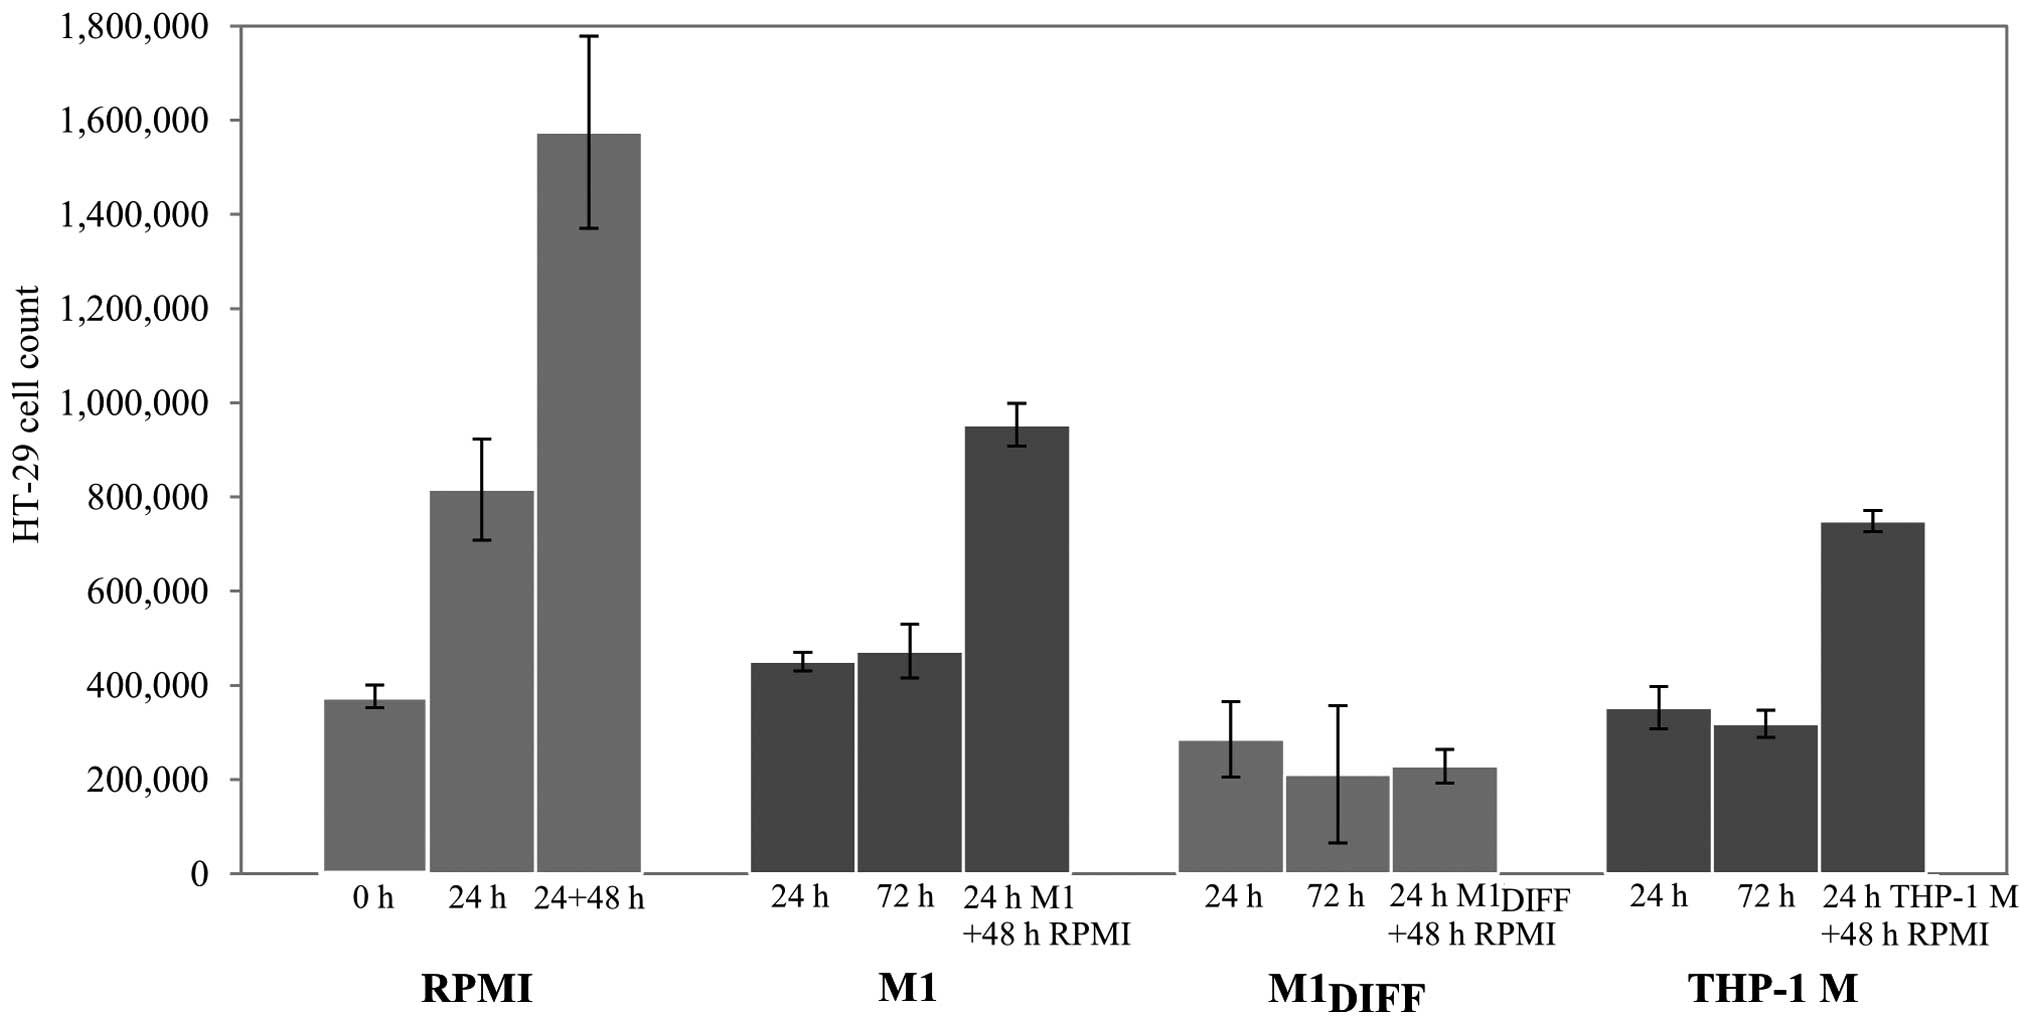
To further evaluate the inhibitory effects of
M1DIFF, M1 and THP-1 M CM on HT-29 cell proliferation we
treated cells for 24 h and allowed the cells to recover by further
culturing in RPMI 5% FCS for 48 h. While the HT-29 cells that had
been treated with M1DIFF CM did not regain their
proliferative ability during the 48 h recovery phase, HT-29 cells
treated with M1 or THP-1 M CM did so (Fig. 2). Results in Fig. 2 also show an almost complete
inhibition of cell growth in cells treated with M1,
M1DIFF or THP-1 M CM based on similar cell numbers after
treatment compared to cell numbers at start of experiment (compare
0 h with 24 h treatment).
Conditioned media from different
macrophage phenotypes affects apoptosis of HT-29 cells
differently
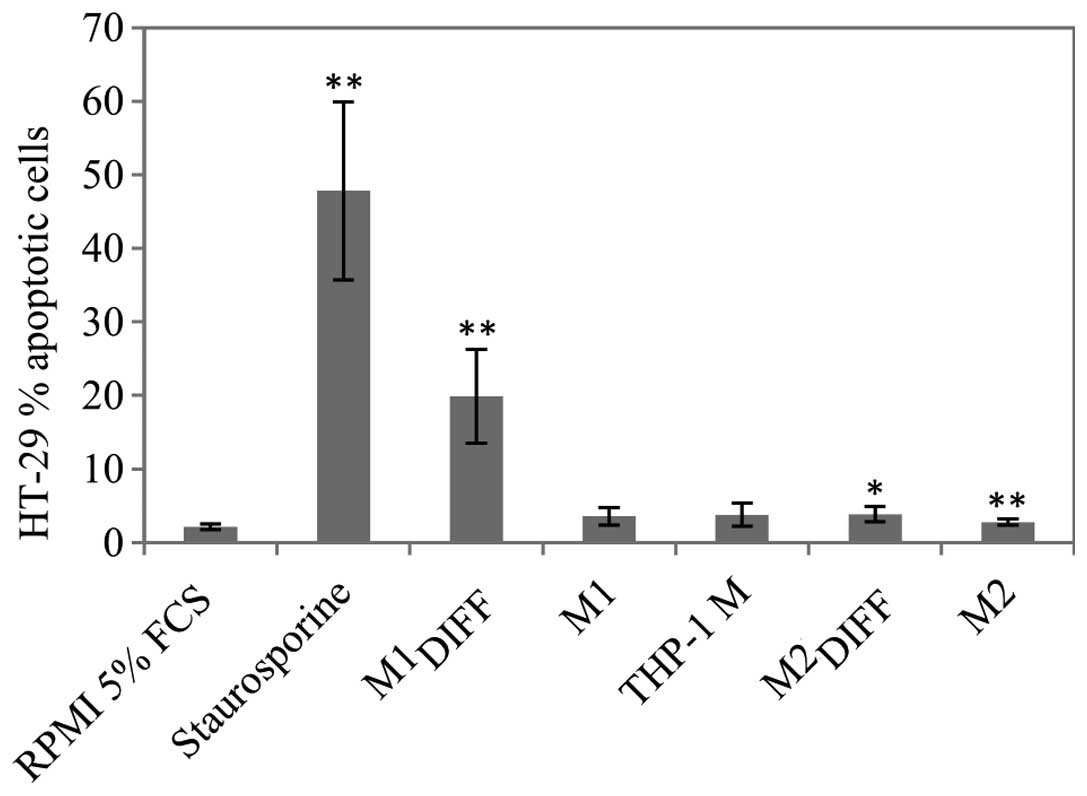
Since there was a decrease in cell count after
treatment of HT-29 cells with M1DIFF, M1 and THP-1 M CM,
apoptosis was determined using a TUNEL assay. M1DIFF was
the only CM that induced a major increase of apoptosis in HT-29
cells (Fig. 3). Treatment of HT-29
cells with 1/2 dose of M1DIFF CM also induced apoptosis
and to the same extent as full dose (results not shown). Since
treatment with M1DIFF CM resulted in detachment of HT-29
cells we also measured apoptosis of detached and adherent cells
separately. Almost all of the detached cells gave an apoptotic
signal whereas the adherent cells only showed a slight
non-significant increase in apoptosis compared to control cells
(results not shown).
Treatment of HT-29 cells with conditioned
media from different macrophage phenotypes affects cell cycle
distribution
We analyzed if the growth inhibition of HT-29 cells
could be explained by cell cycle arrest. After treatment of HT-29
cells with M1DIFF, M1 or THP-1 M CM the percentage of
HT-29 cells in S phase significantly decreased while the percentage
of cells in G2/M phase significantly increased
indicating a G0/G1 as well as a
G2/M cell cycle arrest (Table I). Cell cycle analysis of HT-29
cells that had been allowed to recover in fresh media after
treatment with M1 or THP-1 M CM revealed cell cycle distribution
similar to control. In contrast, HT-29 cells that had been allowed
to recover after treatment with M1DIFF CM showed an
accumulation of cells in S phase with very few cells in
G2/M phase (Table I).
In agreement with apoptosis results (Fig. 3) HT-29 cells treated with
M1DIFF CM also showed an increase of cells with a
sub-G1 signal (Table
I), another estimate of apoptosis.
 | Table I.Cell cycle analysis of HT-29 cells
treated 24 h with macrophage CM with or without a subsequent
recovery time in RPMI 5% FCS. |
Table I.
Cell cycle analysis of HT-29 cells
treated 24 h with macrophage CM with or without a subsequent
recovery time in RPMI 5% FCS.
| Conditioned medium
24 h treatment | Recovery time in
RPMI 5% FCS (h) |
G0/G1 (%) | S (%) | G2/M
(%) |
Sub-G1/apoptosis (% of all
events) |
|---|
| RPMI 5% FCS | - | 67.5±3.9 | 19.9±3.0 | 12.6±2.4 | 2.3±0.7 |
| M1 | - | 69.4±4.3 | 4.8±1.3c | 25.8±4.2c | 2.8±0.4 |
|
M1DIFF | - | 73.3±2.4a | 7.1±1.4c | 19.6±3.2b | 26.1±12.5b |
| M2 | - | 73.2±2.7a | 17.0±5.4 | 9.7±3.0a | 2.5±0.4 |
|
M2DIFF | - | 75.1±4.5a | 16.5±3.6 | 8.4±3.7a | 2.7±0.5 |
| THP-1 M | - | 76.5±5.7c | 3.3±0.6c | 20.3±5.2b | 2.1±0.3 |
| M1 | 24 | 63.1±4.9 | 22.6±3.7 | 14.3±1.6 | 4.3±1.4 |
| THP-1 M | 24 | 63.8±2.5 | 21.9±2.0 | 14.3±1.2 | 3.8±0.8 |
|
M1DIFF | 24 | 62.3±9.8 | 36.9±1.4 | 0.8±1.4 | 15.4±4.0 |
|
M1DIFF | 48 | 59.2±7.1 | 36.8±5.4 | 4.0±2.1 | 21.3±8.1 |
|
M1DIFF | 72 | 72.7±8.2 | 26.8±8.8 | 0.6±0.7 | 28.2±3.6 |
Cytokine and chemokine expression
profiles of M1 and M2 macrophages
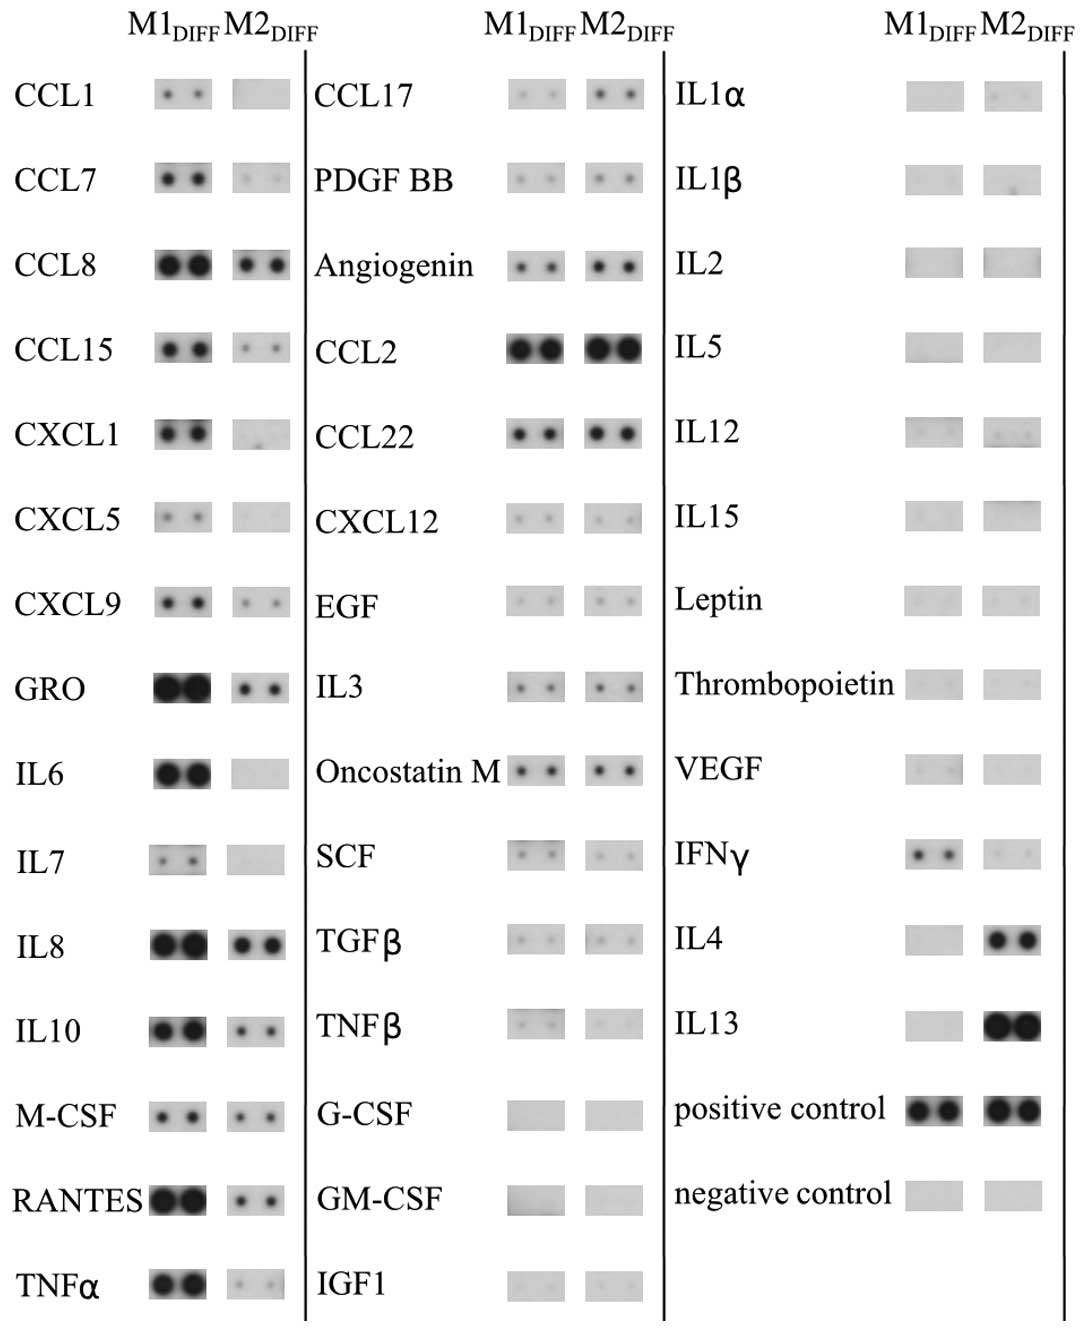
In an attempt to identify cytokines and chemokines
that could be responsible for the inhibition of proliferation of
the colon cancer cell lines we analyzed CM from M1 and M2
macrophages using a protein array. The array demonstrated that M1
macrophages released the cytokines/chemokines TNFα, IL6, IL8, IL10,
CCL7, CCL8, CCL15, CXCL1, CXCL9 and RANTES to a much larger extent
compared to M2 macrophages (Fig.
4). M2 macrophages released more CCL17 than M1 macrophages. The
THP-1 macrophages released a cytokine/chemokine pattern similar to
M1 macrophages (results not shown). Among the cytokines detected in
M1DIFF CM, TNFα and CXCL9 were added directly to HT-29
cells for evaluation of effects on cell growth. A 24-h treatment
with TNFα (100 ng/ml) or CXCL9 (100 ng/ml) to HT-29 gave 104±21%
(n=4) and 109±14% (n=5) cells compared to control,
respectively.
Discussion
Macrophages are functionally plastic cells that can
adopt two main types, classically activated M1 and alternatively
activated M2 phenotypes (17). The
existence of macrophages in tumor tissue is well established and
there they may influence various aspects of cancer progression
including proliferation of tumor cells. In this study we
investigated the effect of CM from different phenotypes of
macrophages on the growth of the colon cancer cell lines HT-29 and
CACO-2. While CM from M0 and M2 macrophages had no effect on the
growth of HT-29 and CACO-2 cells a substantial inhibition of the
growth was seen in response to CM from THP-1 macrophages and M1
macrophages. The reduction in cell number of the cancer cell lines
down to about 50% of control, indicate an almost complete
inhibition of growth. The M1DIFF CM was the most potent
and a significant inhibition of HT-29 cell growth could be seen
using 1/8th of full dose. The M1DIFF CM was generated
during the differentiation of the macrophages to M1 and therefore
contains residual LPS and IFNγ with the potential of affecting
growth of HT-29 cells. A direct addition of LPS plus IFNγ to HT-29
cells, as well as addition of LPS plus IFNγ to a suboptimal dose
(1/2 dose) of M1 CM, gave only a minor inhibition of the growth of
HT-29 cells. This minor effect by LPS plus IFNγ is therefore less
likely to be the sole explanation for M1DIFF CM being
substantially more potent than M1 CM. A more plausible explanation
is a difference in concentration of the soluble factor/factors
present in these two different CM.
The inhibition of HT-29 cell growth in response to
THP-1 M, M1DIFF and M1 CM was accompanied by a change in
the cell cycle distribution with a decrease of cells in the S phase
and increase in the G2/M phase, indicating arrest in
both G0/G1 and G2/M phases. In
addition to the cell cycle arrest, M1DIFF CM, but no
other CM induced apoptosis of the HT-29 cells. Furthermore, HT-29
cells that had been treated with M1DIFF CM neither
regained proliferation or normalized their cell cycle distribution
upon subsequent culture in fresh media which is in agreement with
the cells being apoptotic.
Reduced proliferation in response to CM from M1
macrophages has previously been shown for renal clear cell
carcinoma (36) and breast cancer
cell lines (19). An increase in
proliferation has been seen for the colon cancer cell line HCT116
in response to CM from LPS treated murine macrophages of the cell
line RAW 264.7 (37). This is in
contrast to our results in HT-29 and CACO-2 cells, and also
somewhat surprising since the LPS treated RAW 264.7 cells were
shown to release substantial amounts of TNFα, IL1 and IL6
indicating a pro-inflammatory phenotype of the macrophages. THP-1
macrophages differentiated with phorbol 12-myristate 13-acetate has
been shown to release pro-inflammatory cytokines such as TNFα, IL8
and IL1β (38) and our results
reveals similar effects on cancer cell growth and cell cycle
regulation between our THP-1 M and M1 CM suggesting an M1-like type
of these macrophages.
The macrophages used in our study were characterized
by immunocytochemistry and M2 macrophages showed high expression of
CD163 while M1 had a low expression, which are results supported by
other studies (19,39). The M1 macrophages released IL12
which is in agreement with the general view of this macrophage
being of a pro-inflammatory (M1) phenotype (40). Although release of high amounts of
IL10 is considered as a hallmark of the M2 phenotype of macrophages
(41) we found that both M1 and M2
macrophages released IL10 and that the release was higher from M1
than M2 macrophages. The high release of IL10 from M1 macrophages
in our experiments could be explained by the fact that LPS is known
to induce IL10 expression in human macrophages differentiated with
M-CSF (42).
The cytokine array revealed higher expression of
TNFα, IL6, IL8, IL10, CCL7, CCL8, CCL15, CXCL1, CXCL9 and RANTES in
M1 compared to M2 macrophages. TNFα is a well known
pro-inflammatory cytokine and has in most cases been linked to
reduced proliferation of cancer cell lines. In HCT116 cells, a
colon cancer cell line, TNFα has been shown to inhibit
proliferation (43) and induce
apoptosis (44) while in the
breast cancer cell line T47D both inhibition (19) and stimulation (45) of proliferation has been seen. We
have not been able to observe any effect on the HT-29 cell
proliferation in response to a direct addition of TNFα.
CXCL9 is a chemokine that is released in response to
IFNγ stimulation of mononuclear cells including macrophages
(46). Although less well studied,
CXCL9 is thought to be involved in T cell trafficking and has been
defined as an anti-angiogenic chemokine (47). Regarding effects on cell growth,
CXCL9 has been shown to inhibit intestinal cell proliferation
(48) and also to have antitumor
activity in a murine cancer model (49). However, we have not been able to
see any effects on the HT29 cell proliferation in response to
direct addition of CXCL9.
In summary, our results show that CM from THP-1
macrophages and human macrophages of M1 but not M2 phenotype
inhibited the growth of the colon cancer cell lines HT29 and CACO-2
and that this was accompanied by cell cycle arrest in
G0/G1 and G2/M. Among the
cytokines/chemokines selectively released by M1 macrophages, TNFα
and CXCL9 did not have any effect on HT-29 cell proliferation
suggesting that other factor/factors released by macrophages are
responsible for the reduced proliferation and further experiments
have to be performed to identify these. Our results imply that the
presence of macrophages of the M1 phenotype in the tumor
environment would be beneficial for reducing colon cancer cell
growth.
Abbreviations:
|
CRC
|
colorectal cancer;
|
|
IL
|
interleukin;
|
|
TNF
|
tumor necrosis factor;
|
|
TAM
|
tumor associated macrophage;
|
|
LPS
|
lipopolysaccharide;
|
|
IFN
|
interferon;
|
|
THP-1 M
|
THP-1 macrophage;
|
|
M-CSF
|
macrophage colony-stimulating
factor;
|
|
M1
|
macrophage type 1;
|
|
M1DIFF
|
macrophage type 1 during
differentiation;
|
|
M2
|
macrophage type 2;
|
|
M2DIFF
|
macrophage type 2 during
differentiation;
|
|
CM
|
conditioned media
|
Acknowledgements
The present study was financially
supported by the County Council of Värmland. Örebro University is
gratefully acknowledged for financial support to D.D.
References
|
1.
|
Jemal A, Siegel R, Ward E, Hao Y, Xu J and
Thun MJ: Cancer statistics, 2009. CA Cancer J Clin. 59:225–249.
2009. View Article : Google Scholar
|
|
2.
|
Lozano R, Naghavi M, Foreman K, et al:
Global and regional mortality from 235 causes of death for 20 age
groups in 1990 and 2010: a systematic analysis for the Global
Burden of Disease Study 2010. Lancet. 380:2095–2128. 2012.
View Article : Google Scholar : PubMed/NCBI
|
|
3.
|
Power DG, Gloglowski E and Lipkin SM:
Clinical genetics of hereditary colorectal cancer. Hematol Oncol
Clin North Am. 24:837–859. 2010. View Article : Google Scholar : PubMed/NCBI
|
|
4.
|
Peyrin-Biroulet L, Lepage C, Jooste V,
Gueant JL, Faivre J and Bouvier AM: Colorectal cancer in
inflammatory bowel diseases: a population-based study (1976–2008).
Inflamm Bowel Dis. 18:2247–2251. 2012.PubMed/NCBI
|
|
5.
|
Vargas AJ and Thompson PA: Diet and
nutrient factors in colorectal cancer risk. Nutr Clin Pract.
27:613–623. 2012. View Article : Google Scholar : PubMed/NCBI
|
|
6.
|
Vipperla K and O’Keefe SJ: The microbiota
and its metabolites in colonic mucosal health and cancer risk. Nutr
Clin Pract. 27:624–635. 2012. View Article : Google Scholar : PubMed/NCBI
|
|
7.
|
Al-Sohaily S, Biankin A, Leong R,
Kohonen-Corish M and Warusavitarne J: Molecular pathways in
colorectal cancer. J Gastroenterol Hepatol. 27:1423–1431. 2012.
View Article : Google Scholar
|
|
8.
|
Cui G, Shi Y, Cui J, Tang F and Florholmen
J: Immune micro-environmental shift along human colorectal
adenoma-carcinoma sequence: is it relevant to tumor development,
biomarkers and biotherapeutic targets? Scand J Gastroenterol.
47:367–377. 2012. View Article : Google Scholar
|
|
9.
|
Taketo MM: Roles of stromal
microenvironment in colon cancer progression. J Biochem.
151:477–481. 2012. View Article : Google Scholar : PubMed/NCBI
|
|
10.
|
Quante M, Varga J, Wang TC and Greten FR:
The gastrointestinal tumor microenvironment. Gastroenterology.
145:63–78. 2013. View Article : Google Scholar
|
|
11.
|
Chen JJ, Yao PL, Yuan A, et al:
Up-regulation of tumor inter-leukin-8 expression by infiltrating
macrophages: its correlation with tumor angiogenesis and patient
survival in non-small cell lung cancer. Clin Cancer Res. 9:729–737.
2003.PubMed/NCBI
|
|
12.
|
Lewis CE and Pollard JW: Distinct role of
macrophages in different tumor microenvironments. Cancer Res.
66:605–612. 2006. View Article : Google Scholar : PubMed/NCBI
|
|
13.
|
Solinas G, Schiarea S, Liguori M, et al:
Tumor-conditioned macrophages secrete migration-stimulating factor:
a new marker for M2-polarization, influencing tumor cell motility.
J Immunol. 185:642–652. 2010. View Article : Google Scholar : PubMed/NCBI
|
|
14.
|
Hanahan D and Weinberg RA: Hallmarks of
cancer: the next generation. Cell. 144:646–674. 2011. View Article : Google Scholar : PubMed/NCBI
|
|
15.
|
Martinez FO, Gordon S, Locati M and
Mantovani A: Transcriptional profiling of the human
monocyte-to-macrophage differentiation and polarization: new
molecules and patterns of gene expression. J Immunol.
177:7303–7311. 2006. View Article : Google Scholar : PubMed/NCBI
|
|
16.
|
Watkins SK, Egilmez NK, Suttles J and
Stout RD: IL-12 rapidly alters the functional profile of
tumor-associated and tumor-infiltrating macrophages in vitro and in
vivo. J Immunol. 178:1357–1362. 2007. View Article : Google Scholar : PubMed/NCBI
|
|
17.
|
Sica A and Mantovani A: Macrophage
plasticity and polarization: in vivo veritas. J Clin Invest.
122:787–795. 2012. View
Article : Google Scholar
|
|
18.
|
Biswas SK, Allavena P and Mantovani A:
Tumor-associated macrophages: functional diversity, clinical
significance, and open questions. Semin Immunopathol. 35:585–600.
2013. View Article : Google Scholar : PubMed/NCBI
|
|
19.
|
Rey-Giraud F, Hafner M and Ries CH: In
vitro generation of monocyte-derived macrophages under serum-free
conditions improves their tumor promoting functions. PLoS One.
7:e426562012. View Article : Google Scholar : PubMed/NCBI
|
|
20.
|
Diaz-Gandarilla JA, Osorio-Trujillo C,
Hernandez-Ramirez VI and Talamas-Rohana P: PPAR activation induces
M1 macrophage polarization via cPLA(2)-COX-2 inhibition, activating
ROS production against Leishmania mexicana. Biomed Res Int.
2013:2152832013. View Article : Google Scholar : PubMed/NCBI
|
|
21.
|
Mosser DM and Edwards JP: Exploring the
full spectrum of macrophage activation. Nat Rev Immunol. 8:958–969.
2008. View
Article : Google Scholar : PubMed/NCBI
|
|
22.
|
Pello OM, De Pizzol M, Mirolo M, et al:
Role of c-MYC in alternative activation of human macrophages and
tumor-associated macrophage biology. Blood. 119:411–421. 2012.
View Article : Google Scholar : PubMed/NCBI
|
|
23.
|
Ruffell B, Affara NI and Coussens LM:
Differential macrophage programming in the tumor microenvironment.
Trends Immunol. 33:119–126. 2012. View Article : Google Scholar : PubMed/NCBI
|
|
24.
|
Mantovani A, Sica A, Sozzani S, Allavena
P, Vecchi A and Locati M: The chemokine system in diverse forms of
macrophage activation and polarization. Trends Immunol. 25:677–686.
2004. View Article : Google Scholar : PubMed/NCBI
|
|
25.
|
Kim S, Takahashi H, Lin WW, et al:
Carcinoma-produced factors activate myeloid cells through TLR2 to
stimulate metastasis. Nature. 457:102–106. 2009. View Article : Google Scholar : PubMed/NCBI
|
|
26.
|
Rogers TL and Holen I: Tumour macrophages
as potential targets of bisphosphonates. J Transl Med. 9:1772011.
View Article : Google Scholar : PubMed/NCBI
|
|
27.
|
Erreni M, Mantovani A and Allavena P:
Tumor-associated macrophages (TAM) and inflammation in colorectal
cancer. Cancer Microenviron. 4:141–154. 2011. View Article : Google Scholar : PubMed/NCBI
|
|
28.
|
Sica A, Schioppa T, Mantovani A and
Allavena P: Tumour-associated macrophages are a distinct M2
polarised population promoting tumour progression: potential
targets of anti-cancer therapy. Eur J Cancer. 42:717–727. 2006.
View Article : Google Scholar : PubMed/NCBI
|
|
29.
|
Barbera-Guillem E, Nyhus JK, Wolford CC,
Friece CR and Sampsel JW: Vascular endothelial growth factor
secretion by tumor-infiltrating macrophages essentially supports
tumor angiogenesis, and IgG immune complexes potentiate the
process. Cancer Res. 62:7042–7049. 2002.
|
|
30.
|
Pancione M, Forte N, Sabatino L, et al:
Reduced beta-catenin and peroxisome proliferator-activated
receptor-gamma expression levels are associated with colorectal
cancer metastatic progression: correlation with tumor-associated
macrophages, cyclooxygenase 2, and patient outcome. Hum Pathol.
40:714–725. 2009. View Article : Google Scholar
|
|
31.
|
Bailey C, Negus R, Morris A, et al:
Chemokine expression is associated with the accumulation of tumour
associated macrophages (TAMs) and progression in human colorectal
cancer. Clin Exp Metastasis. 24:121–130. 2007. View Article : Google Scholar : PubMed/NCBI
|
|
32.
|
Algars A, Irjala H, Vaittinen S, et al:
Type and location of tumor-infiltrating macrophages and lymphatic
vessels predict survival of colorectal cancer patients. Int J
Cancer. 131:864–873. 2012. View Article : Google Scholar : PubMed/NCBI
|
|
33.
|
Forssell J, Oberg A, Henriksson ML,
Stenling R, Jung A and Palmqvist R: High macrophage infiltration
along the tumor front correlates with improved survival in colon
cancer. Clin Cancer Res. 13:1472–1479. 2007. View Article : Google Scholar : PubMed/NCBI
|
|
34.
|
Zhou Q, Peng RQ, Wu XJ, et al: The density
of macrophages in the invasive front is inversely correlated to
liver metastasis in colon cancer. J Transl Med. 8:132010.
View Article : Google Scholar : PubMed/NCBI
|
|
35.
|
Herrera M, Herrera A, Dominguez G, et al:
Cancer-associated fibroblast and M2 macrophage markers together
predict outcome in colorectal cancer patients. Cancer Sci.
104:437–444. 2013. View Article : Google Scholar : PubMed/NCBI
|
|
36.
|
Recalcati S, Locati M, Marini A, et al:
Differential regulation of iron homeostasis during human macrophage
polarized activation. Eur J Immunol. 40:824–835. 2010. View Article : Google Scholar : PubMed/NCBI
|
|
37.
|
Jedinak A, Dudhgaonkar S and Sliva D:
Activated macrophages induce metastatic behavior of colon cancer
cells. Immunobiology. 215:242–249. 2010. View Article : Google Scholar : PubMed/NCBI
|
|
38.
|
Park EK, Jung HS, Yang HI, Yoo MC, Kim C
and Kim KS: Optimized THP-1 differentiation is required for the
detection of responses to weak stimuli. Inflamm Res. 56:45–50.
2007. View Article : Google Scholar : PubMed/NCBI
|
|
39.
|
Lolmede K, Campana L, Vezzoli M, et al:
Inflammatory and alternatively activated human macrophages attract
vessel-associated stem cells, relying on separate HMGB1- and
MMP-9-dependent pathways. J Leukoc Biol. 85:779–787. 2009.
View Article : Google Scholar : PubMed/NCBI
|
|
40.
|
Sica A, Larghi P, Mancino A, et al:
Macrophage polarization in tumour progression. Semin Cancer Biol.
18:349–355. 2008. View Article : Google Scholar : PubMed/NCBI
|
|
41.
|
Gordon S and Martinez FO: Alternative
activation of macrophages: mechanism and functions. Immunity.
32:593–604. 2010. View Article : Google Scholar : PubMed/NCBI
|
|
42.
|
Kwan WH, Boix C, Gougelet N, Fridman WH
and Mueller CG: LPS induces rapid IL-10 release by
M-CSF-conditioned tolerogenic dendritic cell precursors. J Leukoc
Biol. 82:133–141. 2007. View Article : Google Scholar : PubMed/NCBI
|
|
43.
|
Park ES, Yoo JM, Yoo HS, Yoon DY, Yun YP
and Hong J: IL-32gamma enhances TNF-alpha-induced cell death in
colon cancer. Mol Carcinog. Dec 19–2012.(Epub ahead of print).
|
|
44.
|
Min HY, Chung HJ, Kim EH, Kim S, Park EJ
and Lee SK: Inhibition of cell growth and potentiation of tumor
necrosis factor-alpha (TNF-alpha)-induced apoptosis by a
phenanthroindolizidine alkaloid antofine in human colon cancer
cells. Biochem Pharmacol. 80:1356–1364. 2010. View Article : Google Scholar
|
|
45.
|
Rivas MA, Carnevale RP, Proietti CJ, et
al: TNF alpha acting on TNFR1 promotes breast cancer growth via
p42/P44 MAPK, JNK, Akt and NF-kappa B-dependent pathways. Exp Cell
Res. 314:509–529. 2008. View Article : Google Scholar : PubMed/NCBI
|
|
46.
|
Gasperini S, Marchi M, Calzetti F, et al:
Gene expression and production of the monokine induced by IFN-gamma
(MIG), IFN-inducible T cell alpha chemoattractant (I-TAC), and
IFN-gamma-inducible protein-10 (IP-10) chemokines by human
neutrophils. J Immunol. 162:4928–4937. 1999.PubMed/NCBI
|
|
47.
|
Erreni M, Bianchi P, Laghi L, et al:
Expression of chemokines and chemokine receptors in human colon
cancer. Methods Enzymol. 460:105–121. 2009. View Article : Google Scholar : PubMed/NCBI
|
|
48.
|
Han X, Wu Z, Di J, et al: CXCL9 attenuated
chemo-therapy-induced intestinal mucositis by inhibiting
proliferation and reducing apoptosis. Biomed Pharmacother.
65:547–554. 2011. View Article : Google Scholar : PubMed/NCBI
|
|
49.
|
Andersson A, Srivastava MK, Harris-White
M, et al: Role of CXCR3 ligands in IL-7/IL-7R alpha-Fc-mediated
antitumor activity in lung cancer. Clin Cancer Res. 17:3660–3672.
2011. View Article : Google Scholar : PubMed/NCBI
|