Introduction
Programmed cell death was first recognized as a
process of tissue restructuring (1) which led to the understanding that it
is a gene-guided progression that occurs naturally particularly in
the embryonic development of tissues, organs and limbs during the
growth and development of an organism (2–5).
This type of cell death is known as apoptosis and has been
recognized as an active regulatory mechanism complementary to, but
functionally opposite of, proliferation. Death programs are also
initiated in the somatic cells of mature organisms for the purposes
of tissue turnover and the eliminating of abnormal cells. Encoded
progressions are intrinsic to various programmed cell death
processes which include autophagy (6), apoptosis (7), anoikis (8) and possibly aspects of necrosis
(9,10). Cell death progressions can be
initiated by a variety of stimuli including free radicals, hypoxia,
hyperthermia, radiation, viral infections, toxins and cytotoxic
pharmacologic agents. These direct stimuli initiate programmed cell
death by what is referred to as intrinsic signaling pathways.
Intrinsic pathways are resisted by growth promoting cytokines and
the stimulation of growth factor and integrin receptors that
normally promote cell survival and simultaneously suppress death
programs. Conversely, intrinsic cell death progressions can be
initiated or assisted by the absence of required survival signals.
Thus, cells obtain survival signals via extracellular stimuli
provided by matrix proteins and growth factors within the cell’s
microenvironment. Survival signals are initiated via cell surface
receptors capable of implementing transduction mechanisms which
result in the recruitment and activation of intracellular effector
proteins. The transduction mechanisms of the integrin family of
receptors (11) along with insulin
type-1 (IGF1R) and epidermal growth factor (EGFR) receptors have
been particularly well studied (12,13)
and there is an emerging picture of interrelationships that exist
between their intracellular signaling systems (14,15).
The term apoptosis was coined in 1972 by Kerr et
al (16) and is the most
commonly used term to describe a form of programmed cell death that
is distinct from autophagy and necrosis. Anoikis is a particular
form of apoptosis induced by the disruption of integrin mediated
cell-matrix interactions (17).
Integrins constitute an important cell surface system that provides
cells with anchorage and growth properties (18,19).
The disruption of anchorage-dependent cell growth mechanisms was
quickly realized to be an initiator of anoikic pathways (20,21).
Anoikis and apoptosis together are important aspects of controlling
cancer progression. It is well known that non-necrotic radiological
and pharmacological treatments of tumors induce cell death
primarily by apoptosis (22).
There is considerable interest in the resistance of cancer cells to
anoikis (23), along with
resistance to drug/radiation induced apoptosis, particularly in the
context of metastases, invasiveness and therapeutic regimens in a
variety of cancer cell types (24–26).
Although there may be a continuum of biochemical and
cytomorphological changes when comparing apoptosis to necrosis
(27), cells undergoing apoptosis
manifest some morphological changes that are distinguishable from
necrosis (28). Morphological
changes that are characteristic of apoptosis include cell
shrinkage, chromatin condensation, blebbing at the cell surface
with an intact plasma membrane, and nuclear fragmentation that is
contained within the cell or within the apoptotic blebs of the
cell. As apoptosis progresses the population of apoptotic cells can
lose cell-to-cell adhesions and will separate from neighboring
cells and the extracellular matrix. This raises the question of
whether there is a reduction in the transcription/translation of
integrin receptors, as cells undergo apoptosis. Alternatively, the
loss of integrin determinants may involve an enzymatic degradation
by cell sheddases that are activated by the apoptotic process.
Using the LN18 glioblastoma cell line as a model, we investigated
whether integrins, growth factor receptors and MHC-1 determinants
are modified as cells proceed throughout the process of
apoptosis.
Materials and methods
Cell type and culture conditions
The LN18 cell line (ATCC, CRL-2610) was established
in 1976 from a patient with a right temporal lobe glioma. The cells
are poorly differentiated, adherent and grow well in culture
(29). LN18 cells were maintained
in Dulbecco’s modified Eagle’s medium, free of phenol red and
supplemented with the dipeptide L-alanyl-L-glutamine (2 mM),
non-essential amino acids, pyruvate (100 μg/ml), penicillin
(100 U/ml), streptomycin (100 μg/ml), amphotericin B (0.25
μg/ml), HEPES (25 mM), and fetal bovine serum (10%), at 37°C
in an atmosphere of 5% CO2. Cells were subcultured by
trypsinization (0.25% trypsin, EDTA). All reagents were purchased
from Sigma/Aldridge or Invitrogen.
Apoptotic inducing agents
MK886 (50 μM) and stauro sporine (1
μM) were used as apoptotic inducing agents. MK886 induces
apoptosis in a variety of cancer cells (30–33)
and inhibits the action of five lipoxygenase activating protein
(FLAP) and blocks the formation of leukotrienes generated by the
ALOX-5 pathway (34–36). Staurosporine inhibits a variety of
kinases including protein kinase C (37) and is a proven apoptotic inducing
agent (38,39).
Monolayers of LN18 cells assayed for
apoptosis by Annexin V binding, changes in mitochondrial potential,
TUNEL and release of soluble DNA-histone complexes
Apoptosis was demonstrated by established tests
including: morphological changes, release of
histone-associated-DNA-fragments from the nucleus into the
cytoplasm, Annexin V binding to membrane exposed
phosphatidylserine, changes in mitochondrial membrane potential and
the TUNEL assay. For examination by fluorescent microscopy, cells
were plated onto 8 chambered glass slides (Lab Tech II) at
2×10⁴ cells/chamber. Following adherence and treatment
with apoptotic inducing agents, the treated and DMSO vehicle
control cells were fixed with 0.1% paraformaldehyde-PBS for 15 min
at room temperature, washed and photographed digitally.
To assay for surface phosphatidylserine exposure
cells were stained with Annexin V-488 and PI per manufacturer’s
instructions (Roche, Annexin V-FLOUS kit). All flow cytometry
samples were assayed on the same day using a two laser, 4 color
FACSCalbur (BD Biosciences, San Jose, CA) with a minimum of 10,000
events per sample. Changes in the mitochondrial function were
detected by changes in fluorescent intensity of the mitochondrial
membrane binding dye Mito Tracker Deep Red 633 (Molecular Probes).
Cells were stained live at 37°C in 300 nM of Mito Tracker for 20
min. Cells were harvested and then fixed in 1% paraformaldehyde and
subsequently analyzed by flow cytometry. The TUNEL assay was
performed on treated and DMSO vehicle control cells according to
the manufacturer’s instructions (Invitrogen). Cells were washed and
fixed with 1% paraformaldehyde then permeabilized with 70% ethanol.
The fragmentation of nuclear DNA was detected by terminal
deoxynucleotidyl transferase (TdT)-mediated dUTP nick end-labeling
(TUNEL). The incorporated BrdU was immunocytochemically detected by
anti-Br-dU antibody conjugated with Alexa-488 dye. Once the cells
were labeled with anti-Br-dU antibody conjugated with Alexa-488
dye, the samples were assayed by flow cytometry.
Release of soluble DNA-histone
complexes
Release of soluble DNA-histone complexes into the
cytosol were detected in 96-well plates by an ELISA technique. LN18
cells were plated in 96-well microtiter plates (1×10⁴
cells/well). The cells were allowed to adhere overnight and then
treated with the indicated concentrations of MK886 or staurosporine
for the time periods indicated. Cells were carefully rinsed and
permeabilized by adding lysis buffer (Roche). After centrifugation,
supernatants of the permeabilized cells were transferred to
streptavidin-coated 96-well microtiter plates and tested for
DNA-histone complexes by ELISA using anti-histone-biotin antibody
followed by peroxidase conjugated anti-DNA using 2,2′-azino-bis
(3-ethylbenzthiazoline-6-sulfonic acid) as substrate (Roche Cell
Death Detection ELISA kit). The development of product was measured
in a Dynatech Microplate Reader at 405 nm with a reference
wavelength at 490 nm.
Cellular surface protein levels
determined by flow cytometry
Flow cytometry fluorescence intensity changes
enabled the determination of changes in levels of integrin
receptors, growth factor receptors and other cell surface cluster
determinants in non-apoptotic LN18 cells as compared to apoptotic
LN18 cells. Monolayers (90% confluent) of normal and MK886 or
staurosporine treated monolayers of LN18 cells were lifted from the
75 cm2 flasks by treatment with a non-enzymatic cell
dissociation buffer (Gibco). The cells were then washed with ice
cold PBS that was 0.5% in BSA, 1 μg/ml of purified human IgG
and then centrifuged at 400 × g for 10 min. Washed cells (100
μl) (1×10⁵ cells) were then reacted with purified
rabbit primary antibodies (5 ng/μl) or mouse primary
antibodies (5 ng/μl) directed against specific determinants
for 30 min on ice. The following antibodies were used as negative
isotype controls: rabbit anti-KLH (Sigma) and Mouse anti-KLH
(Biolegend). The following mouse anti-human primary antibodies were
used: anti-EGFR (Abcam), anti-IGF1R (Affymetrix), anti-HLA-ABC
(Biolegend), anti-integrin α2 (BD Biosciences) and anti-integrin β3
(BD Biosciences). Polyclonal rabbit anti-human MMP3 was purchased
from Sigma. The cells were then washed and centrifuged at 250 × g
for 10 min with ice cold PBS that was 0.5% in BSA. The cells were
subsequently incubated in a volume of 100 μl for 20 min with
phycoerythrin conjugated goat anti-rabbit IgG (Jackson
ImmunoResearch) or phycoerythrin conjugated anti-mouse IgG (Jackson
ImmunoResearch) at a reaction concentration of 1.5 ng/μl.
The cells were then washed 2x with PBS (0.1% normal goat serum),
fixed in 1% paraformaldehyde, washed and assayed by flow
cytometry.
Real-time RT-PCR
Total cellular RNA was isolated using TRIzol
reagent, following manufacturer’s instructions (Life Technologies).
Reverse transcriptase generated c-DNA(s) were obtained using random
hexamers with the high capacity archive kit (Applied Biosystems)
from RNA concentrations of 6.25 ng/μl. The c-DNA(s) were
allowed to form for 2 h at 37°C. Negative controls were generated
by omitting the reverse transcriptase in the cDNA-generating step.
For the PCR step, the primers and Taq-Man fluorescent probes were
purchased from Applied Biosystems. The primers were designed to
span an intron to avoid amplification of any contaminating DNA.
Real-time RT-PCR was performed using the Applied Biosystems Gene
Amp 5700 system with the Taq-Man Universal PCR Master Mix. Relative
mRNA levels were measured using the cycles to threshold (Ct)
method, defined as the cycle number that first gives detection of
the PCR amplicons above a fixed threshold baseline set within the
log phase of the plot of fluorescence versus cycle number. There
were 4 replicates for each sample. The amplicons were generated
over 40 cycles where each cycle consisted of a 15 sec dissociation
step at 92°C and a polymerization step at 60°C for 1 min. The
changes in Ct values (ΔCt) for the housekeeping gene β-actin were
obtained by subtracting the Ct value of the vehicle (DMSO) control
cells from the Ct value for the MK886 treated cells. The ΔCt values
for the genes of interest were similarly obtained. A normed (ΔΔCt)
was calculated for each sample by subtracting the ΔCt value of the
housekeeping gene β-actin (ACTB) from the ΔCt value for the gene of
interest. Samples were assayed by ANOVA followed by a Tukey test
with a p-value <0.05 accepted as a significant difference.
Results
MK886 and staurosporine induced apoptosis
manifest typical morphological changes
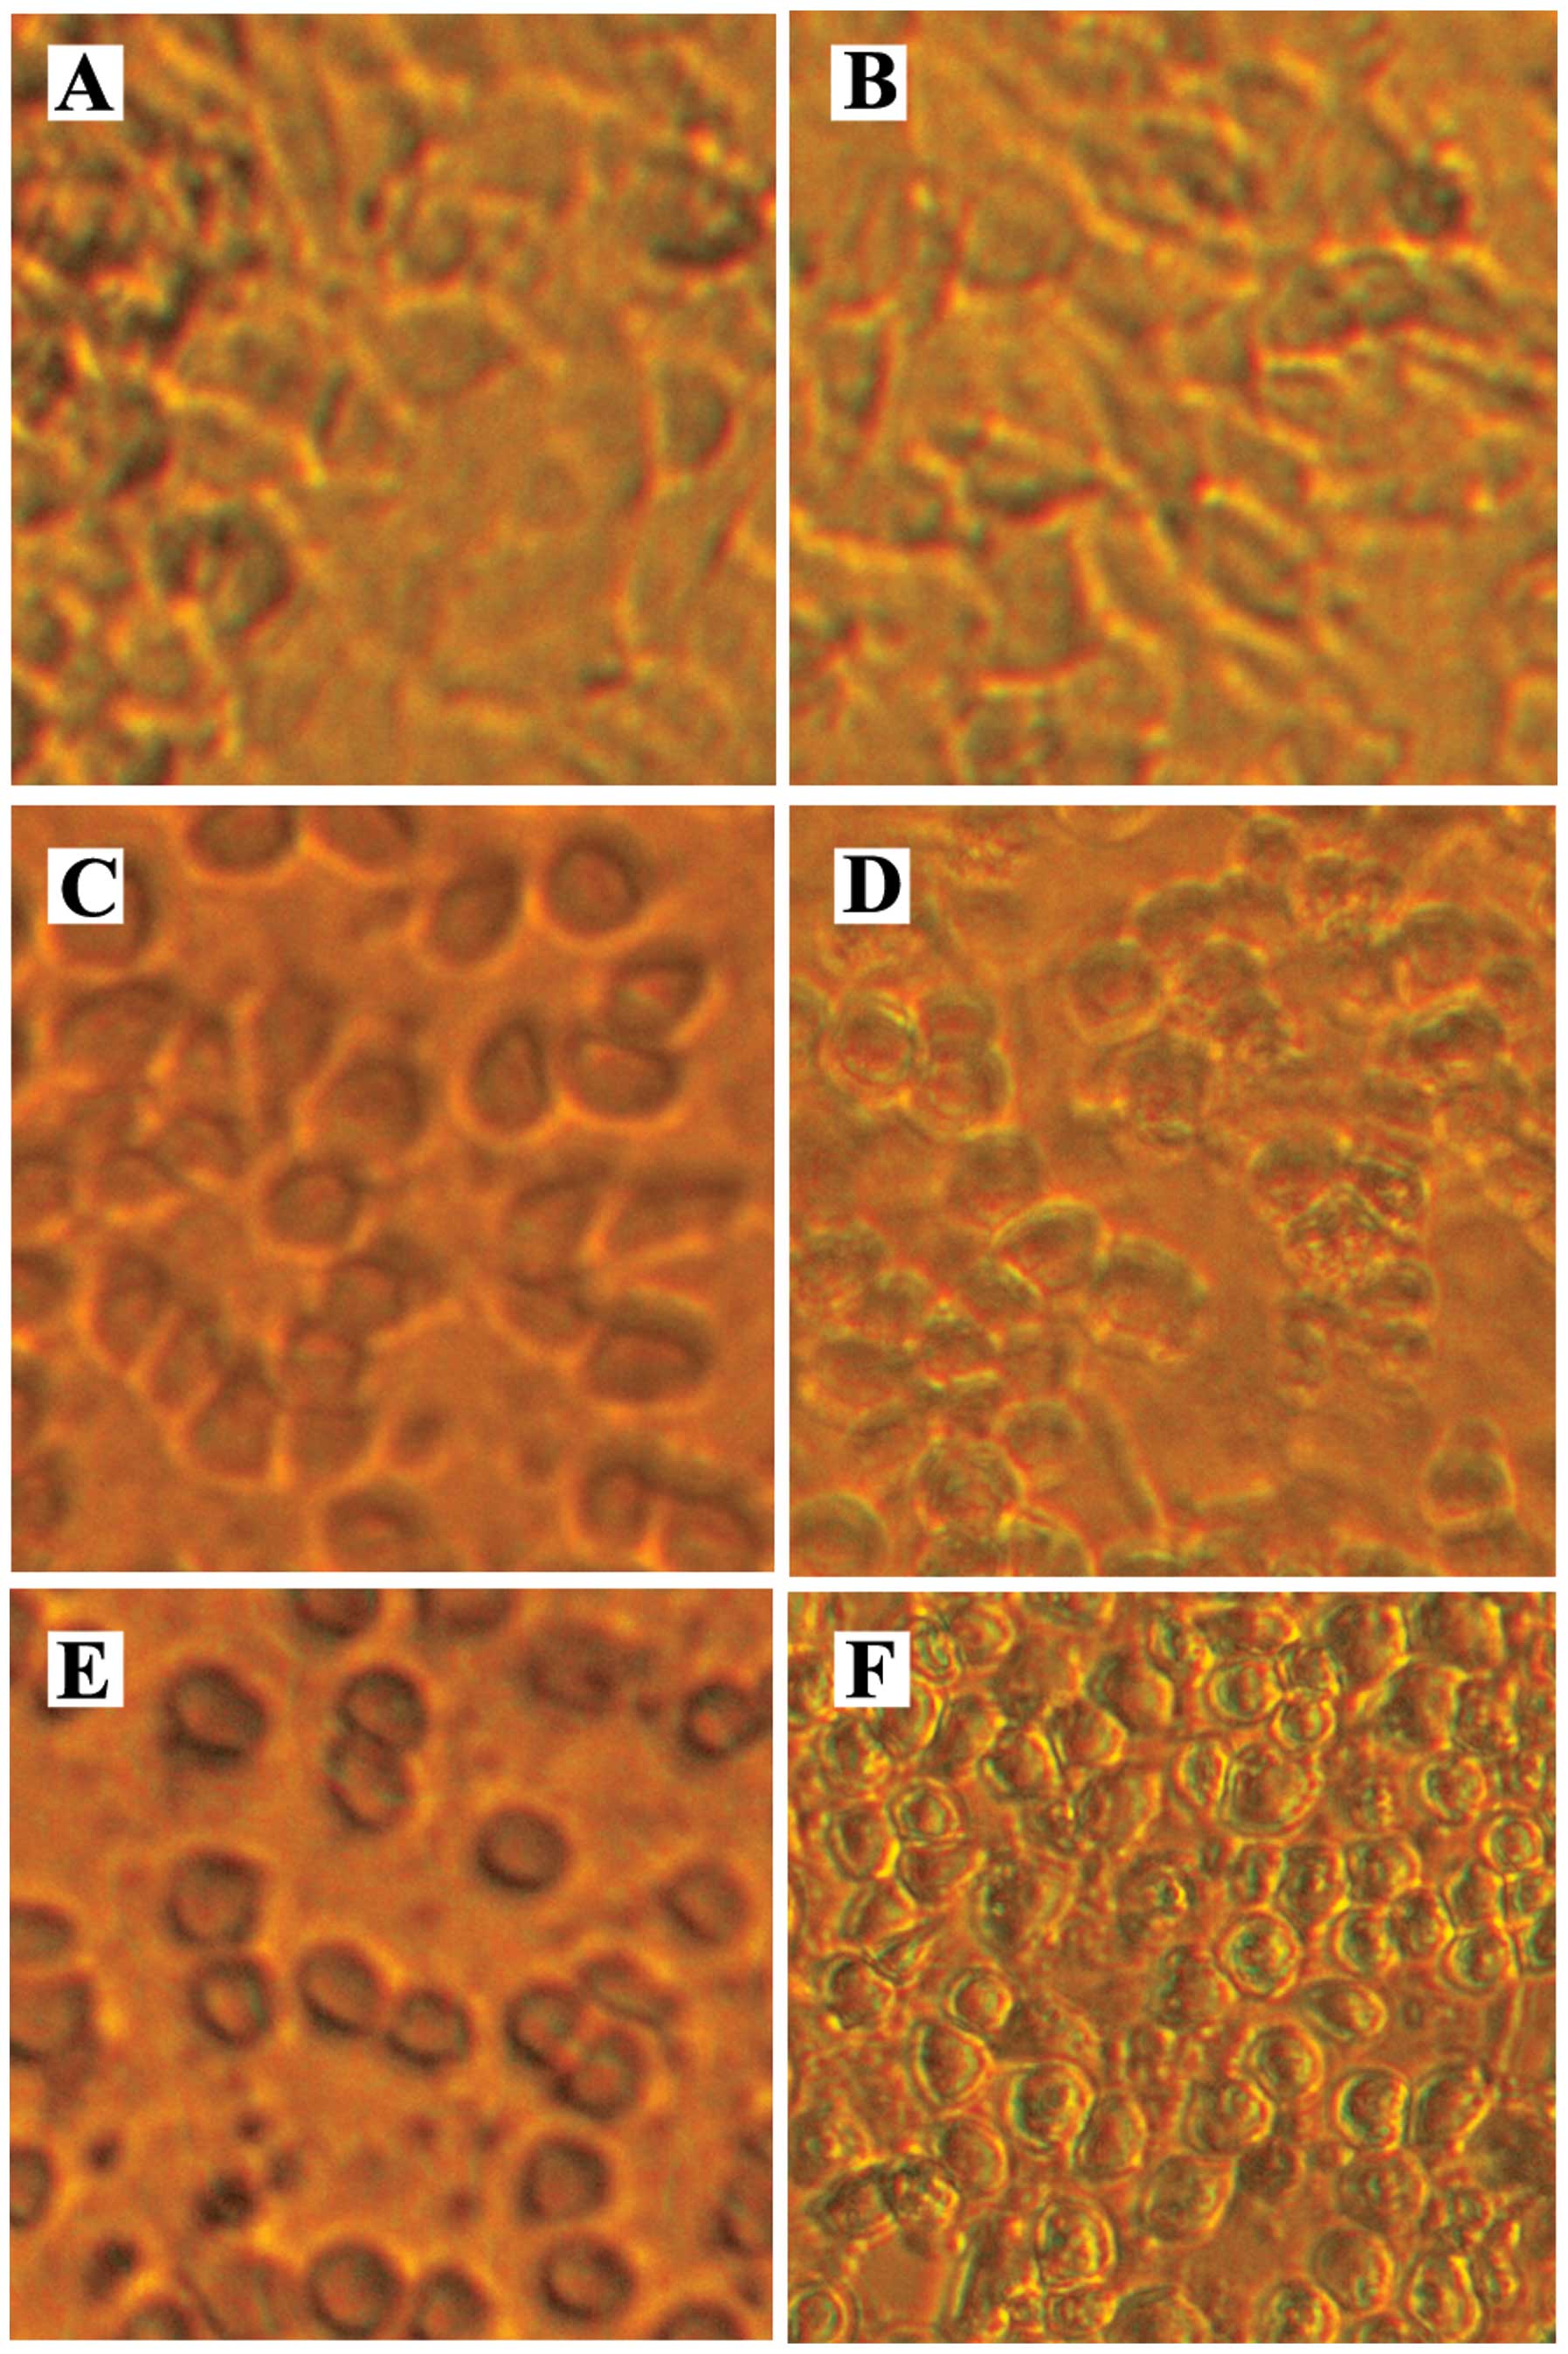
Fig. 1A and B are
micrographs of a confluent monolayer of DMSO vehicle control LN18
glioblastoma cells. The micrographs of the DMSO vehicle control
monolayers illustrate that there is contact between neighboring
cells. Micrographs showing treatment with 1 μM of
staurosporine (Fig. 1C and E) or
50 μM of MK886 (Fig. 1D and
F), each for 3 and 6 h, illustrate that monolayers of LN18
cells manifest the morphologic change of rounding and shrinking as
they proceed through apoptosis. It can be seen that by 3 h of
treatment with staurosporine the cells round up and are separate
from each other. By 6 h, the MK886 treated cells are also clearly
separate from each other resulting in a decrease in cell/cell
integrin signaling and consequently a decrease in survival
signaling. As the apoptotic process proceeds the cells shrink
further, form cell surface blebs and separate from the
extracellular matrix which further decrease integrin mediated
survival signaling (not shown).
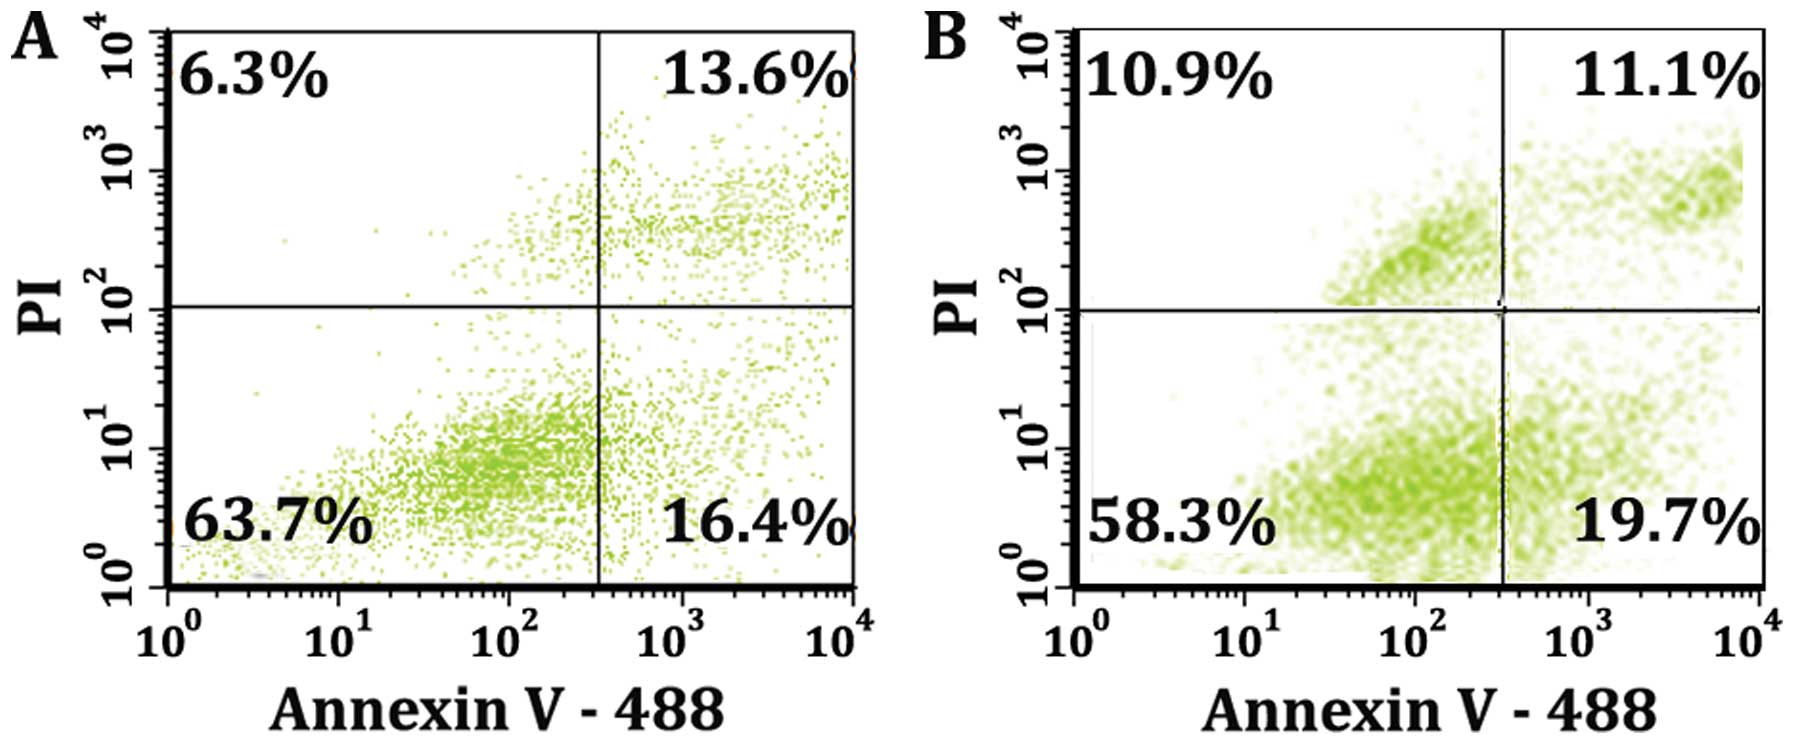
Translocation of phosphatidylserine that
is characteristic of apoptosis
Detecting exposure of phosphatidylserine on the
outer leaflet of the plasma membrane is one of the classic tests
for apoptosis. Phosphatidylserine exposure in the absence of plasma
membrane rupture indicates a state of apoptosis that is devoid of
necrosis. The most common test to separate populations and
determine the fraction of cells that are normal, pure apoptotic,
apoptotic/necrotic or necrotic is to generate dot plots and analyze
multiple colors of fluorescence with respect to each other. The dot
plots of Fig. 2 show the intensity
of fluorescence of cells that express Annexin V-488 binding
(abscissa) in comparison to the intensity of fluorescence of cells
that uptake the nuclear binding dye propidium iodide (ordinate).
The quadrants of Fig. 2A
demonstrate that at 8 h there is a mixed population of cells when
they are treated with 50 μM of MK886 for 8 h. The lower
right quadrant of Fig. 2A shows
that 16.4% of the total population express only Annexin V-488
binding illustrating the fraction of cells that are pure apoptotic
and devoid of any plasma membrane disruption. The lower left
quadrant of Fig. 2A shows that
population (63.7%) that has not progressed to phosphatidylserine
exposure or propidium iodide (PI) binding. The pharmacological
induction of apoptosis in vitro typically progresses into a
population that is apoptotic/ necrotic and finally necrotic. This
is demonstrated by the upper right quadrant of Fig. 2A which shows that 13.6% of the
cells of the population express both PI and Annexin V-488 while the
upper left quadrant 6.3% of the cells of the population express PI
only. The data of Fig. 2B are the
result of stimulating the cells with 1 μM of staurosporine
for 8 h. The quadrants for Fig. 2B
show a very similar pattern to the quadrants of Fig. 2A indicating that both MK886 and
staurosporine induced apoptosis result in an exposure of
phosphatidylserine. In addition to discriminating the population of
cells from each other, the double staining enables flow cytometry
gating as a function of fluorescent intensity and thus a separation
for further analysis of the apoptotic and non-apoptotic cell
populations.
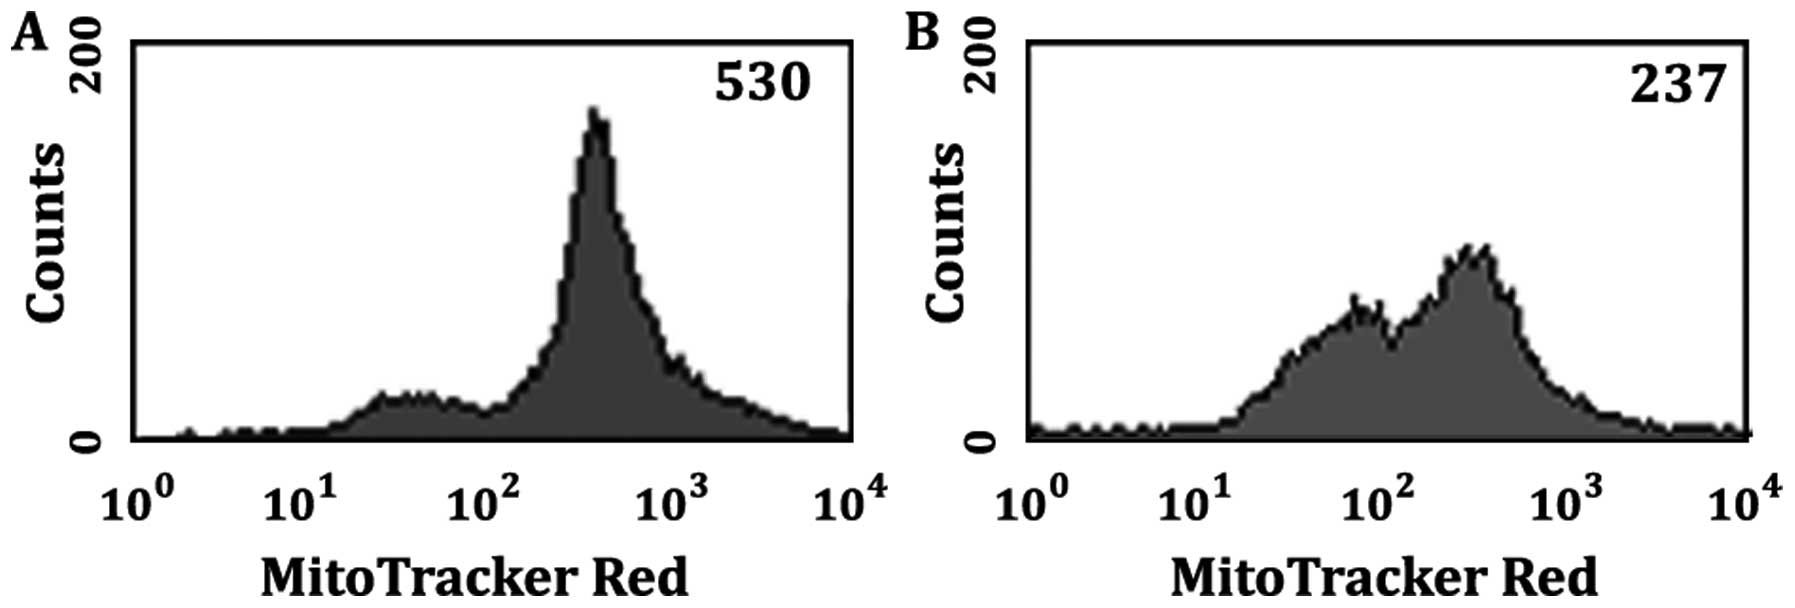
MK886 and staurosporine-induced apoptosis
is mitochondrial mediated
Changes in mitochondrial function are early events
in the pharmacological induction of apoptosis. The histograms of
Fig. 3 represent fluorescence
intensity of Mito Tracker Deep Red 633 dye versus cell count. The
Mito Tracker histograms show cells that were DMSO vehicle controls
(Fig. 3A) and cells that were
treated with 50 μM MK886 for 8 h (Fig. 3B). Cells were harvested and labeled
with Mito Tracker Deep Red 633 dye and analyzed by flow cytometry
as outlined in Materials and methods. It can be seen that the
intensity of the emissions of the mitochondria bound Mito Tracker
Deep Red decreases as the monolayer of LN18 cells proceed through
apoptosis. For Fig. 3 the median
fluorescent intensity (MFI) of the DMSO vehicle control LN18 cells
is 530 (Fig. 3A) whereas the MK886
treated cells show a decrease in average intensity to a value of
237 (Fig. 3B). Mito Tracker Deep
Red is a membrane potential-dependent fluorescent dye that becomes
permanently bound to the mitochondria, and remains attached after
the cell dies or is fixed. Downstream events of mitochondrial pore
activation leading to programmed cell death are associated with
changes in mitochondrial membrane potential. A decrease in
fluorescence intensity indicates a decrease in mitochondrial
membrane function which is a telltale sign that apoptosis is
occurring via a mitochondrial pathway. Similar results were
obtained for staurosporine indicating staurosporine induced
apoptosis is also mitochondria mediated (not shown).
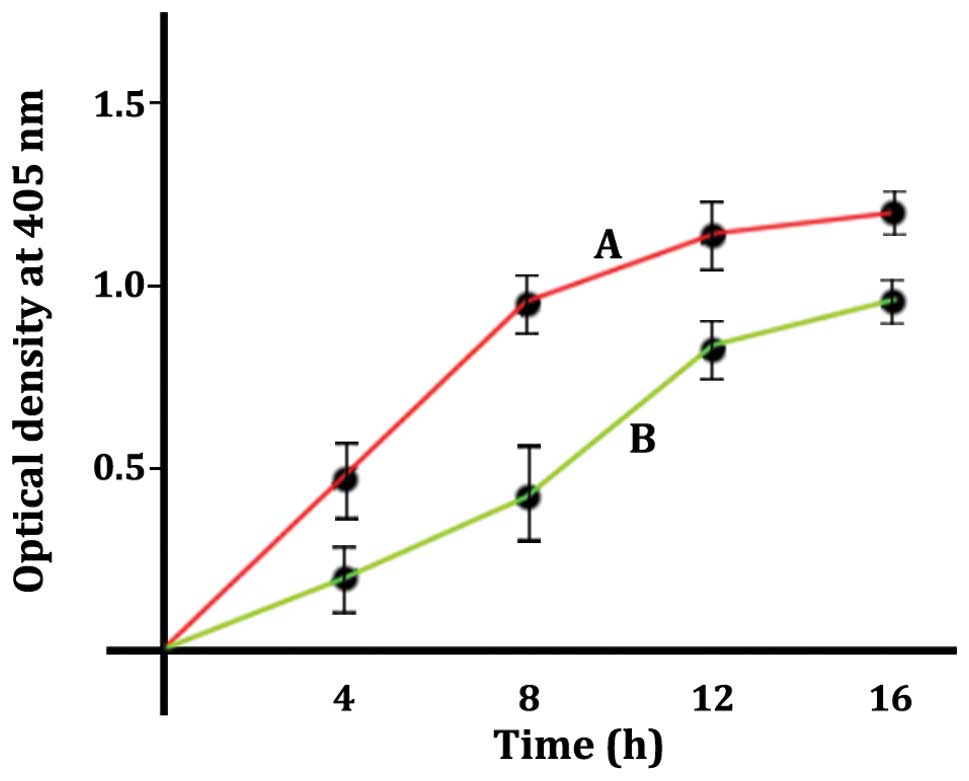
LN18 cells manifest nucleosome release
with an intact plasma membrane
Apoptosis as evidenced by nuclear disintegration and
the presence of soluble DNA/histone complexes as nucleosomes
released from the nucleus is illustrated in Fig. 4. LN18 cells were treated with 1
μM of staurosporine (curve A, red) or 50 μM of MK886
(curve B, green). The plots of Fig.
4 were generated by a quantitative
sandwich-enzyme-linked-immunoassay as described in the Materials
and methods. The increases in optical density indicate an increase
in the presence of mono- and oligonucleosomes in the cytoplasmic
fraction of the permeabilized cells. The optical densities of
Fig. 4 are presented as the values
minus the blank. Blank values for the cells that were
permeabilized, but not treated with inducing agent, gave an optical
density of <0.1. The supernatants from the samples that were not
permeabilized gave optical densities that were barely detectable
indicating the detected nucleosomes in curves A and B were released
from the nucleus by an apoptotic process. The time course shows
that staurosporine treatment (curve A, red) releases the DNA
histone complexes at a faster rate than the MK886 treated cells
(curve B, green). When comparing staurosporine to MK886, data
points of the two curves A and B were shown to be different by the
t-test with a p-value <0.05 accepted as a significant
difference.
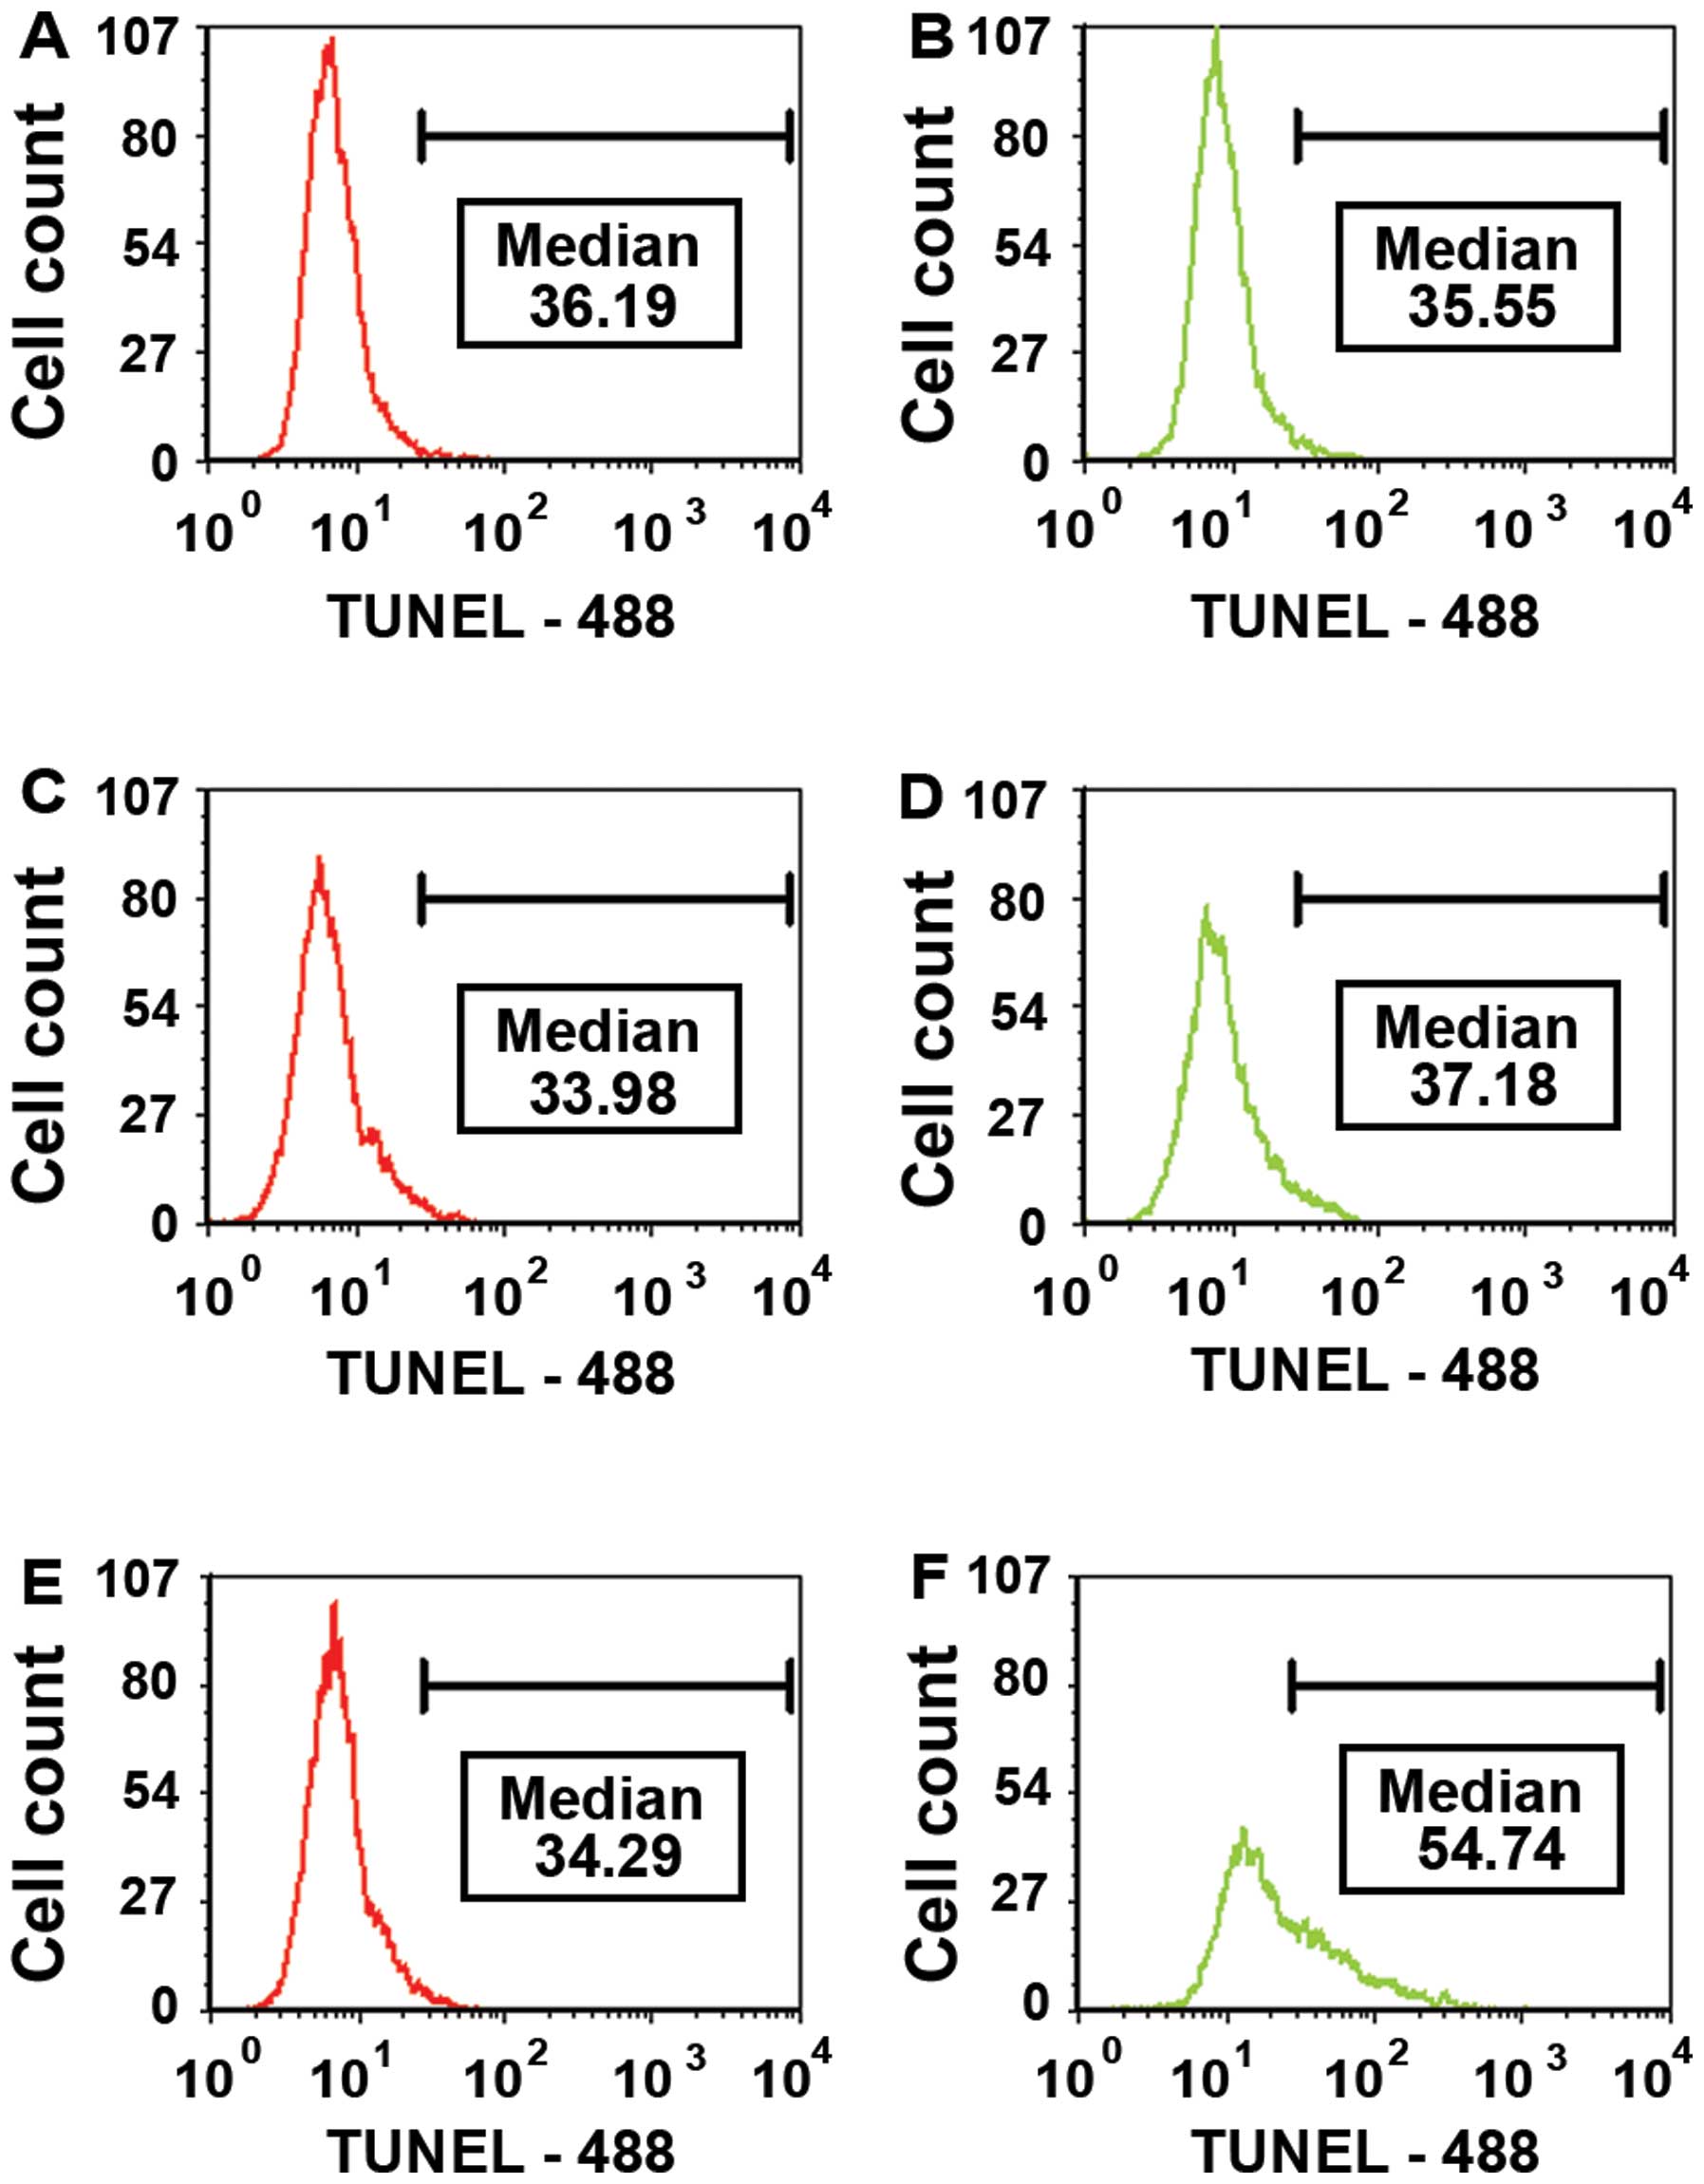
Cleaving double stranded DNA during late
apoptosis
Terminal Uridine Nick End-Labeling (TUNEL) is an
assay for detecting DNA fragmentation due to apoptosis. The TUNEL
assay is designed to detect late apoptosis. Extensive fragmentation
of nuclear DNA that generates a large number of DNA double-strand
breaks is one of the most characteristic events of late apoptosis.
The 3′OH-termini of the 2′-deoxyuridine 5′-triphosphate (dUTP)
nicks serve as primers and become labeled in this procedure with
BrdU when incubated with Br-dUTP in a reaction catalyzed by the
exogenous terminal deoxynucleotidyl transferase (TdT). The
histograms in Fig. 5 show the MFI
for the cell population gated for readings above 20 intensity
units. Fig. 5A, C and E
demonstrate the TUNEL histograms for DMSO vehicle control LN18
cells over a time period of 15 h while Fig. 5B, D and F illustrate the histograms
resulting from treating the LN18 cells with 1 μM of
staurosporine over the same time period. There was no significant
change in the DMSO vehicle control cell population over the 15 h.
Conversely, Fig. 5D shows a shift
of the cell population with corresponding higher median fluorescent
intensity (MFI) (54.74) indicating an increase in DNA double-strand
breaks as the cells proceed through apoptosis. The histograms of
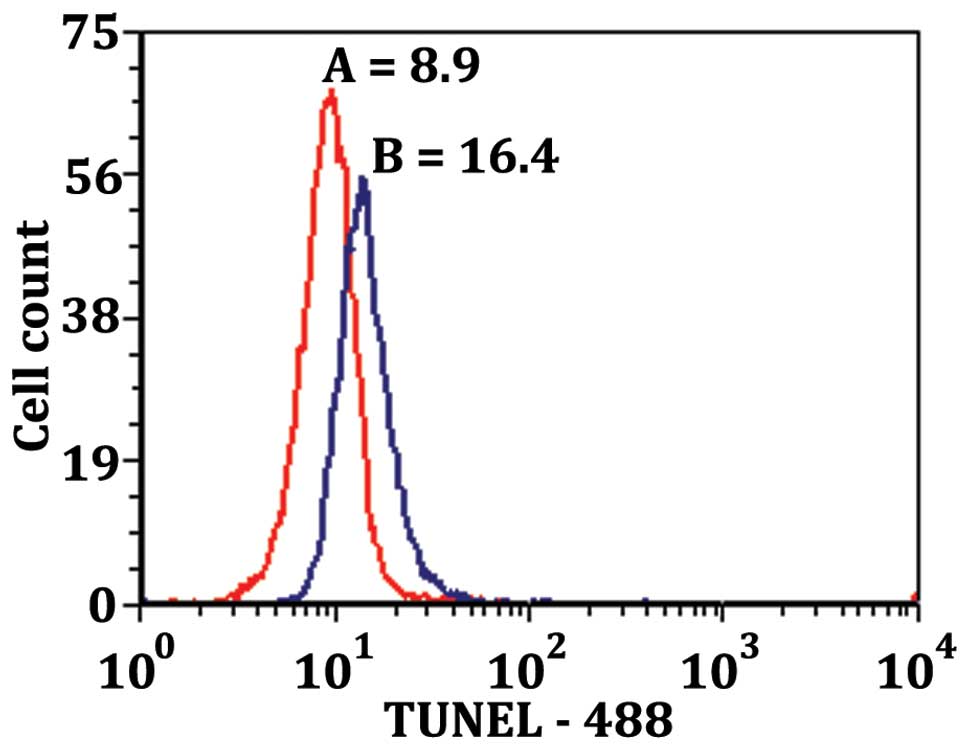
Fig. 6 show the TUNEL-488
intensity vs. cell count for LN18 cells treated with 50 μM
of MK886 for 12 h. Plot A of Fig.
6 is the TUNEL results of the non-apoptotic cell population
showing MFI of 8.9. Plot B of Fig.
6 shows the TUNEL results of apoptotic population showing MFI
twice as high as the non-apoptotic population (16.4 vs. 8.9). These
results demonstrate that there is more DNA fragmentation in the
apoptotic population of the MK886 treated cells.
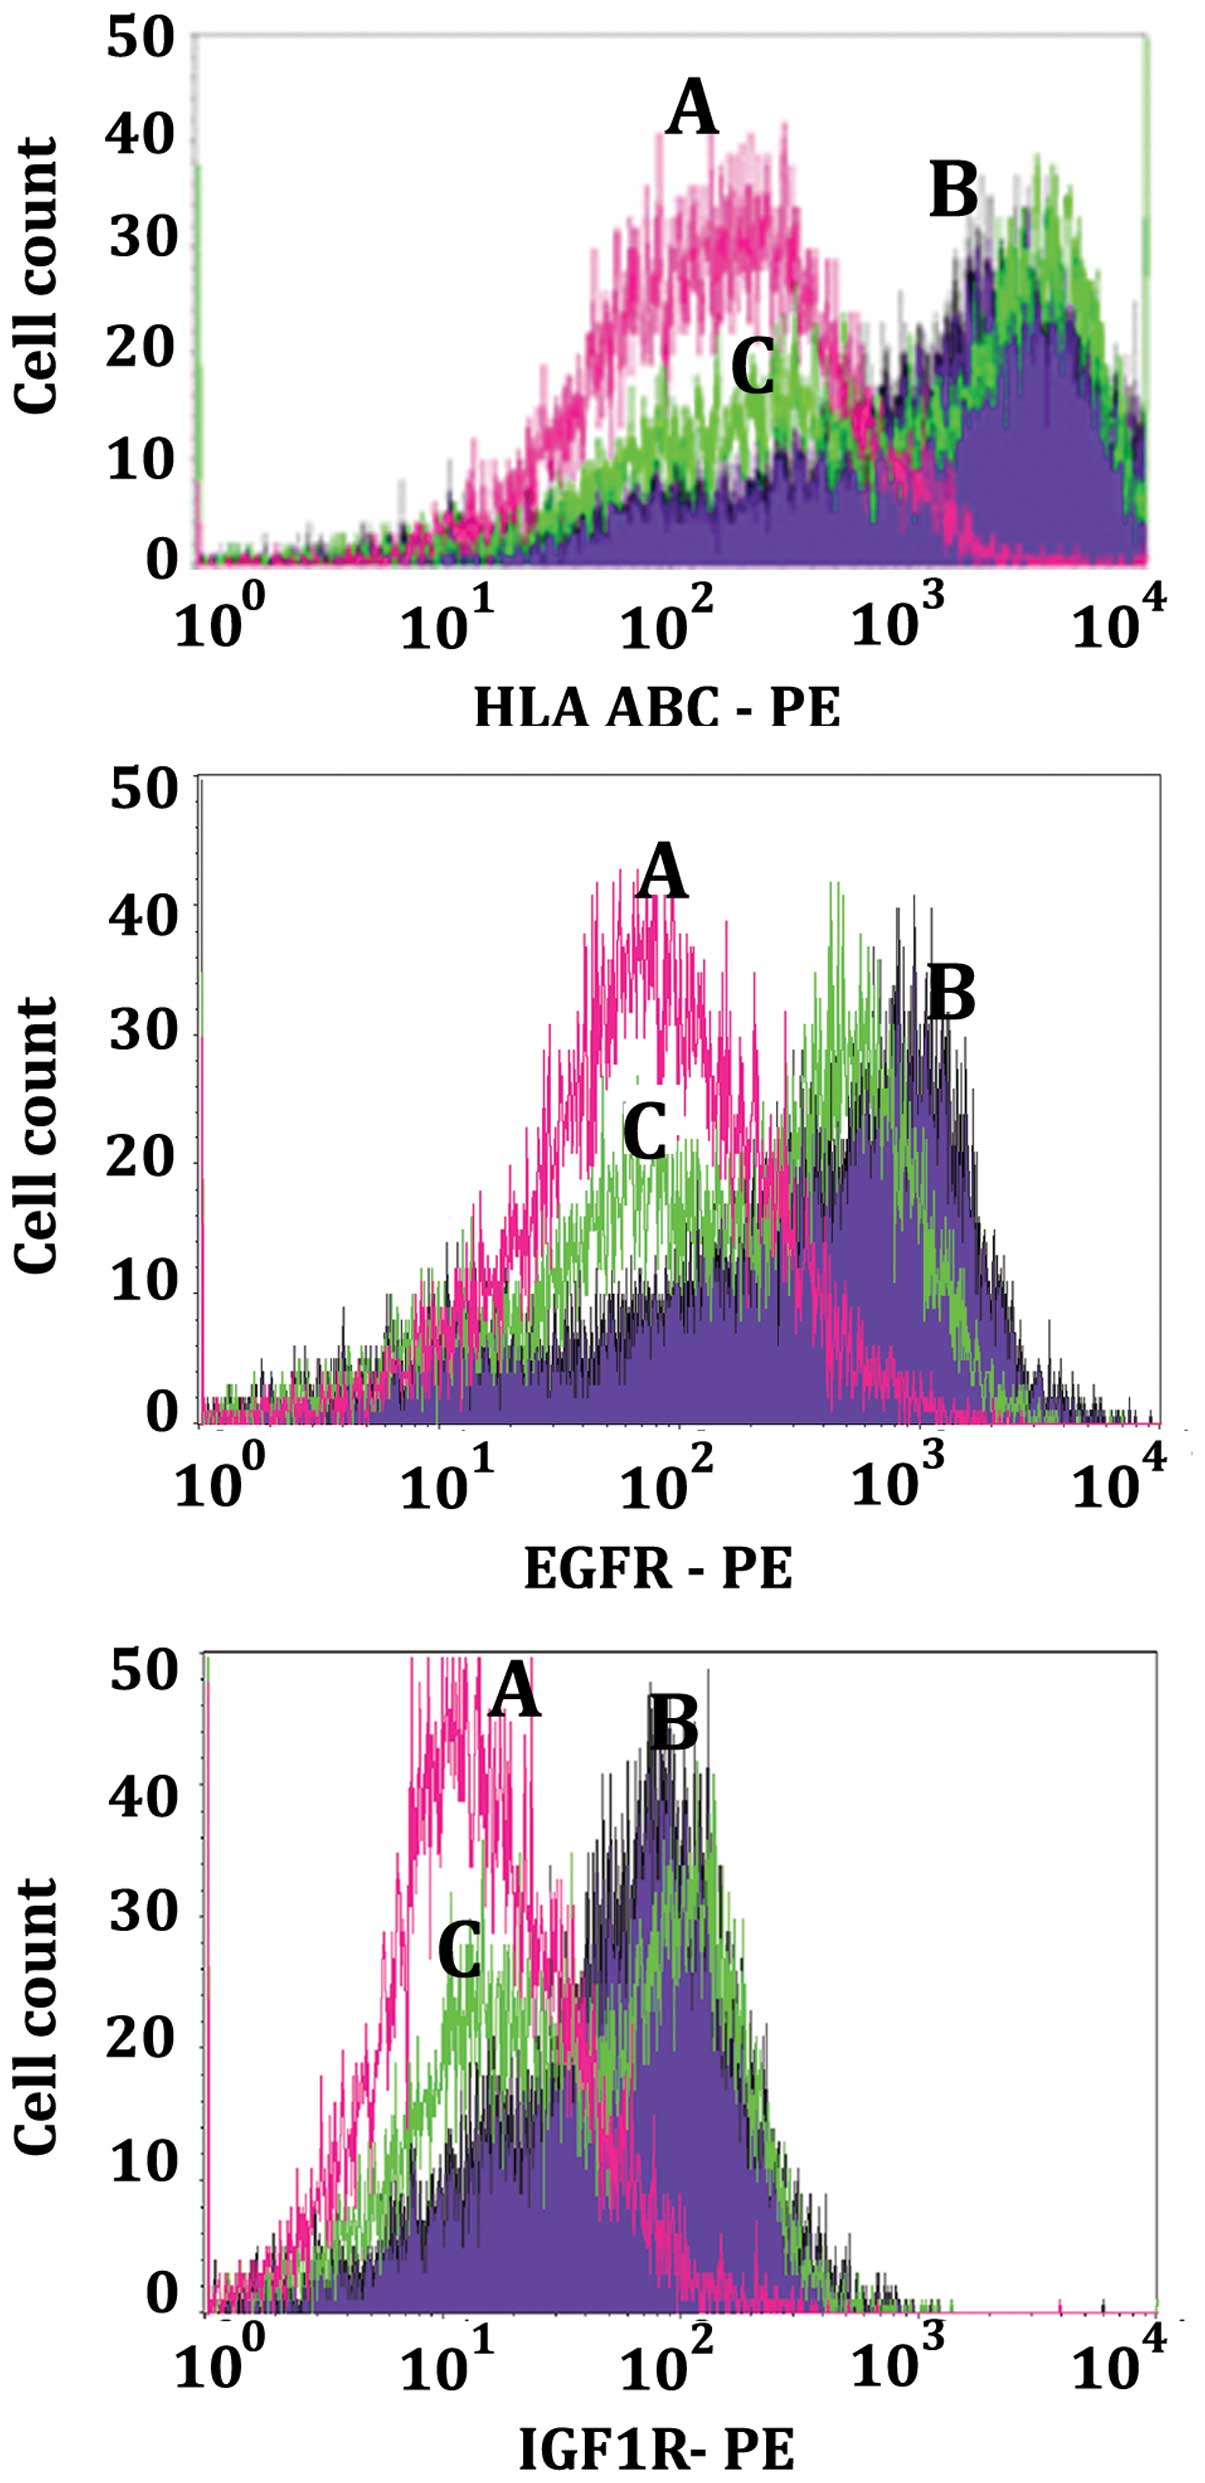
Reduction of HLA-ABC, EGFR, IGF1R, IGA3
and IGB4 cell surface cluster determinants during apoptosis
Figs. 7 and
8 are examples of the decrease in
density of cell surface determinants during apoptosis as measured
by flow cytometry. Monolayers of LN18 cells were either not treated
control cells (purple, curves B) or treated for 14 h with 50
μM MK886 (green, curves C). Following treatment, cells were
harvested and prepared to be analyzed by flow cytometry as
described in the Materials and methods. Non-reacting mouse
monoclonal anti-KLH was used as the primary antibody negative
control for curves A (pink). The histograms of Fig. 7 illustrate that as the LN18 cells
proceed through apoptosis there is a decrease in the cell surface
determinants of Class-1 histocompatibility markers HLA-ABC (top
panel of Fig. 7), epidermal growth
factor receptor (EGFR, middle panel of Fig. 7), and insulin growth factor 1
receptor (IGF1R, lower panel of Fig.
7). The bimodality of the apoptotic cell populations (green,
curves C) indicate that 14 h after the stimulation of the LN18
monolayer with MK886 the cells exist as a mixture of apoptotic and
non-apoptotic cells. This was verified by gating the apoptotic cell
population for those that were both Annexin V-488 and 7-AAD
positive as compared to those that were Annexin V-488 positive and
7-AAD negative thus comparing early and late apoptosis. For those
cells gated for early apoptosis the histogram had the appearance of
the higher intensity (right portion only) of curve C (data not
shown). On the other hand, the cells that were gated for late
apoptosis produced the single histogram of the lower intensity left
portion of curve C (data not shown). The fact that the apoptotic
stimulated cells produce a cell population of varying degrees of
apoptosis is relevant to the view that stimulated LN18 cells can
exist as a mixture of apoptotic and viable non-apoptotic cells.
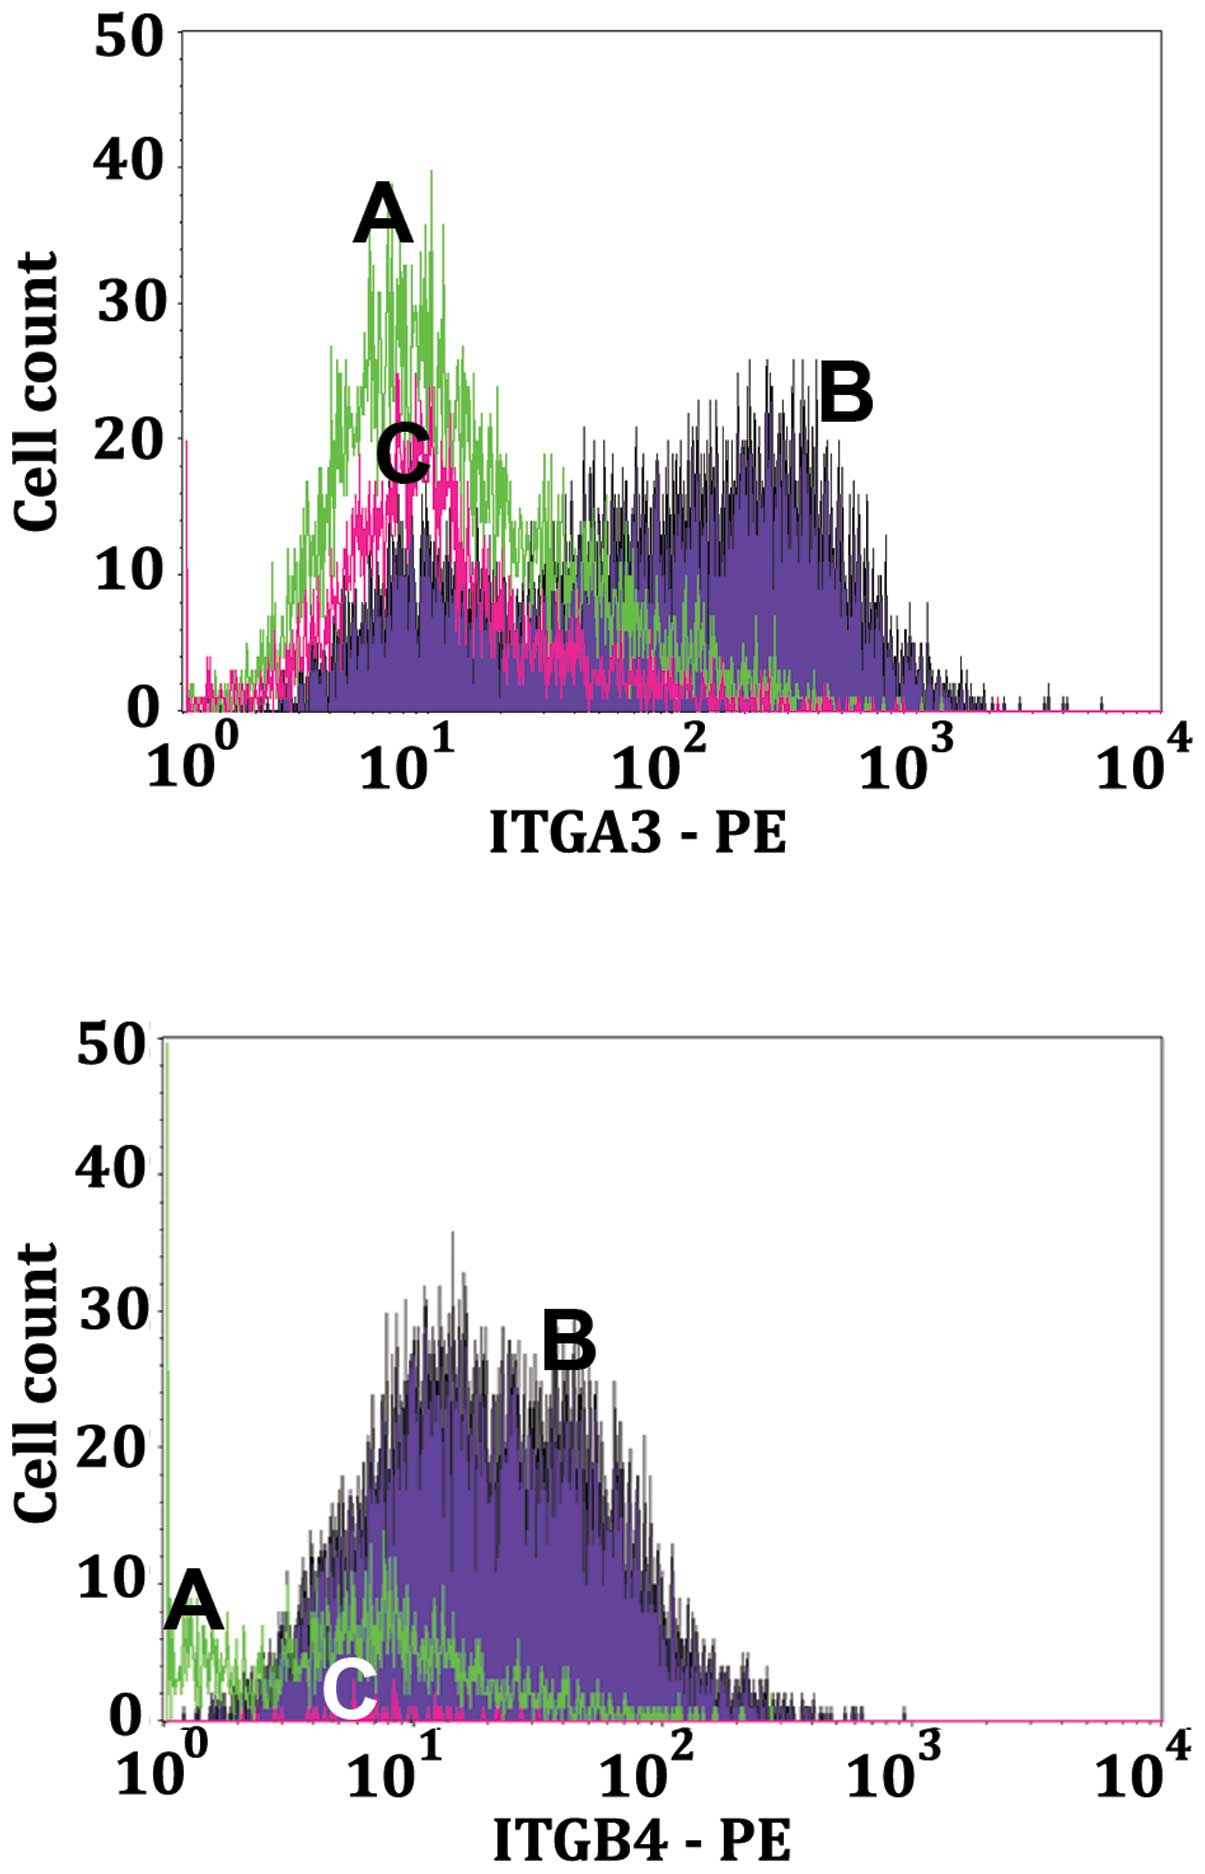
This was also borne out by the dot plots of Fig. 2. In a similar manner to Fig. 8, the histograms of Fig. 9 illustrate that as the LN18 cells
proceed through apoptosis there is a decrease in the LN18 cell
surface integrins α3 (IGA3, top panel of Fig. 9) and β4 (IGB4, middle panel of
Fig. 9).
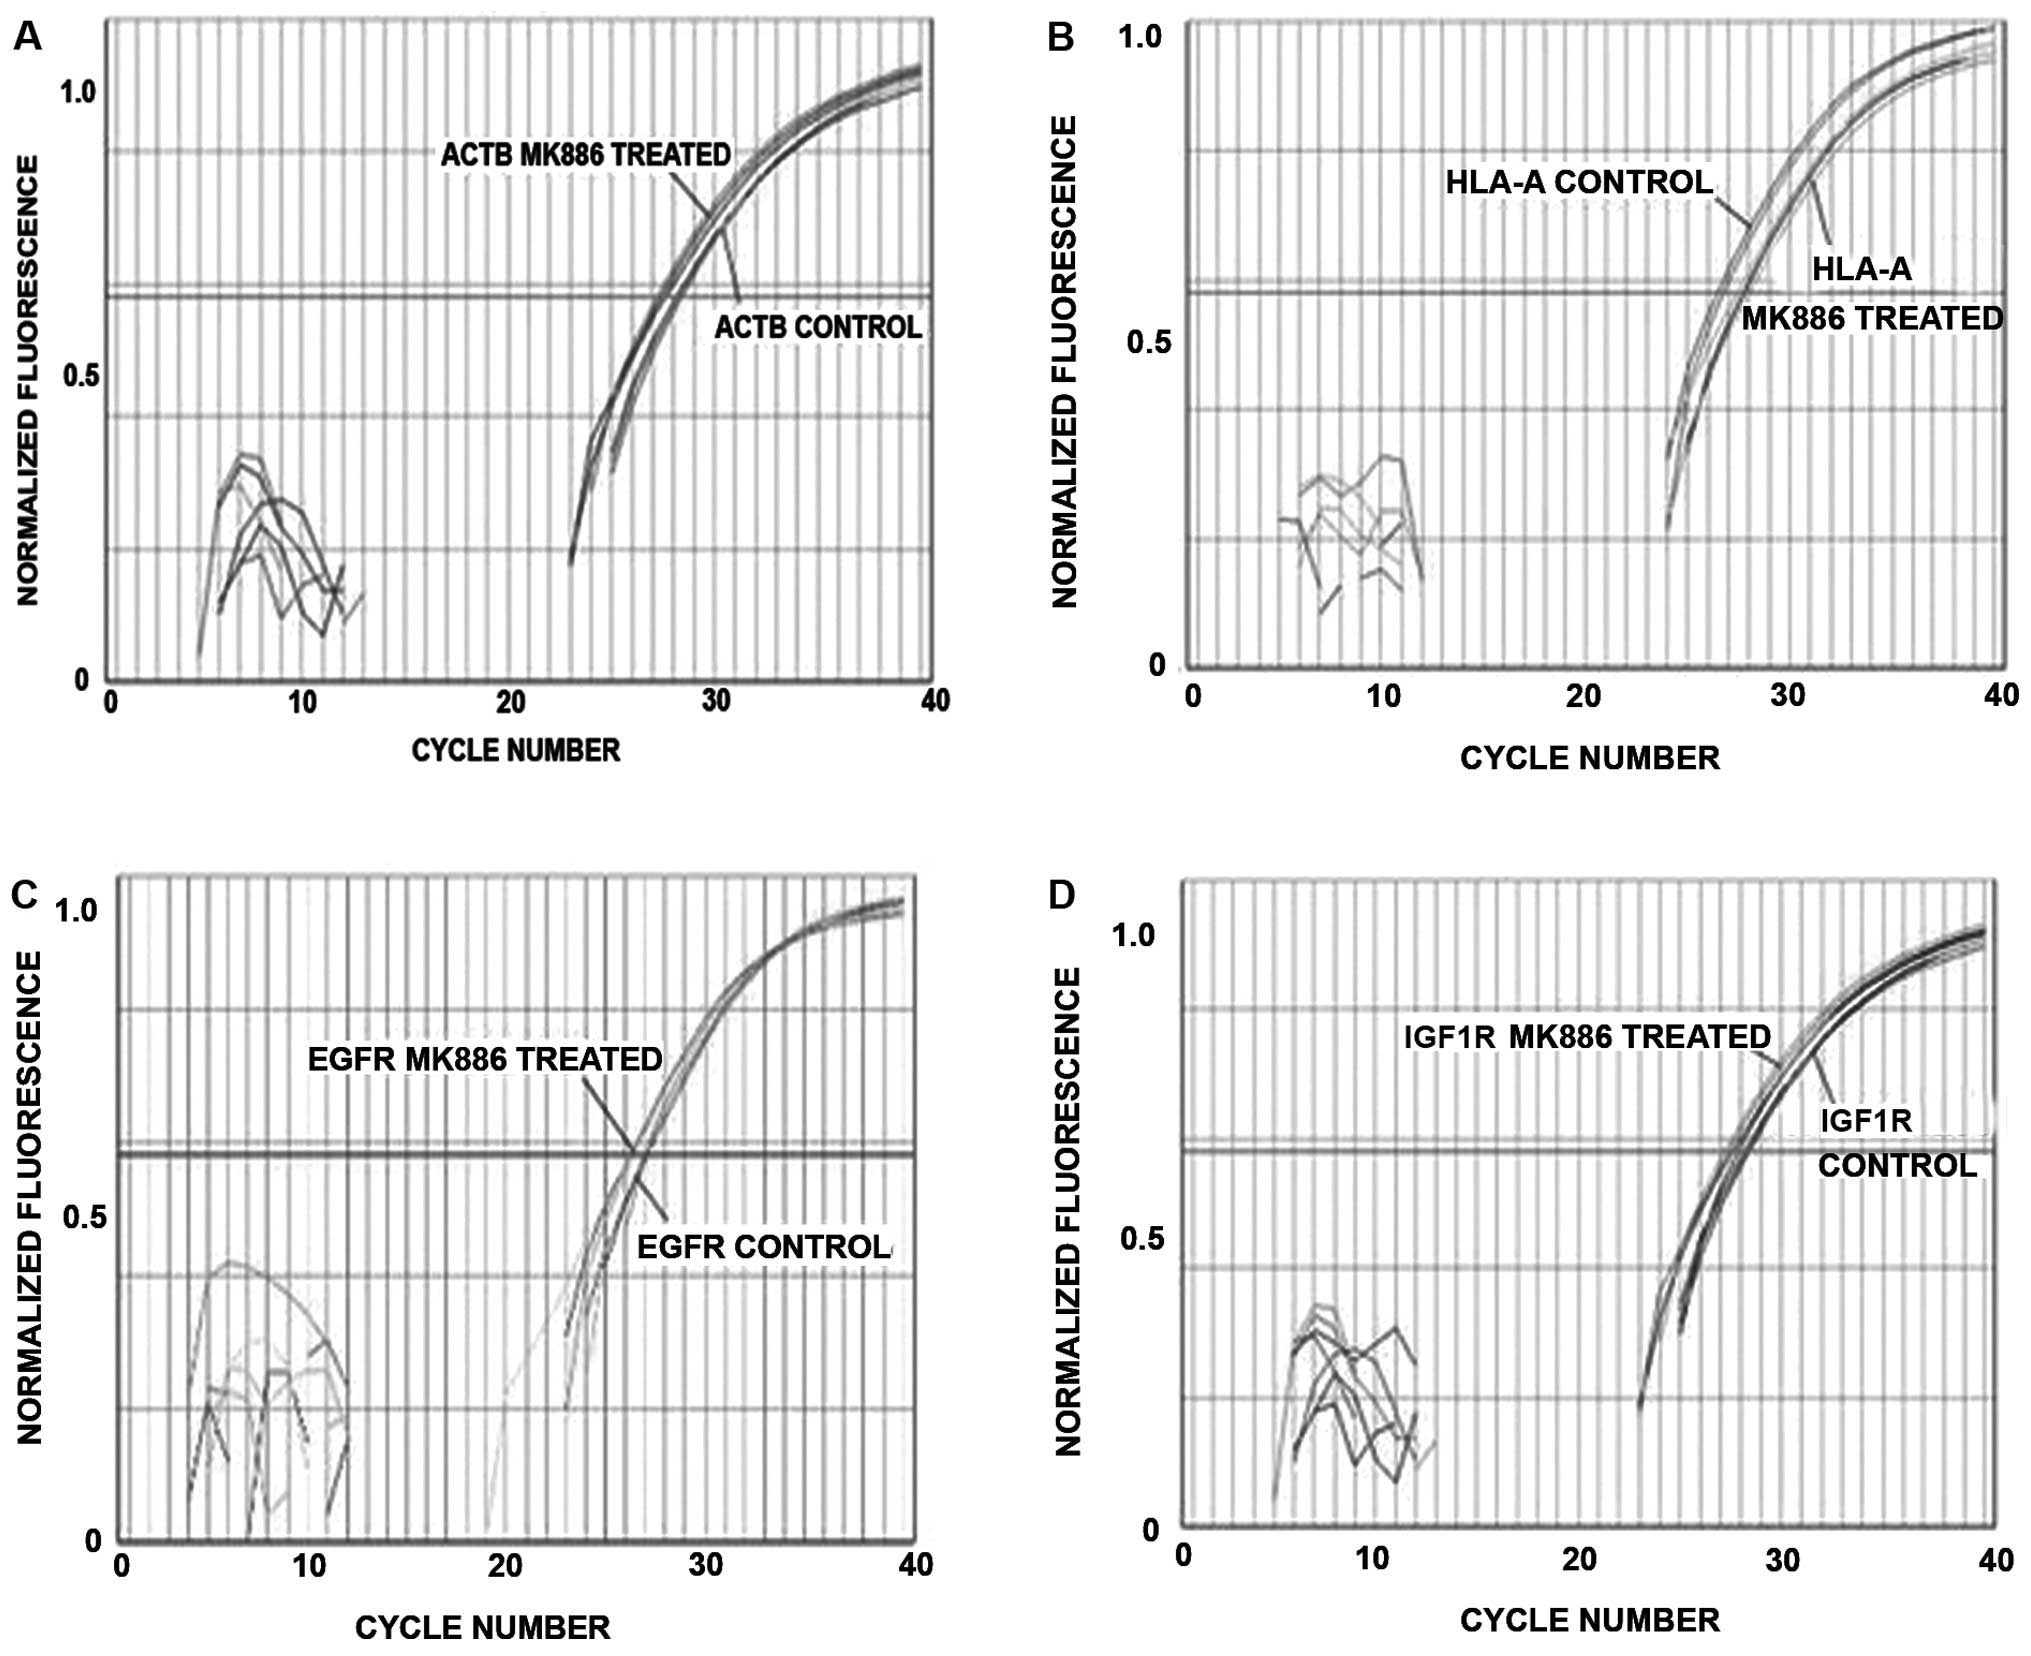
Transcriptions of mRNA for integrins,
HLA, EGFR, IGF1R, IGA3 and IGB4 are not decreased during apoptosis
as measured by RT-PCR
Real-time RT-PCR was used to determine if steady
state mRNAs for integrins, HLA, EGFR and IGF1R are expressed in
LN18 cells. Fig. 9 is a plot of
the normalized fluorescence vs. the sample well position for
cycling DMSO vehicle control cells and 50 μM MK886 treated
LN18 cells. Fig. 9A shows that
there is significant expression for the housekeeping gene β-actin
(ACTB), HLA (Fig. 9B), EGFR
(Fig. 9C) and IGF1R (Fig. 9D). The panels of Fig. 9 show that there is no decrease in
the steady state mRNA at 10 h, which is the beginning of the time
period when the proteins of HLA, EGFR and IGF1R are decreasing. The
RT-PCR results thus indicate that the downturn in these proteins is
due to enzymatic degradations and not reduced transcription.
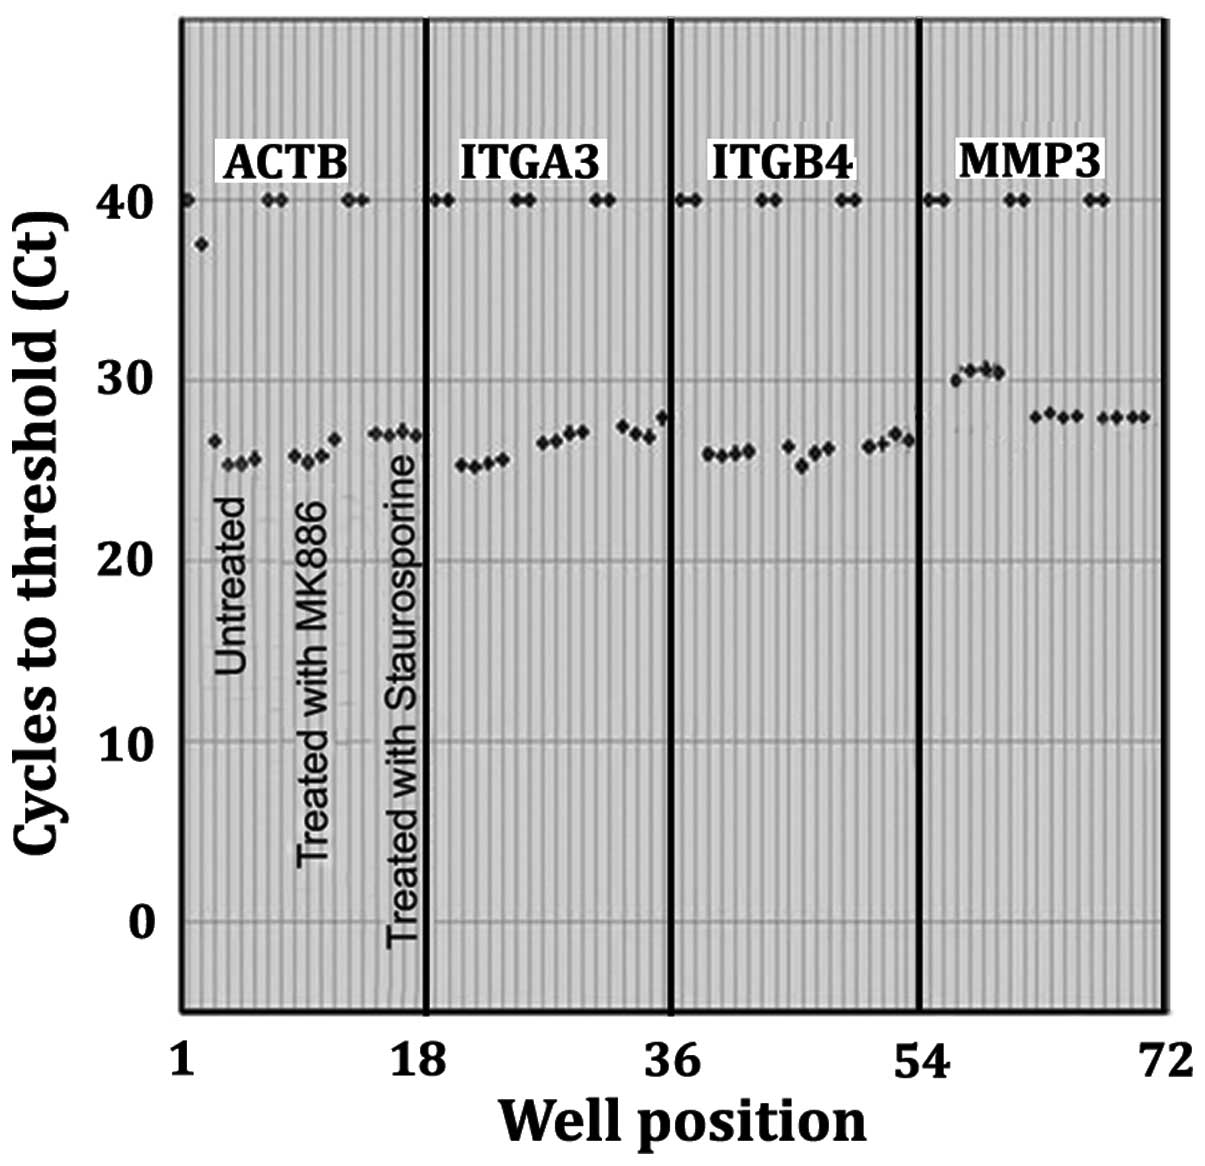
Measurement of mRNA expression by RT-PCR for β-actin (ACTB), α3
(IGA3), β4 (IGB4) and MMP-3 are shown in Fig. 10. PCR amplicons were generated
from RNA isolated from DMSO vehicle control LN18 cells, MK886
treated or staurosporine treated LN18 cells. Cycles to threshold
(Ct) were obtained from the fluorescence vs. cycle number curves
intersecting with a fixed threshold line where the threshold line
was set to intersect at the log phase of the curves (not shown).
There are 2 replicate blanks and 4 replicates for each sample. The
total number of cycles to completion of the PCR portion of the
experiment was 40. The duplicate blank controls, for which reverse
transcriptase was omitted, are presented as having Ct values of 40
because the samples did not reach threshold within 40 cycles. The
displayed Ct values for the 4 replicates of each sample indicate
the level of mRNA in the DMSO vehicle control LN18 cells as
compared to 50 μM MK886 or the 1 μM staurosporine
stimulated LN18 cells for 10 h. Sample Ct values being
significantly <40 indicate there was a steady state mRNA
expression. There were no significant differences in the steady
state mRNA expression for the MK886 or staurosporine stimulated
cells as compared to the DMSO vehicle control cells for the
housekeeping gene ATCB and the integrins IGA3 and IGB4.
Furthermore, the ΔCt for all of the samples were not significantly
different than the ΔCt for the ACTB control. This indicates that
the apoptotic reduction in the integrin determinants is due to
enzymatic degradation and not a reduction in transcription.
Conversely, there was a significant increase in the steady state
levels of mRNA at 10 h stimulation with MK886 or staurosporine as
compared to the unstimulated control for the metalloproteinase
MMP-3.
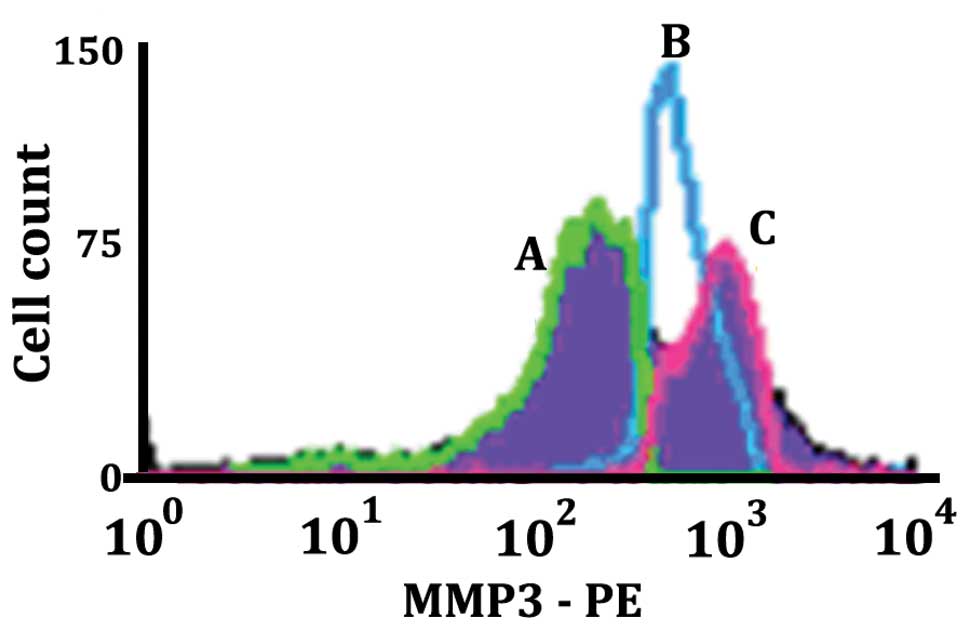
Density of surface MMP-3 for apoptotic
and non-apoptotic LN18 cells
MMP-3 is one of the secreted metalloproteinases that
can act as a sheddase in addition to effecting paracrine
degradation of surface determinants of neighboring cells and can
also have a role in degradation of the extracellular matrix. The
histogram in Fig. 11 shows the
level of MMP-3 expression on different populations of LN18 cells
resulting from being stimulated with 50 μM MK886 for 8 h.
The histogram labeled B (blue) is the Annexin V(−), 7AAD(−) normal
live population of LN18 cells. The histogram labeled C (pink)
illustrates a population of cells in early apoptosis [Annexin V(+),
7AAD(−)]. The histogram labeled A (green) shows the population of
cells that were in late apoptosis [Annexin V(+), 7AAD(+)]. It can
be seen that the density of MMP-3 increases in the apoptotic cell
population as compared to the non-apoptotic population, but
subsequently decreases in late apoptosis. The data are consistent
with what would be expected for a secreted metalloproteinase where
there is an initial increase on the cell surface followed by a
decrease on the cell surface as the secretion of the MMP-3
progresses.
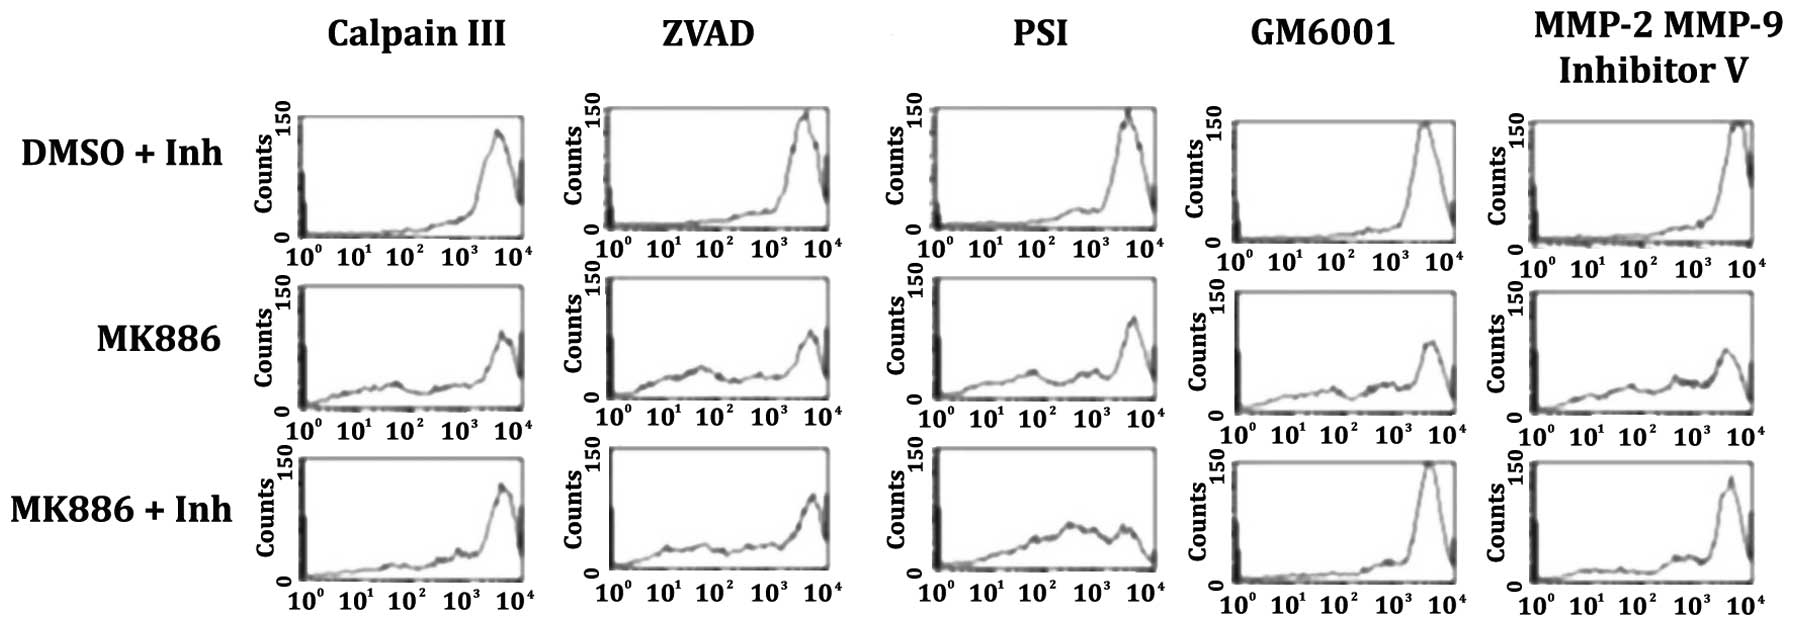
Effect of protease inhibitors upon
changes in the density of cell surface HLA-A determinants induced
by MK886 as measured by flow cytometry
The histograms of Fig.
12 provide examples of the effects of proteolytic inhibitors
upon the reduction of HLA-A cell surface determinants by MK886
induced apoptosis. The following inhibitors were used: Calpain III
(50 μM) inhibits calpain 1 and 2; ZVAD-FMK (50 μM) a
broad caspases inhibitor; PSI (50 μM) proteosome inhibitor
that also inhibits NF-κB and chymotrypsin; GM6001 (50 μM) a
broad matrix metalloproteinase inhibitor; and, MMP-2 MMP-9
Inhibitor V (50 μM) a broad matrix metalloproteinase
inhibitor with an IC50 that is lower for MMP-2 and
MMP-9. The histograms of the first row are the control group and
illustrate the effect of the proteolytic inhibitors upon surface
HLA-A determinants in the DMSO vehicle control cells that were
incubated for 16 h. The histograms of the second row illustrate the
effect upon surface HLA-A determinants in LN18 cells treated with
50 μM MK886 for 16 h in the absence of proteolytic
inhibitors. The histograms of the third row demonstrate the ability
of the proteolytic inhibitors to prevent the decreases in HLA-A
determinants that can be induced by MK886. For the histograms of
the third row, the protease inhibitors were added 7 h after the
MK886 and the reaction was allowed to proceed for an additional 9 h
for a total of 16 h. The histograms of the first row demonstrate
that the inhibitors in the absence of the MK886 have similar levels
of HLA-A expression. The 5 histograms of the second row show a
significant decrease in HLA-A surface determinants induced by 16 h
treatment with MK886. The histograms of the third row show that the
metalloproteinase inhibitor GM6001 (column 4) and the
metalloproteinase inhibitor MMP-2, MMP-9 Inhibitor V (column 5)
prevent the HLA-A reduction induced by MK886 providing evidence
that active metalloproteinases are required for the apoptotic
degradation of the cell surface determinants. The protease
inhibitor calpain III had little effect upon the apoptotic
degradation of the HLA-A determinants (column 1 of row 3). The
broad caspases inhibitor ZVAD-FMK added 7 h after the MK886 had no
discernible effect (column 2 of row 3) indicating that the caspase
cascade of the apoptotic process has taken place prior to the
apoptotic degradation of the cells’ surface determinants. The
proteosome inhibitor PSI (column 3 of row 3) exacerbated the HLA-A
degradation possibly due to an enhancement of the apoptotic process
induced by MK886.
Discussion
There have been many important foundational studies
defining the intrinsic intracellular mechanisms of apoptosis.
Additionally, there has been a great deal of interest in the
apoptotic effects of modulating receptor mediated transduction
mechanisms. Comparatively, there has been little emphasis on
determining the functionally opposite process of modulating the
cell’s surface receptors as the cells progress through apoptosis.
An objective of this investigation was to use the LN18 cell line as
a model to examine the apoptotic modulation of cell surface
integrins, EGFR, IGF1R and MHC-1. Our first interest was to
correlate the state of apoptosis with the degradation of these cell
surface determinants. In the context of the study’s objectives, it
was essential to establish the time course and characterize aspects
of MK886 and staurosporine induced apoptosis in the LN18 cells.
Although the pharmacological agents MK886 and staurosporine have
different modes of apoptotic initiation, both agents stimulate
apoptosis intrinsically and soon after initial stimulation continue
on a pathway of apoptosis that is mitochondrial mediated. Intrinsic
apoptosis does not require transmembrane receptor activation, but
rather is the result of intracellular signals that act directly on
targets within the cell and is typically mitochondrial mediated.
Pathways of mitochondrial mediated apoptosis have been extensively
studied and are becoming ever more well-known. Pro-apoptotic
proteins of the Bcl-2 family (40,41)
promote the increase in mitochondrial membrane permeability
(42) with a loss of mitochondrial
membrane potential (43) whereupon
the mitochondrial proteins cytochrome c (44) and Smac/DIABLO (45) are released into the cytosol which
activate the apoptotic promoting construct Apaf-1 (apoptotic
protease activating factor 1) (46) as well as procaspase-9 (47) and concurrently disrupts apoptotic
inhibition normally brought about by IAPs (inhibitors of apoptosis)
(48). An integral part of the
apoptotic cascade is the activation of effector caspases (49,50)
which control downstream processes that eventually result in the
release of nucleosomes into the cytosol and the cleavage of double
stranded DNA (51–53). The dot plots, Mito Tracker,
nucleosome release and TUNEL experimentation of this present report
are in agreement with the established pathways of caspases mediated
intrinsic apoptosis. Despite this, the broad caspases inhibitor
ZVAD-FMK, when added 7 h after the induction of apoptosis, had no
effect on the degradation of integrins, EGFR, IGF1R and MHC-1 which
takes place 7–15 h after the induction of apoptosis. This is an
indication that caspases are not the terminal proteases that
degrade the CDs and further implies that the caspase cascade
involving relevant proteases is actuated before the CDs are
proteolytically degraded.
Accompanying the enzymatic cascade are morphological
changes that are typical of pharmacologically induced apoptosis
which included rounding and shrinking of the cells resulting in a
separation of the cells from each other and from the extra-cellular
matrix. It is well established that the loss of integrin signaling
by detachment of cells from the extracellular matrix reduces
survival signals and can promote an anoikic form of apoptosis
(17,54). As aforementioned, the question
explored here is, when apoptosis is induced by mitochondrial
mediated intrinsic pathways does the apoptotic process itself
inherently degrade cell surface receptors that are likely to
disrupt transmembrane integrin and growth factor receptor
signaling? Certainly the separation of cells from each other and
separation of the cells from the extracellular matrix, which occurs
during apoptosis, is indicative of disrupting the heterodimeric
transmembrane integrin receptor signaling that normally occurs.
More specifically, the data presented here show that α-β components
of integrins are downgraded during apoptosis. Integrin mediated
signaling pathways initiated by the ligation of matrix proteins
induce clustering and the phosphorylation of pp125FAK (focal
adhesion kinase) which leads to its association with other kinases
and adapter molecules, particularly PI 3-kinase (Akt), which in
turn leads to activation of downstream survival pathways (55,56).
IGF1R and EGFR are among growth factor receptors in which
transduction mechanisms involve transmembrane receptor tyrosine
kinases which affect the recruitment and activation of
intracellular effector proteins that promote cell survival
(13,57,58).
As with the integrins, the flow cytometry data presented here
demonstrate that as the LN18 cells progress through apoptosis there
are reductions in the antigenic determinants of the growth factor
receptors IGF1R and EGFR. Thus, the simultaneous degradation of
integrins, IGF1R and EGFR would concurrently disrupt the critical
role that they have in the kinase cascades of adhesion and growth
factor regulated survival signaling. The apoptotic disruption of
growth factors and integrins simultaneously is relevant to
circumventing apoptotic resistance particularly in the context of
the interrelationships and cross-talk that exist between growth
factor/growth factor and integrin/growth factor intracellular
signaling systems (14,15,59).
It was determined by Real-time RT-PCR that the
steady-state transcription of integrins and growth factor receptors
did not decrease significantly during the time span when the
reduction in the integrins, EGFR, IGF1R and MHC-1 occurred. GM6001
and MMP Inhibitor V effectively prevented the apoptotic down
regulation of class 1 histocompatibility antigens (HLA-A) even when
added 7 h after the induction of apoptosis. Consequently, it is
likely that integrins, EGFR, IGF1R and MHC-1 are not being reduced
by a decrease in transcription but rather by proteases with the
implication that metalloproteinases are part of the effector
proteases. It has been known for some time that metalloproteinases
play an important role in the degradation of the extracellular
matrix and cell surface proteins (60,61).
In humans, there are 23 known members of the matrixin
metalloproteinases most of which are capable of acting as sheddases
and include: matrix metalloproteinases (MMPs) (62,63),
membrane type matrix metalloproteinases (MT-MMPs) (64,65),
a disintegrin and metalloproteinases (ADAMs) (66) and a disintegrin and
metalloproteinases with thrombospondin type 1 motif (ADAMTs)
(67). This study has not
determined which of the metalloproteinases are effector proteases,
nor was it determined how the apoptotic process converts the
zymogen forms of metalloproteinases to their active form.
Nevertheless, there is ample evidence in the literature that latent
precursor forms of metalloproteinases can be processed into
biologically active forms by furin and PC5 and possibly other
members of the family of proprotein convertases (68–70).
Furin convertase can proteolytically process a variety of precursor
forms of molecules including transforming growth factor β1 (TGFβ1)
(71,72). TGFβ1 is immunosuppressive (73,74)
and can be protective in various pathologies including autoimmune
diseases (75). However, one of
the unsettling conditions of glioblastoma patients is the high
frequency of immunosuppression (76,77)
with mounting evidence that the immunosuppression involves furin
processing of TGFβ (78,79). As far as we know, none of the
studies have examined the interrelationship of furin and the
activation of metalloproteinases and TGFβ in glioblastoma cells
during the process of apoptosis. In light of these implications and
the data presented here showing enhanced metalloproteinase activity
during apoptosis, a study of furin activation of metalloproteinases
and TGFβ in apoptotic glioblastoma cells may be a pursuit worthy of
undertaking.
In this study, MHC-1 antigenic levels are reduced
when the cells proceed through the apoptotic process. At first
thought it may be puzzling to deduce any positive effect of having
a reduction of MHC determinants in the commitment to apoptosis or
to the elimination of apoptotic cells. Natural killer cells (NK
cells) pass the blood-brain barrier and infiltrate the brain
whereupon they are modified by resident immune cells and target
virally infected cells and tumor cells rendering the role of
infiltrating NK cells critical as part of the brain’s innate immune
system (80). Actually, NK cells
demonstrate enhanced cytotoxic activity towards those cells missing
or possessing low MHC-1 self-markers (81,82)
which should make them effective eliminators of those glioblastoma
cells that have low levels of MHC markers. Consequently, the data
showing activation of metalloproteinases and the degradation of
cell surface proteins during apoptosis of glioblastoma cells has
the implications of affecting innate immunity, the extra cellular
matrix and the metalloproteinase dependent invasiveness of
glioblastoma tumors.
There is renewed interest in treating glioblastomas
by enhancing innate and adaptive immunity (83) while including the chemotherapeutic
targeting of growth factor receptor (84) and integrin function (85). The optimal standard in the clinical
treatment of brain tumors is to kill the tumor cells effectively
and completely, without inflammation, while keeping normal brain
cells intact. The data presented here are compatible with the
opinion that apoptosis normally proceeds in a manner that inhibits
integrin and growth factor survival signals while stimulating the
brain’s natural immune system. Unfortunately, malignant cells
possess mechanisms to escape apoptosis while sustaining growth
factor survival signals even in the absence of receptor stimulation
along with suppressing the active immune system. Notwithstanding
this, the data presented here have enabled us to formulate a
perspective for further study that includes the idea that the final
stages of the pharmacological induction of apoptosis, to proceed to
a full commitment to non-necrotic cell death, involves the
degradation of integrin, insulin and epidermal growth factor
receptors caused by a programmed dysregulation of the cell’s
metalloproteinases.
Acknowledgements
This study was supported by NIH grants
P20RR016477-12 and P20GM103434-12 awarded to the West Virginia IDeA
Network for Biomedical Research Excellence. Flow cytometry
experiments were performed in the West Virginia University Flow
Cytometry Core Facility, which is supported in part by the National
Institute of Health equipment grant number RR020866 and the
Institutional Development Award (IDeA) from the National Institute
of General Medical Sciences of the National Institutes of Health
under grant numbers P30GM103488 (CoBRE) and P20GM103434
(INBRE).
References
|
1.
|
Lockshin RA and Williams CM: Programmed
cell death-II. Endocrine potentiation of the breakdown of the
intersegmental muscles of silkmoths. J Insect Physiol. 10:643–649.
1964. View Article : Google Scholar
|
|
2.
|
Sulston J and Brenner S: The DNA of
Caenorhabditis elegans. Genetics. 77:95–104. 1974.
|
|
3.
|
Sulston JE and Horvitz HR: Post-embryonic
cell lineages of the nematode, Caenorhabditis elegans. Dev
Biol. 56:110–156. 1977. View Article : Google Scholar : PubMed/NCBI
|
|
4.
|
Jacobson MD, Weil M and Raff MC:
Programmed cell death in animal development. Cell. 88:347–354.
1997. View Article : Google Scholar : PubMed/NCBI
|
|
5.
|
Horvitz HR: Genetic control of programmed
cell death in the nematode Caenorhabditis elegans. Cancer
Res. 59(Suppl 7): 1701–1706. 1999.PubMed/NCBI
|
|
6.
|
Li Y, Fengyi W, Sudeshna D, et al:
Autophagic programmed cell death by selective catalase degradation.
Proc Natl Acad Sci USA. 103:4952–4957. 2006. View Article : Google Scholar : PubMed/NCBI
|
|
7.
|
Elmore S: Apoptosis: a review of
programmed cell death. Toxicol Pathol. 35:495–516. 2007. View Article : Google Scholar : PubMed/NCBI
|
|
8.
|
Taddei ML, Giannoni E, Fiaschi T and
Chiarugi P: Anoikis: an emerging hallmark in health and diseases. J
Pathol. 226:380–393. 2012. View Article : Google Scholar : PubMed/NCBI
|
|
9.
|
Hirsch T, Marchetti P, Susin SA, et al:
The apoptosis-necrosis paradox. Apoptogenic proteases activated
after mitochondrial permeability transition determine the mode of
cell death. Oncogene. 15:1573–1581. 1997. View Article : Google Scholar
|
|
10.
|
Proskuryakov SY, Konoplyannikov A and
Gabai VL: Necrosis: a specific form of programmed cell death. Exp
Cell Res. 283:1–16. 2003. View Article : Google Scholar : PubMed/NCBI
|
|
11.
|
Gilmore AP, Metcalfe AD, Romer LH and
Streuli CH: Integrin-mediated survival signals regulate the
apoptotic function of bax through its conformation and subcellular
localization. J Cell Biol. 149:431–445. 2000. View Article : Google Scholar : PubMed/NCBI
|
|
12.
|
LeRoith D, Werner H, Beitner-Johnson D and
Roberts CT Jr: Molecular and cellular aspects of the insulin-like
growth factor I receptor. Endocr Rev. 16:143–163. 1995. View Article : Google Scholar
|
|
13.
|
Jorissen RN, Walker F, Pouliot N, Garrett
TPJ, Ward CW and Burgessa AW: Epidermal growth factor receptor:
mechanisms of activation and signaling. Exp Cell Res. 284:31–53.
2003. View Article : Google Scholar : PubMed/NCBI
|
|
14.
|
Adams TE, McKern NM and Ward CW:
Signalling by the type 1 insulin-like growth factor receptor:
interplay with the epidermal growth factor receptor. Growth
Factors. 22:89–95. 2004. View Article : Google Scholar : PubMed/NCBI
|
|
15.
|
van der Veeken J, Oliveira S, Schiffelers
RM, Storm G, van Bergen En Henegouwen PM and Roovers RC: Crosstalk
between epidermal growth factor receptor- and insulin-like growth
factor-1 receptor signaling: implications for cancer therapy. Curr
Cancer Drug Targets. 9:748–760. 2009.PubMed/NCBI
|
|
16.
|
Kerr JF, Wyllie AH and Currie AR:
Apoptosis: a basic biological phenomenon with wide-ranging
implications in tissue kinetics. Br J Cancer. 26:239–257. 1972.
View Article : Google Scholar
|
|
17.
|
Frisch SM and Francis H: Disruption of
epithelial cell-matrix interactions induces apoptosis. J Cell Biol.
124:619–626. 1994. View Article : Google Scholar : PubMed/NCBI
|
|
18.
|
Ruoslahti E and Pierschbacher MD: New
perspectives in cell adhesion: RGD and integrins. Science.
238:491–497. 1987. View Article : Google Scholar : PubMed/NCBI
|
|
19.
|
Ruoslahti E: Integrins. J Clin Invest.
87:1–5. 1991. View Article : Google Scholar
|
|
20.
|
Ruoslahti E and Reed JC: Anchorange
independence, integrins, and apoptosis. Cell. 77:477–478. 1994.
View Article : Google Scholar : PubMed/NCBI
|
|
21.
|
Frisch SM and Ruoslahti E: Integrins and
anoikis. Curr Opin Cell Biol. 9:701–706. 1997. View Article : Google Scholar : PubMed/NCBI
|
|
22.
|
Reed JC: Apoptosis-targeted therapies for
cancer. Cancer Cell. 3:17–22. 2003. View Article : Google Scholar
|
|
23.
|
Zhong X and Rescorla FJ: Cell surface
adhesion molecules and adhesion-initiated signaling: understanding
of anoikis resistance mechanisms and therapeutic opportunities.
Cell Signal. 24:393–401. 2012. View Article : Google Scholar : PubMed/NCBI
|
|
24.
|
Baguley BC: Multiple drug resistance
mechanisms in cancer. Mol Biotechnol. 46:308–316. 2010. View Article : Google Scholar : PubMed/NCBI
|
|
25.
|
Zahreddine H and Borden KL: Mechanisms and
insights into drug resistance in cancer. Front Pharmacol. 4:282013.
View Article : Google Scholar
|
|
26.
|
Beier D, Schulz JP and Beier CP:
Chemoresistance of glioblastoma cancer stem cells-much more complex
than expected. Mol Cancer. 10:1282011. View Article : Google Scholar : PubMed/NCBI
|
|
27.
|
Zeiss CJ: The apoptosis-necrosis
continuum: insights from genetically altered mice. Vet Pathol.
40:481–495. 2003. View Article : Google Scholar : PubMed/NCBI
|
|
28.
|
Hacker G: The morphology of apoptosis.
Cell Tissue Res. 301:5–17. 2000. View Article : Google Scholar
|
|
29.
|
Diserens AC, de Tribolet N, Martin-Achard
A, et al: Characterization of an established human malignant glioma
cell line: LN-18. Acta Neuorpathol. 53:21–28. 1981. View Article : Google Scholar : PubMed/NCBI
|
|
30.
|
Anderson KM, Seed T, Jajeh A, et al: An in
vivo inhibitor of 5-lipoxygenase, MK886, at micormolar
concentration induces apoptosis in U937 and CML cells. Anticancer
Res. 16:2589–2599. 1966.PubMed/NCBI
|
|
31.
|
Ghosh J and Myers CE: Inhibition of
arachidonate 5-lipoxygenase triggers massive apoptosis in human
prostate cancer cells. Proc Natl Acad Sci USA. 95:13182–13187.
1998. View Article : Google Scholar
|
|
32.
|
Ghosh J and Myers CE: Arachidonic acid
stimulates prostate cancer cell growth: critical role of
5-lipoxygenase. Biochem Biophys Res Commun. 235:418–423. 1997.
View Article : Google Scholar : PubMed/NCBI
|
|
33.
|
Tong WG, Ding XZ and Adrian TE: The
mechanisms of lipoxygenase inhibitor-induced apoptosis in human
breast cancer cells. Biochem Biophys Res Commun. 296:942–948. 2002.
View Article : Google Scholar : PubMed/NCBI
|
|
34.
|
Dixon RAF, Diehl RE, Opas E, et al:
Requirement of a 5-lipoxygenase-activating protein for leukotriene
synthesis. Nature. 343:282–284. 1990. View Article : Google Scholar : PubMed/NCBI
|
|
35.
|
Miller DK, Gillard JW, Vickers PJ, et al:
Identification and isolation of a membrane protein necessary for
leukotriene production. Nature. 343:278–281. 1990. View Article : Google Scholar : PubMed/NCBI
|
|
36.
|
Ford-Hutchinson AW: FLAP: a novel drug
target for inhibiting the synthesis of leukotrienes. Trends
Pharmacol Sci. 12:68–70. 1991. View Article : Google Scholar : PubMed/NCBI
|
|
37.
|
Vegesna RV, Wu HL, Mong S and Crooke ST:
Staurosporine inhibits protein kinase C and prevents phorbol
ester-mediated leukotriene D4 receptor desensitization in RBL-1
cells. Mol Pharmacol. 33:537–542. 1998.
|
|
38.
|
Belmokhtar CA, Hillion J and
Ségal-Bendirdjian E: Staurosporine induces apoptosis through both
caspase-dependent and caspase-independent mechanisms. Oncogene.
20:3354–3362. 2001. View Article : Google Scholar : PubMed/NCBI
|
|
39.
|
Kabir J, Lobo M and Zachary I:
Staurosporine induces endothelial cell apoptosis via focal adhesion
kinase dephosphorylation and focal adhesion disassembly independent
of focal adhesion kinase proteolysis. Biochem J. 367:145–155. 2002.
View Article : Google Scholar
|
|
40.
|
Yang E, Zha J, Jockel J, Boise LH,
Thompson CB and Korsmeyer SJ: Bad, a heterodimeric partner for
Bcl-XL and Bcl-2, displaces Bax and promotes cell death. Cell.
80:285–291. 1995. View Article : Google Scholar : PubMed/NCBI
|
|
41.
|
Hetz C, Vitte PA, Bombrun A, et al: Bax
channel inhibitors prevent mitochondrion-mediated apoptosis and
protect neurons in a model of global brain ischemia. J Biol Chem.
280:42960–42970. 2005. View Article : Google Scholar : PubMed/NCBI
|
|
42.
|
Narita M, Shimizu S, Ito T, et al: Bax
interacts with the permeability transition pore to induce
permeability transition and cytochrome c release in isolated
mitochondria. Proc Natl Acad Sci USA. 95:14681–14686. 1998.
View Article : Google Scholar : PubMed/NCBI
|
|
43.
|
Zamzami N, Marchetti P, Castedo M, et al:
Sequential reduction of mitochondrial transmembrane potential and
generation of reactive oxygen species in early programmed cell
death. J Exp Med. 182:367–377. 1995. View Article : Google Scholar : PubMed/NCBI
|
|
44.
|
Kluck RM, Bossy-Wetzel E, Green DR and
Newmeyer DD: The release of cytochrome c from mitochondria: a
primary site for Bcl-2 regulation of apoptosis. Science.
275:1132–1136. 1997. View Article : Google Scholar : PubMed/NCBI
|
|
45.
|
Adrain C, Creagh EM and Martin SJ:
Apoptosis-associated release of Smac/DIABLO from mitochondria
requires active caspases and is blocked by Bcl-2. EMBO J.
20:6627–6636. 1997. View Article : Google Scholar : PubMed/NCBI
|
|
46.
|
Hill MM, Adrain C, Duriez PJ, Creagh EM
and Martin SJ: Analysis of the composition, assembly kinetics and
activity of native Apaf-1 apoptosomes. EMBO J. 23:2134–2145. 2004.
View Article : Google Scholar : PubMed/NCBI
|
|
47.
|
Zou H, Li Y, Liu X and Wang X: An APAF-1
cytochrome c multimeric complex is a function apoptosome that
activates procaspase-9. J Biol Chem. 274:11549–11556. 1999.
View Article : Google Scholar : PubMed/NCBI
|
|
48.
|
Du C, Fang M, Li Y, Li L and Wang X: Smac,
a mitochondrial protein that promotes cytochrome c-dependent
caspase activation by eliminating IAP inhibition. Cell. 102:33–42.
2000. View Article : Google Scholar : PubMed/NCBI
|
|
49.
|
Li P, Nijhawan D, Budihardjo I, et al:
Cytochrome c and dATP-dependent formation of Apaf-1/caspase-9
complex initiates an apoptotic protease cascade. Cell. 91:479–489.
1997. View Article : Google Scholar : PubMed/NCBI
|
|
50.
|
McIlwain DR, Berger T and Mak TW: Caspase
functions in cell death and disease. Cold Spring Harb Perspect
Biol. 5:a0086562013. View Article : Google Scholar
|
|
51.
|
Martin SJ and Green DR: Protease
activation during apoptosis: death by a thousand cuts? Cell.
82:349–352. 1995. View Article : Google Scholar : PubMed/NCBI
|
|
52.
|
Earnshaw WC, Martins LM and Kaufmann SH:
Mammalian caspases: structure, activation, substrates, and
functions during apoptosis. Annu Rev. 68:383–424. 1999.PubMed/NCBI
|
|
53.
|
Zhang JH and Xu M: DNA fragmentation in
apoptosis. Cell Res. 10:205–211. 2000. View Article : Google Scholar
|
|
54.
|
Okayama H: Cell cycle control by anchorage
signaling. Cell Signal. 24:1599–1609. 2012. View Article : Google Scholar : PubMed/NCBI
|
|
55.
|
Aplin AE, Howe A, Alahari SK and Juliano
RL: Signal transduction and signal modulation by cell adhesion
receptors: the role of integrins, cadherins, immunoglobulin-cell
adhesion molecules, and selectins. Pharmacol Rev. 50:197–263.
1998.PubMed/NCBI
|
|
56.
|
Schwartz MA and Baron V: Interactions
between mitogenic stimuli, or, a thousand and one connections. Curr
Opin Cell Biol. 11:197–202. 1999. View Article : Google Scholar : PubMed/NCBI
|
|
57.
|
McCubrey JA, Steelman LS, Abrams SL, et
al: Roles of the RAF/ MEK/ERK and P13K/PTEN/AKT pathways in
malignant transformation and drug resistance. Adv Enzyme Regul.
46:249–279. 2006. View Article : Google Scholar : PubMed/NCBI
|
|
58.
|
Chitnis MM, Yuen JS, Protheroe AS, Pollak
M and Macaulay VM: The type 1 insulin-like growth factor receptor
pathway. Clin Cancer Res. 14:6364–6370. 2008. View Article : Google Scholar : PubMed/NCBI
|
|
59.
|
Ivaska J and Heino J: Cooperation between
integrins and growth factor receptors in signaling and endocytosis.
Ann Rev Cell Dev Biol. 27:291–320. 2011. View Article : Google Scholar : PubMed/NCBI
|
|
60.
|
Werb Z: ECM and cell surface proteolysis:
regulating cellular ecology. Cell. 91:439–442. 1997. View Article : Google Scholar : PubMed/NCBI
|
|
61.
|
Mott JD and Werb Z: Regulation of matrix
biology by matrix metalloproteinases. Curr Opin Cell Biol.
16:558–564. 2004. View Article : Google Scholar : PubMed/NCBI
|
|
62.
|
Massova I, Kotra LP, Fridman R and
Mobashery S: Matrix metalloproteinases: structures, evolution, and
diversification. FASEB J. 12:1075–1095. 1998.PubMed/NCBI
|
|
63.
|
Nagase H and Woessner JF Jr: Matrix
metalloproteinases. J Biol Chem. 274:21491–21494. 1999. View Article : Google Scholar
|
|
64.
|
Seiki M: Membrane-type 1 matrix
metalloproteinase: a key enzyme for tumor invasion. Cancer Lett.
194:1–11. 2003. View Article : Google Scholar : PubMed/NCBI
|
|
65.
|
Sohail A, Sun Q, Zhao H, Bernardo MM, Cho
JA and Fridman R: MT4-(MMP17) and MT6-MMP (MMP25), a unique set of
membrane-anchored matrix metalloproteinases: properties and
expression in cancer. Cancer Metastasis Rev. 27:289–302. 2008.
View Article : Google Scholar : PubMed/NCBI
|
|
66.
|
Edwards DR, Handsley MM and Pennington CJ:
The ADAM metalloproteinases. Mol Aspects Med. 5:258–289. 2008.
View Article : Google Scholar
|
|
67.
|
Tang BL: ADAMTS: a novel family of
extracellular matrix proteases. Int J Biochem Cell Biol. 33:33–44.
2001. View Article : Google Scholar : PubMed/NCBI
|
|
68.
|
Kang T, Nagase H and Pei D: Activation of
membrane-type matrix metalloproteinase 3 zymogen by the proprotein
convertase furin in the trans-Golgi network. Cancer Res.
62:675–681. 2002.PubMed/NCBI
|
|
69.
|
Kang T, Zhao YG, Pei D, Sucic JF and Sang
QX: Intracellular activation of human adamalysin 19/disintegrin and
metalloproteinase 19 by furin occurs via one of the two consecutive
recognition sites. J Biol Chem. 277:25583–25591. 2002. View Article : Google Scholar
|
|
70.
|
Stawowy P, Meyborg H, Stibenz D, et al:
Furin-like proprotein convertases are central regulators of the
membrane type matrix metalloproteinase-pro-matrix
metalloproteinase-2 proteolytic cascade in atherosclerosis. Circ.
111:2820–2827. 2005. View Article : Google Scholar
|
|
71.
|
Dubois CM, Laprise M-H, Blanchette F,
Gentry LE and Leduc R: Processing of transforming growth factor β1
precursor by human furin convertase. J Biol Chem. 270:10618–10624.
1995.
|
|
72.
|
Dubois CM, Blanchette F, Laprise MH, Leduc
R, Grondin F and Seidah NG: Evidence that furin is an authentic
transforming growth factor-beta1-converting enzyme. Am J Pathol.
158:305–316. 2001. View Article : Google Scholar : PubMed/NCBI
|
|
73.
|
Letterio JJ and Roberts AB: Regulation of
immune responses by TGF-beta. Annu Rev Immunol. 16:137–161. 1998.
View Article : Google Scholar : PubMed/NCBI
|
|
74.
|
Mantel PY and Schmidt-Weber CB:
Transforming growth factor-beta: recent advances on its role in
immune tolerance. Methods Mol Biol. 677:303–338. 2011. View Article : Google Scholar : PubMed/NCBI
|
|
75.
|
Bommireddy R and Doetschman T: TGFβ1 and
Treg cells: alliance for tolerance Trends. Mol Med.
11:492–501. 2007.
|
|
76.
|
Gomez GG and Kruse CA: Mechanisms of
malignant glioma resistance and sources of immunosuppression. Gene
Ther Mol Biol. 10:133–146. 2006.PubMed/NCBI
|
|
77.
|
Avril T, Vauleon E, Tanguy-Royer S, Mosser
J and Quillien V: Mechanisms of immunomodulation in human
glioblastoma. Immunotherapy. 3(Suppl 4): 42–44. 2011. View Article : Google Scholar : PubMed/NCBI
|
|
78.
|
Leitlein J, Aulwurm S, Waltereit R, et al:
Processing of immunosuppressive pro-TGF-beta 1,2 by human
glioblastoma cells involves cytoplasmic and secreted furin-like
proteases. J Immunol. 166:7238–7243. 2001. View Article : Google Scholar : PubMed/NCBI
|
|
79.
|
Mercapide J, Lopez De Cicco R, Bassi DE,
Castresana JS, Thomas G and Klein-Szanto AJ: Inhibition of
furin-mediated processing results in suppression of astrocytoma
cell growth and invasiveness. Clin Cancer Res. 8:1740–1746.
2002.PubMed/NCBI
|
|
80.
|
Poli A, Kmiecik J, Domingues O, et al: NK
cells in central nervous system disorders. J Immunol.
190:5355–5362. 2013. View Article : Google Scholar : PubMed/NCBI
|
|
81.
|
Lodoen MB and Lanier LL: Viral modulation
of NK cell immunity. Nat Rev Microbiol. 3:59–69. 2005. View Article : Google Scholar : PubMed/NCBI
|
|
82.
|
Vivier E, Raulet DH, Moretta A, et al:
Innate or adaptive immunity? The example of natural killer cells.
Science. 331:44–49. 2011. View Article : Google Scholar : PubMed/NCBI
|
|
83.
|
Daga A, Bottino C, Castriconi R, Gangemi R
and Ferrini S: New perspectives in glioma immunotherapy. Curr Pharm
Des. 17:2439–2467. 2011. View Article : Google Scholar : PubMed/NCBI
|
|
84.
|
Hegi ME, Rajakannu P and Weller M:
Epidermal growth factor receptor: a re-emerging target in
glioblastoma. Curr Opin Neurol. 25:774–779. 2012. View Article : Google Scholar : PubMed/NCBI
|
|
85.
|
Pala A, Karpel-Massler G, Kast RE, Wirtz
CR and Halatsch ME: Epidermal to mesenchymal transition and failure
of EGFR-targeted therapy in glioblastoma. Cancers. 4:523–530. 2012.
View Article : Google Scholar : PubMed/NCBI
|