Introduction
Giant cell tumor of the bone is a relatively
uncommon neoplasm, which is a benign but locally aggressive bone
neoplasm characterized by massive bone destruction at the epiphysis
of the long bone and has a strong tendency to develop local
recurrence and metastasis (1). GCT
accounts for 4–5% of primary bone tumors and up to 20% of benign
bone tumors (2). Statistically,
80% of GCTs have a benign clinical course with a local recurrent
rate of 20–50%. Approximately 10% will undergo malignant
transformation and 1–4% will have pulmonary metastases even in
cases with a benign histology (3).
In China, GCT incidence is significantly higher and observed in
roughly 20% of all primary bone tumors (4). To date, surgery is the primary
treatment for GCT with unresectable tumors being treated with
radiotherapy (5), and these
treatment regimens have remained unchanged for much of the past
three decades, which is partially due to the lack of randomized
clinical trials (4) and lack of
chemotherapy options. Since the tissue origin of GCT remains to be
determined, and its clinical behavior is unpredictable, the
accurate prediction of its recurrence and metastasis is still not
available using clinical diagnosis, radiology and histology
(6). Thus, novel approaches are
urgently required to better understand the molecular mechanisms of
GCT carcinogenesis and to therefore provide meaningful strategies
for the effective control of GCT in the clinic.
Currently, profiling of altered genes and pathways
using gene chips is a useful method and an efficient alternative
strategy to establish disease-pathway relationships (7,8).
Information on disease-related genes, such as from the Genetic
Association Database (GAD) (9), is
increasingly available for constructing high quality
disease-metabolic pathway relationships. Different expression
profiles of the p53 pathway and stem cell pathway genes was
considered to be a major cause of the occurrence of GCT and
promoters of malignant transformation and metastasis (10). However, little is known about the
role that the p53 pathway plays underlying tumorigenesis and
development of recurrent GCT. Moreover, there is strong evidence
showing that the neoplastic cells of GCT are developed from
mesenchymal stem cells (11). In
recent years, more attention has been paid to subpathway (local
area of the entire biological pathway), which can provide more
detailed information of complex diseases in high-throughput data
analysis, because critical genes may not be significantly enriched
in the whole pathway, but nevertheless play key roles (12,13).
Therefore, in this study, we profiled differentially expressed
genes in recurrent versus primary GCT tissues and identified
significant subpathways to further explore the biological
mechanisms involved in the recurrence of GCT. Thus, the aim of this
study was to improve the understanding of these genes and pathways
in the regulation of GCT invasion, recurrence and metastasis, and
therefore to evaluate them as potential biomarkers for the early
detection and prediction of tumor recurrence.
Materials and methods
Study population
A total of 24 cases of bone GCT, including 12
primary and 12 recurrent tumors, were obtained from 17 GCT patients
who were surgically treated in the Department of Orthopedics
Surgery, Shantou Hospital of Zhongshan University, between March
2001 and April 2010. All cases were diagnosed by the experienced
subspecialty bone and soft-tissue pathologists, and confirmed by
another study pathologist. The clinicopathological data of each
patient were retrieved from their medical records and are
summarized in Table I. The
Institutional Review Board of Shantou Hospital of Zhongshan
University approved the study protocol and each patient signed an
informed consent form before recruitment into this study.
 | Table IClinical characteristics of recurrent
and primary bone GCT patients. |
Table I
Clinical characteristics of recurrent
and primary bone GCT patients.
| Case |
Primary/recurrent | Sex | Age (years) | Site | Campanacci’s
grading | Surgical
treatment |
|---|
| 1 | Primary | Female | 25 | Femur | I | Curettage |
| Recurrences | Female | 27 | Femur | III | Wide resection |
| 2 | Primary | Male | 44 | Radius | I | Curettage |
| Recurrences | Male | 46 | Radius | II | Curettage |
| Recurrences | Male | 48 | Radius | III | Wide resection |
| 3 | Primary | Male | 23 | Tibia | I | Curettage |
| Recurrences | Male | 24 | Tibia | II | Curettage |
| 4 | Primary | Female | 20 | Vertebra | I | Curettage |
| Recurrences | Female | 21 | Vertebra | II | Curettage |
| 5 | Primary | Female | 26 | Tibia | I | Curettage |
| Recurrences | Female | 26 | Tibia | I | Curettage |
| Recurrences | Female | 27 | Tibia | II | Curettage |
| 6 | Primary | Male | 18 | Fibula | I | Wide resection |
| 7 | Recurrences | Male | 40 | Humerus | III | Wide resection |
| 8 | Recurrences | Male | 49 | Femur | III | Wide resection |
| 9 | Recurrences | Male | 28 | Tibia | III | Curettage |
| 10 | Recurrences | Male | 48 | Femur | III | Wide resection |
| 11 | Primary | Female | 45 | Radius | II | Curettage |
| 12 | Recurrences | Male | 28 | Femur | III | Wide resection |
| 13 | Primary | Female | 19 | Femur | II | Curettage |
| 14 | Primary | Male | 50 | Humerus | II | Curettage |
| 15 | Primary | Female | 31 | Femur | II | Curettage |
| 16 | Primary | Female | 20 | Metacarpus | I | Curettage |
| 17 | Primary | Male | 23 | Tibia | I | Curettage |
Whole genome cDNA QuantiGene 2.0
microarray analysis
Formalin-fixed and paraffin-embedded (FFPE)
non-cancer and cancer tissues were isolated, separately by
scraping, and placed into 1.5-ml microcentrifuge tubes for
processing of tissue homogenates according to the procedure as
described in the QuantiGene sample processing kit for FFPE tissues
(Affymetrix, Inc., Santa Clara, CA, USA). Briefly, 300 μl of
homogenizing tissue mixture, containing 10 deparaffinized 10-μm
sections, were supplemented with 3 μl of proteinase K (50 μg/μl)
and incubated overnight at 65°C. The following day, the tissue
homogenates were separated from debris by brief centrifugation and
transferred to a new tube. The resulting tissue homogenates were
frozen at −80°C and stored until further use.
A QuantiGene 2.0 Multiplex assay system, containing
Human p53 80-Plex Panels and Human Stem Cell 80-Plex Panels, was
purchased from Affymetrix, Inc. The QuantiGene 80-Plex assay was
performed according to the recommended protocol of QuantiGene 2.0
reagent systems (Affymetrix, Inc.). Briefly, 40 μl of tissue
homogenate was mixed with 33.3 μl of lysis mixture, l μl of
blocking reagent, 0.3 μl of 2.0 probe set, and 25.4 μl of
nuclease-free water. The reactions were placed in a 96-well capture
plate covalently coated with capture probes and incubated for 16 h
at 54°C. Wells were washed three times with wash buffer to remove
unbound material. For signal amplification, with 100 μl of 2.0
Pre-Amplifier working reagent, 100 μl of Amplifier working reagent
was added to each sample and incubated for 1 h each at 50°C,
respectively. To detect the signal, to each sample was added 100 μl
of 2.0 substrate, the samples were sealed and incubated for 5 min.
Luminescence levels were then measured using a luminometer (Victor
Light; Perkin-Elmer, Waltham, MA, USA). Duplicate assays were
performed for all samples, and homogenizing buffer was used as
background control. To verify that the resulting assay signals were
linearly proportional to the sample input, a 2-fold dilution series
of each sample was performed. The RNA level of PGK1, TBP, HPRT1,
GUSB and TFRC (reference genes) were measured to normalize the
data.
Function enrichment analysis
We used the iSubpathwayMiner package that was
developed by our laboratory (12)
to identify the pathways of the differentially expressed genes in
recurrent vs. primary bone GCT tissues. The tool was an R package
for flexible biological pathway identification from the KEGG
database (14), which covered not
only the entire pathway level but also the subpathway level. During
enrichment analyses, we performed entire pathway and subpathway
identification for the differentially expressed genes based on the
hypergeometric test. The corresponding GCT data were integrated
with p53 gene and stem cell data and then into the corresponding
gene product nodes (referred to as signature nodes) within the
pathway. The lenient distance similar to the signature nodes within
the pathway structure were analyzed to locate key cascade
subpathway regions. Finally, a hypergeometric test was used to
evaluate the enrichment significance of these subpathway
regions.
Immunohistochemistry
We also performed immunohistochemistry using the
PV-9000 2-step plus Poly-HRP anti-mouse/rabbit IgG detection system
(ZSGB-BIO) and the liquid DAB substrate kit (ZSGB-BIO) to assess
expression of MDM2 in GCT tissues using an MDM2 antibody (cat no.
ZA-0519; ZSGB-BIO, Beijing, China). Briefly, 24 cases of GCT
tissues were built to form a tissue microarray (TMA) and prepared
for 4 μm sections. For immunohistochemistry, the TMA sections were
subjected to dewaxing in xylene and rehydration in a series of
graded alcohols, and then subjected to antigen retrieval with a
pressure cooker for 10 min in 0.01 M sodium citrate buffer (pH
6.0). After that, the sections were submerged in a peroxidase
quenching solution, containing one part of 30% hydrogen peroxide to
nine parts of distilled water, for 10 min and then washed with
phosphate-buffered saline (PBS) three times for 2 min each. The
sections were incubated in a moist chamber with 0.1 ml of blocking
serum solution for 10 min and then further incubated with 0.1 ml
primary antibody for 30 min. After rinsing with PBS three times for
2 min each, 0.1 ml of HRP polymer conjugate was added to each
section and incubated for 10 min, followed by a rinse with PBS.
Next, the sections were incubated with DAB chromogen solution for
3–10 min and subsequently counterstained with Mayer’s hematoxylin,
dehydrated and mounted. The negative controls were incubated with
10% normal goat serum to substitute the primary antibody.
Immunostained TMA sections were then reviewed and scored in a
blinded manner by at least two independent investigators. The
positive signal was observed in tumor cell cytoplasm, and scored as
the estimated percentage of staining. MDM2 immunoreactivity was
classified into three categories as negative (<20% tumor cells
displaying cytoplasmic staining); heterogeneous (20–79% tumor cells
with cytoplasmic reactivity); and homogeneous (>80% tumor cells
with intense cytoplasmic staining).
Statistical analysis
All statistical analyses were performed by using
SPSS 11.0 software (SPSS, Chicago, IL, USA). Statistical analyses
between primary and recurrent groups were determined by using the
Kruskal Wallis test. A P-value <0.05 was considered
statistically significant.
Results
Identification of differentially
expressed genes in recurrent vs. primary bone GCT
In this study, we analyzed differentially expressed
genes in recurrent vs. primary bone GCT tissues using QuantiGene
2.0 Multiplex assay. We identified a total of 32 differentially
expressed genes using fold-change (FD >2 or FD <0.5),
including 20 most upregulated genes and 12 most downregulated genes
in recurrent bone giant cell tumor tissues versus the primary
tumors (Table II). These genes
are related to cell growth, adhesion, apoptosis, signal
transduction, and bone formation, indicating that they may play
roles in bone GCT progression, such as recurrence or
metastasis.
| Table IIDifferentially expressed genes
between the primary and recurrent bone giant cell tumor
tissues. |
Table II
Differentially expressed genes
between the primary and recurrent bone giant cell tumor
tissues.
| Name | Full name | Fold change |
|---|
| NANOG | Nanog homeobox | 62.01 |
| CD4 | CD4 molecule | 23.97 |
| TIMP3 | Tissue inhibitor of
metalloproteinases 3 | 13.31 |
| ADAR | Adenosine
deaminase, RNA-specific | 10.63 |
| MDM2 | Murine double
minute 2 | 6.17 |
| NUMB | Numb homolog
(Drosophila) | 4.98 |
| STAT1 | Signal transducer
and activator of transcription 1 | 4.89 |
| BAX | BCL2-associated X
protein | 4.16 |
| PAFAH1B1 | Platelet-activating
factor acetylhydrolase 1b, regulatory subunit 1 (45 kDa) | 3.96 |
| RAC1 | Ras-related C3
botulinum toxin substrate 1 | 3.62 |
| CDH2 | Cadherin 2, type 1,
N-cadherin (neuronal) | 3.47 |
| NFKB1 | Nuclear factor of κ
light polypeptide gene enhancer in B-cells 1 | 3.32 |
| NCSTN | Nicastrin | 3.00 |
| CD8A | CD8a molecule | 2.27 |
| PGK1 | Phosphoglycerate
kinase 1 | 1.71 |
| IGF1 | Insulin-like growth
factor 1 (somatomedin C) | 1.47 |
| BTG2 | BTG family, member
2 | 1.34 |
| MME | Membrane
metallo-endopeptidase | 1.17 |
| CXCL12 | Chemokine (C-X-C
motif) ligand 12 | 1.10 |
| JUN | Jun
proto-oncogene | 0.21 |
| FZD1 | Frizzled family
receptor 1 | −1.81 |
| HK2 | Hexokinase 2 | −1.86 |
| TFRC | Transferrin
receptor (p90, CD71) | −2.22 |
| E2F1 | E2F transcription
factor 1 | −3.38 |
| MYC | v-myc
myelocytomatosis viral oncogene homolog (avian) | −7.67 |
| DVL3 | Dishevelled, dsh
homolog 3 (Drosophila) | −8.62 |
| BMP1 | Bone morphogenetic
protein 1 | −10.28 |
| EGR1 | Early growth
response 1 | −14.41 |
| FGFR1 | Fibroblast growth
factor receptor 1 | −20.25 |
| BMP2 | Bone morphogenetic
protein 2 | −36.26 |
| COL1A1 | Collagen, type I, α
1 | −469.8 |
Functional analysis of the differentially
expressed genes
We performed pathway enrichment analysis using the
differentially expressed genes in recurrent GCT tissues and
identified six gene pathways (Table
III). We then used the gene pathway data to locate the
important pathway regions, and tested the regions by entering the
differentially expressed genes into the p53 and stem data set of
150 genes for the pathway enrichment. Thus, we found a total of 11
subpathways (Table IV). It needs
to be pointed out that 6 of these subpathways were not identifiable
by the entire pathway identification method. Only focal adhesion
pathway is significant in both entire and subpathway identification
methods. If we only adopted the entire pathway identification
method, these pathways could be ignored due to their high P-values
threshold. However, these pathways were found statistically
significant using the subpathway identification method. The result
indicated that these subpathways may be associated with GCT
recurrence.
| Table IIIThe newly identified gene pathways
after the pathway enrichment analysis of the differentially
expressed genes. |
Table III
The newly identified gene pathways
after the pathway enrichment analysis of the differentially
expressed genes.
| Pathway ID | Pathway name | P-value | Ann molecule
list | AnnBg molecule
list |
|---|
| path:04640 | Hematopoietic cell
lineage | 0.007708 | CD8A; TFRC; MME;
CD4 | CD8A; TFRC; MME;
CD44; IL6; TNF; CD4 |
| path:04145 | Phagosome | 0.018792 | TFRC; RAC1 | TFRC; RAC1 |
| path:04974 | Protein digestion
and absorption | 0.018792 | MME; COL1A1 | MME; COL1A1 |
| path:05340 | Primary
immunodeficiency | 0.018792 | CD8A; CD4 | CD8A; CD4 |
| path:04514 | Cell adhesion
molecules (CAMs) | 0.036157 | CD8A; CDH2;
CD4 | CD8A; VCAN; NCAM1;
CDH2; CDH1; CD4 |
| path:04510 | Focal adhesion | 0.049058 | IGF1; COL1A1; JUN;
RAC1 | MAPK8; RHOA; IGF1;
CCND1; COL1A1; PTEN; JUN; BCL2; PRKCA; IGF1R; RAC1 |
| Table IVThe statistically significant
subpathways identified by iSubpathwayMiner. |
Table IV
The statistically significant
subpathways identified by iSubpathwayMiner.
| Subpathway ID | Pathway name | P-value | Differential genes
within the subpathway | Genes within the
subpathway |
|---|
| path:05200_1 | Pathways in
cancer | 0.002258 | DVL3; FZD1; IGF1;
STAT1; FGFR1; NFKB1; MDM2; MYC; RAC1 | DVL3; DVL1; FZD1;
RHOA; FZD8; FZD3; IGF1; STAT1; TCF7; FGFR1; NFKB1; MDM2; MYC; KRAS;
RELA; IGF1R; RAC1 |
| path:04062_1 | Chemokine signaling
pathway | 0.007513 | STAT1; NFKB1;
CXCL12; RAC1 | STAT1; NFKB1;
CXCL12; RELA; RAC1 |
| path:04115_1 | p53 signaling
pathway | 0.007513 | IGF1; SERPINE1;
MDM2; BAX | IGF1; TP53;
SERPINE1; MDM2; BAX |
| path:04380_1 | Osteoclast
differentiation | 0.007513 | STAT1; NFKB1; JUN;
RAC1 | STAT1; NFKB1; JUN;
RELA; RAC1 |
| path:04010_1 | MAPK signaling
pathway | 0.019088 | NFKB1; MYC; JUN;
RAC1 | MAPK8; NFKB1; MYC;
JUN; RELA; RAC1 |
| path:04510_1 | Focal adhesion | 0.019088 | IGF1; COL1A1; JUN;
RAC1 | MAPK8; IGF1;
COL1A1; JUN; IGF1R; RAC1 |
| path:05215_1 | Prostate
cancer | 0.019088 | IGF1; FGFR1; NFKB1;
MDM2 | IGF1; FGFR1; NFKB1;
MDM2; RELA; IGF1R |
| path:05220_1 | Chronic myeloid
leukemia | 0.030663 | NFKB1; MDM2;
MYC | NFKB1; MDM2; MYC;
RELA |
| path:04310_2 | Wnt signaling
pathway | 0.036904 | DVL3; FZD1; MYC;
JUN; RAC1 | DVL3; DVL1; FZD1;
FZD8; FZD3; TCF7; AXIN1; MYC; JUN; RAC1 |
| path:04722_1 | Neurotrophin
signaling pathway | 0.037737 | NFKB1; JUN; BAX;
RAC1 | MAPK8; TP53; NFKB1;
JUN; BAX; RELA; RAC1 |
| path:00010_1 |
Glycolysis/gluconeogenesis | 0.044385 | HK2; PGK1 | HK2; PGK1 |
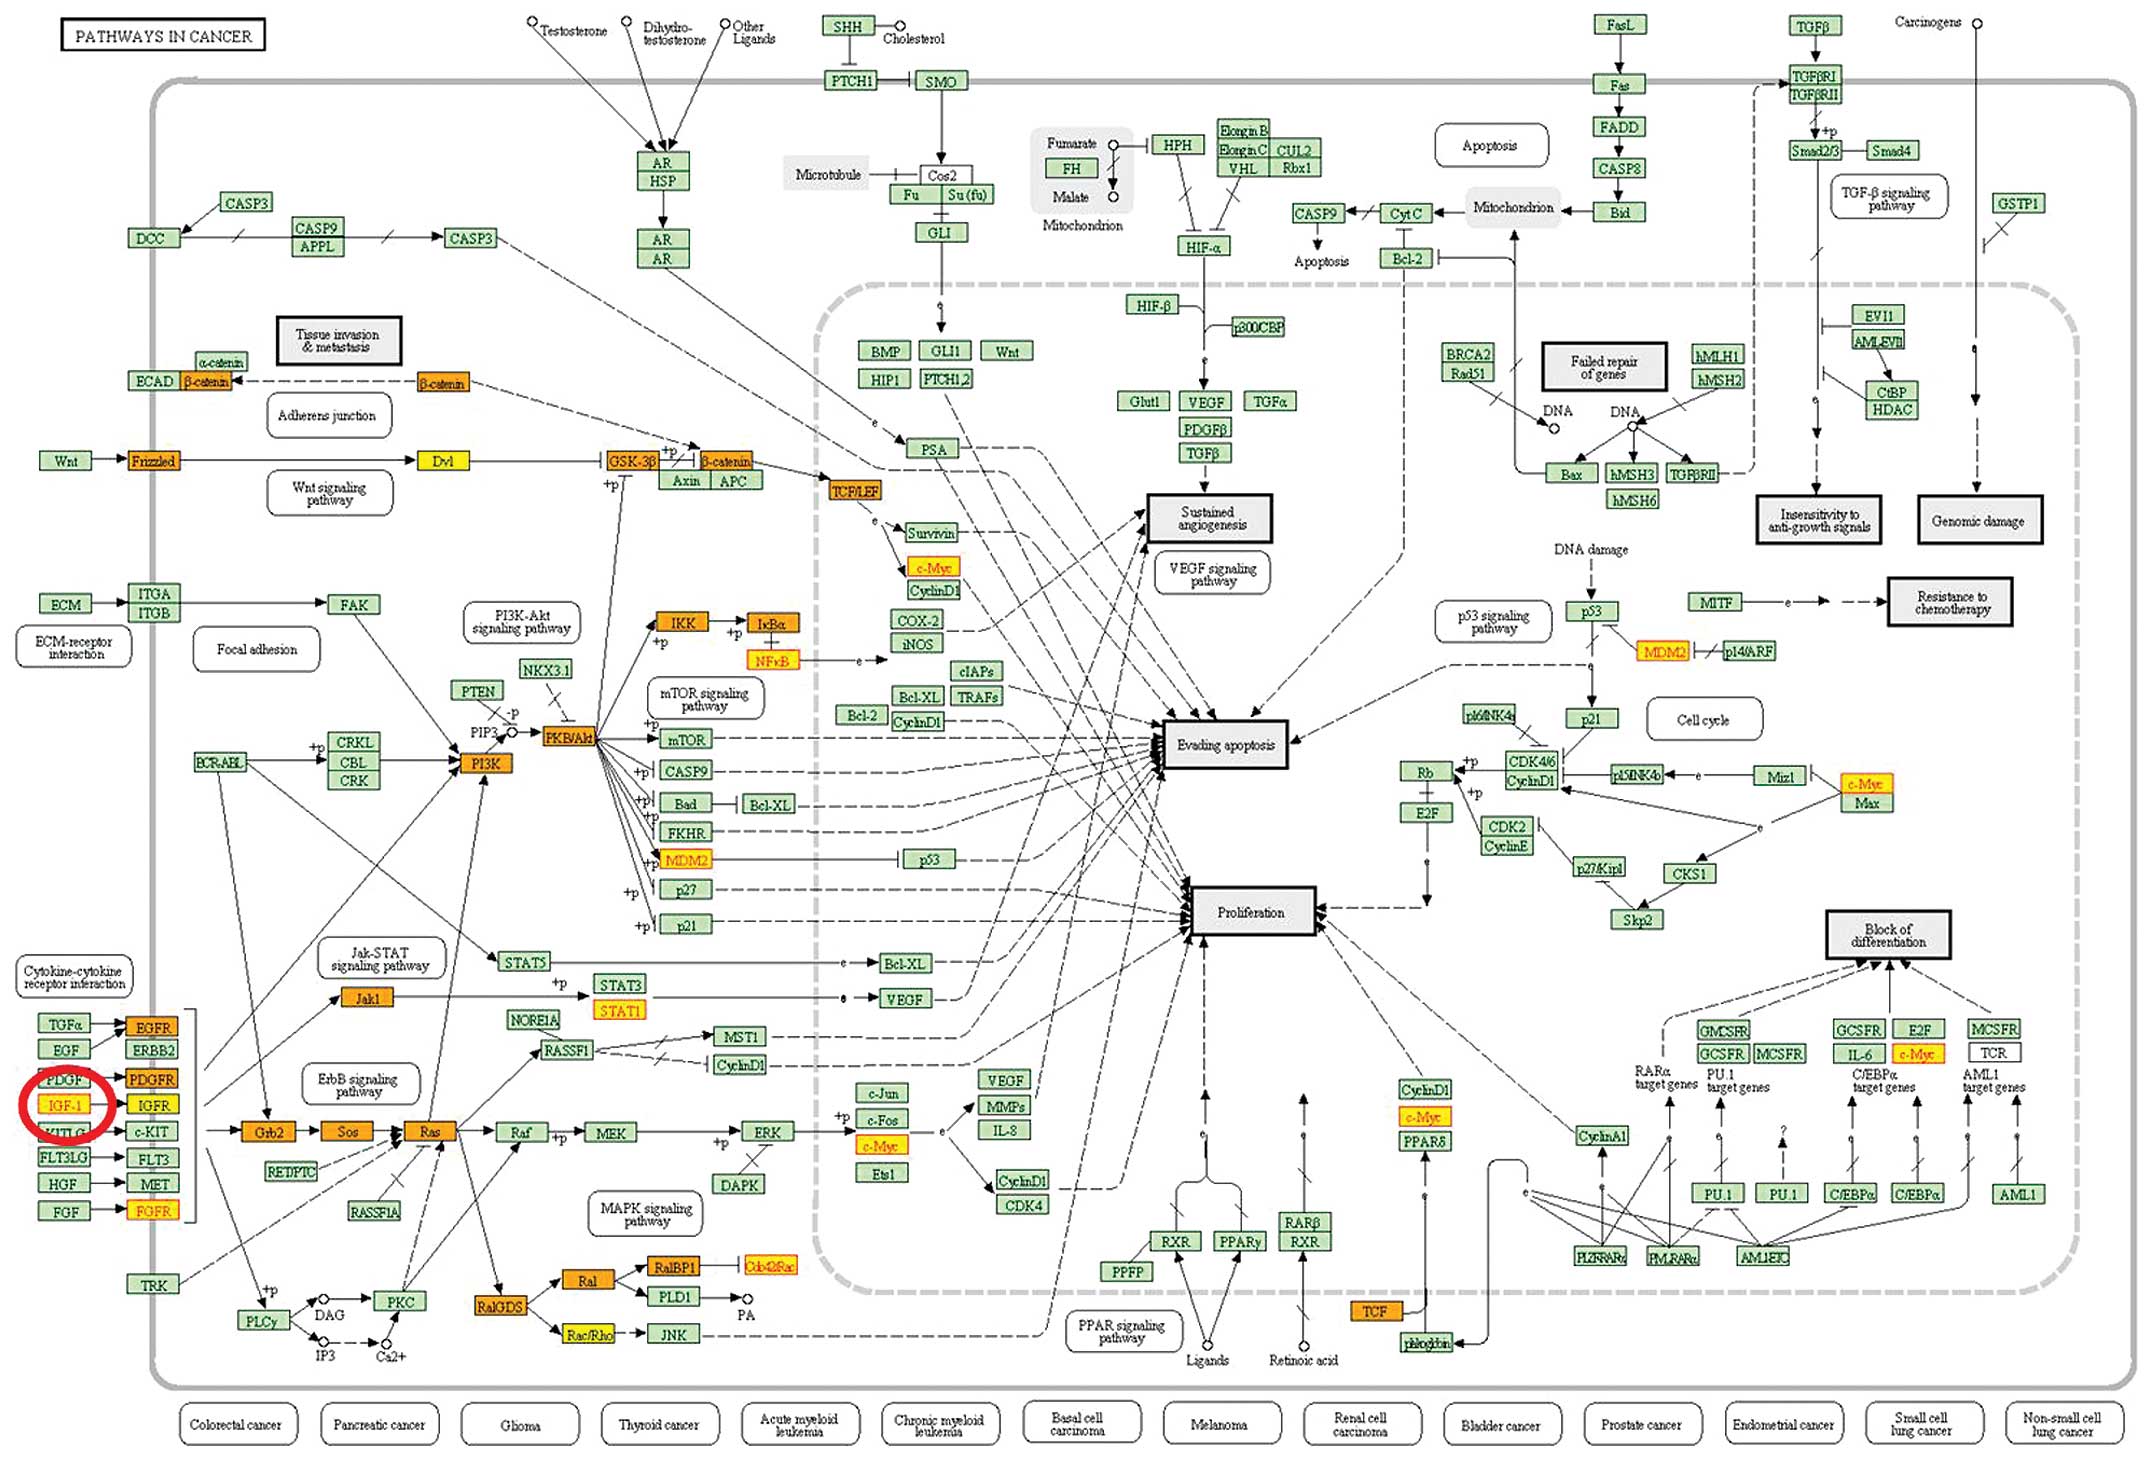
The most significant subpathway was the ‘pathways in
cancer’. GCT, as tumor disease was obviously associated with the
dysregulation of the pathway. We found that the differential gene
IGF1, a growth factor, was located in the starting regions in the
pathway (Fig. 1).
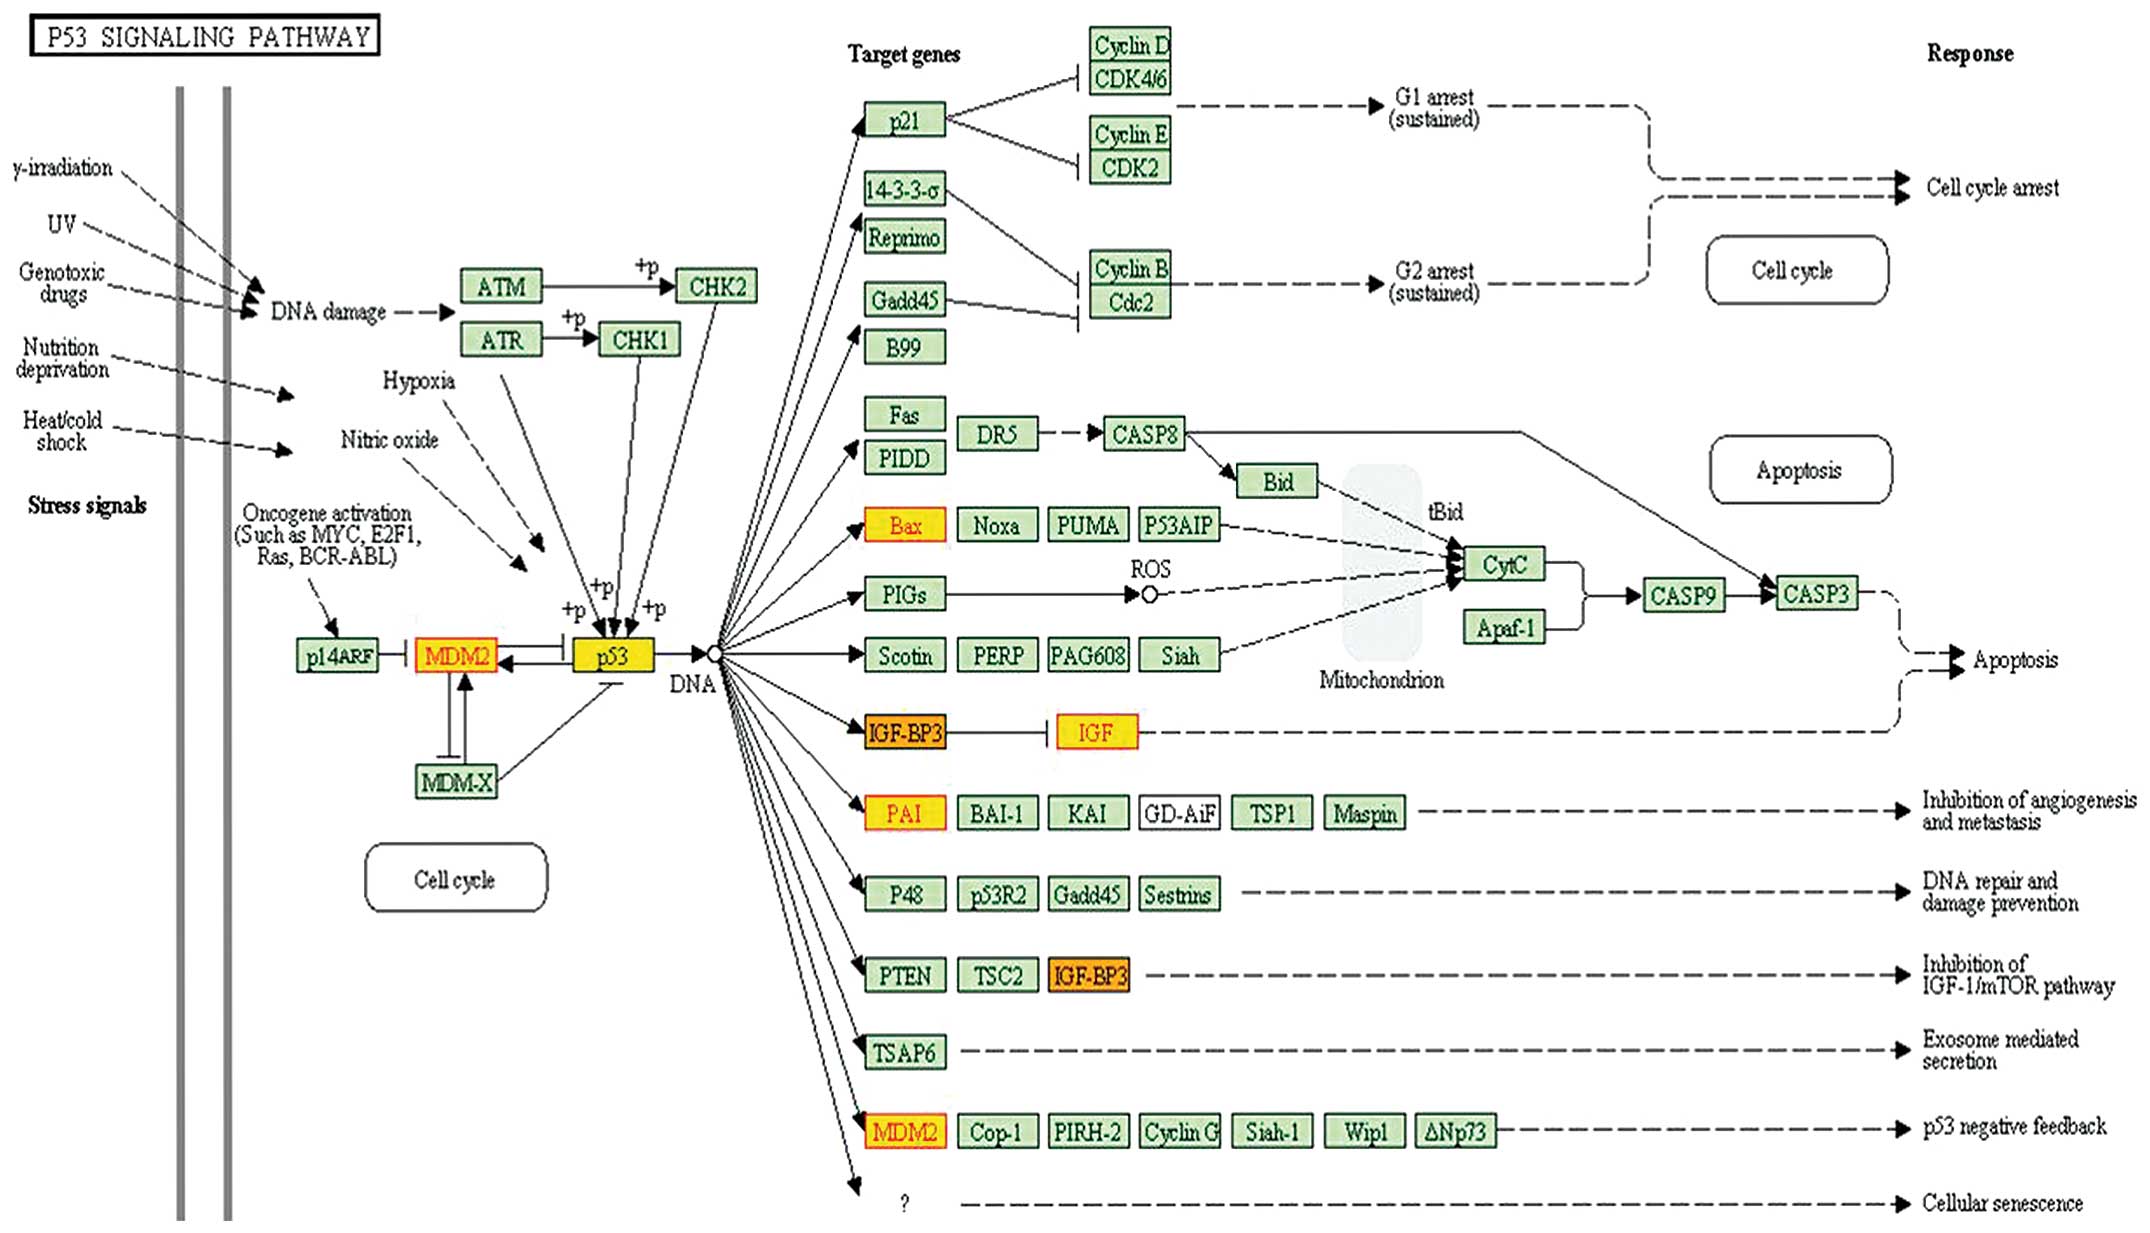
The third subpathway (path:04115_1) in Table I belonged to the p53 signaling
pathway. The pathway was reported to be highly associated with
giant cell tumor of bone (GCTB)(15–17).
Gene p53 was located in the center of the pathway and identified
within the subpathway path:04115_1 (Fig. 2). Moreover, MDM2 was localized in
the central region of this subpathway.
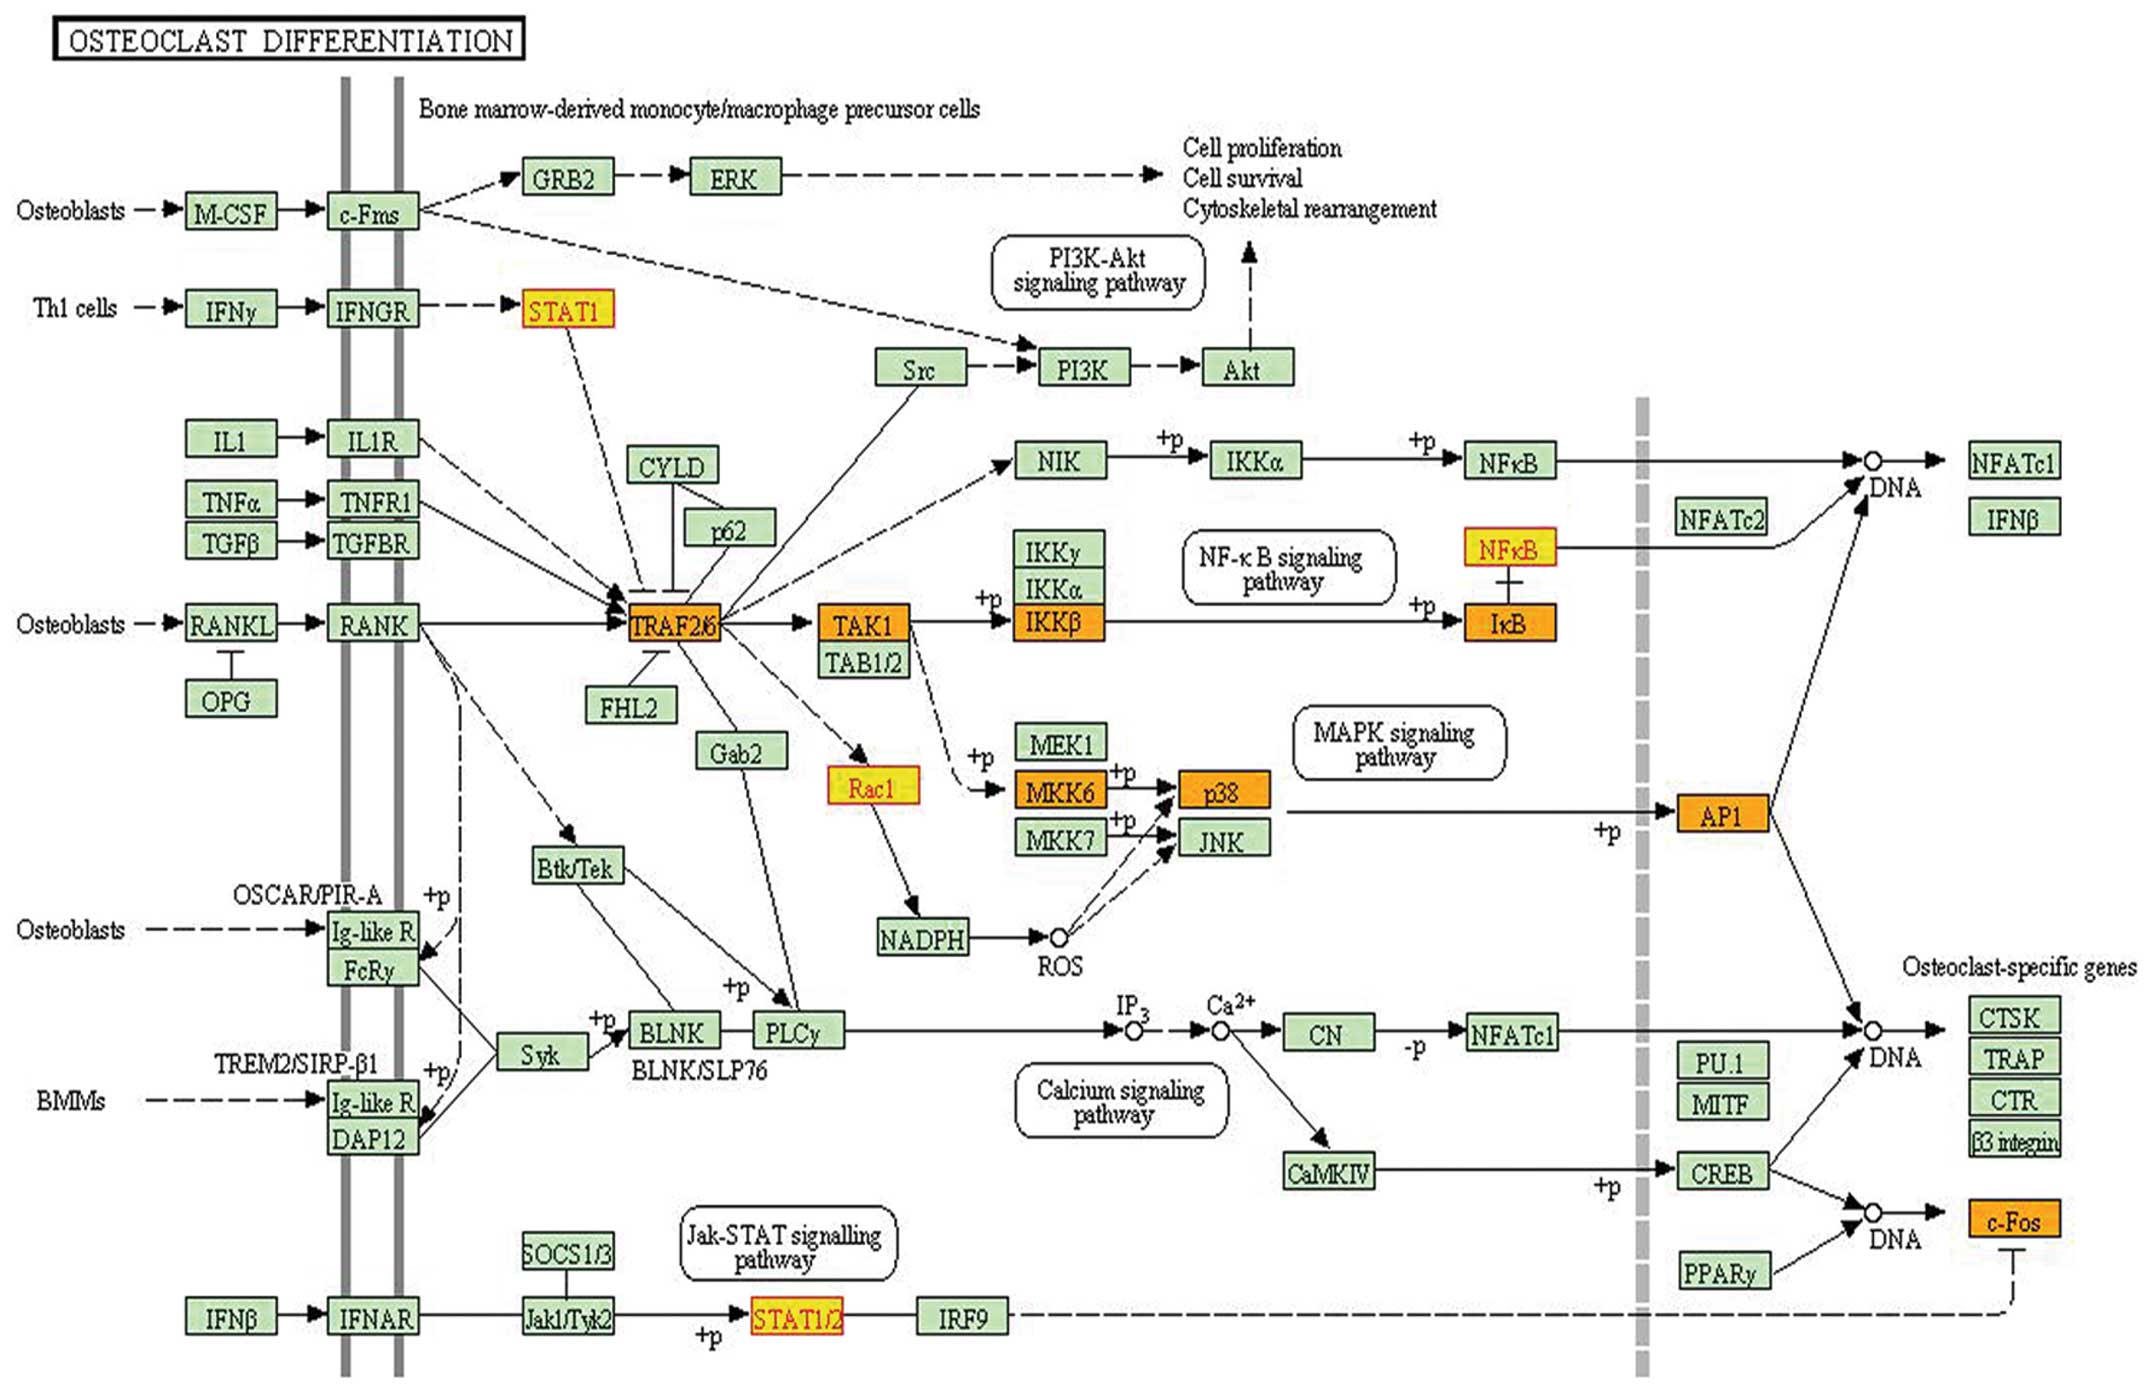
The fourth subpathway path:04380_1, which belonged
to the osteoclast differentiation pathway, was identified as
significant in iSubpathwayMiner, which yielded a P-value of 0.0075.
This pathway was associated with the localized bone destruction of
GCTB (18). Mononuclear stromal
cells in GCTs of bone have shown characteristics of the osteoblast
lineage by expressing many osteoblast-associated differentiation
markers (19). The bone resorption
activity of osteoclasts can cause destructive osteolysis and
consequent morbidity in GCT (18).
The subpathway path:04380_1 contained four differential genes: JUN,
NFKB1, STAT1 and RAC1 (Fig.
3).
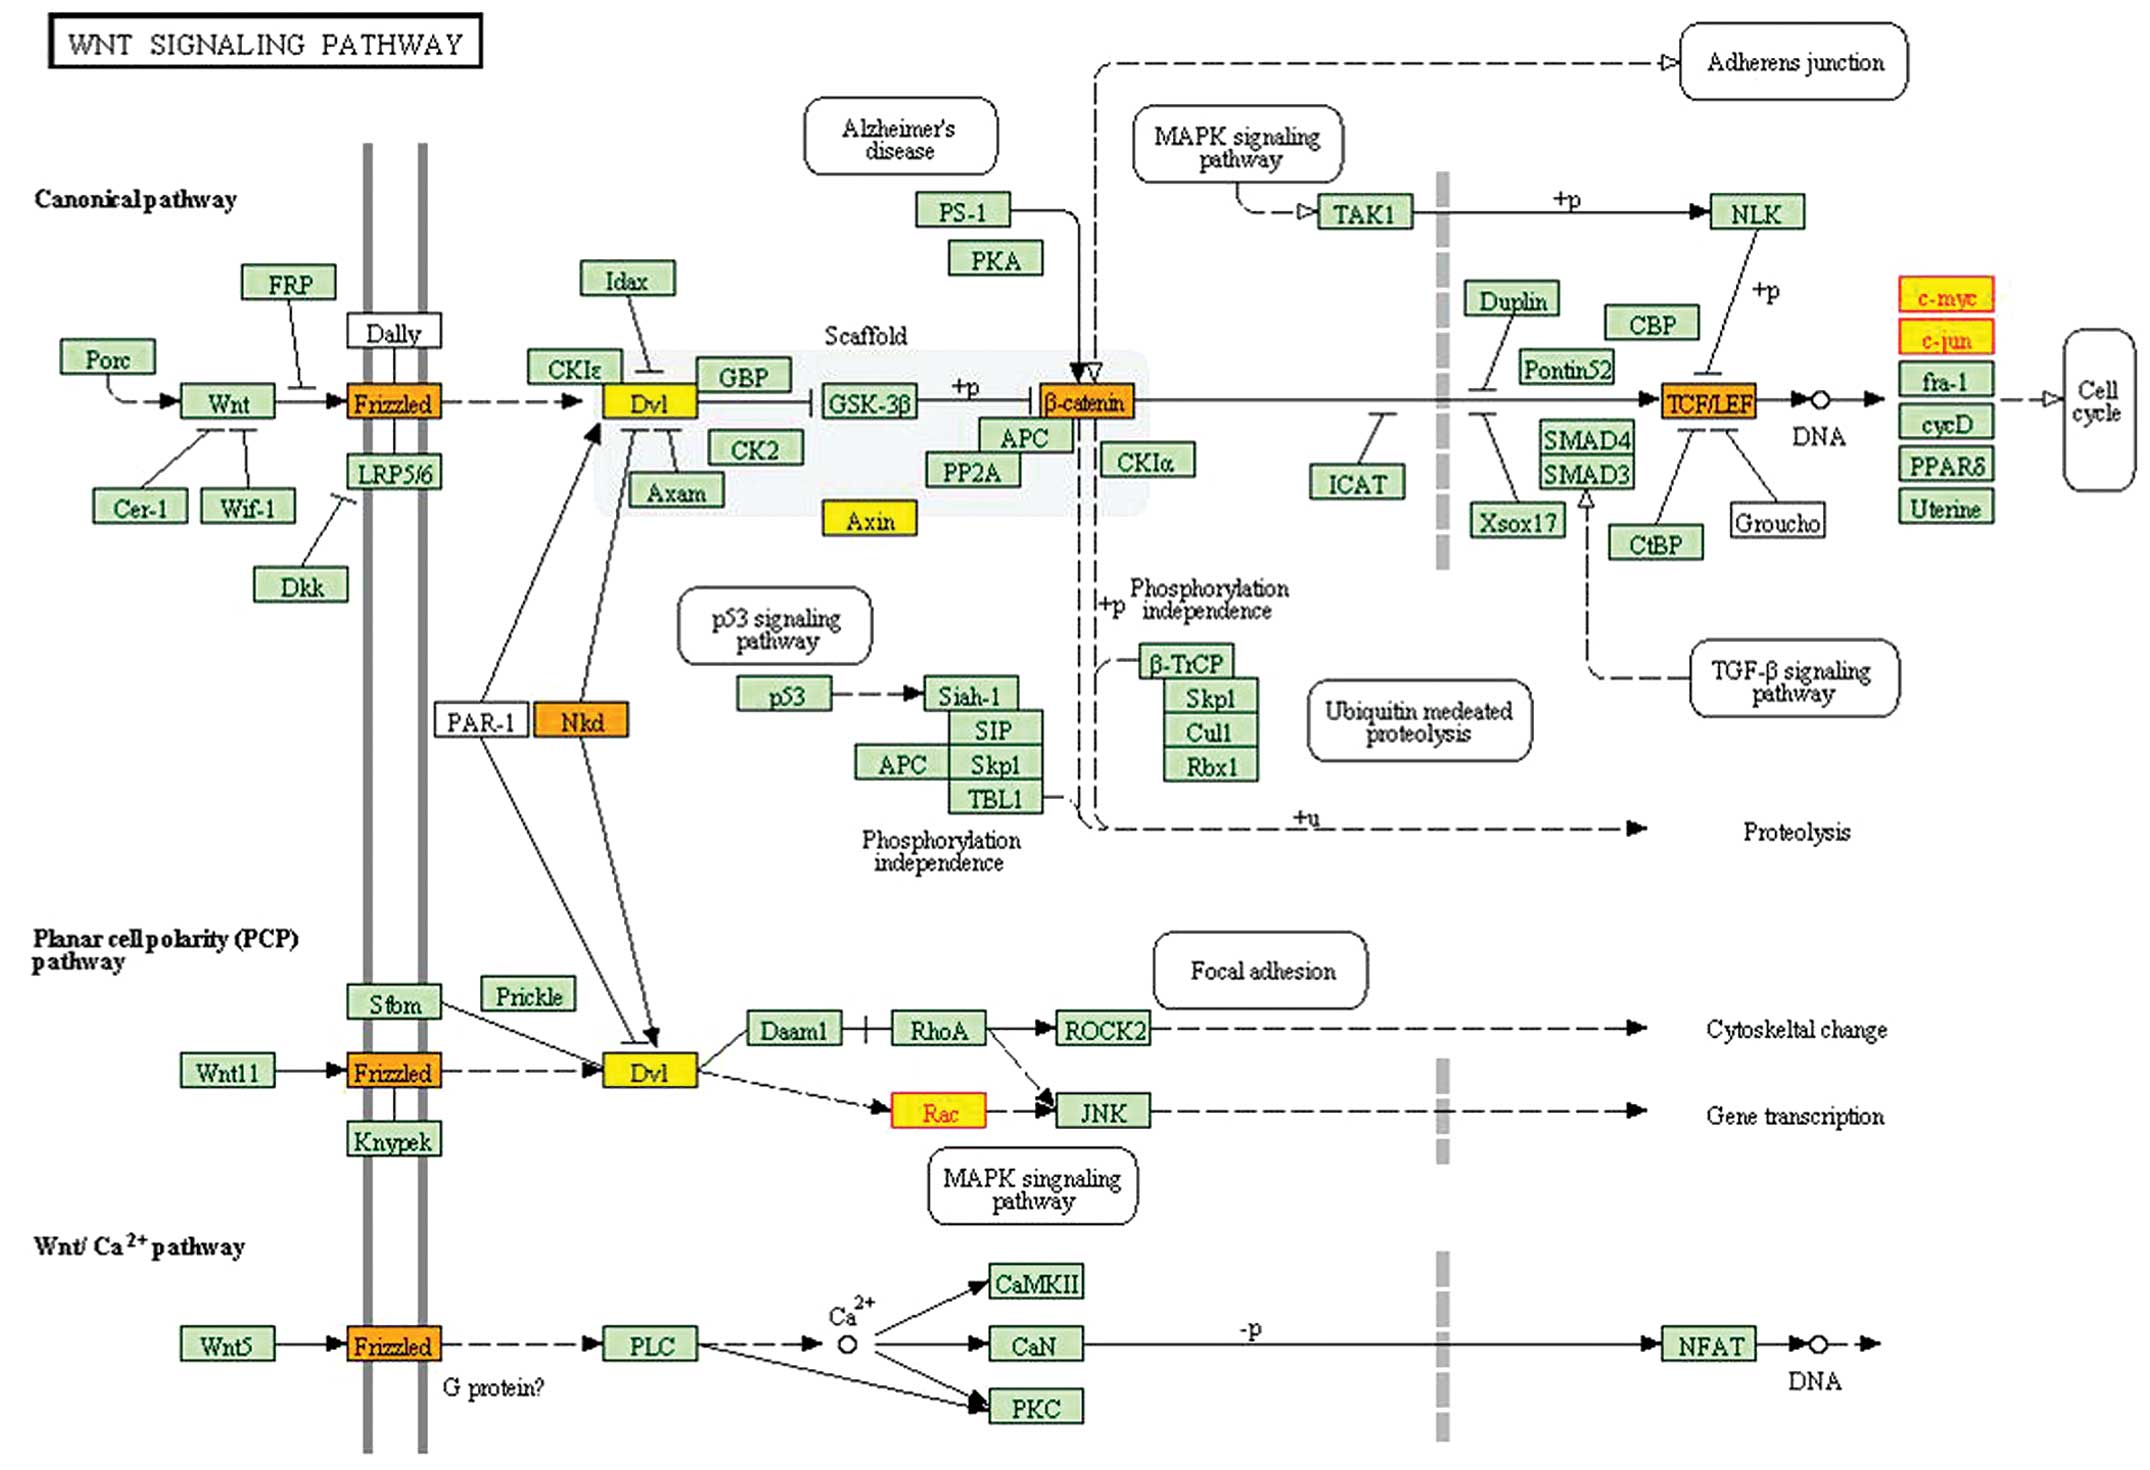
The ninth subpathway (path:04310_2) belonged to the
Wnt signaling pathway. The subpathway path:04310_2 contained MYC,
JUN, and RAC1, most of which were localized in the endpoint of this
pathway (Fig. 4).
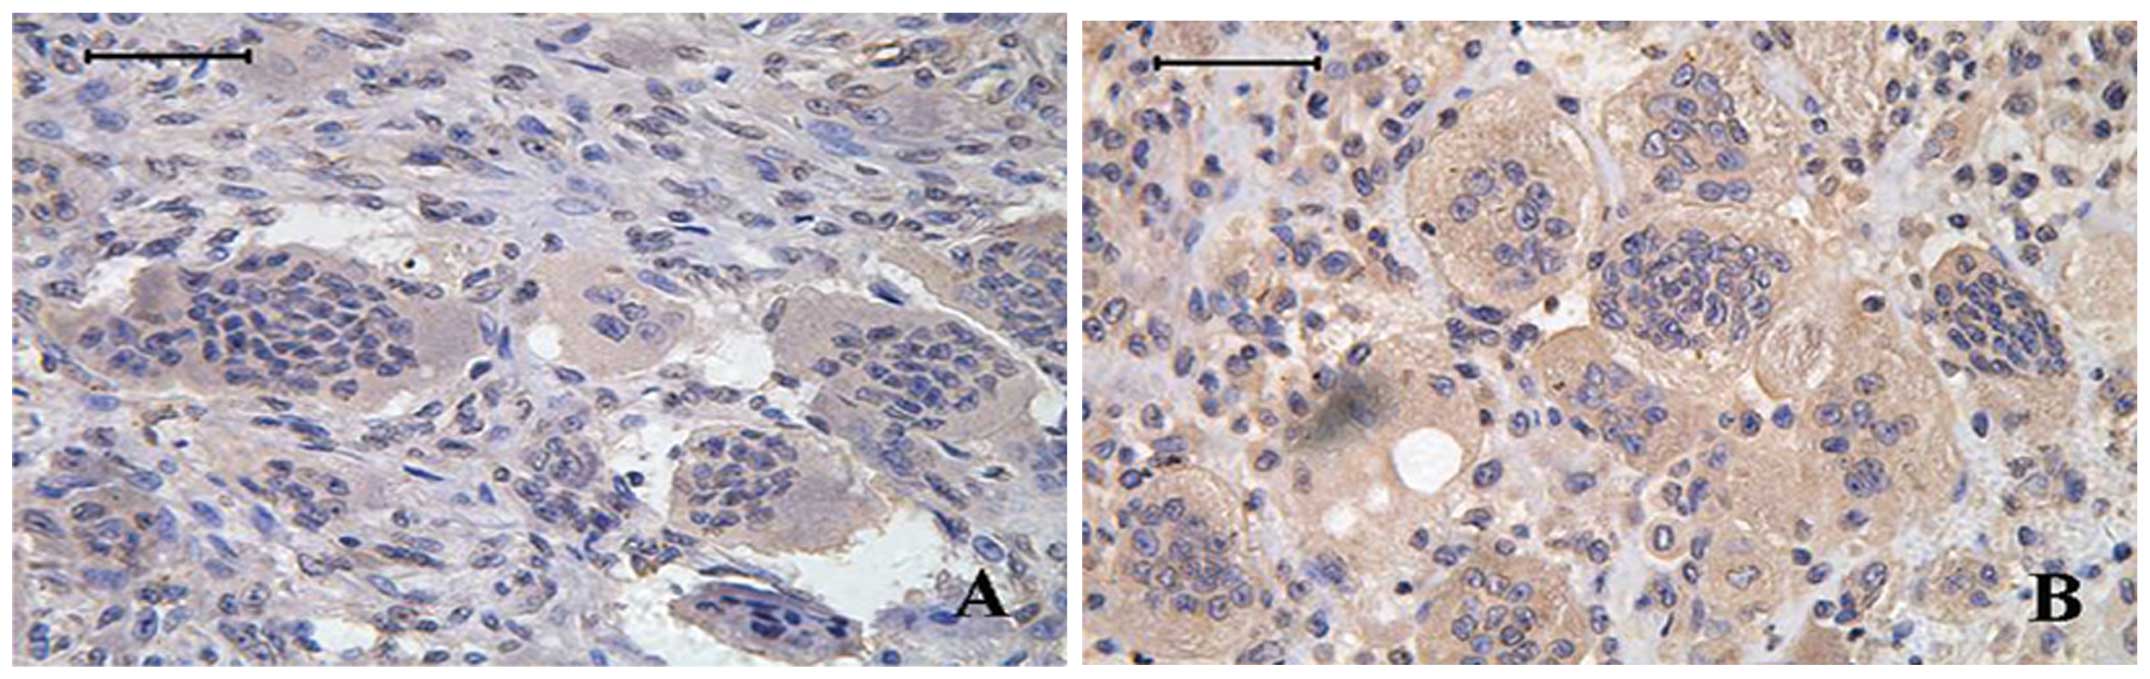
Immunohistochemical validation of MDM2
expression in bone GCT tissues
After the above pathway analysis, we identified many
risk genes in recurrent GCT. Among these risk genes, we chose MDM2
for immunohistochemical analysis in bone GCT tissues. MDM2 protein
was observed in both multinucleated giant cells and mononuclear
stromal cells in GCT tissues (Fig.
5). Comparing immunohistochemical results between the primary
and recurrent bone GCT tissues, MDM2 was statistically
significantly higher in recurrent tumors than primary tumors
(P=0.015, χ2=5.86). MDM2 is involved in the occurrence
and development of GCT.
Discussion
Bone GCT is a benign but locally aggressive bone
neoplasm with a strong tendency to develop a local recurrent and
metastatic disease. Recently, two studies attempted to identify
differentially expressed genes associated with GCT development and
progression (20,21). Altered expression of Ephrin A
receptor, Claudin 7, CD52, FGFR3, and AMFR was found by Guenther
et al (20), whereas
Skubitz et al (21)
reported that genes found to be overexpressed in GCTs included
tartrate-resistant acid phosphatase, the lysosomal
H+-transporting ATPase, and osteoprotegrin ligand
(OPGL). In our present study, we identified 32 differentially
expressed genes in the primary vs. recurrent bone GCT tissues and
we then used iSubpathwayMiner to annotate them into gene
subpathways resulting 11 statistically significantly enriched
subpathways. This study is just the first step to identify genes
that are associated with bone GCT recurrence and further study is
warranted to investigate them mechanistically in bone GCT to
provide biomarkers or therapeutic targets.
The present study identified several critical genes
and gene pathways that are associated with bone GCT recurrence. The
first gene was IGF1, which regulates cell proliferation,
differentiation and survival (22). IGFI plays an important role in
normal bone growth, bone cell turnover and metabolism, and is a key
factor in osteoblast proliferation and bone formation (23). IGF1 may be a possible prognostic
marker useful in the identification of GCT patients at a higher
risk of relapse with potential for development into a therapeutic
agent against GCT. Moreover, the third subpathway (path:04115_1)
belonged to the p53 signaling pathway and p53 is localized in the
center of this pathway and identified within the subpathway
path:04115_1. MDM2 was localized in the central region of this
subpathway. Indeed, p53 is frequently mutated in GCT and could be
useful in predicting tumor progression and local recurrence
(15). p53 mutations were detected
in the cases of secondary malignant giant-cell tumor without
irradiation therapy (10). Masui
et al showed that p53 expression levels correlated with the
rates of lung metastasis and recurrence of GCT (16). These results suggest that p53
mutations may play an important role in malignant transformation of
conventional GCT (17). MDM2 is a
negative regulator of p53 and plays an important role in the
p53-signaling pathway, suggesting a potentially high association
with bone GCT development. Indeed, MDM2 has been found widely
expressed in GCT (24). Thus, we
further evaluated MDM2 expression in bone GCT tissues and the
immune-reactivity of anti-MDM2 antibody was observed in
osteoclast-like giant cells and mononuclear stromal cells.
Statistical analyses showed that MDM2 expression was significantly
higher in recurrent tumors than in primary tumors, suggesting that
MDM2 might be associated with bone GCT recurrence.
Furthermore, the fourth subpathway path:04380_1 was
the osteoclast differentiation pathway. This subpathway
path:04380_1 contained four differentially expressed genes,
including JUN, NFKB1, STAT1 and RAC1. c-Jun is a component of the
heterodimeric AP-1 transcription factor and was highly expressed in
GCT stromal cells (25). JUN may
also be involved in upregulation of matrix-metalloproteinases in
GCT. MMP-2, MMP-13, and MMP-9 have been shown to be highly
expressed in GCT tissues (26–28).
Both MMP-2 and MMP-9 display several AP-1 consensus sequences
within their promoter regions and may be directly upregulated by
JUN (29). MMP-13 is responsible
for optimizing the bone resorption capability of the giant cells,
which is likely to be due to recruiting them to the bone surface
(27,30). JUN could influence normal ECM
physiology, thereby promoting growth and destructiveness of GCT
(27). NF-κB has been shown to
play an important role in many types of cancer and may also
regulate tumor angiogenesis and invasiveness. NF-κB provides a
mechanistic link between inflammation and cancer and is a major
transcriptional factor controlling the ability of both
pre-neoplastic and malignant cells to resist apoptosis-based
tumor-surveillance mechanisms (30). RANKL, as a negative regulator of
NF-κB, was identified as essential for osteoclast physiology
(31,32). RANKL is highly expressed in stromal
cells of GCT (33,34). As a potential therapeutic target of
bone disease, Amgen developed a monoclonal antibody to RANKL
(denosumab). Denosumab was studied in a recent proof-of-principle
phase II study of 35 patients with recurrent or unresectable GCT
(35). Twenty-six of the 31
patients with data reported reduced pain or improvement in the
functional status. Radiologic evidence of bone repair was reported
in nine patients. The treatment was generally well tolerated
without treatment-related serious adverse events. Thus, blockade of
RANKL signaling in patients with advanced or unresectable GCT could
provide objective changes in tumor composition, reduced bony
destruction, and clinical benefit. Signal transducer and activator
of transcription 1 (STAT1), localized in the starting region of the
subpathway path:04380_1 (Fig. 3),
was reported to be associated with human breast cancer, melanoma,
leukemia, lymphoma, and other cancers (36,37).
STAT1 has a critical role in regulation of bone growth and bone
formation (38).
In addition, the ninth subpathway (path:04310_2)
belongs to the Wnt signaling pathway. Several studies have shown
that this pathway plays an important role in regulation of skeletal
function, and the activation of Wnt signaling may induce osteoblast
differentiation and osteoclastogenesis during the bone resorption
process (39–41). Bone GCT was found associated with
activation of the Wnt signaling pathway (42). This subpathway contained MYC, JUN,
and RAC1, most of which were localized at the endpoint of this
pathway. Gamberi et al (43) showed a strong correlation between
c-Myc overexpression and GCT occurrence and its metastases. c-Myc
protein was overexpressed in both giant cells and mononuclear
cells, suggesting that both cell types are involved in progression
of this tumor type (43). Previous
studies found that Rac1 regulated a diverse array of cellular
events, including formation of lamellipodia and membrane ruffles,
cell cycle, cell adhesion and mobility (44–46).
Rac1 is thought to play a significant role in the development of
various cancers, including melanoma (45) and non-small cell lung cancer
(46). As a result, it is now
considered as a therapeutic target for these diseases (30). Rac1 can regulate survival signaling
of osteoclasts and their bone resorption activity (47). A transgenic mouse model was used to
confirm that Rac1 was the primary Rac isoform in regulating ROS
production and the cytoskeleton organization during the multiple
stages of osteoclast differentiation (48).
In conclusion, in the present study, we identified
32 genes that were differentially expressed in recurrent vs.
primary bone GCT tissues and found them in multiple subpathways.
Among them, four genes (IGF1, MDM2, STAT1 and RAC1) were located in
key positions in these pathways. Further studies will confirm our
current data and investigate their roles and functions in bone GCT
progression.
References
|
1
|
Gupta R, Seethalakshmi V, Jambhekar NA, et
al: Clinico-pathologic profile of 470 giant cell tumors of bone
from a cancer hospital in western India. Ann Diagn Pathol.
12:239–248. 2008. View Article : Google Scholar : PubMed/NCBI
|
|
2
|
Gamberi G, Serra M, Ragazzini P, et al:
Identification of markers of possible prognostic value in 57 giant
cell tumors of bone. Oncol Rep. 10:351–356. 2003.PubMed/NCBI
|
|
3
|
Szendröi M: Giant cell tumor of bone. J
Bone Joint Surg Br. 86:5–12. 2004.PubMed/NCBI
|
|
4
|
Thomas DM and Skubitz KM: Giant cell
tumour of bone. Curr Opin Oncol. 21:338–344. 2009. View Article : Google Scholar : PubMed/NCBI
|
|
5
|
Mendenhall WM, Zlotecki RA, Scarborough
MT, Gibbs CP and Mendenhall NP: Giant cell tumour of bone. Am J
Clin Oncol. 29:96–99. 2006. View Article : Google Scholar : PubMed/NCBI
|
|
6
|
Eckardt JJ and Grogan TJ: Giant cell tumor
of bone. Clin Orthop Relat Res. 204:45–58. 1986.PubMed/NCBI
|
|
7
|
Khatri P, Sellamuthu S, Malhotra P, et al:
Recent additions and improvements to the Onto-Tools. Nucleic Acids
Res. 33:W762–W765. 2005. View Article : Google Scholar : PubMed/NCBI
|
|
8
|
Wang K, Li M and Hakonarson H: Analysing
biological pathways in genomewide association studies. Nat Rev
Genet. 11:843–854. 2010. View
Article : Google Scholar : PubMed/NCBI
|
|
9
|
Becker KG, Barnes KC, Bright TJ and Wang
SA: The genetic association database. Nat Genet. 36:431–432. 2004.
View Article : Google Scholar
|
|
10
|
Papanastassiou I, Ioannou M,
Papagelopoulos PJ, et al: P53 expression as a prognostic marker in
giant cell tumor of bone: a pilot study. Orthopedics.
33:3072010.PubMed/NCBI
|
|
11
|
Wülling M, Delling G and Kaiser E: The
origin of the neoplastic stromal cell in giant cell tumor of bone.
Hum Pathol. 34:983–993. 2003.PubMed/NCBI
|
|
12
|
Li C, Li X, Miao Y, et al:
SubpathwayMiner: a software package for flexible identification of
pathways. Nucleic Acids Res. 37:e1312009. View Article : Google Scholar : PubMed/NCBI
|
|
13
|
Li X, Li C, Shang D, et al: The
implications of relationships between human diseases and metabolic
subpathways. PLoS One. 6:e211312011. View Article : Google Scholar : PubMed/NCBI
|
|
14
|
Kanehisa M, Goto S, Sato Y, Furumichi M
and Tanabe M: KEGG for integration and interpretation of
large-scale molecular data sets. Nucleic Acids Res. 40(Database
issue): D109–D114. 2012. View Article : Google Scholar : PubMed/NCBI
|
|
15
|
Oda Y, Sakamoto A, Saito T, et al:
Secondary malignant giant- cell tumor of bone: molecular
abnormalities of p53 and H-ras gene correlated with malignant
transformation. Histopathology. 39:6292001. View Article : Google Scholar : PubMed/NCBI
|
|
16
|
Masui F, Ushigome S and Fujii K: Giant
cell tumor of bone: a clinicopathologic study of prognostic
factors. Pathol Int. 48:7231998. View Article : Google Scholar : PubMed/NCBI
|
|
17
|
Gong L, Liu W, Sun X, et al: Histological
and clinical characteristics of malignant giant cell tumor of bone.
Virchows Arch. 460:327–334. 2012. View Article : Google Scholar : PubMed/NCBI
|
|
18
|
Boyle WJ, Simonet SW and Lacey DL:
Osteoclast differentiation and activation. Nature. 423:337–342.
2003. View Article : Google Scholar : PubMed/NCBI
|
|
19
|
Murata A, Fujita T, Kawahara N, Tsuchiya H
and Tomita K: Osteoblast lineage properties in giant cell tumors of
bone. J Orthop Sci. 10:581–588. 2005. View Article : Google Scholar : PubMed/NCBI
|
|
20
|
Guenther R, Krenn V, Morawietz L, et al:
Giant cell tumors of bone: molecular profiling and expression
analysis of Ephrin A receptor, Claudin 7, CD52, FGFR3 and AMFR.
Pathol Res Pract. 201:649–663. 2005. View Article : Google Scholar : PubMed/NCBI
|
|
21
|
Skubitz KM, Cheng EY, Clohisy DR, Thompson
RC and Skubitz AP: Gene expression in giant cell tumors. J Lab Clin
Med. 144:193–200. 2004. View Article : Google Scholar : PubMed/NCBI
|
|
22
|
Kappel CC, Velez-Yanguas MC, Hirschfeld S
and Helman LJ: Human osteosarcoma cell lines are dependent on
insulin-like growth factor I for in vitro growth. Cancer Res.
54:2803–2807. 1994.PubMed/NCBI
|
|
23
|
Bonjour JP, Schurch MA, Chevalley T,
Ammann P and Rizolli R: Protein intake. IGF-1 and osteoporosis.
Osteoporosis Int. 7:36–42. 1997. View Article : Google Scholar
|
|
24
|
de Souza PE, Paim JF, Carvalhais JN and
Gomez RS: Immunohistochemical expression of p53, MDM2, Ki-67 and
PCNA in central giant cell granuloma and giant cell tumor. J Oral
Pathol Med. 28:54–58. 1999.PubMed/NCBI
|
|
25
|
Mak IW, Turcotte RE, Popovic S, Singh G
and Ghert M: AP-1 as a regulator of MMP-13 in the stromal cell of
giant cell tumor of bone. Biochem Res Int.
2011:1641972011.PubMed/NCBI
|
|
26
|
Rao VH, Singh RK, Delimont DC, et al:
Interleukin-1beta upregulates MMP-9 expression in stromal cells of
human giant cell tumor of bone. J Interferon Cytokine Res.
19:1207–1217. 1999. View Article : Google Scholar : PubMed/NCBI
|
|
27
|
Teti A, Farina AR, Villanova I, et al:
Activation of MMP-2 by human GCT23 giant cell tumor cells induced
by osteopontin, bone sialoprotein and GRGDSP peptides is RGD and
cell shape change dependent. Int J Cancer. 77:82–93. 1998.
View Article : Google Scholar
|
|
28
|
Mak IW, Seidlitz EP, Cowan RW, et al:
Evidence for the role of matrix metalloproteinase-13 in bone
resorption by giant cell tumor of bone. Hum Pathol. 41:1320–1329.
2010. View Article : Google Scholar : PubMed/NCBI
|
|
29
|
Yoon SO, Park SJ, Yun CH and Chung AS:
Roles of matrix metalloproteinases in tumor metastasis and
angiogenesis. J Biochem Mol Biol. 36:128–137. 2003. View Article : Google Scholar : PubMed/NCBI
|
|
30
|
Karin M: Nuclear factor-kappaB in cancer
development and progression. Nature. 441:431–436. 2006. View Article : Google Scholar : PubMed/NCBI
|
|
31
|
Dougall WC, Glaccum M, Charrier K, et al:
RANK is essential for osteoclast and lymph node development. Genes
Dev. 13:2412–2424. 1999. View Article : Google Scholar : PubMed/NCBI
|
|
32
|
Simonet WS, Lacey DL, Dunstan CR, et al:
Osteoprotegerin: a novel secreted protein involved in the
regulation of bone density. Cell. 89:309–319. 1997. View Article : Google Scholar : PubMed/NCBI
|
|
33
|
Morgan T, Atkins GJ, Trivett MK, et al:
Molecular profiling of giant cell tumor of bone and the
osteoclastic localization of ligand for receptor activator of
nuclear factor kappaB. Am J Pathol. 167:117–128. 2005. View Article : Google Scholar : PubMed/NCBI
|
|
34
|
Geldyyev A, Koleganova N, Piecha G, et al:
High expression level of bone degrading proteins as a possible
inducer of osteolytic features in pigmented villonodular synovitis.
Cancer Lett. 255:275–283. 2007. View Article : Google Scholar
|
|
35
|
Thomas D, Henshaw R, Skubitz K, et al:
Denosumab in patients with giant-cell tumor of bone: an open-label,
phase 2 study. Lancet Oncol. 11:275–280. 2010. View Article : Google Scholar : PubMed/NCBI
|
|
36
|
Bowman T, Garcia R, Turkson J and Jove R:
STATs in oncogenesis. Oncogene. 19:2474–2488. 2000. View Article : Google Scholar
|
|
37
|
Boudný V, Kocák I, Lauerová L and Kovarík
J: Interferon inducibility of STAT 1 activation and its prognostic
significance in melanoma patients. Folia Biol. 49:142–146.
2003.PubMed/NCBI
|
|
38
|
Sims NA, Jenkins BJ, Quinn JM, et al:
Glycoprotein 130 regulates bone turnover and bone size by distinct
downstream signaling pathways. J Clin Invest. 113:379–389. 2004.
View Article : Google Scholar : PubMed/NCBI
|
|
39
|
Holmen SL, Zylstra CR, Mukherjee A, et al:
Essential role of beta-catenin in postnatal bone acquisition. J
Biol Chem. 280:21162–21168. 2005. View Article : Google Scholar : PubMed/NCBI
|
|
40
|
Gaur T, Lengner CJ, Hovhannisyan H, et al:
Canonical WNT signaling promotes osteogenesis by directly
stimulating Runx2 gene expression. J Biol Chem. 280:33132–33140.
2005. View Article : Google Scholar : PubMed/NCBI
|
|
41
|
Goldring SR and Goldring MB: Eating bone
or adding it: the Wnt pathway decides. Nat Med. 13:133–134. 2007.
View Article : Google Scholar : PubMed/NCBI
|
|
42
|
Matsubayashi S, Nakashima M, Kumagai K, et
al: Immunohistochemical analyses of beta-catenin and cyclin D1
expression in giant cell tumor of bone (GCTB): a possible role of
Wnt pathway in GCTB tumorigenesis. Pathol Res Pract. 205:626–633.
2009. View Article : Google Scholar : PubMed/NCBI
|
|
43
|
Gamberi G, Benassi MS, Böhling T, et al:
Prognostic relevance of C-myc gene expression in giant-ceIl tmnor
of bone. J Orthop Res. 16:1–7. 1998. View Article : Google Scholar : PubMed/NCBI
|
|
44
|
Ridley AJ: Rho GTPases and actin dynamics
in membrane protrusions and vesicle trafficking. Trends Cell Biol.
16:522–529. 2006. View Article : Google Scholar : PubMed/NCBI
|
|
45
|
Stallings-Mann ML, Waldmann J, Zhang Y,
Miller E and Gauthier ML: Matrix metalloproteinase induction of
Rac1b, a key effector of lung cancer progression. Sci Transl Med.
4:142ra952012.PubMed/NCBI
|
|
46
|
McAllister SS: Got a light? Illuminating
lung cancer. Sci Transl Med. 4:142fs222012.PubMed/NCBI
|
|
47
|
Wang L, Kuang L, Pan X, et al: Isoalvaxant
hone inhibits colon cancer cell proliferation, migration and
invasion through inactivating Racl and AP-1. Int J Cancer.
127:1220–1229. 2010. View Article : Google Scholar : PubMed/NCBI
|
|
48
|
Fukuda A, Hikita A, Wakeyama H, et al:
Regulation of osteoclast apoptosis and motility by small GTPase
binding protein Rac1. J Bone Miner Res. 20:2245–2253. 2005.
View Article : Google Scholar : PubMed/NCBI
|