Introduction
B-cell-specific moloney murine leukemia virus
integration site 1 (BMI1), also known as polycomb group RING finger
protein 4 (PCGF4), is a member of the polycomb group protein
family. Accumulating evidence indicates that BMI1 plays a critical
role in the regulation of cell proliferation, cell cycle, cell
immortalization and chemoresistance (1–4), and
therefore, BMI1 has been considered as a novel target for cancer
therapy (3). Indeed, in
vivo studies have demonstrated that the protein level of BMI1
is elevated in many types of cancers (5–7).
Additionally, numerous molecular studies have demonstrated the
function of BMI1 as a transcriptional regulator of gene expression
(8,9). The INK4a/ARF tumor suppressor locus,
which encodes tumor suppressor proteins p16INK4a and
p14ARF, is significantly repressed by BMI1 (8). In studies using cDNA microarray
analysis, BMI1 was found to regulate the expression of hundreds of
downstream target genes, including genes that are involved in both
differentiation and development (9). Furthermore, BMI1 represses the
expression of microRNAs (miRNAs), such as let-7i, which targets the
mitotic kinase Aurora A (10).
Other studies have revealed that BMI1 contributes to radiation
resistance (radioresistance) of normal and cancer cells (11–14);
therefore, BMI1 expression is a predictive factor for poor patient
prognosis (4). Notably, BMI1
overexpression significantly reduces the ionizing
radiation-mediated DNA double-strand break and cytotoxic effects
in vitro and in vivo (12,13);
however, the effectiveness of BMI1 against irradiation has been
studied at relatively high doses (≥1 Gy). Therefore, whether BMI1
influences cell growth upon cellular exposure to low doses of
ionizing radiation (≤0.1 Gy), remains unknown.
Understanding the cellular effects of exposure to
low-dose radiation (LDR) in human cells is important, as humans are
continuously exposed to LDR from nature, medical devices, nuclear
energy production sources and other industrial uses of ionizing
radiation (15). Research into the
biological effects of LDR exposure is summarized into 3 categories:
the linear non-threshold (LNT) model, threshold model and
radioadaptive model (16). Because
LDR has no immediate noticeable effects on humans, the biological
effects of LDR have typically been estimated by extrapolation based
on the biological effects of high-dose radiation (LNT model)
(17); however, this model has
become controversial because cellular responses can be very
different following LDR compared to responses to high radiation
doses (18). Venkat et al
demonstrated that pre-exposure to LDR in the range of about 1 cGy
reduced the frequency of micronuclei in binucleated cells induced
by 100 cGy, modulating the radioadaptive responses in human
lymphocytes (19). This phenomenon
clearly supports the radioadaptive model (20); however, other studies have shown
that LDR induces hyper-radiosensitivity (HRS) and increases
radioresistance responses (IRR) in cells (21). These studies revealed that
mammalian cells exhibit HRS to radiation doses of less than 0.3 Gy,
whereas in the 0.3-to-0.6 Gy dose range, a more radioresistant
response is observed (21).
Clearly, all of the models for the LDR responses are not fully
understood.
miRNAs, which are small non-coding RNAs with lengths
of 19–24 nucleotides (22), play
important roles in several biological processes, including cell
proliferation, differentiation, apoptosis and stress resistance,
via regulation of gene expression pathways (23). In our previous study, we found that
the miRNA expression profiles are altered by high-dose
gamma-irradiation (≥0.5 Gy), implicating the alteration of miRNA
expression profiles in the irradiation response (24–26).
Other studies also demonstrated a role for miRNAs in radiation
response. Specifically, miR-185 enhances ionizing radiation-induced
apoptosis through regulation of the ataxia telangiectasia
protein-related (ATR) pathway (27). In addition, ionizing
radiation-inducible miR-193a-3p directly targets myeloid cell
leukemia 1 (MCL-1) and induces apoptosis (28). These studies revealed alterations
of miRNA expression profiles and functions at relatively high doses
of radiation. Thus, the interplay between LDR response and miRNAs
is not fully understood. Here, we investigated how BMI1 and miRNAs
influence the LDR response.
Materials and methods
Cell culture and irradiation
Normal human dermal fibroblast (NHDF) cells were
purchased from Lonza (Basel, Switzerland) and cultured in
Dulbecco’s modified Eagle’s medium (DMEM, Gibco, Life Technologies,
Grand Island, NY, USA) containing 10% fetal bovine serum (FBS,
Sigma-Aldrich, St. Louis, MO, USA) at 37°C in a humidified chamber
with 5% CO2. To evaluate the patterns of cell cycle
effects and miRNA expression, 7×10⁵ cells were seeded in
a 60-mm culture plate and grown for 24 h. These cells then were
irradiated with 0.1 Gy of γ-radiation using a MDI-KIRAMS 137
irradiator (137Cs γ-ray source, KIRAMS, Seoul,
Korea).
Generation of stable BMI1-knockdown
NHDFs
A BMI1 stable knockdown cell line was established
using lentiviral gene transfer. The plasmid shBMI1-pLKO.1 puro was
purchased from Sigma-Aldrich. The 293T cells were co-transfected
with shBMI1-pLKO.1 puro lentiviral transfer vector, pCMV-dR8.2
(Addgene, Cambridge, MA, USA), and pCMV-VSV-G plasmid (Addgene).
Approximately 48 h after transfection, recombinant lentivirus
particle-containing medium was collected and used to infect NHDFs.
Infected NHDFs were incubated with the growth culture medium
containing puromycin (1 μg/ml) to select BMI1-knockdown cells.
Western blot analysis
Cell lysates were prepared in SDS lysis buffer [1%
(w/v) SDS, 20 mM Tris-HCl pH 7.4, 20 mM EDTA]. Protein samples were
subjected to SDS-PAGE and then transferred to a nitrocellulose
membrane (Whatman International Ltd., Maidstone, UK). Membranes
were incubated in a solution of 5% (w/v) skim milk in Tris-buffered
saline and Tween-20 (TBST) buffer and probed with anti-β-actin IgG
(Sigma-Aldrich) or anti-BMI1 IgG antibodies (Santa Cruz
Biotechnology, Santa Cruz, CA, USA).
Cell viability assay
The effect of γ-radiation (0.1 Gy) on viability was
determined using a 3-[4,5-dimethylthiazol- 2-yl]-2,5 diphenyl
tetrazolium bromide (MTT) assay (Sigma-Aldrich), according to the
manufacturer’s instructions. Briefly, seeded cells were irradiated
with 0.1 Gy of γ-radiation. After 6 and 24 h of additional
incubation, MTT solution was added to the irradiated cells, and the
samples were incubated for 1 h. Media was removed, and the blue
formazan crystals trapped in cells were dissolved in dimethyl
sulfoxide (DMSO, Sigma-Aldrich). Cell viability was measured using
an iMark plate reader (Bio-Rad, Hercules, CA, USA) at 590 nm with a
reference filter of 620 nm. All results are presented as the mean
percentages ± standard deviation (SD) of three independent
experiments. A p-value of <0.05, as determined by Student’s
t-test, was considered significant.
Analysis of cell cycle by flow
cytometry
Cell cycle distribution was determined using FACS
(Fluorescence Activated Cell Sorting) analysis. Irradiated cells
were fixed by the addition of cold 70% ethanol overnight. Following
fixation, cells were washed with cold PBS and then stained with
propidium iodide (PI) staining solution (50 μg/ml PI, 0.5% Triton
X-100, and 100 μg/ml RNase) at 37°C for 1 h. The PI fluorescence
intensity was detected using a BD FACSCalibur flow cytometer (BD
Biosciences, San Jose, CA, USA). The mean PI fluorescence intensity
was obtained from 10,000 cells using the FL2-H channel.
RNA purification and microarray analysis
of miRNA expression
Total RNAs were purified using TRIzol reagent (Life
Technologies) according to the manufacturer’s protocol. The purity
and integrity of the RNA sample was assessed using the ratio of
absorbance at 230, 260 and 280 nm by MaestroNano®, a
micro-volume spectrophotometer (Maestrogen, Las Vegas, NV, USA) and
Agilent 2100 Bioanalyzer® (Agilent Technologies, Santa
Clara, CA, USA). Microarray analyses were performed using SurePrint
G3 Human V16 miRNA 8×60K microarray kit (Agilent Technologies), as
previously described (29).
Briefly, 50 ng of purified RNA was treated with calf intestine
alkaline phosphatase prior to labeling with cyanine 3-cytidine
bisphosphate (3-pCp). The labeled RNA was hybridized with the
microarray kit in the Agilent Microarray Hybridization Chamber
(Agilent Technologies) for 20 h. The fluorescence intensities of
the labeled miRNA samples on the microarray were measured using
Scanner and Feature Extraction software (Agilent Technologies). The
digitalized fluorescence intensities were analyzed using GeneSpring
GX version 11.5 (Agilent Technologies). The raw data were filtered
using FLAG and t-tests and analyzed using the fold-change analysis,
which was conducted based on a factor of a 2.0-fold difference
between the two groups (i.e., non-irradiated control cells and
irradiated cells).
Target prediction and bioinformatics
analysis of miRNAs
To assess the biological significance of the altered
miRNA expression, three bioinformatic analyses were performed:
determination of putative target genes of the miRNAs using the
DIANA-microT bioinformatic software tool (http://diana.imis.athena-innovation.gr/DianaTools/index.php?r=microT_CDS/index)
(30), prediction of the
target-related cellular pathways using the Kyoto Encyclopedia of
Genes and Genomes (KEGG) pathways and DAVID (Database for
Annotation, Visualization and Interrogate Discovery, http://david.abcc.ncifcrf.gov/home.jsp)
bioinformatics resources v6.7 according to the developer’s protocol
(31), and categorization of
target genes with specific biological functions using the AmiGO
Gene Ontology (GO) analysis tool (http://amigo.geneontology.org/amigo). The prediction
of target genes was limited by setting the value of the threshold
to 0.8 in the DIANA-microT tool. The ‘KEGG_pathway’ category was
processed by setting the threshold of EASE score, a modified Fisher
Exact p-value, to 0.1, and involved KEGG pathways that displayed a
value >1% (percentage of involved target genes/total target
genes in each pathway) were selected. GO analysis was performed in
eight categories for positive or negative regulation of apoptotic
processes, cell growth, cell proliferation and cell cycle.
Results
Cell viability and cell growth changes
are not induced by 0.1 Gy γ-radiation in BMI1-knockdown NHDFs
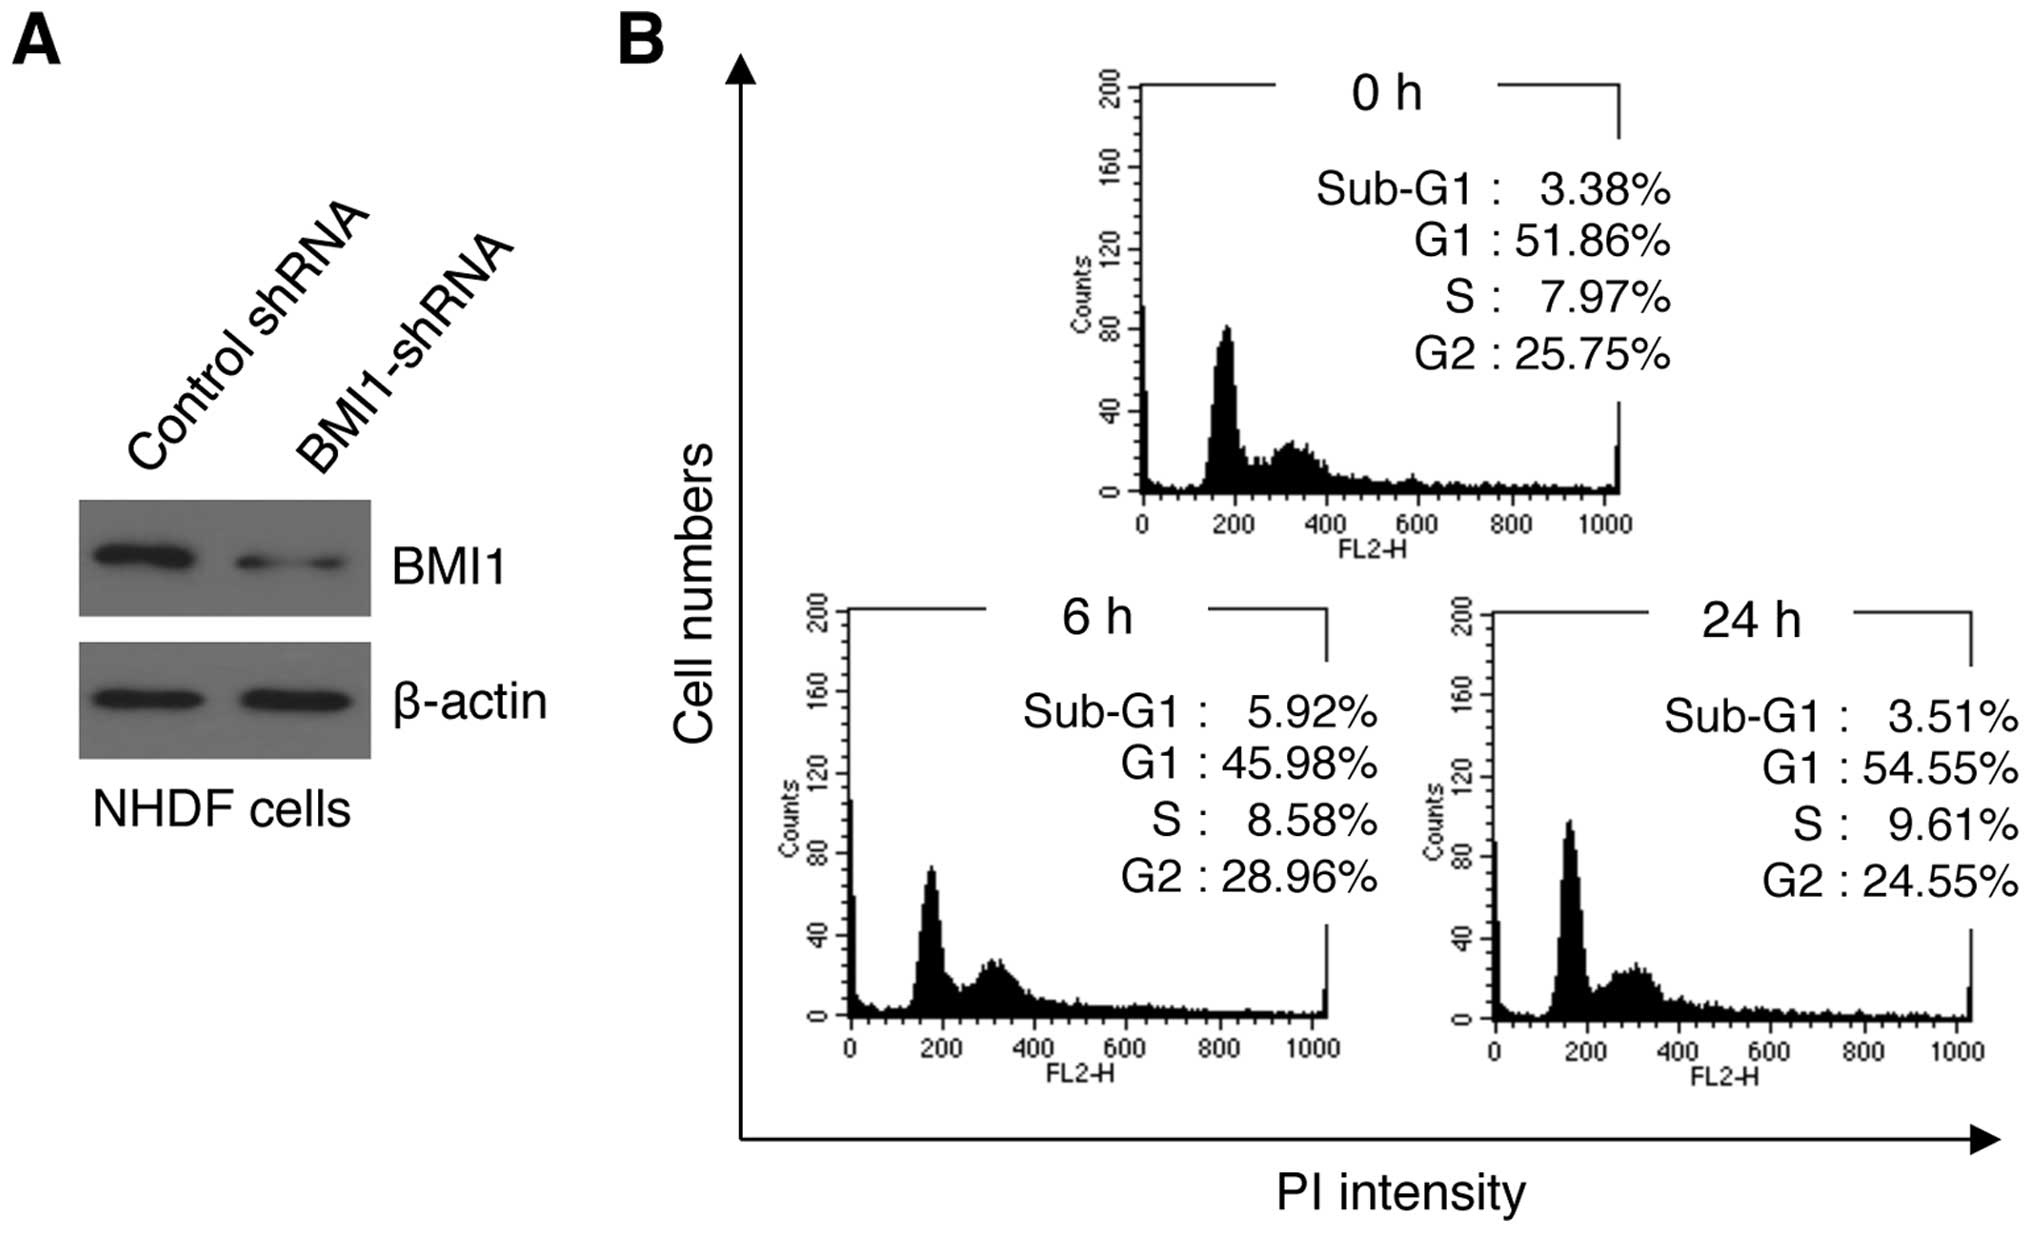
To evaluate the possible effect of BMI1 in
resistance to LDR, we first generated BMI1 shRNA- or control
shRNA-expressing NHDFs using a lentiviral system. After infection,
the cells were treated with selection marker (puromycin) to obtain
stable clones. The BMI1 protein level was clearly reduced in
shBMI1-expressing clones, thereby confirming efficient knockdown
(Fig. 1A). Using these stable
clones, we then examined alterations in cell viability at 6 and 24
h after irradiation with 0.1 Gy of γ-radiation. Unexpectedly, no
significant changes in cell viability were detected (data not
shown), indicating that BMI1 may not be an essential regulator of
LDR resistance in NHDFs. We next performed PI staining-based cell
cycle analysis following irradiation. The cell cycle patterns of
the irradiated cells at 6 and 24 h after irradiation were not
significantly different from that of control cells (Fig. 1B). Although the proportion of cells
in G1 and G2/M phase were slightly changed after 6 h by 5.88 and
−3.21%, respectively, these values returned to baseline (0 h) at 24
h post-irradiation. Therefore, these results suggest that cells
were only slightly sensitive to LDR even in the absence of BMI1
expression in NHDFs.
Altered miRNA expression profiles in
BMI1-knockdown NHDF in response to LDR
Although our results (Fig. 1) suggest a dispensable role for
BMI1 in radioresistance to LDR, these studies did not fully exclude
the possibility that such a modest radiosensitivity was caused by
alteration of cellular pathways in BMI1-knockdown NHDFs. Recent
evidence supports the role of BMI1 as a transcription factor
engaged in cell proliferation, cell cycle, cell immortalization,
chemoresistance and radioresistance (1–4,12).
Notably, numerous cDNA microarray studies have sought to identify
BMI1 target genes (14,32,33);
however, miRNA microarray-based analysis of BMI1 putative target
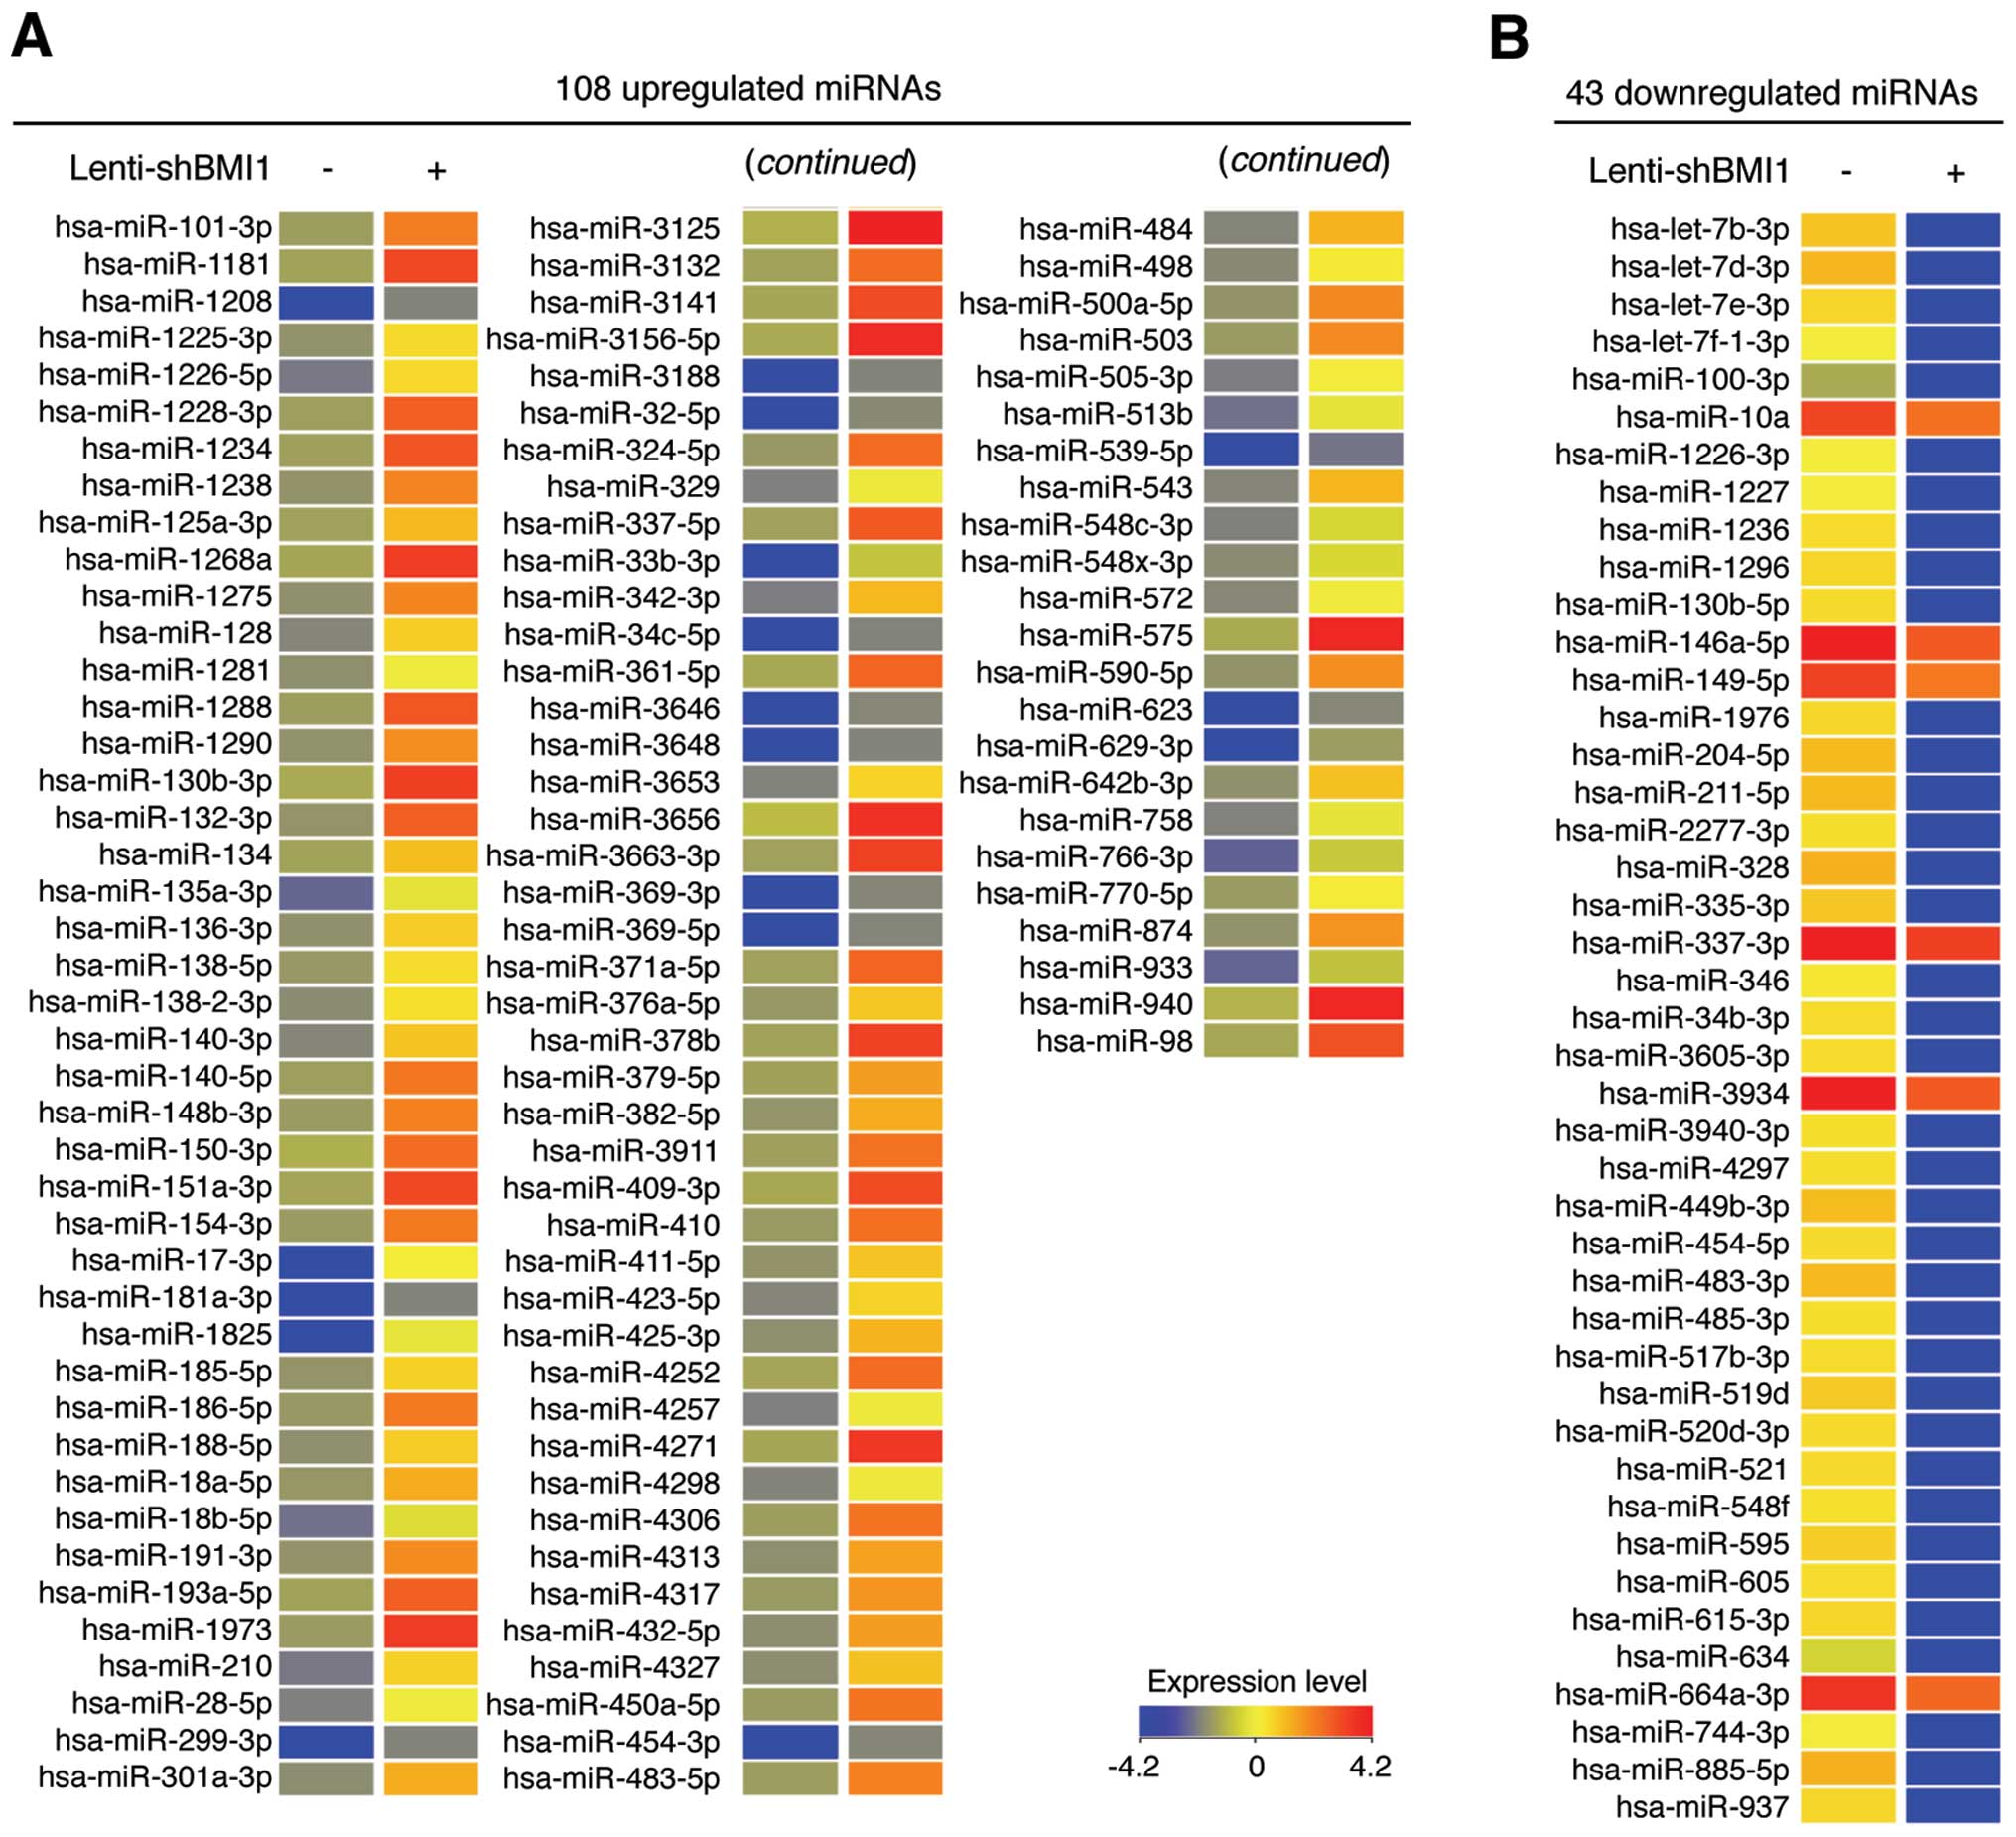
miRNAs has not yet been described. We first compared the miRNA
expression profiles between control and BMI1-knockdown NHDFs not
exposed to LDR. As shown in Fig.
2, 108 and 43 miRNAs are up- and downregulated more than
2-fold, respectively, in BMI1- knockdown NHDFs compared to control
cells, indicating that BMI1 regulates the expression of specific
miRNAs. Notably, expression levels of miR-17-3p, miR-1825 and
miR-33b-3p were significantly increased by 81.71-, 61.18- and
30.62-fold, respectively, while expression levels of miR-328,
miR-885-5p and let-7d-3p were significantly downregulated by
23.53-, 23.12- and 21.69-fold, respectively.
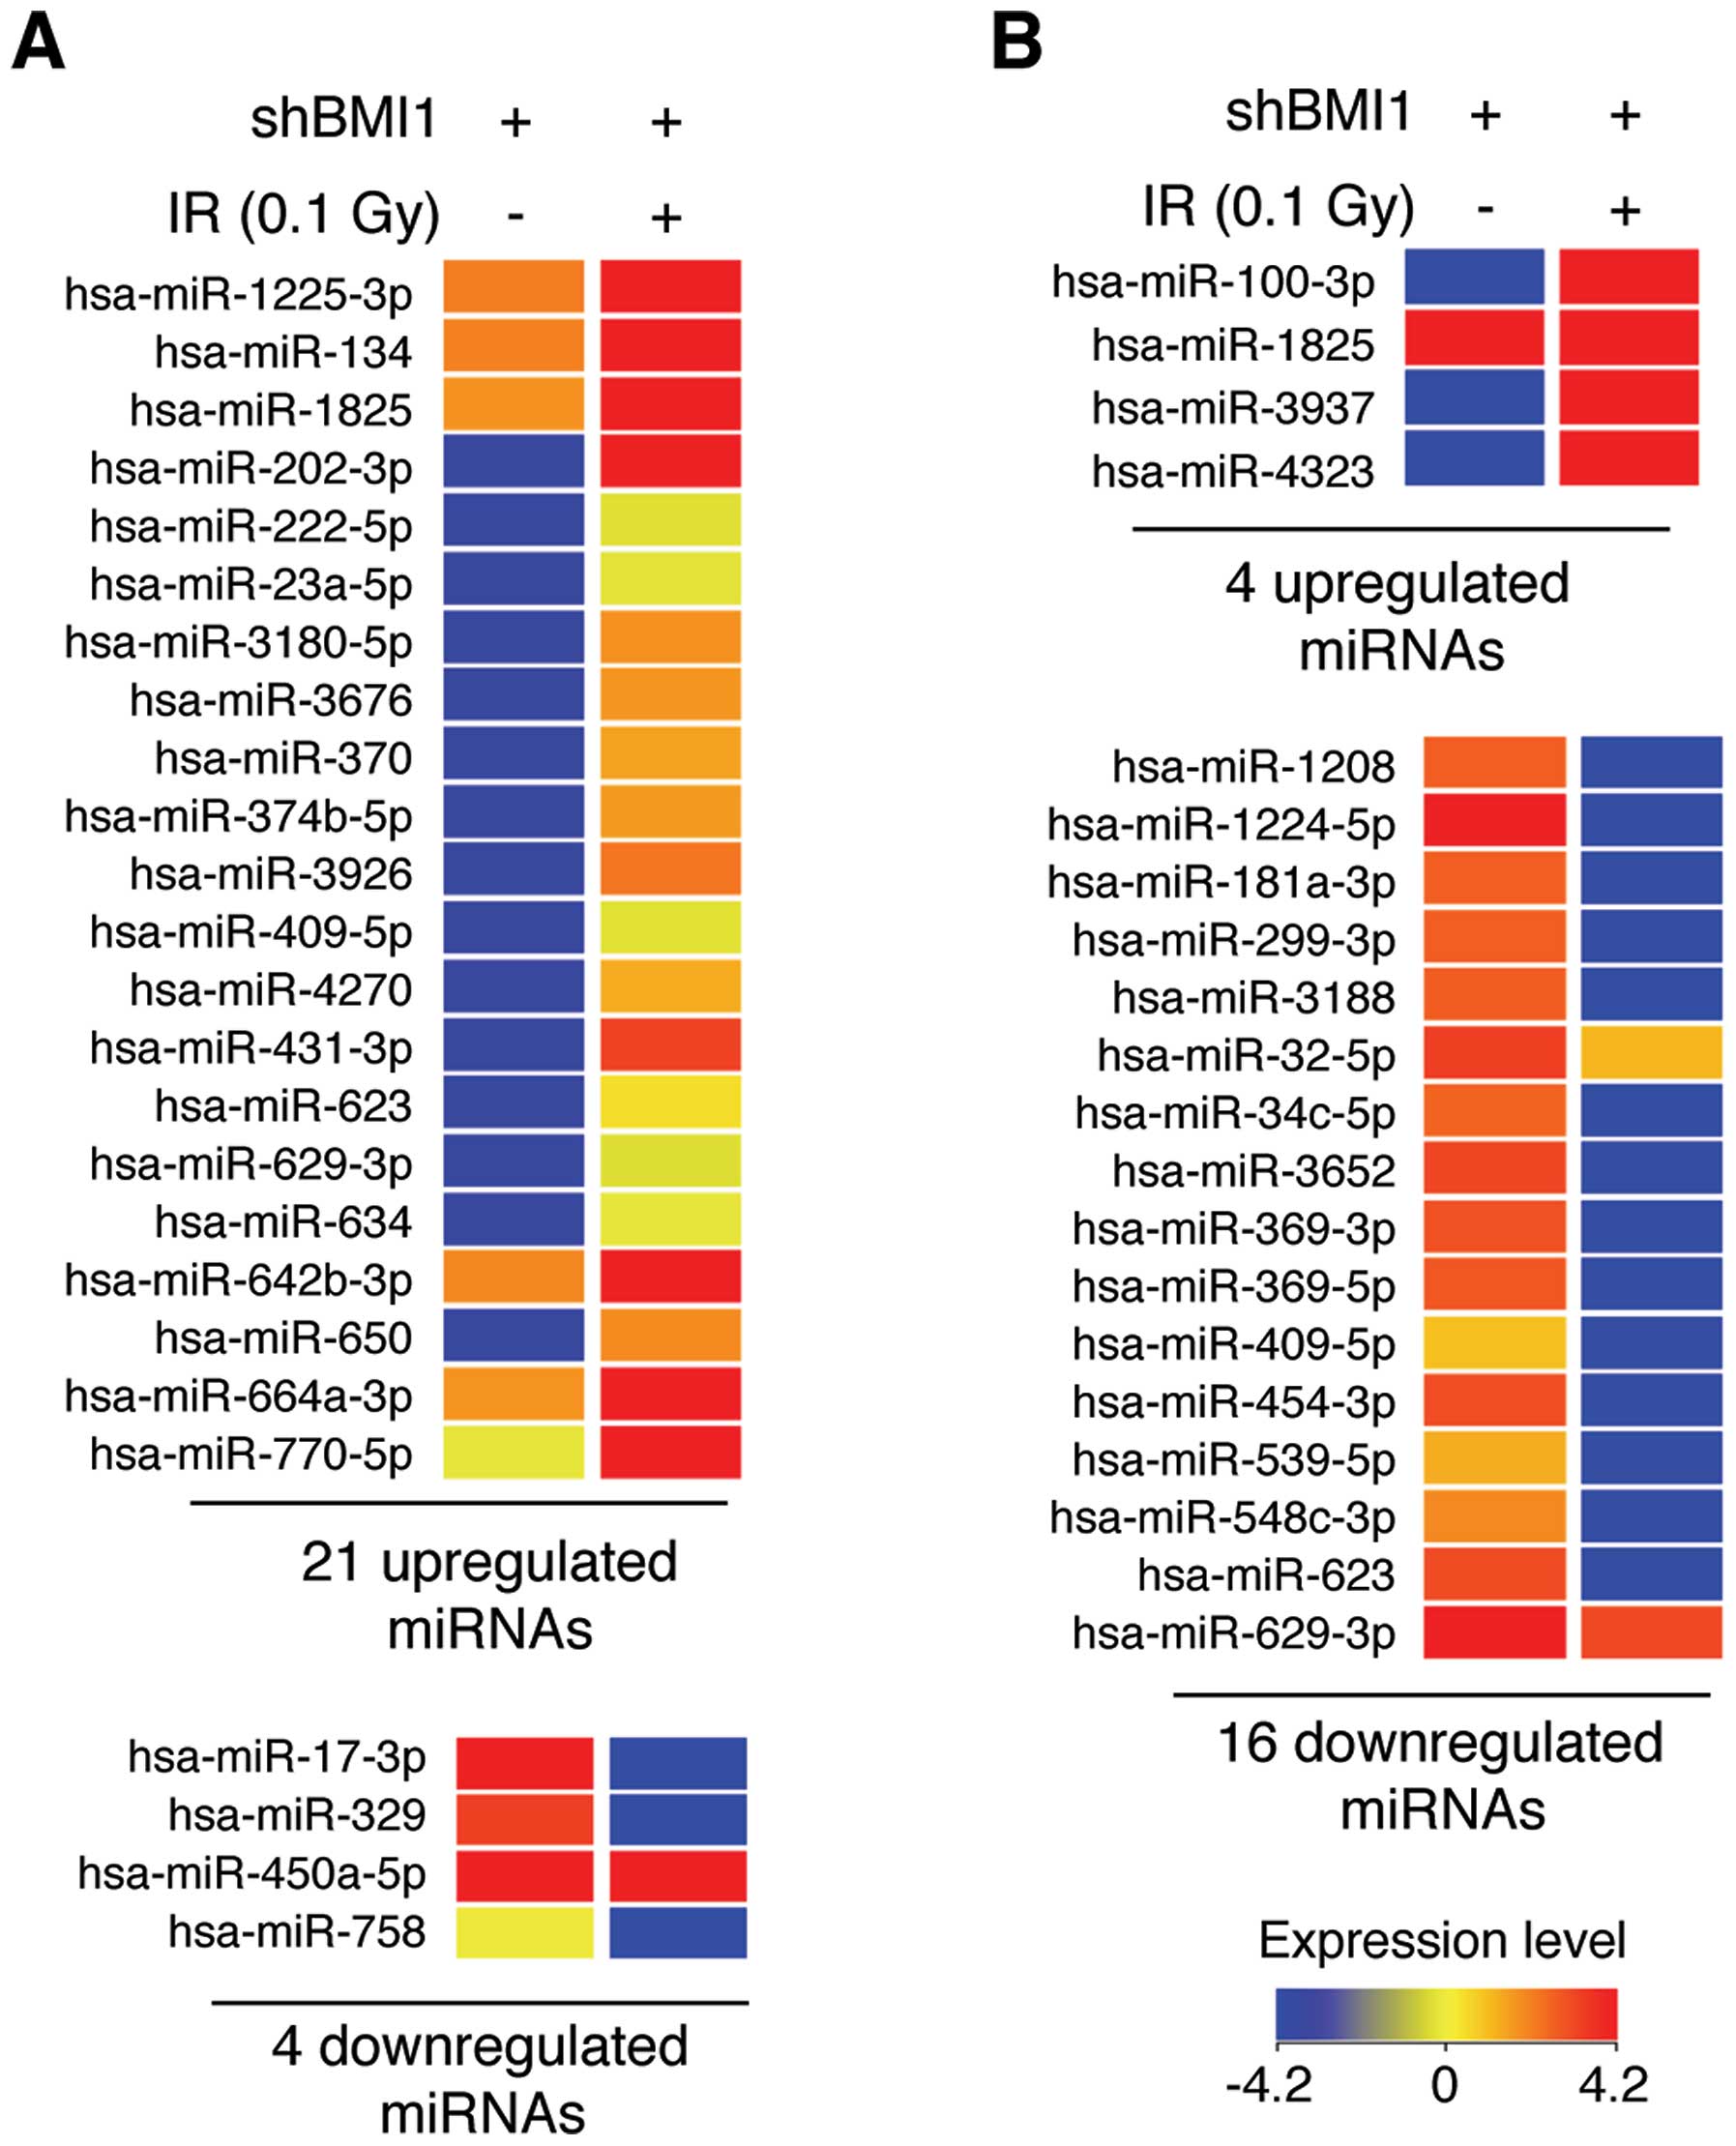
Next, we analyzed the LDR-induced alterations in
miRNA expression profiles in BMI1-knockdown NHDFs. At 6 and 24 h
after irradiation with 0.1 Gy of γ-radiation, total RNA was
purified, and then miRNA microarray assays were performed. Although
LDR induced minimal changes in cell viability and cell cycle
distribution in BMI1-knockdown NHDFs (Fig. 1), we unexpectedly found that the
expression of numerous miRNAs was altered more than 2-fold in the
irradiated BMI1-knockdown NHDFs (Fig.
3). Specifically, LDR upregulated 21 specific miRNAs and
downregulated 4 miRNAs at the 6-h time point in BMI1-knockdown
NHDFs (Fig. 3A). Also, 4 and 16
miRNAs were significantly upregulated and downregulated,
respectively, by LDR at 24 h after irradiation (Fig. 3B). The full data are shown in
Tables I and II. Among these miRNAs, miR-202-3p and
miR-4323 were the most upregulated miRNAs by 81.90- and 66.47-fold
at 6 and 24 h after irradiation, respectively, and miR-758 and
miR-1224-5p were the most downregulated miRNAs (21.20- and
106.85-fold, respectively) (Tables
I and II). Overall, these
data suggest that BMI1 altered miRNA expression in response to
LDR.
 | Table IThe miRNAs that exhibited significant
changes in expression in BMI1-knockdown NHDF cells 6 h after
irradiation with low-dose radiation (0.1 Gy).a |
Table I
The miRNAs that exhibited significant
changes in expression in BMI1-knockdown NHDF cells 6 h after
irradiation with low-dose radiation (0.1 Gy).a
| Gene name | Fold change | Direction | Chr. |
|---|
|
hsa-miR-1225-3p | 2.2 | Up | chr16 |
| hsa-miR-134 | 2.0 | Up | chr14 |
| hsa-miR-1825 | 2.0 | Up | chr20 |
| hsa-miR-202-3p | 81.9 | Up | chr10 |
| hsa-miR-222-5p | 18.8 | Up | chrX |
| hsa-miR-23a-5p | 20.3 | Up | chr19 |
|
hsa-miR-3180-5p | 39.4 | Up | chr16 |
| hsa-miR-3676 | 38.5 | Up | chr17 |
| hsa-miR-370 | 36.8 | Up | chr14 |
|
hsa-miR-374b-5p | 38.1 | Up | chrX |
| hsa-miR-3926 | 44.1 | Up | chr8 |
| hsa-miR-409-5p | 19.6 | Up | chr14 |
| hsa-miR-4270 | 35.6 | Up | chr3 |
| hsa-miR-431-3p | 54.8 | Up | chr14 |
| hsa-miR-623 | 29.0 | Up | chr13 |
| hsa-miR-629-3p | 18.4 | Up | chr15 |
| hsa-miR-634 | 21.6 | Up | chr17 |
|
hsa-miR-642b-3p | 2.2 | Up | chr19 |
| hsa-miR-650 | 40.2 | Up | chr22 |
|
hsa-miR-664a-3p | 2.2 | Up | chr1 |
| hsa-miR-770-5p | 3.2 | Up | chr14 |
| hsa-miR-17-3p | −46.9 | Down | chr13 |
| hsa-miR-329 | −38.4 | Down | chr14 |
|
hsa-miR-450a-5p | −2.1 | Down | chrX |
| hsa-miR-758 | −21.2 | Down | chr14 |
| Table IIThe miRNAs that exhibited significant
changes in BMI1-knockdown cells 24 h after irradiation with
low-dose radiation (0.1 Gy).a |
Table II
The miRNAs that exhibited significant
changes in BMI1-knockdown cells 24 h after irradiation with
low-dose radiation (0.1 Gy).a
| Gene name | Fold change | Direction | Chr. |
|---|
| hsa-miR-100-3p | 30.5 | Up | chr11 |
| hsa-miR-1825 | 2.2 | Up | chr20 |
| hsa-miR-3937 | 56.9 | Up | chrX |
| hsa-miR-4323 | 66.5 | Up | chr19 |
| hsa-miR-1208 | −47.2 | Down | chr8 |
|
hsa-miR-1224-5p | −106.9 | Down | chr3 |
|
hsa-miR-181a-3p | −46.8 | Down | chr1 |
| hsa-miR-299-3p | −47.4 | Down | chr14 |
| hsa-miR-3188 | −47.6 | Down | chr19 |
| hsa-miR-32-5p | −2.1 | Down | chr9 |
| hsa-miR-34c-5p | −45.5 | Down | chr11 |
| hsa-miR-3652 | −55.7 | Down | chr12 |
| hsa-miR-369-3p | −51.6 | Down | chr14 |
| hsa-miR-369-5p | −49.3 | Down | chr14 |
| hsa-miR-409-5p | −26.1 | Down | chr14 |
| hsa-miR-454-3p | −52.7 | Down | chr17 |
| hsa-miR-539-5p | −29.3 | Down | chr14 |
|
hsa-miR-548c-3p | −36.0 | Down | chr12 |
| hsa-miR-623 | −54.0 | Down | chr13 |
| hsa-miR-629-3p | −2.2 | Down | chr15 |
Specific miRNA expression signatures were
found for LDR and BMI1 knockdown in NHDF cells
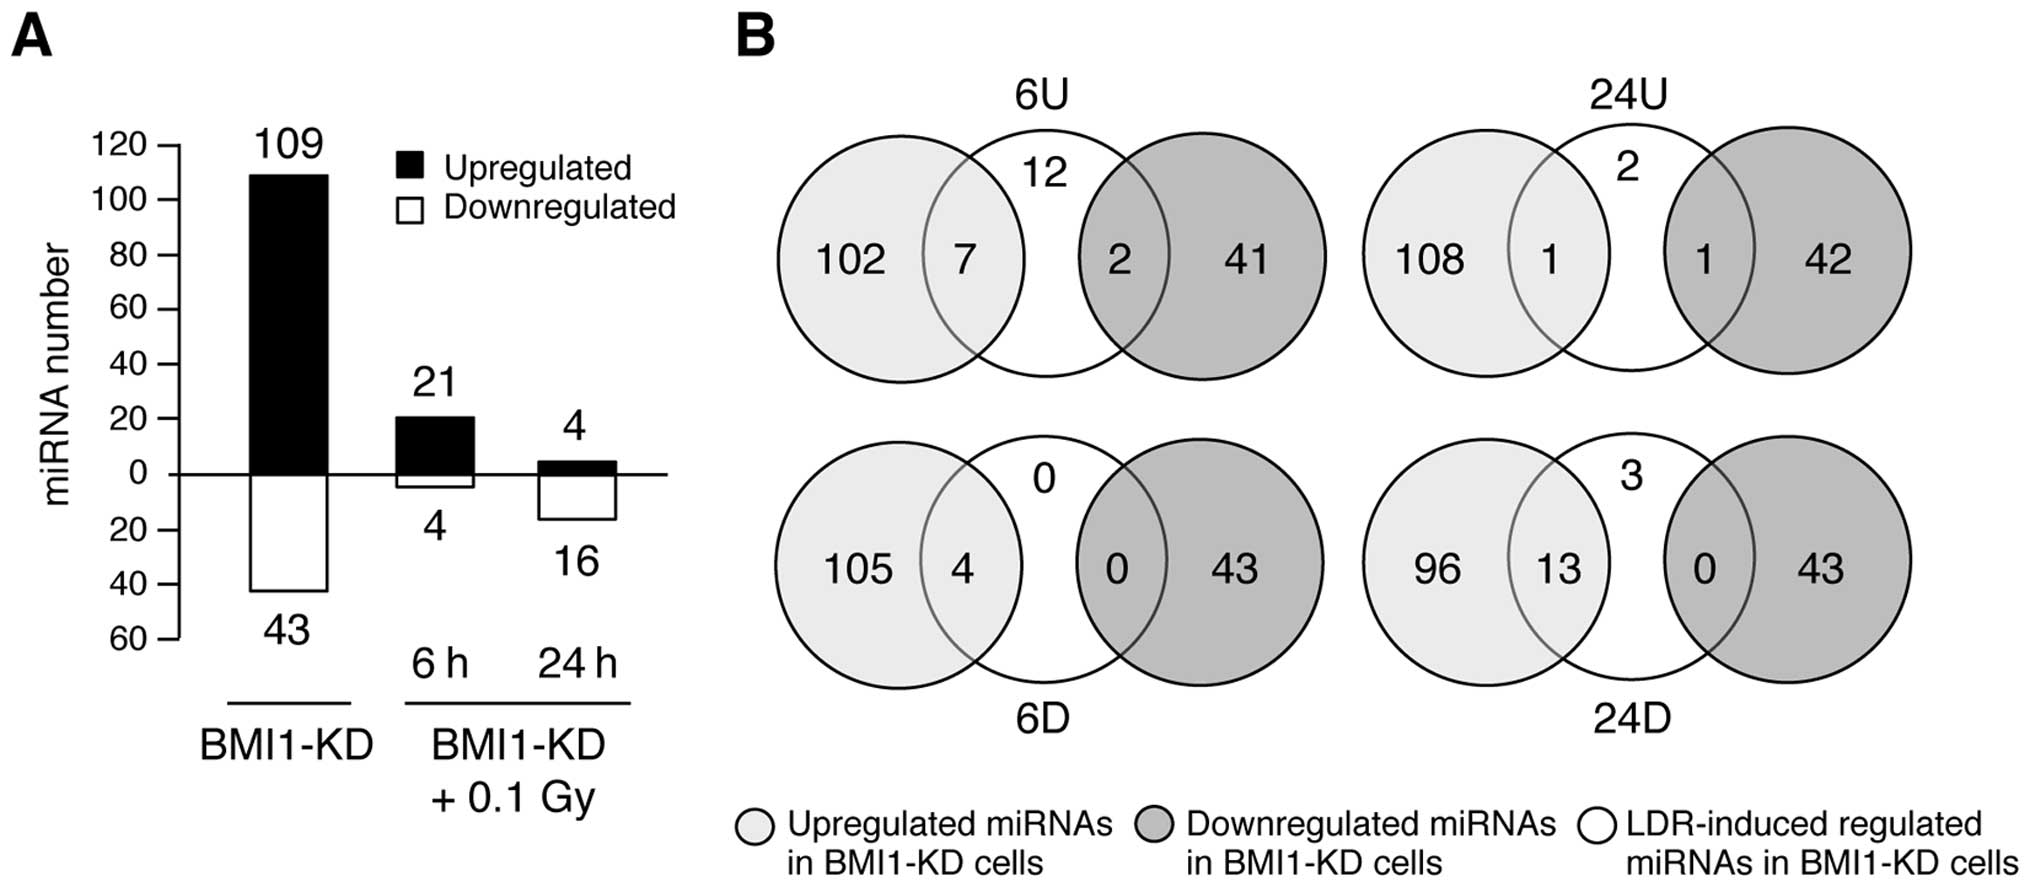
In total, we found 108 upregulated and 43
downregulated miRNAs in BMI1- knockdown NHDFs and 21 upregulated
and 4 downregulated miRNAs in BMI1-knockdown cells 6 h
post-irradiation. In addition, 4 and 16 miRNAs were upregulated and
downregulated, respectively, in these cells 24 h post-irradiation
(Fig. 4A). Seven miRNAs were
upregulated in both BMI1-knockdown cells and in cells 6 h
post-irradiation (Fig. 4B, upper
left). In particular, 2 of the 21 miRNAs were found to be
differentially expressed in either BMI1-knockdown cells or in BMI1-
knockdown cells 6 h post-irradiation (Fig. 4B, upper left). These results also
indicated that 2 upregulated miRNAs were specific to BMI1-knockdown
NHDFs at 6 h post-irradiation (Fig.
4B, upper left). Interestingly, no downregulated miRNAs were
specific to the profile of these cells at 6 h post-irradiation
(Fig. 4B, lower left). Similarly,
the differentially expressed miRNAs in BMI1-knockdown NHDFs at 24 h
post-irradiation were also shared, in part, with BMI
knockdown-induced miRNA alterations (Fig. 4B, upper and lower right). The group
of differentially expressed miRNAs in BMI1-knockdown NHDFs and the
miRNAs upregulated in BMI1-knockdown NHDFs 24 h post-irradiation
had 2 miRNAs in common, and thus, only a subset of 150 and 2 miRNAs
were unique to each group, respectively (Fig. 4B, upper). Furthermore, the sets of
altered miRNAs in BMI1-knockdown NHDFs 24 h post-irradiation and
BMI1-knockdown NHDFs also had 13 miRNAs in common, and only a
subset of 3 and 139 miRNAs were unique to each group, respectively
(Fig. 4, lower). Overall, these
results indicate that knockdown of LDR and BMI1 affects both unique
and shared miRNAs in NHDFs.
Bioinformatics analysis of altered miRNAs
from BMI1-knockdown NHDF in response to LDR
We next examined the biological influence of the
observed altered miRNAs. Because biological functions of miRNAs are
mainly determined by the regulation of their specific target mRNAs,
the putative target of each miRNA was first predicted using the
DIANA-microT-CDS (v5.0) web-based bioinformatics tool. The
prediction threshold, which is a cut-off value for presented
prediction and ranges from 0.3 to 1.0, was fixed at 0.8. Following
prediction, a Gene Ontology and KEGG pathway annotation of the
miRNA targets were performed using the AmiGO and DAVID
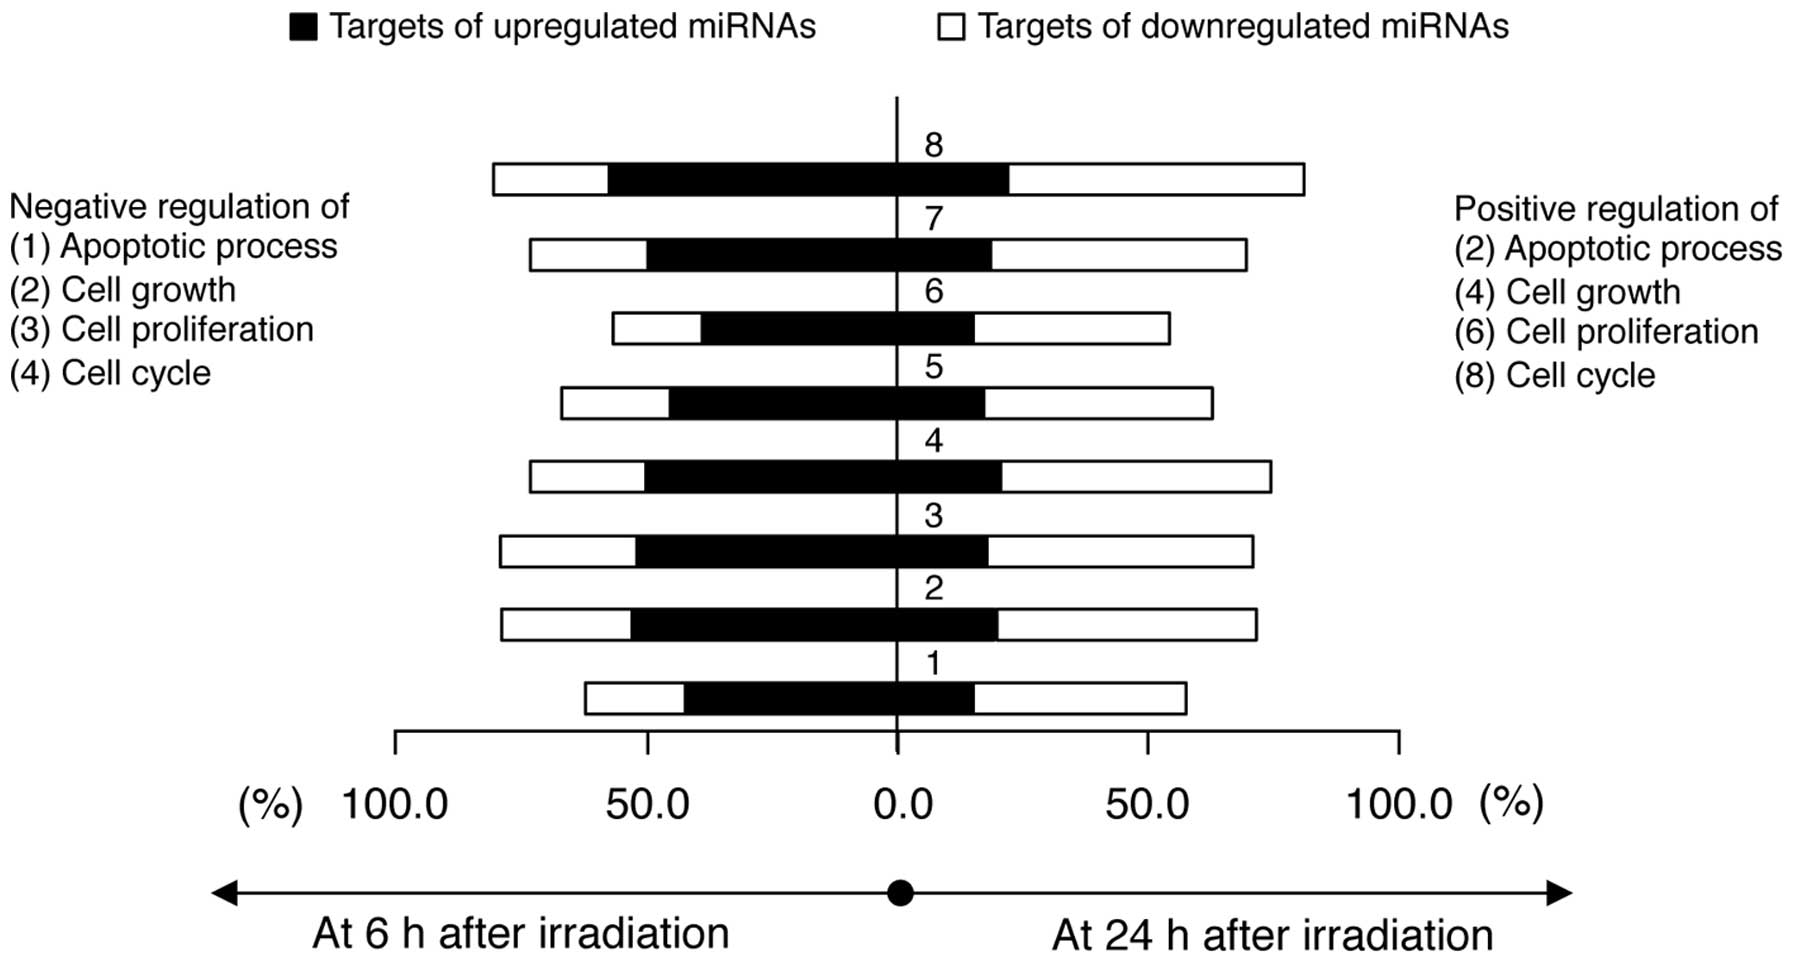
bioinformatics tools. Using AmiGO, we categorized the target genes
into eight types according to biological function: positive and
negative regulation of the apoptotic process, cell growth, cell
proliferation and cell cycle. The target genes for the miRNAs that
were upregulated in BMI1-knockdown NHDFs at 6 h post-irradiation
(written as ‘6PB-NHDFs’) are involved in both positive and negative
regulation of the four biological functions. Similarly, the target
genes for the altered miRNAs in the BMI1-knockdown NHDFs at 24 h
post-irradiation (written as ‘24PB-NHDFs’) are also involved in
both positive and negative regulation of the four biological
functions (Fig. 5). Interestingly,
the targets of the upregulated miRNAs in 6BP-NHDFs are largely
involved in these processes; however, the targets of the
downregulated miRNAs in 24BP-NHDFs are largely involved in these
processes. These results indicate that the miRNA-mediated LDR
response is functionally engaged with both positive and negative
biological processes.
A KEGG pathway annotation of the miRNA targets was
then performed based on scoring of the pathways collected in the
KEGG databases using the DAVID tool. The EASE Score, which is a
modified Fisher Extract p-value, was fixed at 0.1, and meaningful
KEGG pathways showing a value >1% (percentage of involved target
genes/total genes involved in each pathway) were selected. From
these analytic processes, unique and shared pathways were found to
be involved with either the 6BP- or 242BP-NHDFs. Axon guidance,
cell adhesion molecules, MAPK signaling pathway, and pathways
involved in cancer were the main overrepresented pathways in the
targets of the upregulated miRNAs in 6BP-NHDFs (Table III), whereas, Wnt, mTOR, MAPK and
ErbB signaling pathways were common in the targets of the
downregulated miRNAs in 6BP-NHDFs (Table IV), suggesting that these pathways
are significantly regulated after 6 h of post-irradiation with LDR.
The full lists for the identified pathways are presented in
Tables III and IV. We also found that the Wnt, MAPK and
ErbB signaling pathways were unique specific to several upregulated
miRNAs in 24BP-NHDFs (Table V);
however, these pathways were mostly shared involving the targets of
the downregulated miRNAs in 24BP-NHDFs (Table VI). Overall, the results of the
pathway analysis demonstrate possible roles for the differentially
expressed miRNAs in the LDR response.
| Table IIIFunctional annotation chart for
miRNAs that were upregulated in BMI1-knockdown NHDF cells 6 h after
irradiation with 0.1 Gy radiation. |
Table III
Functional annotation chart for
miRNAs that were upregulated in BMI1-knockdown NHDF cells 6 h after
irradiation with 0.1 Gy radiation.
| miRNA (Homo
sapiens) | Putative target
genes | KEGG pathway | Genes involved in
the pathway | % of involved
genes/total genes | p-value |
|---|
| miR-1225-3p | 183 | MAPK signaling
pathway | 7 | 3.8 | 6.20E-02 |
| miR-134 | 245 | Chemokine signaling
pathway | 7 | 2.9 | 1.70E-02 |
| | Jak-STAT signaling
pathway | 6 | 2.4 | 2.90E-02 |
| | ECM-receptor
interaction | 4 | 1.6 | 6.70E-02 |
| miR-1825 | 321 | Pathways in
cancer | 9 | 2.8 | 6.90E-02 |
| | MAPK signaling
pathway | 8 | 2.5 | 6.40E-02 |
| miR-202-3p | 223 | Axon guidance | 5 | 2.2 | 7.80E-02 |
| miR-222-5p | 32 | - | - | - | - |
| miR-23a-5p | 99 | - | - | - | - |
| miR-3180-5p | 489 | Axon guidance | 9 | 1.8 | 8.80E-03 |
| | Cell adhesion
molecules | 7 | 1.4 | 8.00E-02 |
| miR-3676 | 7 | - | - | - | - |
| miR-370 | 199 | Pathways in
cancer | 7 | 3.5 | 5.60E-02 |
| | VEGF signaling
pathway | 4 | 2 | 2.50E-02 |
| miR-374b-5p | 867 | Pathways in
cancer | 31 | 3.6 | 2.00E-04 |
| | MAPK signaling
pathway | 22 | 2.5 | 1.10E-02 |
| | Wnt signaling
pathway | 15 | 1.7 | 9.50E-03 |
| | TGF-β signaling
pathway | 11 | 1.3 | 6.40E-03 |
| miR-3926 | 400 | Pathways in
cancer | 12 | 3 | 5.00E-02 |
| | Huntington’s
disease | 8 | 2 | 5.80E-02 |
| miR-409-5p | 34 | MAPK signaling
pathway | 3 | 8.8 | 6.20E-02 |
| miR-4270 | 423 | Axon guidance | 8 | 1.9 | 5.50E-03 |
| | Insulin signaling
pathway | 6 | 1.4 | 7.40E-02 |
| miR-431-3p | 2 | - | - | - | - |
| miR-623 | 26 | - | - | - | - |
| miR-629-3p | 441 | PPAR signaling
pathway | 6 | 1.4 | 1.20E-02 |
| | Oocyte meiosis | 6 | 1.4 | 6.90E-02 |
| | Riboflavin
metabolism | 3 | 0.7 | 4.00E-02 |
| miR-634 | 207 | GnRH signaling
pathway | 5 | 2.4 | 4.10E-02 |
| | Long-term
potentiation | 4 | 1.9 | 6.20E-02 |
| miR-642b-3p | 272 | Cell adhesion
molecules | 5 | 1.8 | 5.70E-02 |
| miR-650 | 266 | Cell adhesion
molecules | 6 | 2.3 | 2.90E-02 |
| | Glycerophospholipid
metabolism | 4 | 1.5 | 6.00E-02 |
| miR-664a-3p | 1,109 | Regulation of actin
cytoskeleton | 20 | 1.8 | 2.10E-02 |
| | Apoptosis | 9 | 0.8 | 9.40E-02 |
| | mTOR signaling
pathway | 7 | 0.6 | 5.80E-02 |
| miR-770-5p | 257 | Neurotrophin
signaling pathway | 7 | 2.7 | 3.80E-03 |
| Table IVFunctional annotation chart for
miRNAs that were downregulated in BMI1-knockdown NHDF cells 6 h
after irradiation with 0.1 Gy. |
Table IV
Functional annotation chart for
miRNAs that were downregulated in BMI1-knockdown NHDF cells 6 h
after irradiation with 0.1 Gy.
| miRNA (Homo
sapiens) | Putative target
genes | KEGG pathway | Genes involved in
the pathway | % of involved
genes/total genes | p-value |
|---|
| miR-17-3p | 307 | MAPK signaling
pathway | 10 | 3.3 | 1.3E-2 |
| | Pathways in
cancer | 9 | 2.9 | 9.6E-2 |
| | Insulin signaling
pathway | 7 | 2.9 | 1.2E-2 |
| | mTOR signaling
pathway | 6 | 2.0 | 8.2E-4 |
| | VEGF signaling
pathway | 4 | 1.3 | 9.2E-2 |
| miR-329 | 706 | Pathways in
cancer | 25 | 3.5 | 5.60E-04 |
| | MAPK signaling
pathway | 21 | 3 | 1.20E-03 |
| | Insulin signaling
pathway | 14 | 2 | 9.80E-04 |
| | Wnt signaling
pathway | 13 | 1.8 | 7.50E-03 |
| | ErbB signaling
pathway | 9 | 1.3 | 1.20E-02 |
| | Cell cycle | 9 | 1.3 | 7.80E-02 |
| miR-450a-5p | 21 | - | - | - | - |
| miR-758 | 375 | Pathways in
cancer | 15 | 4 | 3.40E-03 |
| | Insulin signaling
pathway | 8 | 2.1 | 1.40E-02 |
| | Colorectal
cancer | 7 | 1.9 | 5.10E-03 |
| | Wnt signaling
pathway | 7 | 1.9 | 6.70E-02 |
| | ECM-receptor
interaction | 5 | 1.3 | 7.60E-02 |
| | ErbB signaling
pathway | 5 | 1.3 | 8.40E-02 |
| | Prostate
cancer | 5 | 1.3 | 8.90E-02 |
| | Endometrial
cancer | 4 | 1.1 | 7.60E-02 |
| | mTOR signaling
pathway | 4 | 1.1 | 7.60E-02 |
| Table VFunctional annotation chart for
miRNAs that were upregulated in BMI1-knockdown NHDF cells 24 h
after irradiation with 0.1 Gy radiation. |
Table V
Functional annotation chart for
miRNAs that were upregulated in BMI1-knockdown NHDF cells 24 h
after irradiation with 0.1 Gy radiation.
| miRNA (Homo
sapiens) | Putative target
genes | KEGG pathway | Genes involved in
the pathway | % of involved
genes/total genes | p-value |
|---|
| miR-100-3p | 187 | Pathways in
cancer | 7 | 3.7 | 1.50E-02 |
| | Cell cycle | 5 | 2.7 | 7.30E-03 |
| | Wnt signaling
pathway | 4 | 2.1 | 6.80E-02 |
| miR-1825 | 390 | Pathways in
cancer | 13 | 3.3 | 1.30E-02 |
| | MAPK signaling
pathway | 10 | 2.6 | 4.80E-02 |
| | Arrhythmogenic
right ventricular cardiomyopathy | 6 | 1.5 | 1.10E-02 |
| miR-3937 | 27 | - | - | - | - |
| miR-4323 | 187 | Axon guidance | 5 | 2.7 | 3.70E-02 |
| | ErbB signaling
pathway | 4 | 2.1 | 5.30E-02 |
| | GnRH signaling
pathway | 4 | 2.1 | 7.10E-02 |
| Table VIFunctional annotation chart for
miRNAs that were downregulated in BMI1-knockdown NHDF cells 24 h
after irradiation with 0.1 Gy radiation. |
Table VI
Functional annotation chart for
miRNAs that were downregulated in BMI1-knockdown NHDF cells 24 h
after irradiation with 0.1 Gy radiation.
| miRNA (Homo
sapiens) | Putative target
genes | KEGG pathway | Genes involved in
the pathway | % of involved
genes/total genes | p-value |
|---|
| miR-1208 | 516 | MAPK signaling
pathway | 13 | 2.5 | 5.70E-02 |
| | Wnt signaling
pathway | 10 | 1.9 | 2.10E-02 |
| | ErbB signaling
pathway | 8 | 1.6 | 8.90E-03 |
| | TGF-β signaling
pathway | 8 | 1.6 | 8.90E-03 |
| | mTOR signaling
pathway | 6 | 1.2 | 1.30E-02 |
| | VEGF signaling
pathway | 6 | 1.2 | 5.20E-02 |
| miR-1224-5p | 263 | Axon guidance | 5 | 1.9 | 5.00E-02 |
| miR-181a-3p | 1 | - | - | - | - |
| miR-299-3p | 238 | Purine
metabolism | 5 | 2.1 | 6.20E-02 |
| miR-3188 | 266 | Tight junction | 6 | 2.3 | 4.70E-02 |
| miR-32-5p | 774 | Focal adhesion | 16 | 2.1 | 1.90E-03 |
| miR-34c-5p | 412 | Adherens
junction | 9 | 2.2 | 1.70E-04 |
| | Cell cycle | 7 | 1.7 | 4.50E-02 |
| | Wnt signaling
pathway | 7 | 1.7 | 9.40E-02 |
| miR-3652 | 250 | ErbB signaling
pathway | 5 | 2 | 2.60E-02 |
| | Insulin signaling
pathway | 5 | 2 | 9.70E-02 |
| miR-369-3p | 1,171 | Pathways in
cancer | 34 | 2.9 | 1.10E-03 |
| | MAPK signaling
pathway | 23 | 2 | 5.80E-02 |
| | Jak-STAT signaling
pathway | 16 | 1.4 | 3.40E-02 |
| | TGF-β signaling
pathway | 15 | 1.3 | 4.10E-04 |
| | ErbB signaling
pathway | 12 | 1 | 1.10E-02 |
| miR-369-5p | 2 | - | - | - | - |
| miR-409-5p | 42 | - | - | - | - |
| miR-454-3p | 546 | Endocytosis | 16 | 2.9 | 2.80E-04 |
| | TGF-β signaling
pathway | 7 | 1.3 | 4.10E-02 |
| | mTOR signaling
pathway | 5 | 0.9 | 6.50E-02 |
| | Inositol phosphate
metabolism | 5 | 0.9 | 7.20E-02 |
| miR-539-5p | 632 | Regulation of actin
cytoskeleton | 12 | 1.9 | 7.50E-02 |
| miR-548c-3p | 1,065 | Pathways in
cancer | 38 | 3.6 | 1.60E-05 |
| | MAPK signaling
pathway | 24 | 2.3 | 2.10E-02 |
| | Wnt signaling
pathway | 22 | 2.1 | 6.60E-05 |
| | Cell cycle | 14 | 1.3 | 1.90E-02 |
| | Ubiquitin mediated
proteolysis | 14 | 1.3 | 3.70E-02 |
| | p53 signaling
pathway | 11 | 1 | 3.70E-03 |
| | ErbB signaling
pathway | 11 | 1 | 2.00E-02 |
| | TGF-β signaling
pathway | 11 | 1 | 2.00E-02 |
| miR-623 | 30 | - | - | - | - |
| miR-629-3p | 563 | PPAR signaling
pathway | 6 | 1.1 | 3.20E-02 |
Discussion
We have uncovered a new role for BMI1 and miRNAs in
the LDR response. BMI1 is a well-known factor involved in
radioresistance (11–13), and therefore, we hypothesized that
ablation of BMI1 induces radiosensitivity even at a low dose (0.1
Gy of γ-radiation). Our data, however, unexpectedly revealed that
cells stably expressing shBMI1 do not exhibit high sensitivity to
irradiation. Unchanged cell viability and cell cycle distribution
were observed in BMI1-knockdown cells following exposure to 0.1 Gy
of radiation, suggesting that BMI1 plays a nonessential role in
these specific cellular phenotypes in response to LDR. Previous
reports, which demonstrated BMI1-mediated radioresistance, examined
its effectiveness at relatively high doses (≥1 Gy). Facchino et
al demonstrated that BMI1 overexpression confers
radioresistance in normal and cancerous neural stem cells following
3 Gy irradiation (11). Liu et
al used a series of radiation doses (1 to 20 Gy) to demonstrate
that BMI1 promotes radioresistance in the MCF-7 breast cancer cell
line (12). Furthermore, Chagraoui
et al showed that radiation sensitivity is increased in
Bmi1-knockout mice after irradiation with 2 Gy of
γ-radiation (13). Therefore, the
role of BMI1 in LDR response was previously unexplored. Our data,
however, indicate that the role of BMI1 in response to high-dose
radiation is different than its role in response to LDR.
Generally, the cellular and physiological effects of
LDR are controversial, and three hypotheses have been provided to
explain these LDR effects (34,35).
Our data do not support the LNT model, but do not refute the
threshold model or the hormesis model (also known as adaptive
response model). Because a modest sensitivity to LDR is still
generated in the absence of radioresistance-inducing BMI1, the LNT
hypothesis, which indicates that the cytotoxic effects of high-dose
irradiation applies to LDR, is not reflected in our study. Rather,
our results suggest that cells may have a threshold against LDR
(threshold model); however, additional data from our miRNA
expression analysis has some divergence from the threshold models.
Although we found no meaningful alterations in cell viability or
cell cycle arrest in response to irradiation even in the absence of
BMI1, these results do not directly indicate that LDR does not
affect cells.
Instead, our data indicate that LDR influences miRNA
expression profiles. Our time course miRNA microarray analyses
clearly show that numerous miRNAs are differentially expressed
after exposure to 0.1 Gy of γ-radiation, despite the lack of change
in cell viability and cell cycle distribution under the same
experimental conditions. Moreover, 32 of these miRNAs were
differentially expressed more than 20-fold after irradiation,
indicating that the differentially expressed miRNAs may be involved
in the low LDR sensitivity in these cells. Our bioinformatics
analyses of the differentially expressed miRNAs revealed that the
target genes of the altered miRNAs are functionally involved in
both positive and negative regulation of cell growth,
proliferation, apoptosis, and the cell cycle. Although the
differences in each category are dependent on the process direction
(positive or negative), the differences were less than 10%. These
results suggest that the interplay between the positive and the
negative regulation of these processes mediates this modest
sensitivity to LDR in cells. Therefore, we conclude that LDR
influences the miRNA expression profiles to minimize the
cytotoxicity on cells. This conclusion supports the hormesis (or
adaptive response) hypothesis of the LDR effect, but because our
study used single irradiation conditions, it is not confirmed.
Additional sequential LDR is necessary to confirm the hormesis
effects, and this will help discriminate between the threshold
model and the hormesis model.
In summary, we demonstrated that the
radioresistance-inducing protein BMI1 is not critical for the LDR
response. We also demonstrated that LDR induces minimal cytotoxic
effects on cells; however, these radiation effects result from the
interplay between miRNAs and LDR. Although additional investigation
should be performed to further examine the LDR effect, our results
offer novel information on miRNA-mediated LDR response in
NHDFs.
Acknowledgements
This study was supported by grant no. 20131610101840
from the Ministry of Trade, Industry and Energy of Republic of
Korea. S.B. was supported by the KU Research Professor Program of
Konkuk University.
References
|
1
|
Xu CR, Lee S, Ho C, et al: Bmi1 functions
as an oncogene independent of Ink4A/Arf repression in hepatic
carcinogenesis. Mol Cancer Res. 7:1937–1945. 2009. View Article : Google Scholar : PubMed/NCBI
|
|
2
|
Dimri GP, Martinez JL, Jacobs JJ, et al:
The Bmi-1 oncogene induces telomerase activity and immortalizes
human mammary epithelial cells. Cancer Res. 62:4736–4745.
2002.PubMed/NCBI
|
|
3
|
Cao LX, Bombard J, Cintron K, Sheedy J,
Weetall ML and Davis TW: BMI1 as a novel target for drug discovery
in cancer. J Cell Biochem. 112:2729–2741. 2011. View Article : Google Scholar : PubMed/NCBI
|
|
4
|
Siddique HR and Saleem M: Role of BMI1, a
stem cell factor, in cancer recurrence and chemoresistance:
preclinical and clinical evidences. Stem Cells. 30:372–378. 2012.
View Article : Google Scholar : PubMed/NCBI
|
|
5
|
Vrzalikova K, Skarda J, Ehrmann J, et al:
Prognostic value of Bmi-1 oncoprotein expression in NSCLC patients:
a tissue microarray study. J Cancer Res Clin Oncol. 134:1037–1042.
2008. View Article : Google Scholar : PubMed/NCBI
|
|
6
|
Wang H, Pan K, Zhang HK, et al: Increased
polycomb-group oncogene Bmi-1 expression correlates with poor
prognosis in hepatocellular carcinoma. J Cancer Res Clin Oncol.
134:535–541. 2008. View Article : Google Scholar : PubMed/NCBI
|
|
7
|
Chowdhury M, Mihara K, Yasunaga S, Ohtaki
M, Takihara Y and Kimura A: Expression of Polycomb-group (PcG)
protein BMI-1 predicts prognosis in patients with acute myeloid
leukemia. Leukemia. 21:1116–1122. 2007.PubMed/NCBI
|
|
8
|
Jacobs JJL, Kieboom K, Marino S, DePinho
RA and van Lohuizen M: The oncogene and Polycomb-group gene bmi-1
regulates cell proliferation and senescence through the ink4a
locus. Nature. 397:164–168. 1999. View
Article : Google Scholar : PubMed/NCBI
|
|
9
|
Douglas D, Hsu JH, Hung L, et al: BMI-1
promotes ewing sarcoma tumorigenicity independent of CDKN2A
repression. Cancer Res. 68:6507–6515. 2008. View Article : Google Scholar : PubMed/NCBI
|
|
10
|
Chou CH, Yang NK, Liu TY, et al:
Chromosome instability modulated by BMI1-AURKA signaling drives
progression in head and neck cancer. Cancer Res. 73:953–966. 2013.
View Article : Google Scholar : PubMed/NCBI
|
|
11
|
Facchino S, Abdouh M, Chatoo W and Bernier
G: BMI1 confers radioresistance to normal and cancerous neural stem
cells through recruitment of the DNA damage response machinery. J
Neurosci. 30:10096–10111. 2010. View Article : Google Scholar : PubMed/NCBI
|
|
12
|
Liu ZG, Liu L, Xu LH, et al: Bmi-1 induces
radioresistance in MCF-7 mammary carcinoma cells. Oncol Rep.
27:1116–1122. 2012.PubMed/NCBI
|
|
13
|
Chagraoui J, Hebert J, Girard S and
Sauvageau G: An anticlastogenic function for the Polycomb group
gene Bmi1. Proc Natl Acad Sci USA. 108:5284–5289. 2011. View Article : Google Scholar : PubMed/NCBI
|
|
14
|
Alajez NM, Shi W, Hui AB, et al: Targeted
depletion of BMI1 sensitizes tumor cells to P53-mediated apoptosis
in response to radiation therapy. Cell Death Differ. 16:1469–1479.
2009. View Article : Google Scholar : PubMed/NCBI
|
|
15
|
Cuttler JM and Pollycove M: Nuclear energy
and health: and the benefits of low-dose radiation hormesis. Dose
Response. 7:52–89. 2009. View Article : Google Scholar : PubMed/NCBI
|
|
16
|
Bonner WM: Low-dose radiation: thresholds,
bystander effects, and adaptive responses. Proc Natl Acad Sci USA.
100:4973–4975. 2003. View Article : Google Scholar : PubMed/NCBI
|
|
17
|
Bonner WM: Phenomena leading to cell
survival values which deviate from linear-quadratic models. Mutat
Res. 568:33–39. 2004. View Article : Google Scholar : PubMed/NCBI
|
|
18
|
Wodarz D, Sorace R and Komarova NL:
Dynamics of cellular responses to radiation. PLoS Comput Biol.
10:e10035132014. View Article : Google Scholar : PubMed/NCBI
|
|
19
|
Venkat S, Apte SK, Chaubey RC and Chauhan
PS: Radioadaptive response in human lymphocytes in vitro. J Environ
Pathol Toxicol Oncol. 20:165–175. 2001. View Article : Google Scholar
|
|
20
|
Tapio S and Jacob V: Radioadaptive
response revisited. Radiat Environ Biophys. 46:1–12. 2007.
View Article : Google Scholar
|
|
21
|
Marples B and Collis SJ: Low-dose
hyper-radiosensitivity: past, present, and future. Int J Radiat
Oncol Biol Phys. 70:1310–1318. 2008. View Article : Google Scholar : PubMed/NCBI
|
|
22
|
Fabian MR, Sonenberg N and Filipowicz W:
Regulation of mRNA translation and stability by microRNAs. Annu Rev
Biochem. 79:351–379. 2010. View Article : Google Scholar : PubMed/NCBI
|
|
23
|
Cai Y, Yu X, Hu S and Yu J: A brief review
on the mechanisms of miRNA regulation. Genomics Proteomics
Bioinformatics. 7:147–154. 2009. View Article : Google Scholar : PubMed/NCBI
|
|
24
|
Cha HJ, Seong KM, Bae S, et al:
Identification of specific microRNAs responding to low and high
dose gamma-irradiation in the human lymphoblast line IM9. Oncol
Rep. 22:863–868. 2009.PubMed/NCBI
|
|
25
|
Cha HJ, Shin S, Yoo H, et al:
Identification of ionizing radiation- responsive microRNAs in the
IM9 human B lymphoblastic cell line. Int J Oncol. 34:1661–1668.
2009.PubMed/NCBI
|
|
26
|
Shin S, Cha HJ, Lee EM, et al: Alteration
of miRNA profiles by ionizing radiation in A549 human non-small
cell lung cancer cells. Int J Oncol. 35:81–86. 2009.PubMed/NCBI
|
|
27
|
Wang J, He J, Su F, et al: Repression of
ATR pathway by miR-185 enhances radiation-induced apoptosis and
proliferation inhibition. Cell Death Dis. 4:e6992013. View Article : Google Scholar : PubMed/NCBI
|
|
28
|
Kwon JE, Kim BY, Kwak SY, Bae IH and Han
YH: Ionizing radiation-inducible microRNA miR-193a-3p induces
apoptosis by directly targeting Mcl-1. Apoptosis. 18:896–909. 2013.
View Article : Google Scholar : PubMed/NCBI
|
|
29
|
Lee EJ, Cha HJ, Ahn KJ, An IS, An S and
Bae S: Oridonin exerts protective effects against hydrogen
peroxide-induced damage by altering microRNA expression profiles in
human dermal fibroblasts. Int J Mol Med. 32:1345–1354. 2013.
|
|
30
|
Paraskevopoulou MD, Georgakilas G,
Kostoulas N, et al: DIANA-microT web server v5.0: service
integration into miRNA functional analysis workflows. Nucleic Acids
Res. 41:W169–W173. 2013. View Article : Google Scholar : PubMed/NCBI
|
|
31
|
Huang da W, Sherman BT and Lempicki RA:
Systematic and integrative analysis of large gene lists using DAVID
bioinformatics resources. Nat Protoc. 4:44–57. 2009.PubMed/NCBI
|
|
32
|
Ochiai H, Takenobu H, Nakagawa A, et al:
Bmi1 is a MYCN target gene that regulates tumorigenesis through
repression of KIF1B beta and TSLC1 in neuroblastoma. Oncogene.
29:2681–2690. 2010. View Article : Google Scholar : PubMed/NCBI
|
|
33
|
Biehs B, Hu JK, Strauli NB, et al: BMI1
represses Ink4a/Arf and Hox genes to regulate stem cells in the
rodent incisor. Nat Cell Biol. 15:846–852. 2013. View Article : Google Scholar : PubMed/NCBI
|
|
34
|
Cleaver JE: Biology and genetics in the
biological effects of ionizing radiation (BEIR VII) report. Health
Physics. 89:S322005.
|
|
35
|
Feinendegen LE: Evidence for beneficial
low level radiation effects and radiation hormesis. Br J Radiol.
78:3–7. 2005. View Article : Google Scholar : PubMed/NCBI
|