Introduction
MicroRNAs (miRNAs) are a novel class of evolutionary
conserved single-stranded RNAs, which have an important role in the
regulation of gene expression at the posttranscriptional level.
These short non-coding RNAs (~23 nucleotides long) were discovered
in 1993 (1) and since that time
24,521 entries from over 200 species leading to production of
>30,000 mature miRNAs have been found (June 2013, miRBase.org).
MiRNA biogenesis is a multilevel process involving many enzymes and
proteins; however its regulation is quite different from the
previously described regulators of gene expression. Within the
canonical model of biogenesis, genes for miRNAs contain their own
promoters and are transcribed by RNA polymerase II into primary
transcripts (pri-miRNA) (2,3).
Thus unique way of transcription predestines them to have unique
properties. An effect of miRNAs is most often based on the binding
to the untranslated region (3′UTR) of target mRNA causing
degradation (or inhibition) of target mRNA. It is not surprising
that they influence numerous cellular processes such as
proliferation, differentiation, apoptosis, metastases,
angiogenesis, and immune response (4,5), of
these many are connected with diseases including tumor ones. It has
been found that miRNAs may have a different expression pattern in a
patient with a tumor disease in comparison to healthy subjects,
whereas many miRNAs are specific for a given type of cancer
(6). Recently, many studies have
shown that miR-124, usually expressed in the developing nervous
system, is downregulated in several types of cancers such as breast
cancer (7,8), hepatocellular carcinoma (9), lymphoblastic leukemia (10) and prostate cancer (11). MiR-124 also contributes to the
differentiation of neurons (12),
regulates proliferation (13) and
gastrulation of stem cells (14).
The detection and quantification of miRNAs is very
important for the gene expression profiling, however, there are
several limitations of miRNAs detection such as their short length
and tissue-specific occurrence. Basic methods used for detection
are northern blotting, real-time reverse transcription polymerase
chain reaction (RT-qPCR), in situ hybridization (ISH) and
micro-RNA arrays (15–22). These methods require labelling
(radioactive, fluorescent), amplification and/or enzymatic
catalysis. With the exception of the RT-qPCR none of these
techniques is quantitative. Besides these methods, electrochemical
(EC) methods can be also used (23). From the EC methods, those detecting
reduction of nucleic acids bases on mercury electrodes belong to
the most sensitive ones. Palecek was the first who used modern
oscillographic polarography for successful detection of redox DNA
signals (23,24). Since then, attention is paid to
various electrochemical methods including linear sweep and cyclic
polarography/voltammetry (elimination polarography/voltammetry),
differential pulse polarography/voltammetry, square wave
polarography/voltammetry, AC polarography/voltammetry, and
chronopotentiometry for analysis of DNA (23,25).
Square wave voltammetry (SWV) is one of the most sensitive EC
methods for determination of oligonucleotides (ODNs) (26). SWV offers background suppression
combined with the effectiveness of differential pulsed voltammetry
(DPV), slightly greater sensitivity compared to DPV, much faster
scan rates, and applicability to a wider range of electrode
materials and systems. The most reproducible behavior and the
lowest detection limits are generally found at mercury surfaces
(23). For the simple, low-cost
and sensitive detection the EC analysis was linked with
nanomaterials. Among nanoparticles (NPs) which can be used in
connection with label-based EC methods belong the OsO2
NPs, RuO2 NPs, gold NPs or magnetic particles (MPs)
(27–31). On the contrary, for the label-free
miRNA detection in connection with EC methods silicon nanowires,
silver or gold nanostructures and carbon nanotubes can be used
(32–35).
In this study, we coupled electrochemical analysis
with MPs-based extraction, which does not need any specific
pretreatment, for detection of miR-124 in cell extracts.
Materials and methods
Chemicals
All chemicals of ACS purity were obtained from
Sigma-Aldrich (St. Louis, MO, USA) unless otherwise stated. The 1X
binding and washing (BW) buffer (5 mM Tris-HCl, 0.5 mM EDTA and 1.0
M NaCl, pH 7.5), solution A (0.1 M NaOH and 0.05 M NaCl) and
solution B (0.1 M NaCl) were employed for MPs washing. For
biotinylated anti-miR-124 immobilization, the 2X BW buffer (10 mM
Tris-HCl, 1 mM EDTA and 2.0 M NaCl, pH 7.5) was utilized. The
phosphate buffer I for washing MPs with immobilized oligonucleotide
was composed of 0.1 M NaCl, 0.05 M Na2HPO4
and 0.05 M NaH2PO4, pH 7.8.
The composition of hybridization solution was as
follows: 0.1 M Na2HPO4, 0.1 M
NaH2PO4, 0.6 M guanidinium thiocyanate
(Amresco, Solon, OH, USA), 0.15 M Tris-HCl and 0.5 M NaCl (pH 7.5).
The elution solution composition was: 0.2 M NaCl, 0.1 M
Na2HPO4 and 0.1 M
NaH2PO4. All solutions were treated with
diethylpyrocarbonate (DEPC) or prepared in DEPC treated water.
Acetate buffer (0.2 M CH3COOH and 0.2 M
CH3COONa, pH 5.0) was used for electrochemical
analysis.
The miR-124-3p (5′-UAA GGC ACG CGG UGA AUG CC-3′)
and complementary biotinylated oligonucleotide (ODN)
anti-miR-124-3p (5′-Btn-GG CAT TCA CCG CGT GCC TTA-3′, both
synthesized by Sigma-Aldrich, were used for magnetic separation
optimization. For the binding specificity confirmation, ODNs of the
following sequences were used: ODN 10 (ATGGCAGACA), ODN 21
(GCGATTGATG GTGATACGGTT), ODN 55 (GGGGACAAGTTTGTACA
AAAAAGCAGGCTGTGGCTAATACGAAAAAAACAAC ATT) and miR-150 (UCU CCC AAC
CCU UGU ACC AGU G). The ODNs were also synthesized by
Sigma-Aldrich.
MiR-124 isolation by magnetic
particles
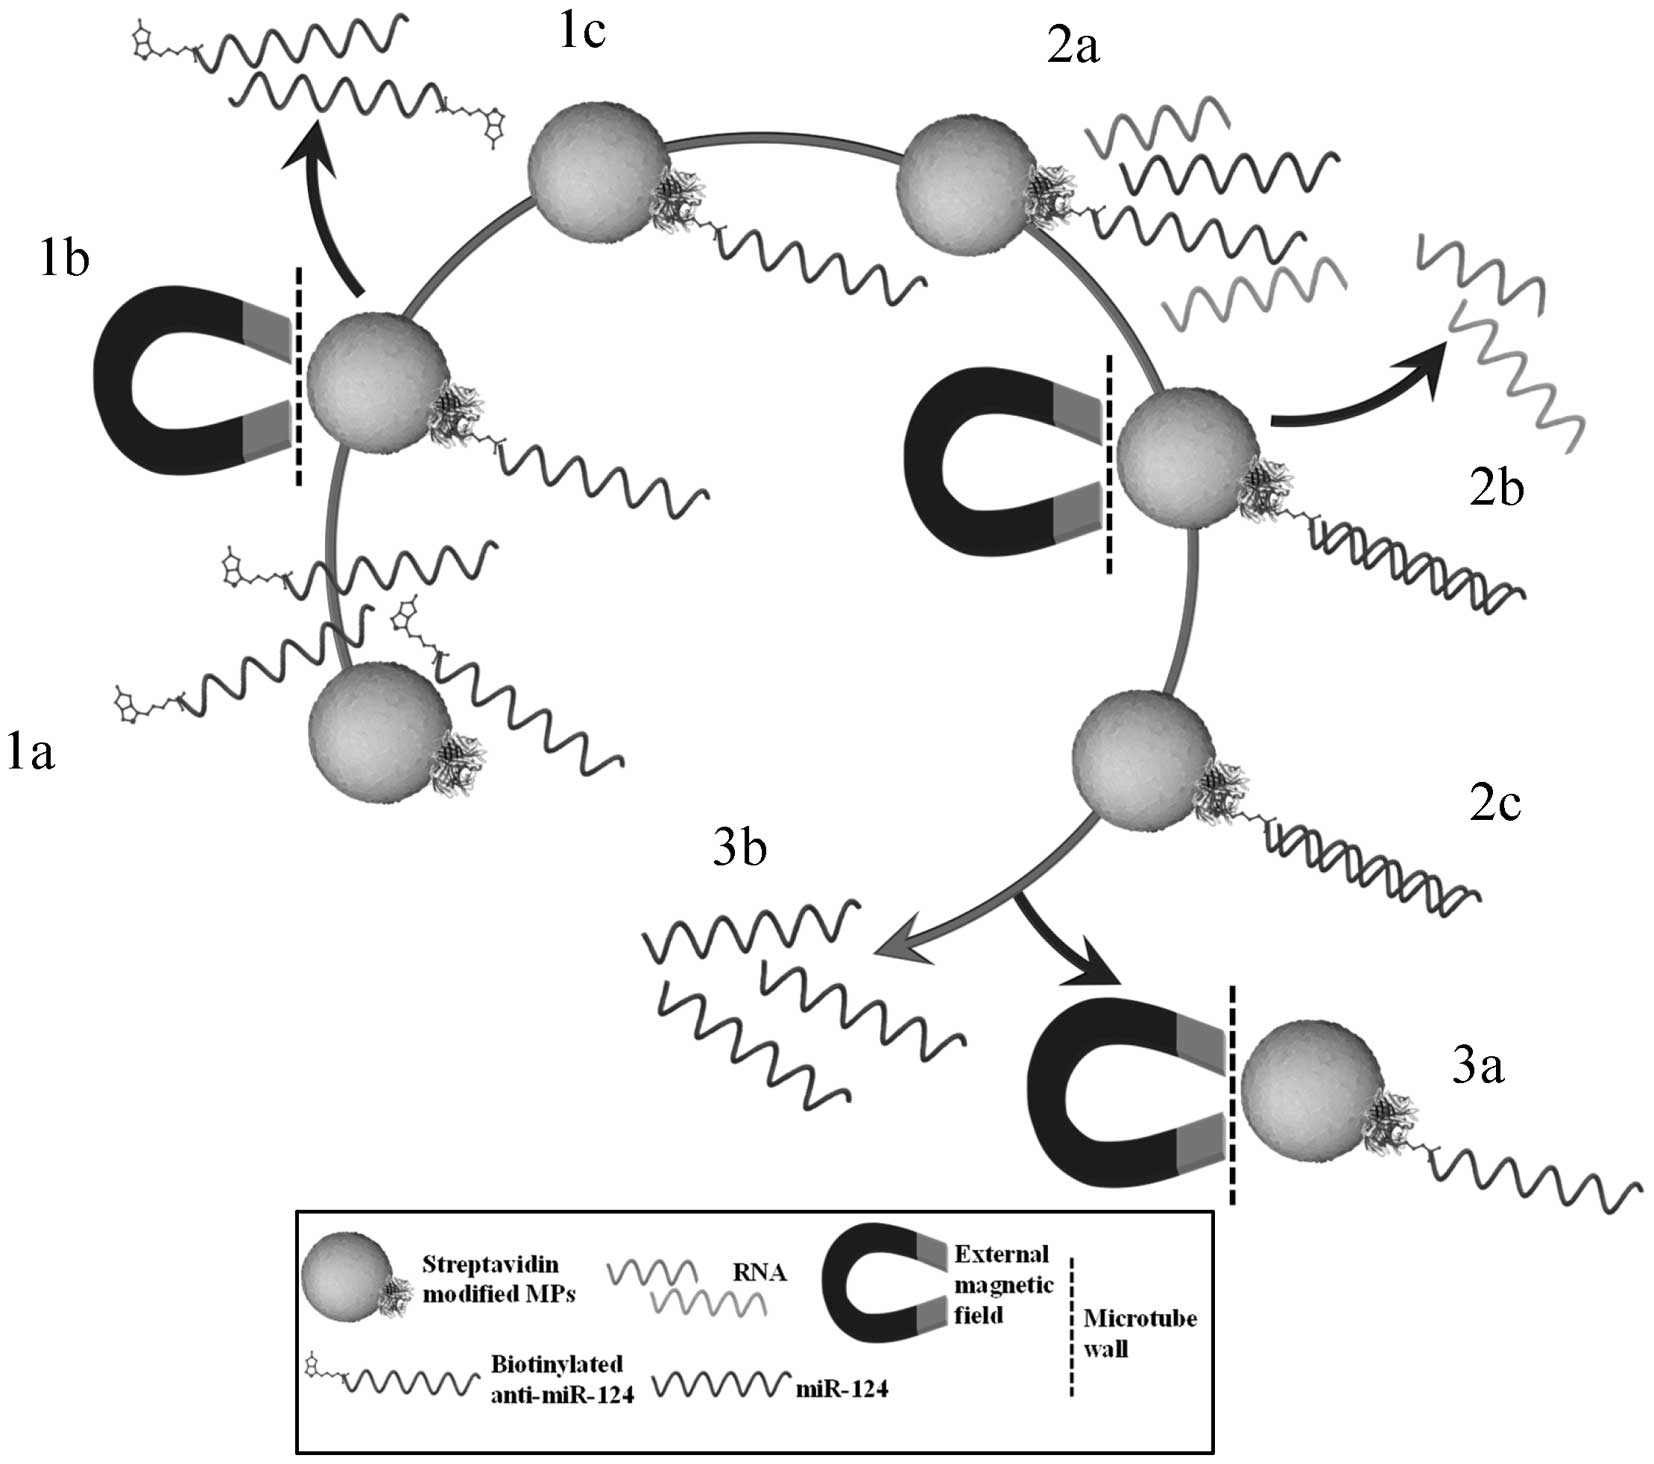
The isolation procedure was carried out according to
the scheme shown in Fig. 1. The
magnetic microparticles Dynabeads M-270 Streptavidin (Life
Technologies, Invitrogen, Oslo, Norway) and magnetic separation
rack MagnaRack (Life Technologies, Invitrogen) were used for miRNA
isolation. The miRNA experiments were performed in RNA/DNA
UV-cleaner box UVT-S-AR (Biosan, Riga, Latvia) as follows. The
biotinylated anti-miR-124 immobilization on MPs surface was done
according to the manufacturer’s recommendations. Briefly, a
microcentrifuge tube with 50 μl of resuspended MPs was placed on
the magnetic rack. After 1–2 min the supernatant (storage solution)
was removed and the washing step followed. The tube was taken out
from magnetic stand and the MPs were resuspended by pipette in 50
μl of 1X BW buffer. Then, the tube was returned to magnetic rack
and the supernatant was removed. The washing process was repeated 3
times using BW buffer. Subsequently, the MPs were washed the same
way twice with 50 μl of the solution A and once with the solution B
(50 μl).
The washed MPs were ready for immobilization of
biotinylated ODN. MPs were resuspended in 100 μl of 2X BW buffer
and the amount of added biotin anti-miR-124 was optimized. The used
volume (1.5, 2, 2.5, 3 and 3.5 μl) of 100 μM biotinylated
anti-miR-124 was diluted in DEPC-treated water reaching the final
volume of 200 μl. The mixture with MPs and biotinylated ODN was
incubated for 10 min on rotator-mixer (multi RS-60, Biosan) at 60
rpm at room temperature. The biotinylated anti-miR-124 was bound
during the incubation to streptavidin on MPs surface. After the
incubation, the coated MPs were separated on the magnetic rack and
twice washed with 50 μl of 1X BW buffer.
Further, the MPs were twice washed with 100 μl of
phosphate buffer I and the hybridization step was performed
according to Huska et al (36). Briefly, 50 μl of hybridization
solution and 50 μl of sample (miR-124 diluted in water) were added
to the anti-miR-124 coated MPs. The hybridization process took
place on a rotator-mixer at 60 rpm for 40 min at room temperature.
During this step, the miR-124 was bound to complementary
anti-miR-124 on MPs surface. After the incubation, the tube was
placed on magnetic rack, the hybridization solution was removed and
the MPs with miR-124 were washed three times with 100 μl of
phosphate buffer I (36).
Moreover, the MPs were resuspended in 50 μl of the
elution solution. The miR-124 elution was done in Thermomixer 5355
Comfort/Compact (Eppendorf, Hamburg, Germany) for 5 min at 350 rpm,
whereas the elution temperature was optimized. The used
temperatures were within the range from 50 to 90°C. During the
elution, higher temperatures were used and this caused
double-stranded RNA (dsRNA) denaturation and the miRNA was released
from MPs surface. Further, the tube was placed on a magnetic stand
and the solution with eluted miR-124 was pipetted to a new tube.
The miR-124 amount was electrochemically determined.
Electrochemical analysis
Electrochemical measurements were performed with
AUTOLAB PGS30 Analyzer (EcoChemie, Utrecht, The Netherlands)
connected to VA-Stand 663 (Metrohm, Zofingen, Switzerland) using a
standard cell with three electrodes. A hanging mercury drop
electrode (HMDE) with a drop area of 0.4 mm2 was
employed as the working electrode. An Ag/AgCl/3M KCl electrode
served as the reference electrode. Pt electrode was used as the
auxiliary electrode.
Adsorptive transfer technique was used for the
electrochemical determination of RNA. The adsorptive transfer
technique is based on the sample accumulation (120 s) onto the
working electrode surface, washing of the electrode and square wave
voltammetric (SWV) measurement. All experiments were carried out at
room temperature (21°C). The SWV conditions were performed
according to Hynek et al (37). SWV measurements were carried out in
the presence of 0.2 M acetate buffer pH 5.0. SWV parameters were as
follows: start potential 0 V, end potential −1.8 V, potential step
5 mV, frequency 280 Hz, and amplitude 25.05 mV. For smoothing and
baseline correction, the software GPES 4.9 supplied by EcoChemie
was employed.
Plasmid construction
pENTR-miR-124 plasmid was constructed from pENTR/U6
(Life Technologies, Rockville, MD, USA) where mouse U6 promoter was
replaced with human U6 promoter followed by two BsaI
restriction sites. These sites were used for cloning of miRNA
precursor. The insert was created by annealing two synthetic
oligonucleotides as mi124F-Bsa: CCTGGTCTCACACCGGGCATTCACCGCG
TAACTTATTCAAGAGATAAGGCACGCGGTGAATGCC TTTTTGAGACAGG, and mi124R-Bsa:
CCTGGTCTCAAA AAGGCATTCACCGCGTGCCTTATCTCTTGAATAAGTT
ACGCGGTGAATGCCCGGTGTGAGACCAGG. Annealed oligonucleotides were
digested with BsaI and cloned into vector cleaved with the
same enzyme.
Preparation of miR-124 enriched RNA
HEK293 cells were cultivated in DMEM media (PAA)
containing 10% FBS (fetal bovine serum). Cells were transfected
with pENTR-miR-124 plasmid with Polyethyleneimine MAX
(Polysciences, Eppelheim, Germany). Forty-eight hours after
transfection, the cells were washed with PBS and RNA was extracted
with TRIzol reagent (Life Technologies) according to the
manufacturer’s protocol. The isolated RNA was dissolved in
DEPC-treated water.
RNA isolation
RNA isolation from cells was done using TRIzol
method. Briefly, 200 μl of TriPure reagent (Roche, Mannheim,
Germany) was applied on the cells (2×10⁶) and these were
incubated for 5 min at room temperature. Then, 40 μl of chloroform
was added followed by centrifugation at 12,000 × g for 15 min at
4°C. After the centrifugation, RNA was in the upper aqueous phase,
which was removed and transferred to an RNase-free tube.
Subsequently, 100 μl isopropanol was added to precipitate RNA from
the solution. The precipitated samples were incubated at 25°C for
10 min followed by centrifugation of the samples at 12,000 × g for
10 min at 4°C, after which the supernatant was discarded and the
pellet washed with 200 μl of 75% ethanol (v/v). Moreover, the
samples were mixed using vortex and centrifuged at 7500 × g for 5
min at 4°C. After centrifugation, the supernatant was removed,
pellets dried and dissolved in 50 μl of RNase-free water in a
thermostat at 58°C for 18 min.
Real-time reverse transcription
quantitative polymerase chain reaction
The isolated miRNA was firstly converted into cDNA
by reverse transcription, for which the TaqMan MicroRNA Reverse
Tranciption kit (Applied Biosystems, Foster City, CA, USA) with a
miRNA-specific primer TaqMan MicroRNA Assays for hsa-miR-124-3p
(Applied Biosystems) was used. Briefly, 10 ng of total RNA was used
for 15 μl reaction with 3 μl of specific primer (71.4 nM) and 7 μl
of mastermix.
Real-time reverse transcription quantitative
polymerase chain reaction (real-time qRT-PCR) was performed in
triplicates using the TaqMan gene expression assay system with the
7500 real-time PCR system (Applied Biosystems), and the amplified
cDNA was analyzed by the comparative Ct method using sample without
plasmid as an endogenous control and for expression quantification.
The specific fluorescent primer probe for quantification of
hsa-miRNA-124-3p was selected from TaqMan miRNA expression assays
(Applied Biosystems). qPCR was performed under the following
amplification conditions: total volume of 20 μl, initial
denaturation 95°C/10 min, then 45 cycles 95°C/15 sec, 60°C/1 min.
For the evaluation, we selected value 1 for expression cycle (CT)
of the basic sample (without plasmid), and from it we derived
values for samples with inserted plasmids. The evaluation was
performed using MS Excel.
Structural prediction
The structure of miR-124 as well as anti-miR-124 was
predicted using a freeware software Oligo analyzer (https://eu.idtdna.com/analyzer/Applications/OligoAnalyzer/)
enabling us calculation of the free Gibbs energy for given
sequences. Input parameters were as follows: oligo concentration
0.006–0.400 μM (concentrations of miR-124 applied for recovery
determination), and Na+ concentration 800 mM (total
concentration of sodium in the hybridization solution, see
Chemicals in Materials and methods).
Mathematical treatment of data and
estimation of detection limits
Mathematical analysis of the experimental data and
the graphical interpretation were carried out by the Microsoft
Office tools (MS Excel®, MS Word®, and MS
PowerPoint®). All results were expressed as a mean ±
standard deviation (SD) unless noted otherwise. The detection
limits (3 signal/noise, S/N) were calculated according to Long and
Winefordner (38), whereas N was
expressed as a standard deviation of noise determined in the signal
domain unless stated otherwise. Calculation of the recovery was
carried out as indicated by Causon (39).
Results and Discussion
It has to be noted that the electrochemical
detection by itself, even though highly sensitive, lacks the
sequence specificity, which would be required for determination of
miRNAs belonging to the particular disease, however, its
combination with the specific miRNA isolation based on highly
specific base paring creates a very powerful technique. Moreover,
addition of the advantages of magnetic particles, extremely
suitable for simple sample clean up, is increasing the benefits
even more.
Calibration curves of microRNA and
antisense microRNA
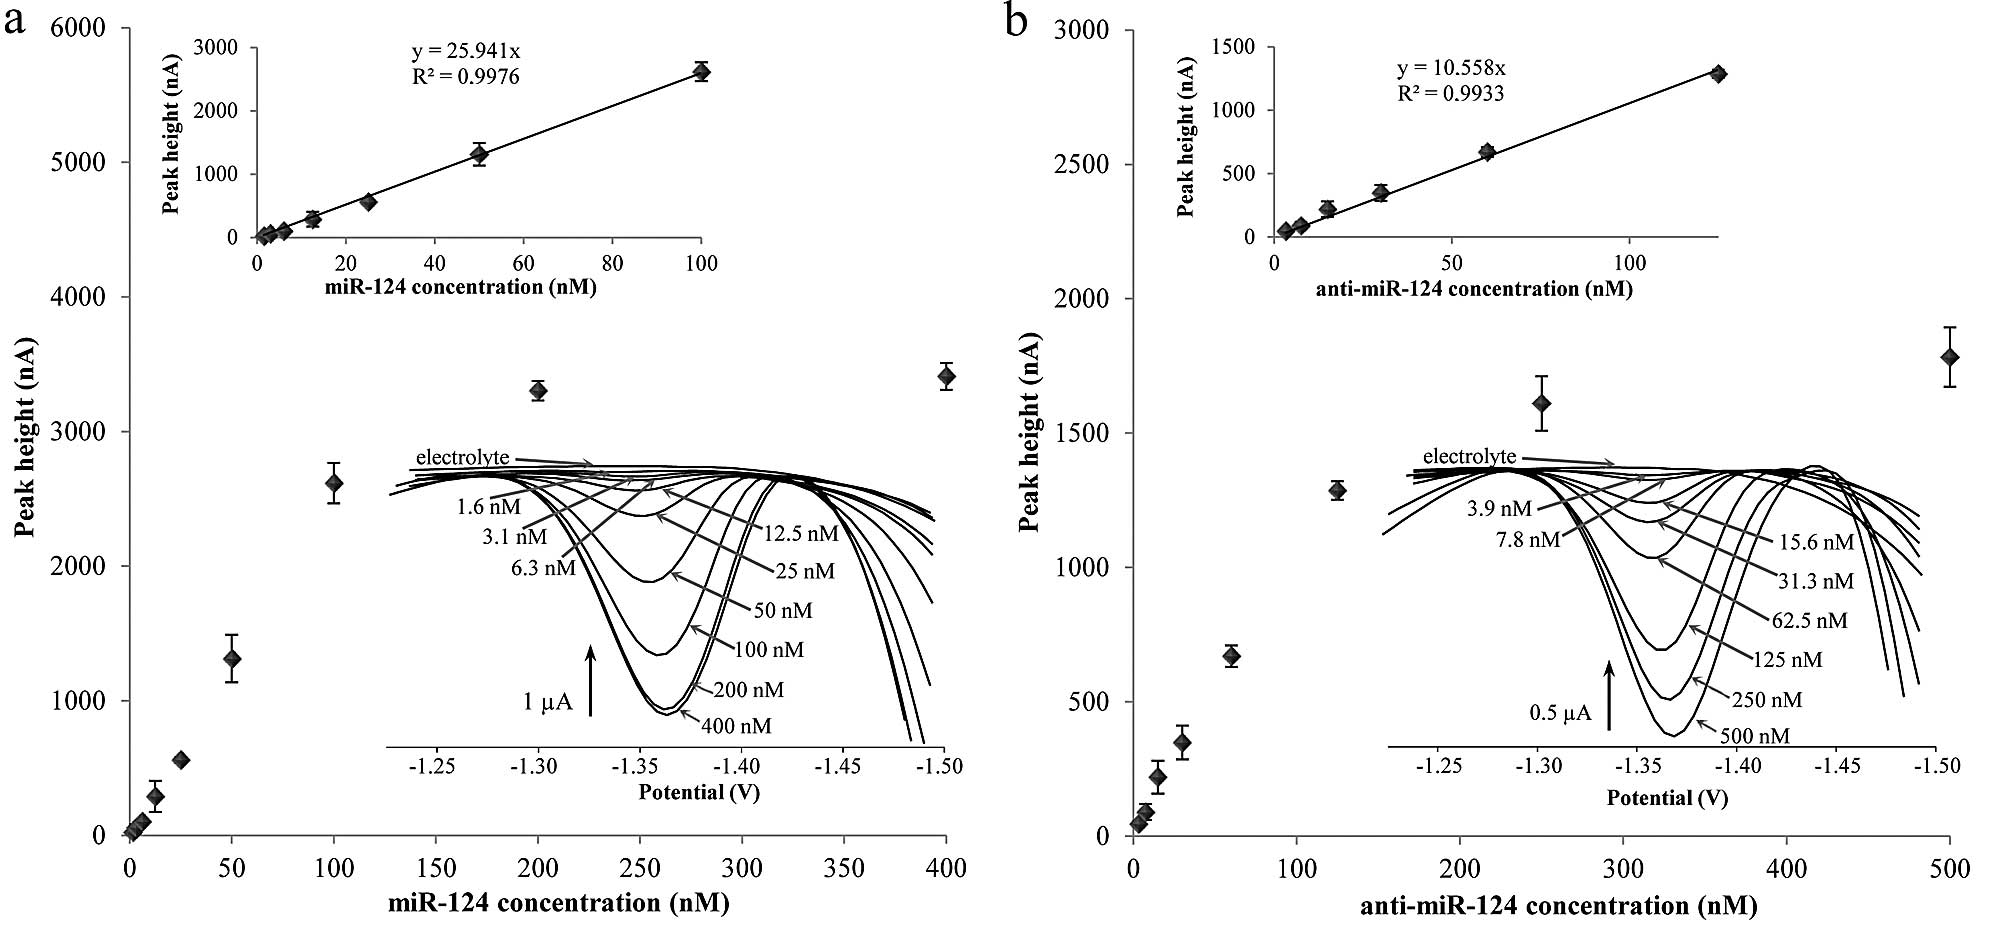
To evaluate the SWV sensitivity, the calibration
curves for miR-124 and biotinylated anti-miR-124 were determined.
The measured data are shown in Fig.
2. The dependence of peak height on miR-124 concentration
measured by SWV is shown in Fig.
2a. The lower inset shows the linear range of this technique.
Higher miR-124 concentration than 100 nM caused HMDE surface
saturation by nucleic acid and therefore 100 nM is the highest
concentration showing linearity. The limit of detection was
determined as 1 nM and limit of quantification was established as 4
nM. The typical miR-124 voltammograms are shown in the upper inset
in Fig. 2a. In addition, the
calibration curve of biotinylated antisense oligonucleotide (ODN)
is shown in Fig. 2b. The SWV
voltammograms of anti-miR-124 are in the upper inset. The linear
range of anti-miR-124 measured by SWV is shown in the lower inset.
In both cases of the calibration curve the intercept was set to 0
due to its statistical insignificance. The HMDE surface saturation
by ODN occurs at higher concentration than 125 nM. The limit of
detection is 1 nM and the limit of quantification is 4 nM, which is
the same as that for miR-124.
The optimization of magnetic
separation
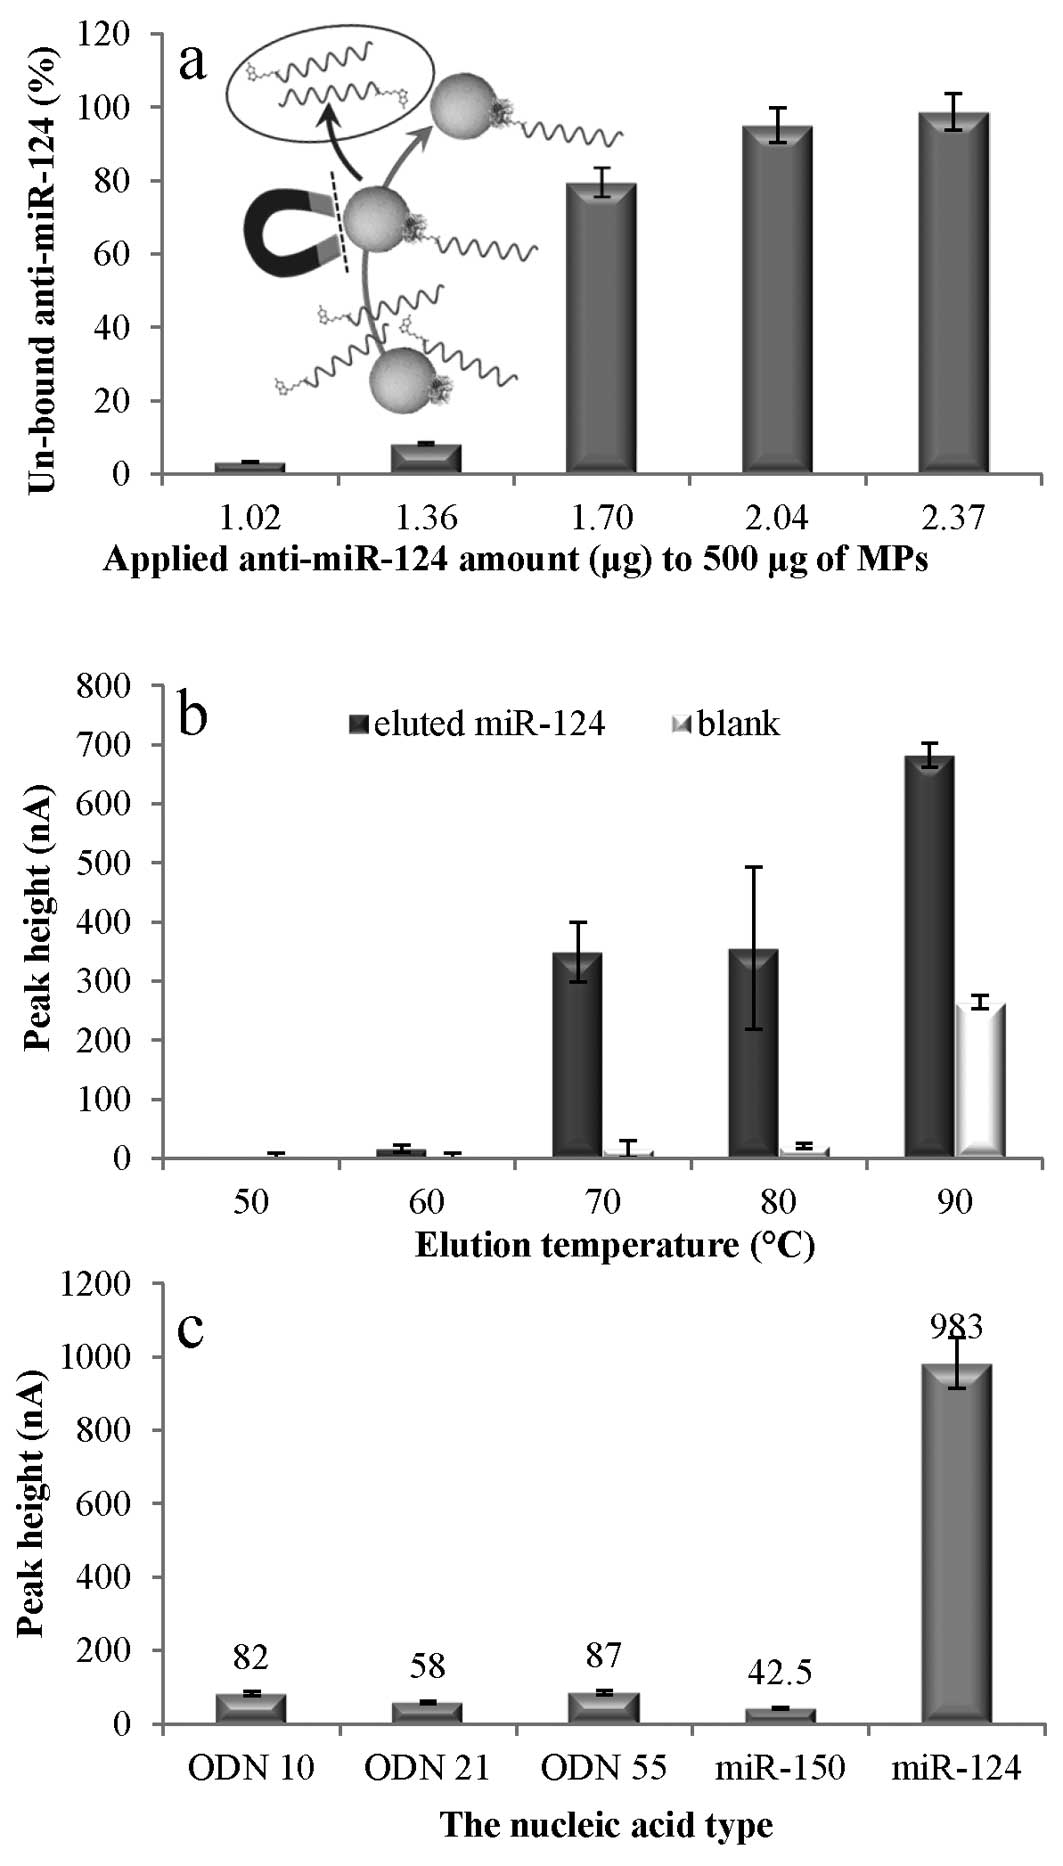
For optimal MPs utilization, the binding capacity of
the MP surface was determined. The anti-miR-124 was added to the
MPs and after the immobilization step, and MP separation (inset in
Fig. 3a), the amount of unbound
antisense ODN in retantate (a solution remaining after MPs
immobilization on the vial wall by magnetic field) was determined.
The dependence of anti-miR-124 amount remained in the retentate on
applied concentration to MPs is shown in Fig. 3a. When 1.5 μl of 100 μM probe (1.02
μg) was added the unbound probe, the determined amount was only
3.3%. With the increasing probe amount applied to the particles the
unbound anti-miR-124 amount increased considerably. When 3.5 μl of
100 μM probe (2.37 μg) was added, the amount of unbound
anti-miR-124 was 98.7%. Thus, the addition of 1.02 μg of
anti-miR-124 to the 500 μg of MPs was used in the following
experiments.
The next step of optimization was the elution
temperature (Fig. 3b). During the
elution, dsRNA denaturation occurs and the miR-124 is released into
the elution solution. The goal was to find such a temperature, at
which maximum miR-124 amount would be released and simultaneously
prevent damage to streptavidin-biotin binding. At 50 and 60°C very
low miR-124 elution (the peak height 0–16 nA) occurred. An increase
of the temperature to 70 and 80°C substantially higher miR-124
yield (the peak height 349 and 356 nA, respectively) was reached.
However, in the case of 80°C, the repeatability was significantly
worse (Fig. 3b). The temperature
increase up to 90°C caused another miR-124 yield growth. However,
at this elution temperature significant increase of SWV
anti-miR-124 signal was observed. During this experiment the
control solutions were prepared containing no miR-124. It was
observed that up to the elution temperature of 80°C the
anti-miR-124 signals were insignificant. Nevertheless, at 90°C the
signal grew markedly (Fig. 3b).
This is probably caused by the degradation of the particle surface
leading to the release of the immobilized anti-miR-124 ODN.
Therefore, the elution temperature of 70°C was used in the
following experiments.
The selectivity of optimized method was verified
using oligonucleotides of different lengths as well as miR-150,
which has no complementarity to anti-miR-124 oligonucleotide. The
oligonucleotide lengths were 10 nt (ODN 10), 21 nt (ODN 21) and 55
nt (ODN 55). As it shown in Fig.
3c, the SWV signal obtained, when the complementary sequence
(miR-124) was isolated, was on average nearly 15 times higher than
for the non-complementary sequence signals, which were at the same
level as the blank solutions. This significantly higher extraction
efficiency confirms the selectivity towards the targeted miRNA.
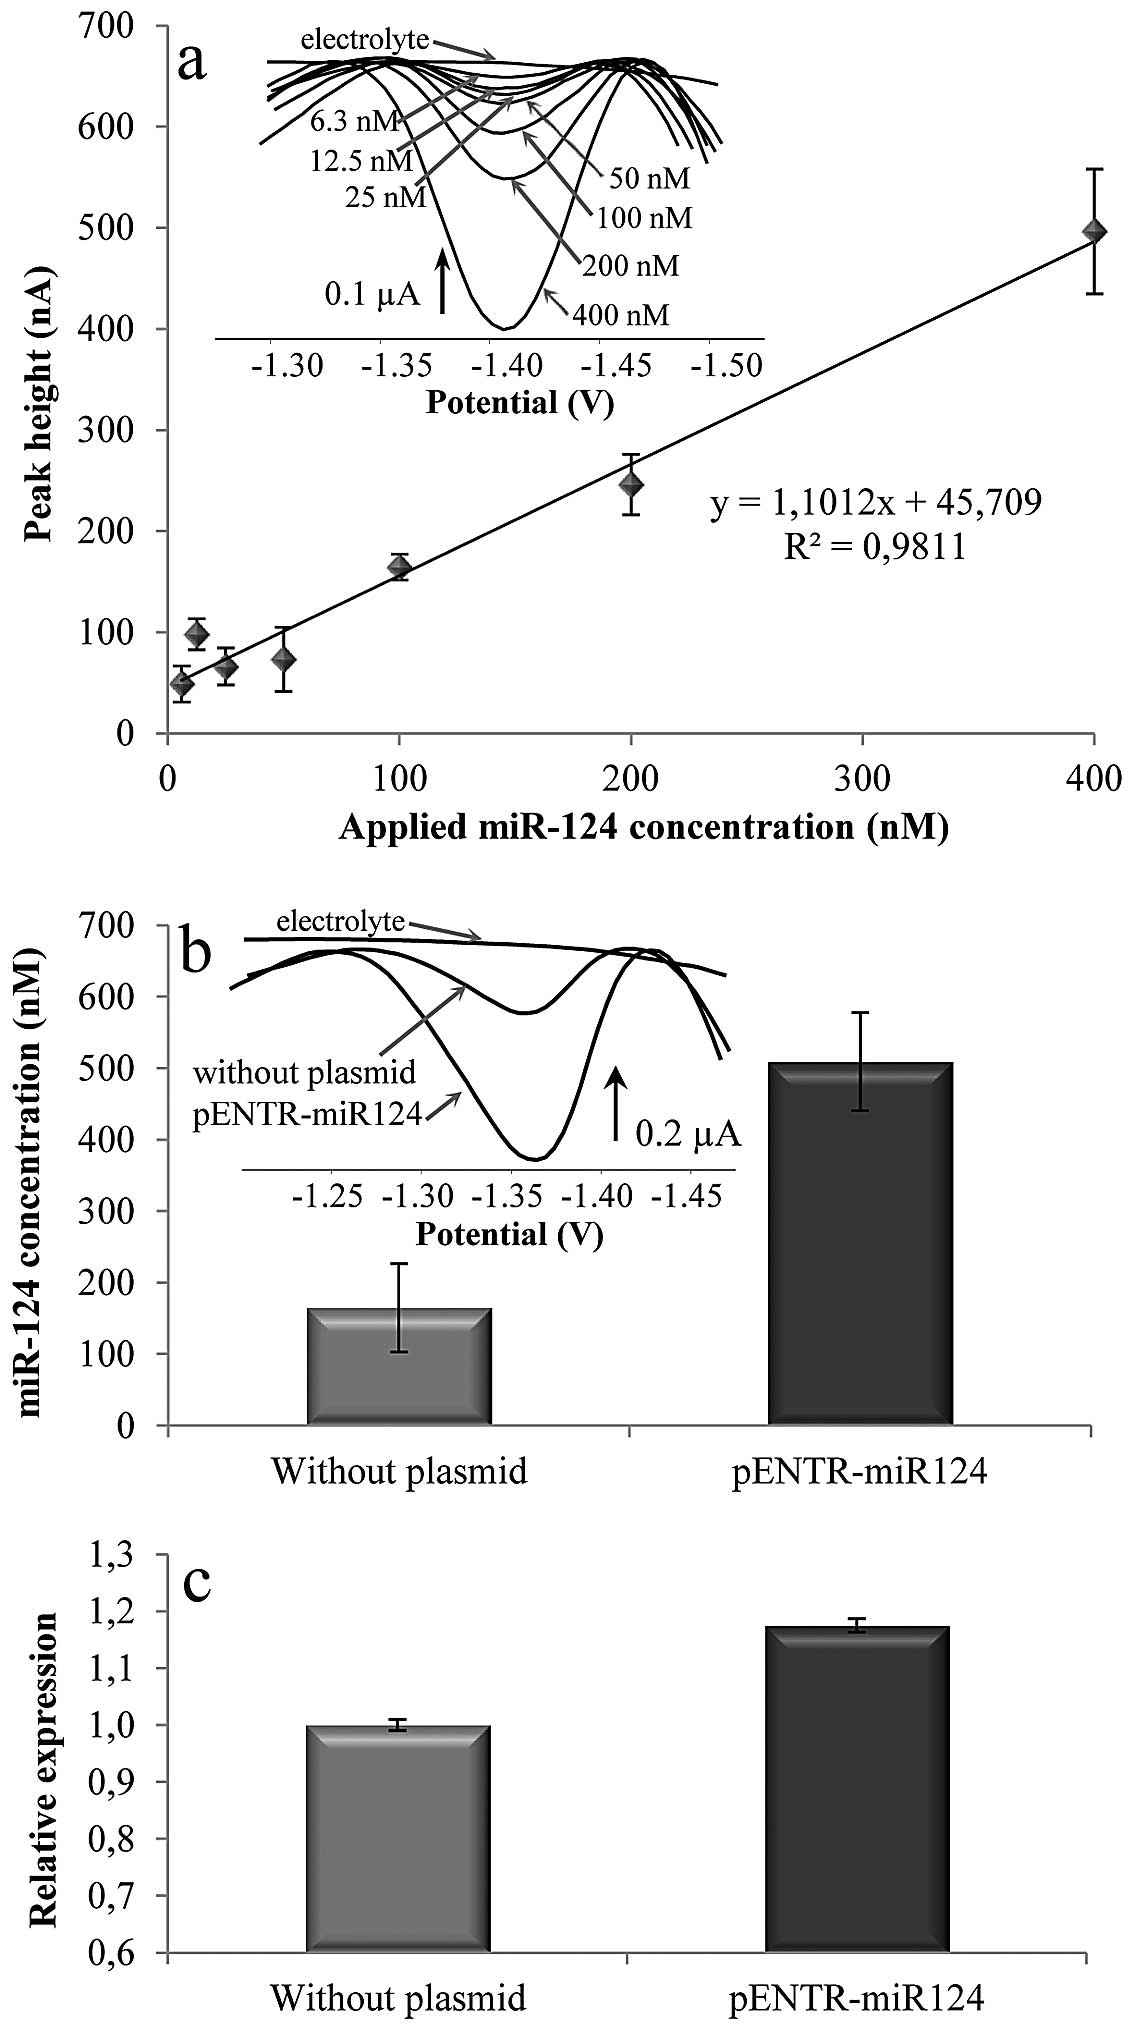
To determine the sensitivity of the optimized
separation method a calibration curve for the analytical process
including isolation procedure and SWV determination was performed
(Fig. 4a). The SWV response is
linear with determination coefficient R2 = 0.9811 within
this range. The intercept was not set to 0 due to its statistical
significance. This is caused by the fact that the calibration curve
includes the whole MP-based isolation process (probe
immobilization, miR-124 hybridization, elution, and EC detection)
and not only the detection part as shown in Fig. 2. The limit of detection was
determined as 4 nM and limit of quantification was established as
14 nM. The isolated miR-124 voltammograms are shown in the inset in
Fig. 4a. To obtain the
concentration of miR-124 extracted from these samples as well as
the recovery calculation the regression equation shown in Fig. 2a was used. It was found out that
the recovery is highly dependent on the miRNA concentration in the
sample. The extraction efficiency of approximately 28.8±2.5% was
reached for miRNA concentrations 0–20 nM. For the higher miRNA
concentrations a higher amount of magnetic particles has to be
used. The dramatic decrease in the recovery (5.4±0.8%) in case of a
higher concentration of miRNA (50–400 nM) may be caused by the
formation of secondary structures of both miR-124 as well as
anti-miR-124. According to the prediction calculations the tendency
to hairpin formation is relatively high. According to the sequence
of miR-124 five potential hairpin structures may be formed with
Gibbs free energies within the range from −7.23 to −3.75 kcal/mol.
Anti-miR-124 has potential to form two hairpins with calculated
Gibbs free energies −4.2 and −3.78 kcal/mol. Larger negative value
for Gibbs free energy indicates stable hairpins preventing the
correct hybridization between miR-124 and anti-miR-124.
The cell samples analysis
After the optimization and validation of the
magnetic separation procedure using synthetic miRNA, the method was
applied on RNA extracted from cell samples. HEK293 cells and the
same cells transfected with pENTR-miR-124 ectopically expressing
miR-124 were used as testing cell sample. Plasmid pENTR-miR-124
expresses miRNA in a form of short hairpin cloned under the control
of U6 promoter. The hairpin is post-transcriptionally cleaved
giving rise to mature miR-124. The sample of total RNA extracted
from cell lines was hybridized with anti-miR-124 modified-MPs
following previously described protocol. After miR-124 isolation
the electrochemical detection was performed, and the results are
shown in Fig. 4b (the
voltammograms of isolated miR-124 are shown in inset). The SWV
signal determined in non-transfected HEK293 cells correspond to
164.8 nM of miR-124. In the pENTR-miR-124 transfected cells
concentration of 509.3 nM miR-124 was determined. The miR-124
concentration was 3X higher in transfected cells. The ectopic
expression of miRNA from the plasmid was confirmed by northern blot
hybridization (data not shown).
For the confirmation of results obtained by magnetic
separation method in connection with electrochemical detection
real-time RT-qPCR analysis was performed. The miR-124 relative
expression was analyzed using the total RNA extracted from HEK
cells (non-transfected and transfected). The results are shown in
Fig. 4c. The the same trend is
observed since the cells with the inserted plasmid for miR-124
increased production of these miRNAs to a greater extent than the
cells without the plasmid. Even though the increase in the amount
of miR-124 expressed by the HEK cells is not as high as it would be
expected from the transfected cells, probably due to the
un-optimized cloning/transfection procedure, this was not the main
aim of the presented study. We were aiming at development of a
combination of isolation and detection technique enabling simple
and easy miRNA analysis.
In conclusion, exploitation of the connection
between miRNA expression and disease development and progression
may potentially improve our diagnostic power and moreover the
application for therapeutic purposes to improve the success of
treatment. Therefore, the attention attracted by miRNAs is
exhibiting continuously growing trend and it can be anticipated
that the search for methods enabling easy and sensitive detection
will be required. Due to the flexibility of surface modification of
magnetic particles and sensitivity of electrochemical detection,
the combination of these two steps is extremely beneficial. This
study demonstrated the applicability of the relatively simple
procedure for isolation of these very important biomolecules and
their detection without requirement of complex and costly PCR-based
techniques.
Acknowledgements
Financial support from GACR P102/11/1068
NanoBioTeCell is highly acknowledged.
References
|
1
|
Lee RC, Feinbaum RL and Ambros V: The
c-elegans heterochronic gene lin-4 encodes small rnas with
antisense complementarity to lin-14. Cell. 75:843–854. 1993.
View Article : Google Scholar : PubMed/NCBI
|
|
2
|
Winter J, Jung S, Keller S, Gregory RI and
Diederichs S: Many roads to maturity: microRNA biogenesis pathways
and their regulation. Nat Cell Biol. 11:228–234. 2009. View Article : Google Scholar : PubMed/NCBI
|
|
3
|
Krol J, Loedige I and Filipowicz W: The
widespread regulation of microRNA biogenesis, function and decay.
Nat Rev Genet. 11:597–610. 2010.PubMed/NCBI
|
|
4
|
Mirnezami AHF, Pickard K, Zhang L,
Primrose JN and Packham G: MicroRNAs: key players in carcinogenesis
and novel therapeutic targets. Eur J Surg Oncol. 35:339–347. 2009.
View Article : Google Scholar
|
|
5
|
Ruan K, Fang XG and Ouyang GL: MicroRNAs:
novel regulators in the hallmarks of human cancer. Cancer Lett.
285:116–126. 2009. View Article : Google Scholar : PubMed/NCBI
|
|
6
|
Paranjape T, Slack FJ and Weidhaas JB:
MicroRNAs: tools for cancer diagnostics. Gut. 58:1546–1554. 2009.
View Article : Google Scholar : PubMed/NCBI
|
|
7
|
Hannafon BN, Sebastiani P, de las Morenas
A, Lu JN and Rosenberg CL: Expression of microRNA and their gene
targets are dysregulated in preinvasive breast cancer. Breast
Cancer Res. 13:1–14. 2011. View
Article : Google Scholar
|
|
8
|
Sieuwerts AM, Mostert B, Bolt-de Vries J,
et al: mRNA and microRNA expression profiles in circulating tumor
cells and primary tumors of metastatic breast cancer patients. Clin
Cancer Res. 17:3600–3618. 2011. View Article : Google Scholar : PubMed/NCBI
|
|
9
|
Furuta M, Kozaki KI, Tanaka S, Arii S,
Imoto I and Inazawa J: miR-124 and miR-203 are epigenetically
silenced tumor-suppressive microRNAs in hepatocellular carcinoma.
Carcinogenesis. 31:766–776. 2010. View Article : Google Scholar
|
|
10
|
Agirre X, Vilas-Zornoza A, Jimenez-Velasco
A, et al: Epigenetic silencing of the tumor suppressor microRNA
Hsa-miR-124a regulates CDK6 expression and confers a poor prognosis
in acute lymphoblastic leukemia. Cancer Res. 69:4443–4453. 2009.
View Article : Google Scholar : PubMed/NCBI
|
|
11
|
Shi XB, Xue L, Ma AH, et al: Tumor
suppressive miR-124 targets androgen receptor and inhibits
proliferation of prostate cancer cells. Oncogene. 32:4130–4138.
2013. View Article : Google Scholar
|
|
12
|
Makeyev EV, Zhang JW, Carrasco MA and
Maniatis T: The microRNA miR-124 promotes neuronal differentiation
by triggering brain-specific alternative pre-mRNA splicing. Mol
Cell. 27:435–448. 2007. View Article : Google Scholar : PubMed/NCBI
|
|
13
|
Cheng LC, Pastrana E, Tavazoie M and
Doetsch F: miR-124 regulates adult neurogenesis in the
subventricular zone stem cell niche. Nat Neurosci. 12:399–408.
2009. View
Article : Google Scholar : PubMed/NCBI
|
|
14
|
Lee MR, Kim JS and Kim K-S: miR-124a is
important for migratory cell fate transition during gastrulation of
human embryonic stem cells. Stem Cells. 28:1550–1559. 2010.
View Article : Google Scholar : PubMed/NCBI
|
|
15
|
Bernardo BC, Charchar FJ, Lin RCY and
McMullen JR: A microRNA guide for clinicians and basic scientists:
background and experimental techniques. Heart Lung Circ.
21:131–142. 2012. View Article : Google Scholar
|
|
16
|
Li W and Ruan KC: MicroRNA detection by
microarray. Anal Bioanal Chem. 394:1117–1124. 2009. View Article : Google Scholar : PubMed/NCBI
|
|
17
|
Obernosterer G, Martinez J and Alenius M:
Locked nucleic acid-based in situ detection of microRNAs in mouse
tissue sections. Nat Protoc. 2:1508–1514. 2007. View Article : Google Scholar : PubMed/NCBI
|
|
18
|
Pena JTG, Sohn-Lee C, Rouhanifard SH, et
al: miRNA in situ hybridization in formaldehyde and EDC-fixed
tissues. Nat Methods. 6:139–141. 2009. View Article : Google Scholar : PubMed/NCBI
|
|
19
|
Schmittgen TD, Lee EJ, Jiang JM, et al:
Real-time PCR quantification of precursor and mature microRNA.
Methods. 44:31–38. 2008. View Article : Google Scholar
|
|
20
|
Streit S, Michalski CW, Erkan M, Kleeff J
and Friess H: Northern blot analysis for detection and
quantification of RNA in pancreatic cancer cells and tissues. Nat
Protoc. 4:37–43. 2009. View Article : Google Scholar : PubMed/NCBI
|
|
21
|
Valoczi A, Hornyik C, Varga N, Burgyan J,
Kauppinen S and Havelda Z: Sensitive and specific detection of
microRNAs by northern blot analysis using LNA-modified
oligonucleotide probes. Nucleic Acids Res. 32:1–7. 2004. View Article : Google Scholar
|
|
22
|
Wang XW: A PCR-based platform for microRNA
expression profiling studies. RNA. 15:716–723. 2009. View Article : Google Scholar : PubMed/NCBI
|
|
23
|
Palecek E and Bartosik M: Electrochemistry
of nucleic acids. Chem Rev. 112:3427–3481. 2012. View Article : Google Scholar : PubMed/NCBI
|
|
24
|
Palecek E: Oscillographic polarography of
highly polymerized deoxyribonucleic acid. Nature. 188:656–657.
1960. View
Article : Google Scholar : PubMed/NCBI
|
|
25
|
Hynek D, Prasek J, Koudelka P, et al:
Advantages and progress in the analysis of DNA by using mercury and
amalgam electrodes (Review). Curr Phys Chem. 1:299–324. 2011.
View Article : Google Scholar
|
|
26
|
Osteryoung JG and Osteryoung RA:
Square-wave voltammetry. Anal Chem. 57:A101–A110. 1985. View Article : Google Scholar
|
|
27
|
Gao ZQ and Yang ZC: Detection of microRNAs
using electrocatalytic nanoparticle tags. Anal Chem. 78:1470–1477.
2006. View Article : Google Scholar : PubMed/NCBI
|
|
28
|
Peng YF and Gao ZQ: Amplified detection of
microRNA based on ruthenium oxide nanoparticle-initiated deposition
of an insulating film. Ana Chem. 83:820–827. 2011. View Article : Google Scholar
|
|
29
|
Peng YL, Jiang JH and Yu RQ: A sensitive
electrochemical biosensor for microRNA detection based on
streptavidin-gold nanoparticles and enzymatic amplification. Anal
Methods. 6:2889–2893. 2014. View Article : Google Scholar
|
|
30
|
Bettazzi F, Hamid-Asl E, Esposito CL, et
al: Electrochemical detection of miRNA-222 by use of a magnetic
bead-based bioassay. Anal Bioanal Chem. 405:1025–1034. 2013.
View Article : Google Scholar
|
|
31
|
Bartosik M, Hrstka R, Palecek E and
Vojtesek B: Magnetic bead-based hybridization assay for
electrochemical detection of microRNA. Anal Chim Acta. 813:35–40.
2014. View Article : Google Scholar : PubMed/NCBI
|
|
32
|
Zhang GJ, Chua JH, Chee RE, Agarwal A and
Wong SM: Label-free direct detection of MiRNAs with silicon
nanowire biosensors. Biosens Bioelectron. 24:2504–2508. 2009.
View Article : Google Scholar : PubMed/NCBI
|
|
33
|
Dong HF, Jin S, Ju HX, et al: Trace and
label-free microRNA detection using oligonucleotide encapsulated
silver nanoclusters as probes. Anal Chem. 84:8670–8674. 2012.
View Article : Google Scholar : PubMed/NCBI
|
|
34
|
Yin HS, Zhou YL, Zhang HX, Meng XM and Ai
SY: Electrochemical determination of microRNA-21 based on graphene,
LNA integrated molecular beacon, AuNPs and biotin multifunctional
bio bar codes and enzymatic assay system. Biosens Bioelectron.
33:247–253. 2012. View Article : Google Scholar : PubMed/NCBI
|
|
35
|
Tran HV, Piro B, Reisberg S, Tran LD, Duc
HT and Pham MC: Label-free and reagentless electrochemical
detection of microRNAs using a conducting polymer nanostructured by
carbon nanotubes: Application to prostate cancer biomarker miR-141.
Biosens Bioelectron. 49:164–169. 2013. View Article : Google Scholar : PubMed/NCBI
|
|
36
|
Huska D, Hubalek J, Adam V, et al:
Automated nucleic acids isolation using paramagnetic microparticles
coupled with electrochemical detection. Talanta. 79:402–411. 2009.
View Article : Google Scholar : PubMed/NCBI
|
|
37
|
Hynek D, Krejcova L, Zitka O, et al:
Electrochemical study of doxorubicin interaction with different
sequences of single stranded oligonucleotides, part I. Int J
Electrochem Sci. 7:13–33. 2012.
|
|
38
|
Long GL and Winefordner JD: Limit of
detection. Anal Chem. 55:A712–A724. 1983.
|
|
39
|
Causon R: Validation of chromatographic
methods in biomedical analysis - viewpoint and discussion. J
Chromatogr B. 689:175–180. 1997. View Article : Google Scholar
|